قطع یا اجتناب از مصرف استروئیدها در دریافت کنندگان پیوند کلیه
Appendices
Appendix 1. Electronic search strategies
| Database | Search terms |
| CENTRAL | 1. Kidney Transplantation [MESH] |
| MEDLINE | 1. Kidney Transplantation/ |
| EMBASE | 1. exp kidney transplantation/ |
Appendix 2. Risk of bias assessment tool
| Potential source of bias | Assessment criteria |
| Random sequence generation Selection bias (biased allocation to interventions) due to inadequate generation of a randomised sequence | Low risk of bias: Random number table; computer random number generator; coin tossing; shuffling cards or envelopes; throwing dice; drawing of lots; minimization (minimization may be implemented without a random element, and this is considered to be equivalent to being random). |
| High risk of bias: Sequence generated by odd or even date of birth; date (or day) of admission; sequence generated by hospital or clinic record number; allocation by judgement of the clinician; by preference of the participant; based on the results of a laboratory test or a series of tests; by availability of the intervention. | |
| Unclear: Insufficient information about the sequence generation process to permit judgement. | |
| Allocation concealment Selection bias (biased allocation to interventions) due to inadequate concealment of allocations prior to assignment | Low risk of bias: Randomisation method described that would not allow investigator/participant to know or influence intervention group before eligible participant entered in the study (e.g. central allocation, including telephone, web‐based, and pharmacy‐controlled, randomisation; sequentially numbered drug containers of identical appearance; sequentially numbered, opaque, sealed envelopes). |
| High risk of bias: Using an open random allocation schedule (e.g. a list of random numbers); assignment envelopes were used without appropriate safeguards (e.g. if envelopes were unsealed or non‐opaque or not sequentially numbered); alternation or rotation; date of birth; case record number; any other explicitly unconcealed procedure. | |
| Unclear: Randomisation stated but no information on method used is available. | |
| Blinding of participants and personnel Performance bias due to knowledge of the allocated interventions by participants and personnel during the study | Low risk of bias: No blinding or incomplete blinding, but the review authors judge that the outcome is not likely to be influenced by lack of blinding; blinding of participants and key study personnel ensured, and unlikely that the blinding could have been broken. |
| High risk of bias: No blinding or incomplete blinding, and the outcome is likely to be influenced by lack of blinding; blinding of key study participants and personnel attempted, but likely that the blinding could have been broken, and the outcome is likely to be influenced by lack of blinding. | |
| Unclear: Insufficient information to permit judgement | |
| Blinding of outcome assessment Detection bias due to knowledge of the allocated interventions by outcome assessors. | Low risk of bias: No blinding of outcome assessment, but the review authors judge that the outcome measurement is not likely to be influenced by lack of blinding; blinding of outcome assessment ensured, and unlikely that the blinding could have been broken. |
| High risk of bias: No blinding of outcome assessment, and the outcome measurement is likely to be influenced by lack of blinding; blinding of outcome assessment, but likely that the blinding could have been broken, and the outcome measurement is likely to be influenced by lack of blinding. | |
| Unclear: Insufficient information to permit judgement | |
| Incomplete outcome data Attrition bias due to amount, nature or handling of incomplete outcome data. | Low risk of bias: No missing outcome data; reasons for missing outcome data unlikely to be related to true outcome (for survival data, censoring unlikely to be introducing bias); missing outcome data balanced in numbers across intervention groups, with similar reasons for missing data across groups; for dichotomous outcome data, the proportion of missing outcomes compared with observed event risk not enough to have a clinically relevant impact on the intervention effect estimate; for continuous outcome data, plausible effect size (difference in means or standardized difference in means) among missing outcomes not enough to have a clinically relevant impact on observed effect size; missing data have been imputed using appropriate methods. |
| High risk of bias: Reason for missing outcome data likely to be related to true outcome, with either imbalance in numbers or reasons for missing data across intervention groups; for dichotomous outcome data, the proportion of missing outcomes compared with observed event risk enough to induce clinically relevant bias in intervention effect estimate; for continuous outcome data, plausible effect size (difference in means or standardized difference in means) among missing outcomes enough to induce clinically relevant bias in observed effect size; ‘as‐treated’ analysis done with substantial departure of the intervention received from that assigned at randomisation; potentially inappropriate application of simple imputation. | |
| Unclear: Insufficient information to permit judgement | |
| Selective reporting Reporting bias due to selective outcome reporting | Low risk of bias: The study protocol is available and all of the study’s pre‐specified (primary and secondary) outcomes that are of interest in the review have been reported in the pre‐specified way; the study protocol is not available but it is clear that the published reports include all expected outcomes, including those that were pre‐specified (convincing text of this nature may be uncommon). |
| High risk of bias: Not all of the study’s pre‐specified primary outcomes have been reported; one or more primary outcomes is reported using measurements, analysis methods or subsets of the data (e.g. subscales) that were not pre‐specified; one or more reported primary outcomes were not pre‐specified (unless clear justification for their reporting is provided, such as an unexpected adverse effect); one or more outcomes of interest in the review are reported incompletely so that they cannot be entered in a meta‐analysis; the study report fails to include results for a key outcome that would be expected to have been reported for such a study. | |
| Unclear: Insufficient information to permit judgement | |
| Other bias Bias due to problems not covered elsewhere in the table | Low risk of bias: The study appears to be free of other sources of bias. |
| High risk of bias: Had a potential source of bias related to the specific study design used; stopped early due to some data‐dependent process (including a formal‐stopping rule); had extreme baseline imbalance; has been claimed to have been fraudulent; had some other problem. | |
| Unclear: Insufficient information to assess whether an important risk of bias exists; insufficient rationale or evidence that an identified problem will introduce bias. |

Study flow diagram.

Risk of bias summary: review authors' judgements about each risk of bias item for each included study

Risk of bias graph: review authors' judgements about each risk of bias item presented as percentages across all included studies
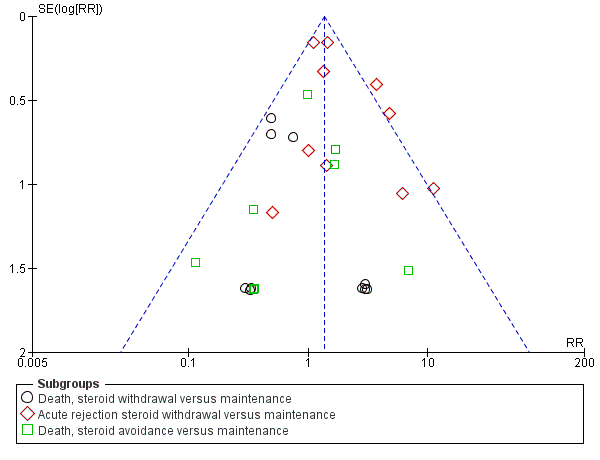
Funnel plot of comparisons that included at least 10 studies in the meta‐analysis

Comparison 1 Steroid withdrawal versus steroid maintenance, Outcome 1 Death and graft loss.
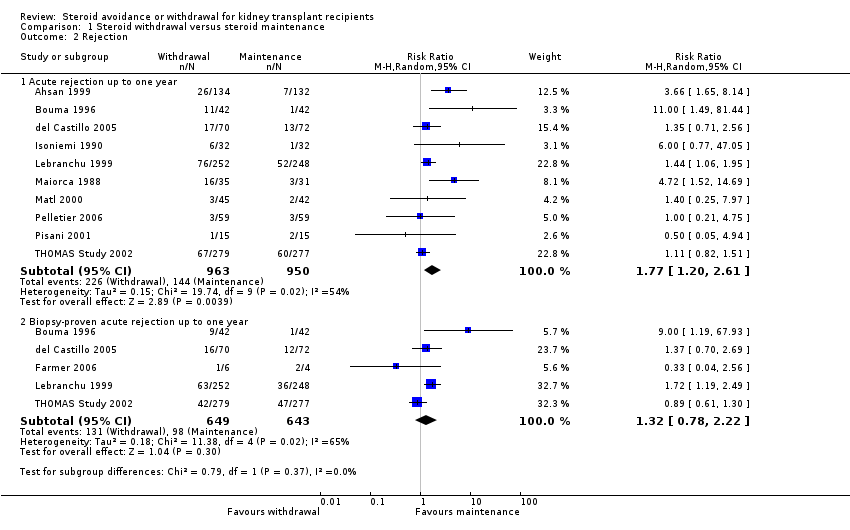
Comparison 1 Steroid withdrawal versus steroid maintenance, Outcome 2 Rejection.

Comparison 1 Steroid withdrawal versus steroid maintenance, Outcome 3 New‐onset diabetes after transplantation and cardiovascular events.
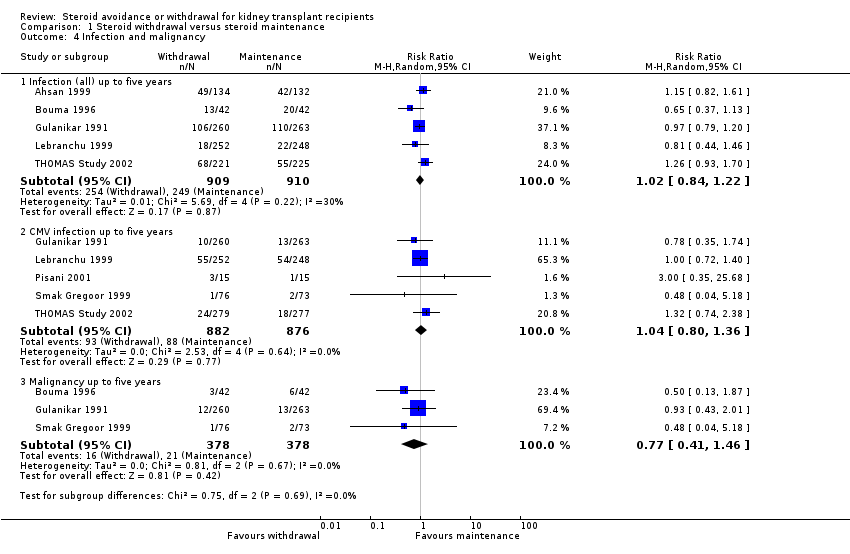
Comparison 1 Steroid withdrawal versus steroid maintenance, Outcome 4 Infection and malignancy.
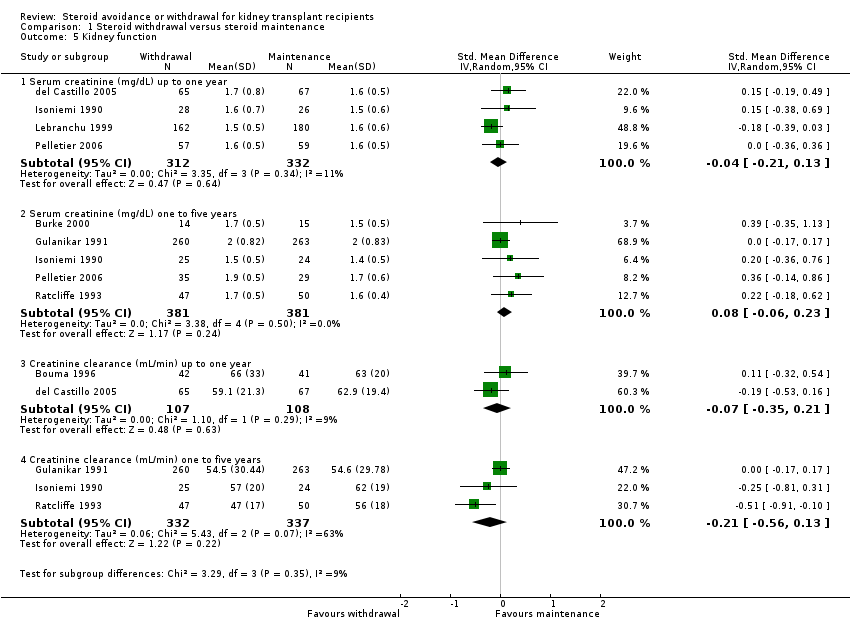
Comparison 1 Steroid withdrawal versus steroid maintenance, Outcome 5 Kidney function.

Comparison 2 Steroid avoidance versus steroid maintenance, Outcome 1 Death and graft loss.

Comparison 2 Steroid avoidance versus steroid maintenance, Outcome 2 Rejection.
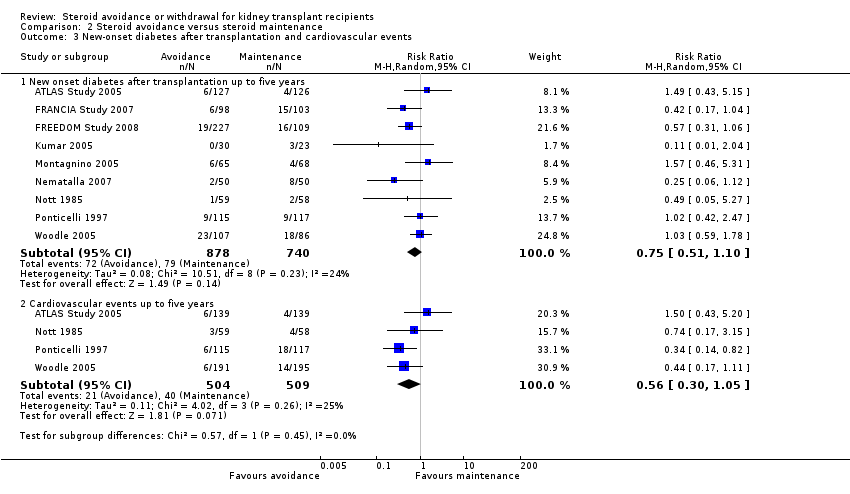
Comparison 2 Steroid avoidance versus steroid maintenance, Outcome 3 New‐onset diabetes after transplantation and cardiovascular events.

Comparison 2 Steroid avoidance versus steroid maintenance, Outcome 4 Infection and malignancy.

Comparison 2 Steroid avoidance versus steroid maintenance, Outcome 5 Kidney function.

Comparison 3 Steroid avoidance versus steroid withdrawal, Outcome 1 Death and graft loss.

Comparison 3 Steroid avoidance versus steroid withdrawal, Outcome 2 Rejection.

Comparison 3 Steroid avoidance versus steroid withdrawal, Outcome 3 New‐onset diabetes after transplantation, infection, malignancy.

Comparison 3 Steroid avoidance versus steroid withdrawal, Outcome 4 Kidney function.
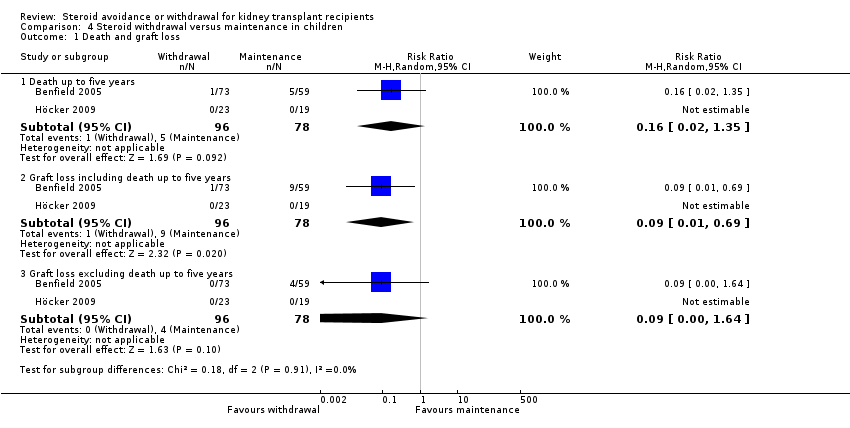
Comparison 4 Steroid withdrawal versus maintenance in children, Outcome 1 Death and graft loss.
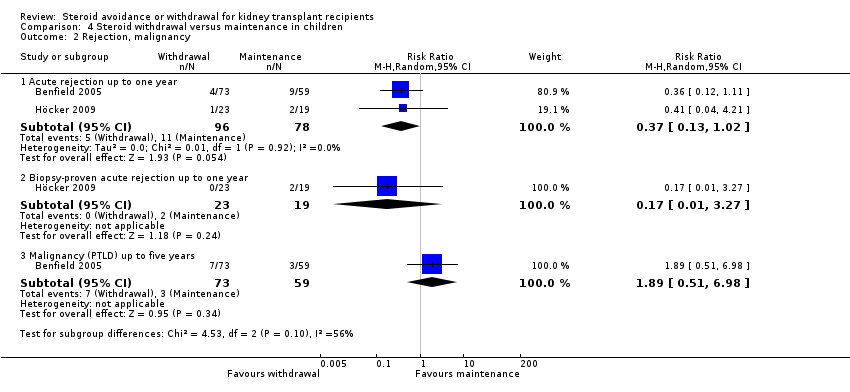
Comparison 4 Steroid withdrawal versus maintenance in children, Outcome 2 Rejection, malignancy.

Comparison 4 Steroid withdrawal versus maintenance in children, Outcome 3 Kidney function.

Comparison 5 Publication bias, Outcome 1 Funnel plots.
| Steroid withdrawal versus steroid maintenance for kidney transplant recipients | |||||
| Patient or population: kidney transplant recipients | |||||
| Outcomes | Illustrative comparative risks* (95% CI) | Relative effect | No of participants | Quality of the evidence | |
| Assumed risk | Corresponding risk | ||||
| Steroid maintenance | Steroid withdrawal | ||||
| Mortality | 22 per 1000 | 15 per 1000 | RR 0.68 | 1913 (10) | ⊕⊕⊝⊝ |
| Graft loss (excluding death) | 32 per 1000 | 38 per 1000 | RR 1.17 | 1817 (8) | ⊕⊕⊝⊝ |
| Acute rejection | 152 per 1000 | 268 per 1000 | RR 1.77 | 1913 (10) | ⊕⊕⊕⊝ |
| NODAT | 57 per 1000 | 44 per 1000 | RR 0.77 | 1439 (6) | ⊕⊕⊝⊝ |
| CMV infection | 100 per 1000 | 104 per 1000 | RR 1.04 | 1758 (5) | ⊕⊕⊝⊝ |
| *The assumed risk is the baseline risk in the control group treated with steroid maintenance. The corresponding risk (and its 95% confidence interval) is based on the assumed risk in the comparison group and the relative effect of the intervention (and its 95% CI). | |||||
| GRADE Working Group grades of evidence | |||||
| 1 Most studies were unblinded (9 studies) and did not report details about random sequence generation or allocation concealment or both (8 studies). One study had inappropriate random sequence generation. Four studies were industry sponsored. ITT analysis was unclear in four. | |||||
| Steroid avoidance versus steroid maintenance for kidney transplant recipients | ||||||
| Patient or population: kidney transplant recipients | ||||||
| Outcomes | Illustrative comparative risks* (95% CI) | Relative effect | No of participants | Quality of the evidence | Comments | |
| Assumed risk | Corresponding risk | |||||
| Control | Steroid avoidance versus steroid maintenance | |||||
| Mortality | 31 per 1000 | 30 per 1000 | RR 0.96 | 1462 (10) | ⊕⊕⊝⊝ | |
| Graft loss (excluding death) | 42 per 1000 | 46 per 1000 | RR 1.09 | 1211 (7) | ⊕⊕⊝⊝ | |
| Acute rejection | 204 per 1000 | 323 per 1000 | RR 1.58 | 835 (7) | ⊕⊕⊕⊝ | |
| NODAT | 107 per 1000 | 80 per 1000 | RR 0.75 | 1618 (9) | ⊕⊕⊝⊝ | |
| CMV Infection | 106 per 1000 | 101 per 1000 | RR 0.96 | 1454 (6) | ⊕⊕⊝⊝ | |
| *The assumed risk is the baseline risk in the control group treated with steroid maintenance. The corresponding risk (and its 95% confidence interval) is based on the assumed risk in the comparison group and the relative effect of the intervention (and its 95% CI). | ||||||
| GRADE Working Group grades of evidence | ||||||
| 1 All studies were unblinded. Six studies were industry sponsored. In six studies random sequence generation or allocation concealment or both was unclear. In two studies ITT was either not performed or unclear. One study had selective outcome reporting | ||||||
| Death | Graft loss | Acute rejection | Biopsy‐proven acute rejection | |||||||||
| Studies | RR | 95% CI | Studies | RR | 95% CI | Studies | RR | 95% CI | Studies | RR | 95% CI | |
| Publication status | ||||||||||||
| Peer reviewed journal | 8 | 0.60 | 0.31 to 1.17 | 7 | 1.25 | 0.73 to 2.13 | 8 | 2.02 | 1.23 to 3.23 | 4 | 1.32 | 0.66 to 2.66 |
| Abstract only | 2 | 3.04 | 0.33 to 28.29 | 1 | 0.82 | 0.23 to 2.94 | 2 | 1.25 | 0.67 to 2.32 | 1 | 1.37 | 0.70 to 2.69 |
| ITT analysis | ||||||||||||
| ITT analysis used | 6 | 0.69 | 0.30 to 1.61 | 6 | 1.31 | 0.69 to 2.46 | 6 | 2.07 | 1.10 to 3.91 | 3 | 1.37 | 0.64 to 2.94 |
| ITT analysis not used/unclear | 4 | 0.67 | 0.25 to 1.81 | 2 | 1.00 | 0.46 to 2.17 | 4 | 1.65 | 0.81 to 3.36 | 2 | 1.04 | 0.24 to 4.59 |
| Calcineurin inhibitor | ||||||||||||
| CsA | 9 | 0.75 | 0.36 to 1.54 | 7 | 0.90 | 0.50 to 5.14 | 9 | 2.08 | 1.29 to 3.35 | 4 | 1.60 | 0.87 to 2.92 |
| TAC | 1 | 0.50 | 0.13 to 1.97 | 1 | 2.13 | 0.88 to 5.14 | 1 | 1.11 | 0.82 to 1.51 | 1 | 0.89 | 0.61 to 1.30 |
| Antimetabolite | ||||||||||||
| MMF or EC‐MPS | 6 | 0.67 | 0.31 to 1.47 | 5 | 1.25 | 0.75 to 2.08 | 6 | 1.41 | 1.02 to 1.94 | 3 | 1.27 | 0.81 to 2.00 |
| AZA | 2 | 0.93 | 0.26 to 3.40 | 2 | 0.25 | 0.03 to 2.18 | 2 | 2.61 | 0.62 to 10.91 | 1 | 0.33 | 0.04 to 2.56 |
| MMF or EC‐MPS or AZA | 8 | 0.73 | 0.38 to 1.43 | 7 | 1.15 | 0.70 to 1.89 | 8 | 1.46 | 1.07 to 1.98 | 4 | 1.19 | 0.75 to 1.90 |
| none | 2 | 0.31 | 0.03 to 2.95 | 1 | 3.00 | 0.13 to 71.61 | 2 | 5.80 | 2.16 to 15.57 | 1 | 9.00 | 1.19 to 67.93 |
| Induction treatment | ||||||||||||
| Induction (yes) | 2 | 3.00 | 0.32 to 27.87 | 1 | 0.33 | 0.01 to 8.02 | 2 | 0.80 | 0.22 to 2.91 | NA | ‐‐ | ‐‐ |
| Induction (no) | 8 | 0.60 | 0.31 to 1.17 | 7 | 1.21 | 0.74 to 1.99 | 8 | 1.93 | 1.26 to 2.94 | NA | ‐‐ | ‐‐ |
| AZA ‐ azathioprine; CI ‐ confidence interval; CsA ‐ cyclosporin A; EC‐MPS ‐ enteric‐coated mycophenolate sodium; ITT ‐ intention to treat; MMF ‐ mycophenolate mofetil; NA ‐ not available; RR ‐ risk ratio; TAC ‐ tacrolimus | ||||||||||||
| Death | Graft loss | Acute rejection | Biopsy‐proven acute rejection | |||||||||
| Studies | RR | 95% CI | Studies | RR | 95% CI | Studies | RR | 95% CI | Studies | RR | 95% CI | |
| ITT analysis | ||||||||||||
| ITT analysis used | 7 | 1.16 | 0.48 to 2.83 | 5 | 1.09 | 0.56 to 2.11 | 4 | 1.92 | 1.18 to 3.14 | 4 | 2.31 | 1.47 to 3.63 |
| ITT analysis not used/unclear | 3 | 0.51 | 0.07 to 3.83 | 2 | 1.11 | 0.46 to 2.67 | 3 | 1.24 | 0.97 to 1.59 | 2 | 1.05 | 0.49 to 2.23 |
| Calcineurin inhibitor | ||||||||||||
| CsA | 8 | 0.88 | 0.47 to 1.66 | 5 | 1.08 | 0.59 to 1.99 | 5 | 1.31 | 1.05 to 1.63 | 3 | 1.89 | 1.29 to 2.79 |
| TAC | 2 | 6.82 | 0.36 to 130.81 | 2 | 1.14 | 0.39 to 3.3 | 2 | 2.40 | 1.05 to 5.49 | 3 | 1.81 | 0.66 to 4.99 |
| Antimetabolite | ||||||||||||
| MMF or EC‐MPS | 6 | 1.15 | 0.36 to 3.69 | 6 | 1.09 | 0.56 to 2.11 | 5 | 1.87 | 1.20 to 2.91 | 6 | 1.94 | 1.26 to 2.98 |
| AZA | 1 | 1.64 | 0.29 to 9.2 | NA | ‐‐ | ‐‐ | NA | ‐‐ | ‐‐ | NA | ‐‐ | ‐‐ |
| MMF or EC‐MPS or AZA | 8 | 1.16 | 0.48 to 2.83 | NA | ‐‐ | ‐‐ | NA | ‐‐ | ‐‐ | NA | ‐‐ | ‐‐ |
| None | 2 | 0.51 | 0.07 to 3.83 | 1 | 1.11 | 0.46 to 2.67 | 2 | 1.26 | 0.95 to 1.65 | NA | ‐‐ | ‐‐ |
| Induction treatment | ||||||||||||
| Induction (yes) | 7 | 0.97 | 0.38 to 2.48 | 5 | 1.06 | 0.45 to 2.46 | 4 | 1.50 | 0.97 to 2.32 | 5 | 1.67 | 1.19 to 2.36 |
| Induction (no) | 3 | 0.92 | 0.17 to 5.01 | 2 | 1.12 | 0.57 to 2.2 | 3 | 1.72 | 0.89 to 3.32 | 1 | 3.89 | 2.16 to 7.03 |
| AZA ‐ azathioprine; CI ‐ confidence interval; CsA ‐ cyclosporin A; EC‐MPS ‐ enteric‐coated mycophenolate sodium; ITT ‐ intention to treat; MMF ‐ mycophenolate mofetil; NA ‐ not available; RR ‐ risk ratio; TAC ‐ tacrolimus | ||||||||||||
| Outcome or subgroup title | No. of studies | No. of participants | Statistical method | Effect size |
| 1 Death and graft loss Show forest plot | 15 | Risk Ratio (M‐H, Random, 95% CI) | Subtotals only | |
| 1.1 Death up to one year | 10 | 1913 | Risk Ratio (M‐H, Random, 95% CI) | 0.68 [0.36, 1.30] |
| 1.2 Death one to five years | 7 | 1118 | Risk Ratio (M‐H, Random, 95% CI) | 1.26 [0.73, 2.17] |
| 1.3 Graft loss including death up to one year | 8 | 1817 | Risk Ratio (M‐H, Random, 95% CI) | 0.97 [0.64, 1.49] |
| 1.4 Graft loss including death one to five years | 7 | 1092 | Risk Ratio (M‐H, Random, 95% CI) | 1.41 [1.00, 2.01] |
| 1.5 Graft loss excluding death up to one year | 8 | 1817 | Risk Ratio (M‐H, Random, 95% CI) | 1.17 [0.72, 1.92] |
| 1.6 Graft loss excluding death one to five years | 7 | 1092 | Risk Ratio (M‐H, Random, 95% CI) | 1.61 [0.98, 2.64] |
| 2 Rejection Show forest plot | 11 | Risk Ratio (M‐H, Random, 95% CI) | Subtotals only | |
| 2.1 Acute rejection up to one year | 10 | 1913 | Risk Ratio (M‐H, Random, 95% CI) | 1.77 [1.20, 2.61] |
| 2.2 Biopsy‐proven acute rejection up to one year | 5 | 1292 | Risk Ratio (M‐H, Random, 95% CI) | 1.32 [0.78, 2.22] |
| 3 New‐onset diabetes after transplantation and cardiovascular events Show forest plot | 6 | Risk Ratio (M‐H, Random, 95% CI) | Subtotals only | |
| 3.1 New onset diabetes after transplantation up to five years | 6 | 1439 | Risk Ratio (M‐H, Random, 95% CI) | 0.77 [0.49, 1.21] |
| 3.2 Cardiovascular events up to five years | 2 | 607 | Risk Ratio (M‐H, Random, 95% CI) | 0.98 [0.42, 2.33] |
| 4 Infection and malignancy Show forest plot | 7 | Risk Ratio (M‐H, Random, 95% CI) | Subtotals only | |
| 4.1 Infection (all) up to five years | 5 | 1819 | Risk Ratio (M‐H, Random, 95% CI) | 1.02 [0.84, 1.22] |
| 4.2 CMV infection up to five years | 5 | 1758 | Risk Ratio (M‐H, Random, 95% CI) | 1.04 [0.80, 1.36] |
| 4.3 Malignancy up to five years | 3 | 756 | Risk Ratio (M‐H, Random, 95% CI) | 0.77 [0.41, 1.46] |
| 5 Kidney function Show forest plot | 8 | Std. Mean Difference (IV, Random, 95% CI) | Subtotals only | |
| 5.1 Serum creatinine (mg/dL) up to one year | 4 | 644 | Std. Mean Difference (IV, Random, 95% CI) | ‐0.04 [‐0.21, 0.13] |
| 5.2 Serum creatinine (mg/dL) one to five years | 5 | 762 | Std. Mean Difference (IV, Random, 95% CI) | 0.08 [‐0.06, 0.23] |
| 5.3 Creatinine clearance (mL/min) up to one year | 2 | 215 | Std. Mean Difference (IV, Random, 95% CI) | ‐0.07 [‐0.35, 0.21] |
| 5.4 Creatinine clearance (mL/min) one to five years | 3 | 669 | Std. Mean Difference (IV, Random, 95% CI) | ‐0.21 [‐0.56, 0.13] |
| Outcome or subgroup title | No. of studies | No. of participants | Statistical method | Effect size |
| 1 Death and graft loss Show forest plot | 13 | Risk Ratio (M‐H, Random, 95% CI) | Subtotals only | |
| 1.1 Death up to one year | 10 | 1462 | Risk Ratio (M‐H, Random, 95% CI) | 0.96 [0.52, 1.80] |
| 1.2 Death one to five years | 7 | 1201 | Risk Ratio (M‐H, Random, 95% CI) | 0.57 [0.32, 1.01] |
| 1.3 Graft loss including death up to one year | 7 | 1211 | Risk Ratio (M‐H, Random, 95% CI) | 1.08 [0.72, 1.62] |
| 1.4 Graft loss including death one to five years | 7 | 1245 | Risk Ratio (M‐H, Random, 95% CI) | 0.79 [0.53, 1.18] |
| 1.5 Graft loss excluding death up to one year | 7 | 1211 | Risk Ratio (M‐H, Random, 95% CI) | 1.09 [0.64, 1.86] |
| 1.6 Graft loss excluding death one to five years | 7 | 1245 | Risk Ratio (M‐H, Random, 95% CI) | 0.98 [0.66, 1.45] |
| 2 Rejection Show forest plot | 9 | Risk Ratio (M‐H, Random, 95% CI) | Subtotals only | |
| 2.1 Acute rejection up to one year | 7 | 835 | Risk Ratio (M‐H, Random, 95% CI) | 1.58 [1.08, 2.30] |
| 2.2 Biopsy‐proven acute rejection up to one year | 6 | 1073 | Risk Ratio (M‐H, Random, 95% CI) | 1.94 [1.26, 2.98] |
| 3 New‐onset diabetes after transplantation and cardiovascular events Show forest plot | 9 | Risk Ratio (M‐H, Random, 95% CI) | Subtotals only | |
| 3.1 New onset diabetes after transplantation up to five years | 9 | 1618 | Risk Ratio (M‐H, Random, 95% CI) | 0.75 [0.51, 1.10] |
| 3.2 Cardiovascular events up to five years | 4 | 1013 | Risk Ratio (M‐H, Random, 95% CI) | 0.56 [0.30, 1.05] |
| 4 Infection and malignancy Show forest plot | 11 | Risk Ratio (M‐H, Random, 95% CI) | Subtotals only | |
| 4.1 Infection (all) up to five years | 9 | 1833 | Risk Ratio (M‐H, Random, 95% CI) | 0.93 [0.84, 1.03] |
| 4.2 CMV Infection up to five years | 6 | 1454 | Risk Ratio (M‐H, Random, 95% CI) | 0.96 [0.70, 1.31] |
| 4.3 Malignancy up to five years | 7 | 1635 | Risk Ratio (M‐H, Random, 95% CI) | 0.97 [0.61, 1.52] |
| 5 Kidney function Show forest plot | 10 | Std. Mean Difference (IV, Random, 95% CI) | Subtotals only | |
| 5.1 Serum creatinine (mg/dL) up to one year | 5 | 735 | Std. Mean Difference (IV, Random, 95% CI) | 0.02 [‐0.12, 0.17] |
| 5.2 Serum creatinine (mg/dL) one to five years | 3 | 688 | Std. Mean Difference (IV, Random, 95% CI) | ‐0.01 [‐0.16, 0.14] |
| 5.3 Creatinine clearance (mL/min) up to one year | 6 | 1104 | Std. Mean Difference (IV, Random, 95% CI) | ‐0.08 [‐0.23, 0.08] |
| 5.4 Creatinine clearance (mL/min) one to five years | 3 | 563 | Std. Mean Difference (IV, Random, 95% CI) | ‐0.08 [‐0.25, 0.08] |
| Outcome or subgroup title | No. of studies | No. of participants | Statistical method | Effect size |
| 1 Death and graft loss Show forest plot | 3 | Risk Ratio (M‐H, Random, 95% CI) | Subtotals only | |
| 1.1 Death up to one year | 1 | 222 | Risk Ratio (M‐H, Random, 95% CI) | 0.39 [0.08, 1.98] |
| 1.2 Death one to five years | 2 | 152 | Risk Ratio (M‐H, Random, 95% CI) | 2.67 [0.63, 11.32] |
| 1.3 Graft loss including death up to one year | 1 | 222 | Risk Ratio (M‐H, Random, 95% CI) | 0.86 [0.32, 2.29] |
| 1.4 Graft loss including death one to five years | 2 | 152 | Risk Ratio (M‐H, Random, 95% CI) | 2.44 [0.89, 6.70] |
| 1.5 Graft loss excluding death up to one year | 1 | 222 | Risk Ratio (M‐H, Random, 95% CI) | 1.64 [0.40, 6.68] |
| 1.6 Graft loss excluding death one to five years | 2 | 152 | Risk Ratio (M‐H, Random, 95% CI) | 1.91 [0.48, 7.67] |
| 2 Rejection Show forest plot | 2 | Risk Ratio (M‐H, Random, 95% CI) | Totals not selected | |
| 2.1 Acute rejection up to one year | 1 | Risk Ratio (M‐H, Random, 95% CI) | 0.0 [0.0, 0.0] | |
| 2.2 Biopsy‐proven acute rejection up to one year | 1 | Risk Ratio (M‐H, Random, 95% CI) | 0.0 [0.0, 0.0] | |
| 3 New‐onset diabetes after transplantation, infection, malignancy Show forest plot | 3 | Risk Ratio (M‐H, Random, 95% CI) | Subtotals only | |
| 3.1 New onset diabetes after transplantation up to five years | 3 | 351 | Risk Ratio (M‐H, Random, 95% CI) | 0.63 [0.36, 1.09] |
| 3.2 Infection (all) up to five years | 3 | 374 | Risk Ratio (M‐H, Random, 95% CI) | 1.07 [0.76, 1.50] |
| 3.3 CMV Infection up to five years | 2 | 284 | Risk Ratio (M‐H, Random, 95% CI) | 0.53 [0.30, 0.92] |
| 3.4 Malignancy up to five years | 1 | 90 | Risk Ratio (M‐H, Random, 95% CI) | 1.57 [0.28, 8.94] |
| 4 Kidney function Show forest plot | 2 | Std. Mean Difference (IV, Random, 95% CI) | Subtotals only | |
| 4.1 Serum creatinine (mg/dL) up to one year | 2 | 88 | Std. Mean Difference (IV, Random, 95% CI) | ‐0.05 [‐0.47, 0.37] |
| 4.2 Creatinine clearance (mL/min) up to one year | 2 | 206 | Std. Mean Difference (IV, Random, 95% CI) | ‐0.13 [‐0.41, 0.14] |
| Outcome or subgroup title | No. of studies | No. of participants | Statistical method | Effect size |
| 1 Death and graft loss Show forest plot | 2 | Risk Ratio (M‐H, Random, 95% CI) | Subtotals only | |
| 1.1 Death up to five years | 2 | 174 | Risk Ratio (M‐H, Random, 95% CI) | 0.16 [0.02, 1.35] |
| 1.2 Graft loss including death up to five years | 2 | 174 | Risk Ratio (M‐H, Random, 95% CI) | 0.09 [0.01, 0.69] |
| 1.3 Graft loss excluding death up to five years | 2 | 174 | Risk Ratio (M‐H, Random, 95% CI) | 0.09 [0.00, 1.64] |
| 2 Rejection, malignancy Show forest plot | 2 | Risk Ratio (M‐H, Random, 95% CI) | Subtotals only | |
| 2.1 Acute rejection up to one year | 2 | 174 | Risk Ratio (M‐H, Random, 95% CI) | 0.37 [0.13, 1.02] |
| 2.2 Biopsy‐proven acute rejection up to one year | 1 | 42 | Risk Ratio (M‐H, Random, 95% CI) | 0.17 [0.01, 3.27] |
| 2.3 Malignancy (PTLD) up to five years | 1 | 132 | Risk Ratio (M‐H, Random, 95% CI) | 1.89 [0.51, 6.98] |
| 3 Kidney function Show forest plot | 1 | Mean Difference (IV, Random, 95% CI) | Totals not selected | |
| 3.1 Creatinine clearance (mL/min) up to five years | 1 | Mean Difference (IV, Random, 95% CI) | 0.0 [0.0, 0.0] | |
| Outcome or subgroup title | No. of studies | No. of participants | Statistical method | Effect size |
| 1 Funnel plots Show forest plot | 20 | 5288 | Risk Ratio (M‐H, Fixed, 95% CI) | 1.36 [1.15, 1.62] |
| 1.1 Death, steroid withdrawal versus maintenance | 10 | 1913 | Risk Ratio (M‐H, Fixed, 95% CI) | 0.70 [0.39, 1.29] |
| 1.2 Acute rejection steroid withdrawal versus maintenance | 10 | 1913 | Risk Ratio (M‐H, Fixed, 95% CI) | 1.55 [1.28, 1.87] |
| 1.3 Death, steroid avoidance versus maintenance | 10 | 1462 | Risk Ratio (M‐H, Fixed, 95% CI) | 0.92 [0.52, 1.63] |