| 1 Occurrence of any exacerbation Show forest plot | 4 | 269 | Rate Ratio (Random, 95% CI) | 0.57 [0.38, 0.86] |
|
| 1.1 Adults | 3 | 215 | Rate Ratio (Random, 95% CI) | 0.45 [0.24, 0.86] |
| 1.2 Children | 1 | 54 | Rate Ratio (Random, 95% CI) | 0.75 [0.54, 1.04] |
| 2 Number of participants who had one or more exacerbations over the study period Show forest plot | 4 | 269 | Odds Ratio (M‐H, Fixed, 95% CI) | 0.36 [0.21, 0.62] |
|
| 2.1 Adult | 3 | 215 | Odds Ratio (M‐H, Fixed, 95% CI) | 0.36 [0.20, 0.64] |
| 2.2 Children | 1 | 54 | Odds Ratio (M‐H, Fixed, 95% CI) | 0.39 [0.09, 1.71] |
| 3 Number of participants with exacerbations regarding hospitalisations over the study period Show forest plot | 4 | 269 | Odds Ratio (M‐H, Fixed, 95% CI) | 0.28 [0.09, 0.84] |
|
| 3.1 Adult | 3 | 215 | Odds Ratio (M‐H, Fixed, 95% CI) | 0.14 [0.02, 1.25] |
| 3.2 Children | 1 | 54 | Odds Ratio (M‐H, Fixed, 95% CI) | 0.38 [0.10, 1.45] |
| 4 Number of severe exacerbations requiring oral corticosteroids Show forest plot | 1 | | Rate Ratio (Fixed, 95% CI) | Totals not selected |
|
| 5 MIld exacerbations over study period Show forest plot | 2 | 150 | Rate Ratio (Fixed, 95% CI) | 0.82 [0.67, 1.00] |
|
| 6 Eosinophilic v Noneosinophilic exacerbations Show forest plot | 1 | | Risk Ratio (Fixed, 95% CI) | Subtotals only |
|
| 6.1 Eosinophilic Exacerbations | 1 | 2 | Risk Ratio (Fixed, 95% CI) | 0.28 [0.10, 0.76] |
| 6.2 Noneosinophilic Exacerbations | 1 | 2 | Risk Ratio (Fixed, 95% CI) | 1.07 [0.62, 1.85] |
| 7 Exacerbations subgrouped by asthma severity: Mild vs Severe Show forest plot | 1 | | Rate Ratio (Fixed, 95% CI) | Subtotals only |
|
| 7.1 Very mild to mild asthma | 1 | 2 | Rate Ratio (Fixed, 95% CI) | 1.34 [0.52, 3.43] |
| 7.2 Moderate to severe asthma | 1 | 2 | Rate Ratio (Fixed, 95% CI) | 0.63 [0.38, 1.04] |
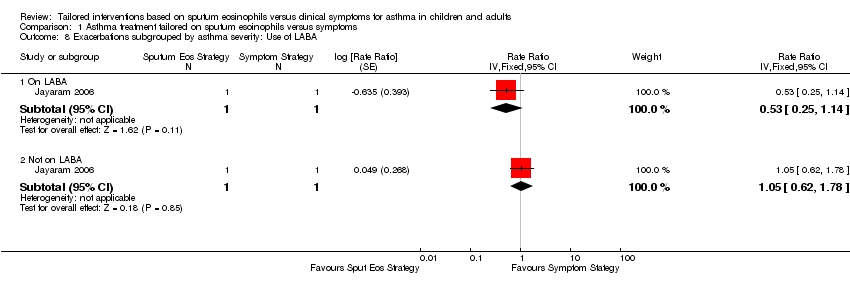
| 8 Exacerbations subgrouped by asthma severity: Use of LABA Show forest plot | 1 | | Rate Ratio (Fixed, 95% CI) | Subtotals only |
|
| 8.1 On LABA | 1 | 2 | Rate Ratio (Fixed, 95% CI) | 0.53 [0.25, 1.14] |
| 8.2 Not on LABA | 1 | 2 | Rate Ratio (Fixed, 95% CI) | 1.05 [0.62, 1.78] |
| 9 Mean dose of inhaled corticosteroids per person per day (Bud equiv) Show forest plot | 5 | 316 | Mean Difference (Fixed, 95% CI) | 12.56 [‐127.92, 153.04] |
|
| 9.1 Adults | 4 | 262 | Mean Difference (Fixed, 95% CI) | 0.67 [‐154.39, 155.73] |
| 9.2 Children | 1 | 54 | Mean Difference (Fixed, 95% CI) | 67.0 [‐264.81, 398.81] |
| 10 Mean dose of oral corticosteroids per person per day Show forest plot | 1 | | Mean Difference (Fixed, 95% CI) | Totals not selected |
|
| 11 Yearly cost per person (USD) Show forest plot | 1 | | Mean Difference (IV, Fixed, 95% CI) | Totals not selected |
|