基于痰嗜酸性粒细胞与儿童和成人哮喘的临床症状定制的干预措施
摘要
研究背景
哮喘的严重程度和控制程度可以从主观和客观两个方面来衡量。痰液分析用于评价痰嗜酸性粒细胞百分比,可直接测量气道炎症,是客观监测哮喘的方法之一。使用痰液分析来调整或定制哮喘药物,可能优于基于症状和肺活量测定的传统研究方法。
研究目的
通过与传统研究方法(通常以症状为基础,有或无肺活量/峰流速测定)比较,评价基于痰液分析的定制哮喘干预措施对儿童和成人哮喘相关结局的疗效。
检索策略
我们检索了Cochrane气道组专业试验注册库(Cochrane Airways Group Specialised Register of Trials),Cochrane对照试验中心注册库(Cochrane Central Register of Controlled Trials, CENTRAL)、MEDLINE、Embase、试验注册库及相关文章的参考文献列表。最新一次检索于2017年2月进行。
纳入排除标准
所有基于痰嗜酸性粒细胞的哮喘治疗调整与传统研究方法(主要是临床症状和肺活量/峰流速测定)的随机对照比较。
资料收集与分析
依据事先确定的纳入标准评价了检索结果。在本次更新中,两名系统综述作者筛选了相关研究,独立评价了试验质量并提取了资料。我们联系了作者以获取更多相关信息。我们分析了“接受治疗”资料,并进行了敏感性分析。
主要结果
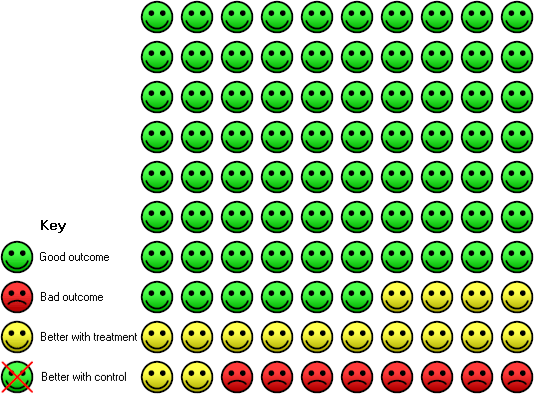
本次更新增加了三项新的研究,共纳入六项研究(五项研究针对成人,一项研究涉及儿童/青少年)。这六项研究均在临床和方法学上存在异质性(药物的使用、痰嗜酸性粒细胞百分比的临界值以及哮喘恶化的定义)。在374名随机受试者中,共有333名完成了试验。在meta分析(meta‐analysis)中,与基于有无肺功能的临床症状相比,基于痰嗜酸性粒细胞计数的治疗,其任何恶化的发生都显著减少;合并比值比(odds ratio, OR)=0.57(95%置信区间(confidence interval, CI) [0.38, 0.86])。在16个月内出现一次或多次恶化的风险在对照组中为82%,在痰液分析组中为62%(95% CI [49%, 74%]),最终获益需治疗人数(number needed to treat to benefit, NNTB)为6(95% CI [4, 13])。
各组之间的恶化率(每年任何恶化)以及根据使用口服糖皮质激素和住院治疗的要求而定义的恶化严重程度也存在差异:对照组在16个月内一次或多次住院的风险为24%,而痰液分析组中为8%(95% CI [3%, 21%])。各组之间的临床症状、生活质量和肺活量测定资料没有显著差异。两组受试者每天吸入糖皮质激素的平均剂量也相似。然而,痰诱导并不总是可行的。纳入的研究未记录任何不良事件。
一项研究未采用盲法,因此被认为具有高偏倚风险。然而,将该研究从敏感性分析中移除后,组间主要结局(恶化)仍有显著统计学差异。由于恶化定义的不一致性和入院人数少,证据的推荐意见的评估、制定与评价(Grading of Recommendation Assessment, Development, and Evaluation, GRADE)质量范围从中等(对于结局“发生任何恶化”和“住院”)到低(对于结局“每人每天吸入糖皮质激素的平均剂量”)。
作者结论
在本次更新的系统综述中,基于痰嗜酸性粒细胞的定制哮喘干预措施有助于减少成年哮喘患者的哮喘恶化频率。尽管我们无法通过亚组分析证实这一点,但频繁恶化和患有严重哮喘的成人可能会从这项额外的监测测试中得到最大的获益。目前尚缺乏足够的资料来评价基于儿童痰嗜酸性粒细胞定制的哮喘药物。
需要开展进一步稳健的随机对照试验(randomized controlled trials, RCTs),这些随机对照试验应纳入具有不同潜在哮喘严重程度和内型的受试者。
PICO
简语概要
基于痰嗜酸性粒细胞与儿童和成人哮喘的临床症状定制的干预措施
研究背景
哮喘的药物治疗通常以各种措施为指导,例如哮喘症状和肺功能检查。在本系统综述中,我们想了解根据痰嗜酸性粒细胞指导治疗是否更有益处。嗜酸性粒细胞是一种白细胞,在某些形式的炎症中数量会增加。痰液中嗜酸性粒细胞的数量可以告诉我们肺部一种炎症的水平。我们寻找了有关测量痰液中嗜酸性粒细胞以指导哮喘治疗是否可以改善儿童和成人哮喘结局的证据。
研究特征
我们纳入了通过计数痰嗜酸性粒细胞与常规治疗来比较哮喘药物调整的研究。为了纳入本综述中,研究必须随机决定谁会属于哪一组。受试者根据哮喘指南诊断均患有哮喘。
研究的最近一次检索是在2017年2月进行的。
本次更新的系统综述纳入了六项研究,涉及382名哮喘患者(55名儿童/青少年,327名成人)。这些研究在研究持续时间和随访、痰嗜酸性粒细胞计数用于调整药物和定义哮喘发作的方式等方面存在差异。研究持续6至24个月。研究中受试者的年龄分布为12至48岁。
主要研究结果
我们发现,基于痰嗜酸性粒细胞计数指导哮喘药物治疗(与对照组相比)可减少成人哮喘发作的次数并降低严重程度。在根据临床症状指导治疗的对照组中,100名受试者中有82名至少出现过一次发作。在基于痰嗜酸性粒细胞计数指导用药的受试者中,这降低到了100名中有62名至少出现过一次发作。我们不确定对其他措施的影响,例如生活质量或所需吸入类固醇的剂量。在儿童受试者方面没有足够的资料来评价使用痰嗜酸性粒细胞是否有用。
证据质量
我们对任何哮喘发作和入院的证据有中等程度的信心。我们关注的是这些研究定义哮喘发作的不同方式和总体住院人数少,这使得我们更难发现差异。
我们对吸入类固醇剂量的证据不太有信心。这是因为这些研究使用了非常不同的剂量。此外,我们无法判断嗜酸性粒细胞指导的治疗是否总体上减少或增加了类固醇的剂量。
Authors' conclusions
Summary of findings
| Tailored interventions based on sputum eosinophils compared to tailored interventions based on clinical symptoms for asthma in adults and children | ||||||
| Patient or population: adults and children with asthma | ||||||
| Outcomes | Illustrative comparative risks* (95% CI) | Relative effect | No of Participants | Quality of the evidence | Comments | |
| Assumed risk at one year | Corresponding risk | |||||
| Tailored interventions based on clinical symptoms | Tailored interventions based on sputum eosinophils | |||||
| Number of participants who had one or more exacerbations over the study period Follow‐up: 12 to 24 months | 82 per 100 | 62 per 100 (49 to 74) | OR 0.36 | 228 | ⊕⊕⊕⊝ | see Figure 1 |
| Hospitalisations | 24 per 100 | 8 per 100 | OR 0.28 | 269 | ⊕⊕⊕⊝ | see Figure 2 |
| Mean dose of inhaled corticosteroids per person per day (BUD equivalent mcg/day) | The mean dose of inhaled corticosteroids per person per day in the intervention groups was | 316 | ⊕⊕⊝⊝ | |||
| Mean daily use of oral corticosteroids per person per day | See comment | See comment | Not estimable | 68 | Not estimable | |
| Yearly cost per person (USD) | See comment | See comment | Not estimable | 68 | Not estimable | |
| *The basis for the assumed risk is the mean of the two studies with a duration of one year. The corresponding risk (and its 95% confidence interval) is based on the assumed risk in the comparison group and the relative effect of the intervention (and its 95% CI). | ||||||
| GRADE Working Group grades of evidence | ||||||
| 1 One paper (Chlumsky 2006) was open labelled , but results were similar without this study. Our confidence in these results was downgraded by one point because of inconsistency in defining exacerbations 3The dose of inhaled steroids varied considerably within and between studies and results are compatible with both important reduction or decrease in dose of inhaled corticosteroids using sputum eosinophils. | ||||||

In the control group 82 people out of 100 had people with one or more exacerbations over 16 months, compared to 62 (95% CI 49 to 74) out of 100 for the active treatment group.
In the control group 24 people out of 100 had people with one or more hospitalisations over 16 months, compared to 8 (95% CI 3 to 21) out of 100 for the active treatment group.
Background
Description of the condition
Asthma guidelines aim to guide health practitioners in adjusting treatment for patients so as to minimise symptoms or improve asthma control, optimise lung function, and prevent acute exacerbations (BTS/SIGN 2016; GINA 2017; National Asthma Council 2014). Exacerbations are important as they cause anxiety to patients and their families and are costly to healthcare systems (Weiss 2001). Preventing exacerbations is thus an important component for maintaining ideal asthma control. The second component in asthma management is monitoring of asthma control (by subjective and objective measures) (BTS/SIGN 2016; GINA 2017; National Asthma Council 2014). Subjective measures usually involve a series of questions used for clinical assessment, diary cards and quality‐of‐life questionnaires. Traditional objective measures include peak flow monitoring, spirometry and degree of airway hyper‐responsiveness (AHR) (Zacharasiewicz 2005). Other methods such as markers of airway inflammation (e.g. sputum eosinophils, exhaled nitric oxide levels and breath condensate markers) have been advocated for asthma monitoring. These may be more sensitive markers than subjective measures, as they directly measure airway inflammation, in comparison to traditional objective measures (Zacharasiewicz 2005).
Types of airway inflammation in people with asthma
Airway inflammation in asthma may be eosinophilic, neutrophilic or a mixture of both (Douwes 2002). Asthma management is arguably best tailored in accordance with the type of airway inflammation, as corticosteroids are more beneficial in eosinophilic inflammation (Wardlaw 2000), and inhaled corticosteroids (ICS) reduce exacerbations and improve symptoms and asthma control (Wardlaw 2000).
Description of the intervention
There are several ways to quantify airway eosinophilic inflammation, such as determining the percentage of eosinophils in the sputum or in the bronchoalveolar lavage. Recurrent use of the latter is not feasible in clinical medicine as it is an invasive procedure (e.g. usually requiring general anaesthesia in children). Induced sputum is not invasive, it is much simpler to obtain sputum and it provides similar (but not identical) data to that of bronchoalveolar lavage. Induced sputum can be obtained by several methods including the use of nebulised hypertonic saline or mannitol (as part of a bronchial provocation testing) and chest physiotherapy techniques such as using airway clearance apparatus like the flute. The sputum obtained is then prepared and the total cell and differential cellularity determined, thereby providing the relative percentages of eosinophils, neutrophils and macrophages. Analysis of induced sputum is a reproducible method in determining airway inflammation in asthma in adults (Bacci 2002).
How the intervention might work
In many people with asthma, the percentage of eosinophils in induced sputum is higher than that in non‐asthmatic patients (Ohnishi 1998). Neutrophilic airway inflammation has however also been described in people with asthma (Green 2002b). Thus assessing airway inflammation by quantitative measurements instead of subjective data potentially allows better tailoring of personal asthma interventions, which in turn may improve asthma control or reduce exacerbations, or both.
Why it is important to do this review
While tailoring asthma medications based on sputum eosinophilia may be helpful, undertaking induced sputum and sputum analysis is labour intensive and not widely available in non‐research laboratories. Also, hypertonic saline or mannitol, used to induce sputum, may also temporarily increase asthma symptoms. Thus, a systematic review evaluating the efficacy of tailoring asthma interventions based on sputum analysis (sputum strategy, SS) in comparison with the traditional reliance primarily on clinical symptoms (CS) of asthma will be useful to help guide both physicians and patients as to whether or not undertaking this additional intervention is warranted in improving their asthma outcomes.
Objectives
To evaluate the efficacy of tailoring asthma interventions based on sputum analysis in comparison to traditional methods (usually symptom‐based with or without spirometry/peak flow) for asthma‐related outcomes in children and adults.
Methods
Criteria for considering studies for this review
Types of studies
All randomised controlled trials comparing adjustment of asthma medications based on sputum analysis in comparison to traditional methods (primarily clinical symptoms with or without spirometry/peak flow).
Types of participants
Children and adults with a diagnosis of asthma in accordance to guideline‐defined criteria. Exclusion criteria: eosinophilic bronchitis; asthma related to an underlying lung disease such as bronchiectasis and chronic obstructive pulmonary disease (COPD).
Types of interventions
We included studies which compared adjustment of asthma therapy based on sputum eosinophils to adjusting therapy based on clinical symptoms with or without spirometry/peak flow. Trials that included the use of other interventions were included if all participants had equal access to such interventions.
Types of outcome measures
Primary outcomes
Proportion of participants who had asthma exacerbations during follow‐up.
Secondary outcomes
-
Objective measurements of asthma control (FEV₁, peak flow or airway hyper‐responsiveness).
-
FeNO level.
-
Subjective symptoms as reported in Asthma Control Test or asthma‐related quality of life questionnaire score.
-
Inhaled corticosteroid doses.
-
Cost analysis.
We determined the proportions of participants who failed to improve on treatment and the mean clinical improvement using the following hierarchy of assessment measures (i.e. where two or more assessment measures are reported in the same study, we used the outcome measure that is listed first in the hierarchy).
-
Hospitalisation, acute presentations to an emergency facility for asthma, frequency of exacerbations and rescue courses of oral corticosteroids.
-
Symptomatic (quality of life, Likert scale, asthma diary, visual analogue scale) – assessed by the patient (adult or child).
-
Symptomatic (quality of life, Likert scale, asthma diary, visual analogue scale) – assessed by the parents/carers.
-
Symptomatic (Likert scale, visual analogue scale) – assessed by clinicians.
-
Indices of spirometry, peak flow, airway hyper‐responsiveness.
-
Beta‐agonist used.
Search methods for identification of studies
Electronic searches
This is an update of a previous Cochrane Review (Petsky 2007). For this update (from November 2008 to current search), we identified trials from the Cochrane Airways Group's Specialised Register (CAGR), which is maintained by the Information Specialist for the Group. The Register contains studies identified from several sources.
-
Monthly searches of the Cochrane Central Register of Controlled Trials (CENTRAL) in the Cochrane Library, through the Cochrane Register of Studies Online (crso.cochrane.org).
-
Weekly searches of MEDLINE Ovid SP 1946 to date.
-
Weekly searches of Embase Ovid SP 1974 to date.
-
Monthly searches of PsycINFO Ovid SP.
-
Monthly searches of CINAHL EBSCO (Cumulative Index to Nursing and Allied Health Literature).
-
Monthly searches of AMED EBSCO (Allied and Complementary Medicine).
-
Handsearches of the proceedings of major respiratory conferences.
Studies contained in the Trials Register are identified through search strategies based on the scope of Cochrane Airways. Details of these strategies, as well as a list of handsearched conference proceedings are in Appendix 1. See Appendix 2 for search terms used to identify studies for this review.
We also conducted a search of ClinicalTrials.gov (www.ClinicalTrials.gov) and the World Health Organization (WHO) trials portal (www.who.int/ictrp/en/), using the search strategy in Appendix 3. We searched all databases from their inception to 15 February 2017, and we imposed no restriction on language of publication.
Searching other resources
We checked reference lists of all primary studies and review articles for additional references. We searched relevant manufacturers' web sites for trial information.
We searched for errata or retractions from included studies published in full text on PubMed (www.ncbi.nlm.nih.gov/pubmed) on 10 March 2017.
Data collection and analysis
Selection of studies
The original selection of studies were reported in the previous review (Petsky 2007).
For this update, two review authors (HP, AC) independently screened titles, abstracts and descriptors retrieved from the literature searches, to identify potential relevant trials for inclusion. We retrieved potential full text study reports/publications and two review authors (HP, AC) independently screened the full text and identified studies for inclusion, and recorded reasons for exclusion for ineligible studies. We identified and excluded duplicates and collated multiple reports of the same study so that each study, rather than each report, was the unit of interest in the review. We recorded the selection process in sufficient detail to complete the PRISMA flow diagram (Figure 3) and Characteristics of excluded studies table.

Study flow diagram for 2008‐2017 literature searches.
Data extraction and management
We reviewed trials that satisfied the inclusion criteria and recorded the following information: study setting, year of study, source of funding, patient recruitment details (including number of eligible participants), inclusion and exclusion criteria, other symptoms, randomisation and allocation concealment method, numbers of participants randomised, blinding (masking) of participants, care providers and outcome assessors, dose and type of intervention, duration of therapy, co‐interventions, numbers of participants not followed up, reasons for withdrawals from study protocol (clinical, side‐effects, refusal and other), details on side‐effects of therapy, and whether intention‐to‐treat analyses were possible. We extracted data on the outcomes described previously and we double‐entered data from included studies into Review Manager 5 (RevMan 5) for meta‐analysis (Review Manager 2014).
Initial attempts to contact the corresponding authors in the original review were not successful (Petsky 2007). Dr Fleming provided further information and clarified some queries for Fleming 2012.
Assessment of risk of bias in included studies
We subjected studies included in the review to quality assessment and entered the results in 'Risk of bias' tables. We assessed seven components, as follows.
-
Random sequence generation.
-
Allocation concealment.
-
Blinding of the participants and personnel.
-
Blinding of outcome assessment.
-
Incomplete outcome data.
-
Selective outcome reporting.
-
Other bias.
We recorded each potential source of bias as high, low or unclear and provided a quote with a justification for our judgement in the 'Risk of bias' table. We then summarised the risk of bias judgements across different studies for each of the domains listed. Where information on risk of bias related to unpublished data or correspondence with a trialist, we noted this in the 'Risk of bias' table.
When considering treatment effects, we considered the risk of bias for the studies that contributed to that outcome.
Measures of treatment effect
We analysed dichotomous data as odds ratios (OR) and continuous data as mean difference (MD) or standardised mean difference (SMD) with 95% confidence intervals (CI). We then entered data presented as a scale with a consistent direction of effect.
We undertook meta‐analyses where it was meaningful (i.e. if the treatments, participants and the underlying clinical question were similar enough for pooling to make sense).
We narratively described skewed data as medians and interquartile ranges.
Where multiple trial arms were reported in a single trial, we included only the relevant arms. If two comparisons (e.g. drug A versus placebo and drug B versus placebo) were combined in the same reported result, we halved the control group to avoid double counting.
Unit of analysis issues
For dichotomous data, we reported the proportion of participants contributing to each outcome in comparison to the total number randomised. For rate ratios of common events whereby one participant may have more than one event, we used generic inverse variance (GIV) analysis. The rate ratios were taken from the published papers and the standard errors calculated from CIs or P values published in the papers. We had planned for cross‐over studies, to calculate the mean treatment differences from raw data, and variances extracted or imputed and entered as fixed‐effect (GIV) outcome, to provide summary weighted differences and 95% CIs.
Dealing with missing data
We contacted investigators to verify key study characteristics and obtain missing numerical outcome data where possible (e.g. when a study was identified as abstract only). Where this was not possible, and the missing data were thought to introduce serious bias, we explored the impact of including such studies in the overall assessment of results by a sensitivity analysis.
Assessment of heterogeneity
We described any heterogeneity between the study results and tested it to see if it reached statistical significance using a Chi² test. We planned to include the 95% CI estimated using a random‐effects model whenever there were concerns about statistical heterogeneity. Heterogeneity was considered significant when the P value was less than 0.10 (Higgins 2011). We then used the I² statistic to measure heterogeneity among the trials in each analysis. If we identified substantial heterogeneity, we reported it and explored possible cause of prespecified subgroup analysis.
Assessment of reporting biases
We were unable to pool more than 10 trials, so did not create and examine a funnel plot to explore possible small‐study and publication biases.
Data synthesis
We included the results from studies that met the inclusion criteria and reported the outcomes of interest in the subsequent meta‐analyses. The summary weighted odds ratio and 95% confidence interval (fixed‐effect model) were calculated (Review Manager 2014). For rate ratios of common events whereby one participant may have more than one event, generic inverse variance (GIV) was utilised. The rate ratios were taken from the published papers and the standard errors were calculated from confidence intervals or P values published in the papers. It was planned that for cross‐over studies, mean treatment differences would be calculated from raw data, extracted or imputed and entered as fixed‐effect GIV outcome, to provide summary weighted differences and 95% confidence intervals. For cross‐over trials, it was planned that only data from the first arm were included in meta‐analysis if data were combined with parallel studies (Elbourne 2002). Numbers needed to treat for an additional beneficial outcome (NNTB) were calculated from the pooled OR and its 95% CI applied to a specified baseline risk using an online calculator (Cates 2008). The outcome indices were assumed to be normally distributed continuous variables so the mean difference in outcomes could be estimated (weighted mean difference). If studies reported outcomes using different measurement scales, we estimated the standardised mean difference.
Subgroup analysis and investigation of heterogeneity
We carried out the planned a priori sub‐group analysis for adults versus children.
Sensitivity analysis
We planned sensitivity analyses to assess the impact of the potentially important factors on the overall outcomes.
-
Variation in the inclusion criteria.
-
Differences in the medications used in the intervention and comparison groups.
-
Analysis using random‐effects model.
-
Analysis by 'treatment received'.
-
Analysis by 'intention‐to‐treat'.
-
Analysis by study design‐parallel and crossover studies.
Results
Description of studies
See Characteristics of included studies; Characteristics of excluded studies; Characteristics of studies awaiting classification.
Results of the search
See Figure 3 for study flow diagram.
For this update, the searches identified 1213 potentially relevant titles from CAGR. We identified an additional 62 titles through searches of ClinicalTrials.gov and the WHO trials portal (who.int/ictrp/en/). After assessing the abstracts, seven papers were obtained for consideration to be included into the updated review. Four papers were not relevant as treatment was not based on sputum eosinophils or non‐randomised. From the searches conducted in 2014 an additional two papers (Chakir 2010; D'Silva 2008) were considered eligible but were the same participants from an already included study (Jayaram 2006). Please see our previous review for results of searches (Petsky 2007).
Included studies
This updated review now includes six studies (see Characteristics of included studies): three were from our previous review (Petsky 2007); and three are new to this review (Figure 3). The six studies involved 374 randomised participants with 333 completing the trials (Cao 2007; Chlumsky 2006; Fleming 2012; Green 2002a; Jayaram 2006; Malerba 2015).
Five papers were published in English and one study in Chinese (Cao 2007), which was translated by two independent translators using a standardised extraction form.
Study design
All six studies were parallel‐group studies. One was a multi‐centre study (Jayaram 2006); and the other five were uni‐centre studies (Cao 2007; Chlumsky 2006; Fleming 2012; Green 2002a; Malerba 2015).
Three studies were double blind (Fleming 2012; Green 2002a; Jayaram 2006); two were single blind (Cao 2007; Malerba 2015); and one had no blinding (Chlumsky 2006).
All the included studies differed in a variety of ways including the control arm, intervention arm (i.e. cut‐off used for sputum eosinophil percentage used to adjust medications), definition of exacerbations and duration of study. These differences have been outlined in Table 1.
| Study | Exacerbation definition | Sputum eosinophil cut‐off (%) | Control arm | Study duration (months) |
| Cao 2007 | Unknown | Decrease ICS < 1 Keep same 1 to 3 Increase ICS > 3 | "Standard clinical guidelines" | 6 |
| Chlumsky 2006 | Doubling of the frequency of symptoms and/or number of puffs of rescue salbutamol and/or reduction in morning PEF by 30% or more on at least 2 consecutive days. A decrease in FEV₁ by > 30% at any study visit | Decrease ICS ≤ 3 Keep same 4 to 8 Increase ICS ≥ 8 | GINA guidelines | 18 |
| Fleming 2012 | Minor exacerbation: use of bronchodilators > 5 times/week (excl. routine or pre‐exercise) Major exacerbation: deterioration requiring high‐dose OCS (≥ 20 mg/day) for at least 2 days | Decrease ICS < 0.1 (or FeNO < 22 ppb) Keep same 0.1 to 2.5 (or FeNO 22 to 30 ppb) Increase ICS > 2.5 (or FeNO > 30 ppb) | Based on number of major exacerbations in preceding 3 months and SABA use in preceding 2 weeks | 12 |
| Green 2002 | Severe exacerbations: decrease in morning PEF > 30% on 2 or more consecutive days, or deterioration in symptoms needing OCS. | Decrease ICS < 1 Keep same 1 to 3 Increase ICS > 3 | BTS guidelines | 12 |
| Jayaram 2006 | Worsening of symptoms requiring increased use of SABA by ≥ 4 puffs/day for a minimum of 48 hours, or early morning wakening due to respiratory symptoms > 2 times/week, with or without reduction in FEV₁ of at least 20%. Severe exacerbation: course of OCS as determined by study investigator. | Decrease ICS ≤ 2 Increase ICS ≥ 2 | Canadian Asthma Consensus Group Guidelines | 24 |
| Malerba 2015 | Moderate exacerbation: requiring an unscheduled visit with a course of OCS. Severe exacerbation: hospital admission and requiring > 3 days OCS. | Sputum eosinophil (%) & FeNO (ppb) Decrease ICS < 2% & ≤ 10 pbb Keep same 2% to 3% & 11 to 20 ppb Increase ICS > 3% & ≥ 20 ppb | Symptom scores, use of SABA and night time symptoms | 24 |
FeNO: exhaled nitric oxide; FEV₁: forced expiratory volume in one second; ICS: inhaled corticosteroids; OCS: oral corticosteroids; PEF: peak expiratory flow; ppb: parts per billion
Malerba 2015 partly fulfilled the inclusion criteria but their data were not included in the meta‐analyses as their intervention strategy involved adjusting the medication based on both FeNO levels and sputum eosinophil counts.
Participants
The six studies had different inclusion criteria for the participants. All studies included participants with asthma.
Five studies involved only adult patients (Cao 2007; Chlumsky 2006; Green 2002a; Jayaram 2006; Malerba 2015). There was one study that included children (Fleming 2012).
Sputum eosinophil strategy (SS)
The intervention arm in the studies, although primarily based on sputum eosinophil percentage, also differed slightly. In two studies, anti‐inflammatory treatment was based on maintaining sputum eosinophil count below 3% with a minimum dose of anti‐inflammatory treatment (Cao 2007; Green 2002a). In Jayaram and colleagues' study, medications were adjusted to keep sputum eosinophils to 2% or less using inhaled corticosteroids (Jayaram 2006). In Chlumsky and colleagues' study, medications were based on maintaining the sputum eosinophil count below 8% (Chlumsky 2006). The paediatric paper adjusted treatment to keep sputum eosinophils to less than 2.5% (Fleming 2012).
The intervention arm in Malerba and colleagues' study was based on maintaining FeNO levels at less than 20 ppb, in addition to keeping sputum eosinophil count below 3% (Malerba 2015).
The intervention strategies used in the various trials are further described in Table 1.
Clinical symptom strategy (CS)
Four of the six studies utilised existing asthma guidelines to adjust treatment in the control group (Cao 2007; Chlumsky 2006; Green 2002a; Jayaram 2006). One study used participant‐reported symptoms (Malerba 2015). The sole paediatric study used number of major exacerbations (defined by oral corticosteroid use) and short‐acting beta₂‐agonists (SABA) use in the preceding three months (Fleming 2012).
The control group strategies are described in Table 1.
Outcomes
All six studies used asthma exacerbations as their primary outcome (Cao 2007; Chlumsky 2006; Fleming 2012; Green 2002a; Jayaram 2006; Malerba 2015). However the definitions of exacerbation were different among the studies (Table 1). In addition to exacerbations, two studies included reported symptoms as the primary outcome (Fleming 2012; Malerba 2015).
The secondary outcomes also varied among the studies. Five studies used ICS doses (Cao 2007; Fleming 2012; Green 2002a; Jayaram 2006; Malerba 2015); four studies included spirometry (Cao 2007; Chlumsky 2006; Green 2002a; Malerba 2015); two studies included symptom scores (Cao 2007; Green 2002a); and two included FeNO levels (Green 2002a; Malerba 2015).
The study characteristics are described in the Characteristics of included studies table.
Excluded studies
We recorded the reasons for excluding 23 studies in the Characteristics of excluded studies table. The most common reason for exclusions were: treatment not adjusted according to sputum eosinophil counts (18 studies); and not an RCT (five studies).
The search in November 2008 revealed another abstract that can be included (Pinot 2008); the author was contacted for further information but this abstract was never written up in full publication.
Adverse events were not reported in any studies. We requested further information from the authors to allow data to be entered into RevMan 5 for meta‐analysis. Fleming 2012 provided some raw data.
Risk of bias in included studies
The full details of risk of bias judgements are described under the 'Risk of Bias' section in the Characteristics of included studies table and summarised in Figure 4. Overall, the methodological quality of the included studies was good.
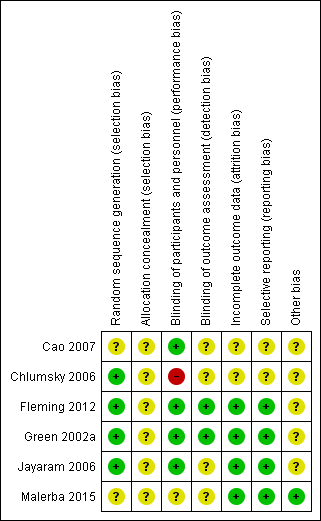
Methodological quality summary: review authors' judgements about each methodological quality item for each included study.
Three studies were double blinded (Fleming 2012; Green 2002a; Jayaram 2006); whereas one was open labelled (Chlumsky 2006); and two single blinded (Cao 2007; Malerba 2015). Allocation concealment was clearly described in one study (Green 2002a), but unclear in the other five (Cao 2007; Chlumsky 2006; Fleming 2012; Jayaram 2006; Malerba 2015). All six studies reported on the progress of all randomised participants (Cao 2007; Chlumsky 2006; Fleming 2012; Green 2002a; Jayaram 2006; Malerba 2015).
Allocation
Four studies described generation of randomisation sequence (Chlumsky 2006; Fleming 2012; Green 2002a; Jayaram 2006); it was unclear in two single‐blinded studies (Cao 2007; Malerba 2015). The method of allocation concealment was adequate in one study (Green 2002a), and unclear in five studies (Cao 2007; Chlumsky 2006; Fleming 2012; Jayaram 2006; Malerba 2015).
Blinding
Risk associated with participant blinding was low when the blinding of the assessors was reported based on information provided by the authors of the studies. These included comments from the studies such as "management decisions were made by independent physician" and "decisions made by an investigator blind to identity and randomisation group of the subject".
Risk of detection bias due to inadequate blinding of outcome assessors was high in one study (Chlumsky 2006); and unclear in two studies (Cao 2007; Malerba 2015), as there was not enough information in the published article. Three double‐blinded studies were assessed at low risk of bias (Fleming 2012; Green 2002a; Jayaram 2006).
Incomplete outcome data
Four studies were at low risk of attrition bias (Fleming 2012; Green 2002a; Jayaram 2006; Malerba 2015). Two studies did not report on dropouts and were therefore judged at unclear risk of attrition bias (Cao 2007; Chlumsky 2006).
Selective reporting
Reporting bias was low in four studies with all outcomes being reported (Fleming 2012; Green 2002a; Jayaram 2006; Malerba 2015). Two studies were at unclear risk of reporting bias as there was inadequate information in the published article (Cao 2007; Chlumsky 2006).
Other potential sources of bias
Another source of bias was the success of obtaining sputum at each visit. Three studies did not report the success of sputum induction at each time point (Cao 2007; Chlumsky 2006; Malerba 2015). Three studies reported their success in sputum induction: Fleming 2012 reported 85% success in sputum induction; Green 2002a reported 87%; and Jayaram 2006 reported 81% successful sputum induction.
Effects of interventions
See: summary of findings Table for the main comparison for the main comparisons.
Asthma exacerbations
All studies reported asthma exacerbations as the primary outcome (Cao 2007; Chlumsky 2006; Fleming 2012; Green 2002a; Jayaram 2006; Malerba 2015). The five adult studies described a significant reduction in asthma exacerbations in the arm that utilised treatment based on sputum eosinophils (SS) when compared to the clinical symptom (CS) arm (control arm whereby treatment was based primarily on clinical symptoms ± lung function) (Cao 2007; Chlumsky 2006; Green 2002a; Jayaram 2006; Malerba 2015). The adult studies reported a significant difference between groups in exacerbation data, with the SS group experiencing fewer exacerbations than the CS group. The paediatric study did not find a significant difference in the number of exacerbation between the strategies for the study duration (Fleming 2012). However they did see a difference with smaller number of exacerbations being experienced in the sputum strategy group within 28 days of a study visit. Some but not all data that relate to exacerbations could be combined for meta‐analysis. One study utilised FeNO levels in addition to sputum eosinophil counts to adjust medications in the intervention arm, therefore data from this study were not included in the meta‐analyses (Malerba 2015).
Also, the definition of exacerbation of the studies differed as described in Table 1
Any exacerbation (Outcome 1)
(a) Occurrence of any exacerbations (Analysis 1.1)
Combining data from these four studies (3 adults and 1 children), the use of the symptom eosinophil strategy (SS), compared to the clinical symptom strategy (CS), significantly reduced the occurrence of any exacerbations: rate ratio was 0.57 (95% CI 0.38 to 0.86); 269 participants in four studies; P = 0.007. As there was heterogeneity between the studies (I² = 51%), we used a random‐effects analysis.
In subgroup analysis, we separated children from adult studies. In the adult‐based studies (n = 3), use of the sputum strategy (compared to controls) significantly reduced the rate ratio of occurrence of exacerbations: rate ratio was 0.45 (95% CI 0.24 to 0.86), 215 participants in three studies; P = 0.02. The heterogeneity remained high with I² = 55%. In children there was only one study and there was no significant difference between the groups but the results numerically favoured the sputum strategy group: rate ratio was 0.75 (95% CI 0.54 to 1.04); 54 participants; P = 0.09. The test for a difference between adults and children showed no statistical significance (Chi² = 1.93, df = 1 (P = 0.17), I² = 48.1%).
(b) Number of participants who had one or more exacerbations (as defined by authors) during the study period (Analysis 1.2)
Meta‐analysis from data combined from four studies showed that the number of participants experiencing any exacerbation was significantly less (P < 0.001) in the SS group than in the CS group. Pooled OR estimate effect was 0.36 (95% CI 0.21 to 0.62); 269 participants. Using the combined control event rate from the one‐year studies of 82%, the NNTB for 16 months was 6 (95% CI 4 to 13); see Figure 1.
When considering the adult studies only, the SS group had significantly fewer participants experiencing one or more exacerbations compared to the CS group: OR 0.36 (95% CI 0.20 to 0.64); 215 participants in 3 studies; P < 0.001. However, the difference between the two groups in the paediatric study was not statistically significant: OR 0.39 (95% CI 0.09 to 1.71); 54 participants; P = 0.21. The test for a difference between adults and children showed no statistical significance (Chi² = 0.01, df = 1 (P = 0.92), I² = 0%).
(c) Time to first exacerbation
Four studies reported that the SS group had significantly longer time to first exacerbation compared to the CS group (Chlumsky 2006; Fleming 2012; Green 2002a; Jayaram 2006). However, the data from the studies could not be combined.
Chlumsky 2006 reported a significant difference (Chi² = 8.8, P = 0.003). Green 2002a reported 12 exacerbations in the BTS management group in the first month, versus one in the sputum management group.
Exacerbations classified by severity of exacerbation (Outcome 2)
(a) Number of participants requiring hospitalisation
See Analysis 1.3.
None of the participants from either arm in Jayaram 2006 or Chlumsky 2006 were hospitalised, whereas a total of seven in Green 2002a and 13 in Fleming 2012 were hospitalised. Combined data showed a difference between the groups (P = 0.02) favouring the SS group: the OR was 0.28 (95% CI 0.09 to 0.84); 269 participants in four studies. The risk of one or more hospitalisations over 16 months fell from a risk of 24% on control to 8% (95% CI 3% to 21%), giving a 16‐month NNTB of 7 (95% CI 5 to 33); see Figure 2.
When considering only the adults who were hospitalised for subgroup analysis, the difference was no longer statistically significant (P = 0.08); OR 0.14 (95% CI 0.02 to 1.25); 215 participants. Likewise statistical significance was lost when considering only children, (P = 0.16): OR 0.38 (95% CI 0.10 to 1.45). The reduction in statistical power when considering subgroups of adults and children is the most likely reason for the loss of statistical significance in these subgroup findings.
(b) Number of exacerbations requiring rescue oral corticosteroids (Analysis 1.4)
The rate of exacerbations requiring treatment with rescue oral corticosteroids was significantly lower in the SS group compared to the CS group in one study (Jayaram 2006), rate ratio of 0.33 (95% CI 0.16 to 0.70); 96 participants in one study, P = 0.004.
(c) Number of mild exacerbations (Analysis 1.5)
Data on mild exacerbations were available in two studies (Fleming 2012; Jayaram 2006). As the definition of severe exacerbations (other than that defined in Analyses 1.3 and 1.4) differed between the studies it was difficult to combine this data. Combining the two studies which defined minor exacerbations similarly by loss of asthma control requiring more than four puffs extra of bronchodilators, the number of exacerbations between the groups reached borderline significance (P = 0.05) favouring SS, rate ratio of 0.82 (95% CI 0.67 to 1.00); 150 participants.
Eosinophilic exacerbations
See Analysis 1.6.
Jayaram and colleagues reported types of asthma exacerbations in each group (Jayaram 2006). Sputum could only be obtained in 39 of the 47 exacerbations in the SS group and 63 of the 79 total exacerbations in the CS group. Those exacerbations where sputum could be obtained were classified as eosinophilic or non‐eosinophilic and this indicated that the overall reduction in exacerbation rate was largely due to a reduction in eosinophilic exacerbations in this study.
Exacerbations subgrouped by asthma severity
(a) Any exacerbation (risk ratio (RR)) by severity of asthma (Analysis 1.7)
Five studies did not subgroup participants by asthma severity (Cao 2007; Chlumsky 2006; Fleming 2012; Green 2002a; Malerba 2015). Jayaram and colleagues analysed data based on daily requirement for ICS and long‐acting beta₂‐agonists (LABA). Asthma severity was defined based on minimum daily maintenance fluticasone (mild asthma = requiring < 250 mcg/day; moderate to severe asthma = requiring 250 mcg/day) (Jayaram 2006). Those with mild asthma (< 250 mcg/day fluticasone equivalent) showed no significant difference: RR 1.34 (95% CI 0.52 to 3.46). Those with moderate to severe asthma (= 250 mcg/day fluticasone equivalent) also showed no significant difference between groups in the RR of exacerbation, although the direction of the outcome favoured the SS group (RR 0.63, 95% CI 0.38 to 1.04). The difference between these subgroup effects was not significant (test for subgroup differences: Chi² 1.93, df = 1, P = 0.19).
(b) Any exacerbations (RR), by use of long‐acting beta₂‐agonists (LABA) (Analysis 1.8)
Green 2002a reported equal numbers of participants in both groups being treated with LABA (N = 12) but outcomes based on those on LABA were not available . Data from Jayaram 2006 did not show a significant difference between the effect on exacerbations in those taking LABA (RR 0.53, 95% CI 0.25 to 1.14) or those not on LABA (RR 1.05, 95% CI 0.62 to 1.78), (test for subgroup differences: Chi² 2.07, df = 1, P = 0.15).
Secondary outcomes
Green 2002a reported other outcomes: exhaled nitric oxide was 48% lower in the SS group in comparison to the CS group at the end of study. The improvement in methacholine PC20 was significantly better in the SS group compared to the CS group at 6 months (doubling doses 1.0 versus −0.7, P = 0.03) and 12 months (0.2 versus −1.3, P = 0.015). However, the visual analogue symptom scores, total asthma quality of life scores, peak expiratory flow amplitude (% mean), FEV₁ after bronchodilator use and the use of rescue beta₂‐agonists did not differ significantly between the two groups in Green 2002a. Jayaram and colleagues did not report these outcomes; although asthma quality of life (QoL) assessments were undertaken, these results were not published (Jayaram 2006). Chlumsky et al's study also reported no significant difference between groups for FEV₁ change and they did not report on symptoms or QOL (Chlumsky 2006). Fleming and colleagues reported that the FeNO levels did not significantly change over the study period (Fleming 2012). Both the SS and control groups had significant improvement in FEV₁ scores when comparing z‐score from end to beginning of the study. The mean (SE) difference was 0.51 (0.37) for the symptom group and 0.49 (0.34) for the sputum eosinophil group. Neither group had a significant change in their bronchodilator reversibility over the duration of the study (Fleming 2012).
Mean daily dose of corticosteroid use
(a) Inhaled corticosteroid (ICS) (Analysis 1.9)
All six studies reported no significant differences in ICS use between groups. The SD for the groups were not available in Jayaram 2006 and was imputed based on the data from Green 2002a. Forest plots showed no significant difference between the groups and a wide confidence interval. Pooled MD 12.56 mcg (95% CI −127.92 to 153.04).
(b) Oral corticosteroids (Analysis 1.10)
Only Green and colleagues reported on mean oral corticosteroids use and described no difference between the groups (mean difference of −0.40 mg, 95% CI −2.36 to 1.56) (Green 2002a). Meta‐analysis was not possible.
Cost (Analysis 1.11)
Green and colleagues described estimated cost per patient per year and there was no significant difference between the groups (mean difference of −314, 95% CI −941.27 to 313.27) (Green 2002a). There were no data from other studies.
Other results
Sputum induction was not always successful: in Green's study, sputum induction was successful in 552 of 632 attempts (87%) (Green 2002a), and 102 out of a total of 126 (81%) in Jayaram and colleagues' study (Jayaram 2006). Fleming 2012, the one included paediatric paper, reported a success rate of 85% (174 occasions) with a sputum differential count success in 152 samples. Chlumsky 2006, Cao 2007 and Malerba 2015 did not report their success rate in obtaining sputum. No other adverse events were reported in the studies.
Sensitivity analyses
In the outcome of number of participants with one or more exacerbations during the study period, analyses based on 'intention to treat' (ITT) altered pooled OR only slightly from 0.49 (95% CI 0.28 to 0.87) for 'treatment received' to 0.50 (95% CI 0.28 to 0.88). The NNTB for one year changed from 6 (95% CI 4 to 13) to 7 (95% CI 4 to 35). Re‐analysis of the data based on the less conservative numbers (i.e. use of total of 102 as opposed to 96) for Jayaram and colleagues' study did not change the direction or significance of any of the outcomes (Jayaram 2006). Likewise re‐analysis of data based on ITT did not alter direction or significance of effects. In the outcomes described above, significant heterogeneity was only found in subgroup comparisons and thus no sensitivity analyses were performed for this.
One study did not use blinding (Chlumsky 2006); however removing the data from this study did not alter the results of the primary outcome (exacerbations) found in the main analyses; occurrence of any exacerbation (RR 0.66, 95% CI 0.46 to 0.93; participants = 218; studies = 3), number of participants who had one of more exacerbations over the study period (OR 0.43, 95% CI 0.24 to 0.79; participants = 218; studies = 3) and exacerbations requiring hospitalisations (OR 0.28, 95% CI 0.09 to 0.84; participants = 218; studies = 3).
Discussion
Summary of main results
This review consists of six RCTs involving 374 participants with 344 completing the trials. The studies varied in the sputum eosinophil levels (ranging from 2% to 8%) and algorithms used to adjust medications. The duration of the studies also differed, ranging from 6 to 24 months. We found that asthma exacerbations decreased when treatment was adjusted according to sputum eosinophil percentage. Six participants would need to have their asthma treatment adjusted by sputum eosinophil count for one participant to avoid exacerbation (95% CI 4 to 13). However, the data were robust for adult participants only as there was a single study involving children/adolescents. Also, there were no significant difference between the groups in symptoms of asthma (VAS score, QoL and beta agonist use) but this was limited by little data.
All studies reported exacerbations (our review's primary outcome), but the definition varied among the studies. We were able to combine data for a maximum of four studies for the meta‐analysis of the different definitions of exacerbation. The occurrence of any exacerbation was significantly lower in the group that utilised sputum eosinophil counts compared to the symptom strategy (rate ratio 0.57, 95% CI 0.38 to 0.86). Likewise, the number of participants having one or more asthma exacerbations was lower in the sputum eosinophil group (OR 0.36, 95% CI 0.21 to 0.62). The number of people with exacerbations requiring hospitalisations was significantly lower in the sputum eosinophilia strategy (OR 0.28, 95% CI 0.09 to 0.84).
There was no significant difference between groups for the mean daily dose of inhaled corticosteroids at final visit.
In the subgroup analyses, for children the reductions seen between the sputum eosinophil strategy and control strategy for occurrence of any exacerbations (RR 0.75, 95% CI 0.54 to 1.04), number of participants who had one or more episodes of asthma exacerbation (OR 0.39, 95% CI 0.09 to 1.71) or exacerbations requiring hospitalisations (OR 0.38, 95% CI 0.10 to 1.45) did not achieve statistical significance (possibly due to lack of statistical power due to small numbers).
In the sensitivity analyses, there were no changes in the primary outcomes when conducting analyses on 'intention to treat' or by removing the one study which did not have any blinding (Chlumsky 2006).
Overall completeness and applicability of evidence
This review included six studies, but the meta‐analyses consisted of data from between one to five studies for the various outcomes, including our review's primary outcome. The total number of participants for the various outcomes ranged from 68 (outcomes: mean dose of oral corticosteroids per person per day and yearly cost per person) to 316 (outcome: mean daily dose of inhaled corticosteroids per person per day). Although we contacted authors of the studies, the completeness of the review was limited by availability of data.
Theoretically the use of sputum to guide asthma therapy may result in significant differences in doses of oral or ICS. This meta‐analysis found that there was no significant differences in the amount of corticosteroids (inhaled or oral) used between the two groups. Also, Green 2002a reported that the annual cost was not significantly more expensive in the SS group compared to the CS group.
In contrast to the favourable data in the outcome of exacerbations that support the use of sputum to guide asthma therapies, there was a lack of difference between the groups in symptoms of asthma (VAS score, QoL and beta agonist use). While exacerbations are an important outcome, arguably subjective measures of asthma control are also important.
Asthma is a heterogeneous condition, and there is increasing appreciation of non‐eosinophilic asthma (Seys 2017) and overlap syndromes (with COPD) (Karampitsakos 2016). The data from this review is unlikely to be applicable to those who have non‐eosinophilic asthma, overlap syndromes, or exacerbations that are non‐eosinophilic asthma. Thus, although this meta‐analysis that has shown that monitoring airway inflammation through eosinophils in induced sputum is useful in reducing exacerbations in adults, it is arguable that it cannot be universally advocated. However, in people with frequent exacerbations it is likely that this intervention is useful.
None of the studies used the new biologic compounds (e.g. anti‐interleukin‐5) that is efficacious for severe eosinophilic asthma in adults (Robinson 2017).
Furthermore, sputum analysis is restricted to laboratories with specific expertise in inducing and analysing sputum. Obtaining and analysing sputum is relatively time consuming (when compared to exhaled nitric oxide) and is not always successful. Also, it can be very difficult to obtain satisfactory samples in young children.
Lastly this review is limited in children as there was only one small study that included children (Fleming 2012).
Quality of the evidence
We summarised the evidence for the three main outcomes related to exacerbations and ICS dose in the 'Summary of findings' table. Overall, we judged the quality of evidence to be moderate for exacerbations (due to inconsistency of definition of an exacerbation) and hospitalisations (due to the small number of events). One study was a non‐blinded trial but removing this study did not alter the results of the primary outcomes (Chlumsky 2006).
The quality of the evidence for the outcome of ICS dose per person per day at the end of the study was low. We downgraded this outcome by one for imprecision and one for lack of blinding in one study. The dose of inhaled steroids varied considerably within and between studies.
Potential biases in the review process
We are unaware of any bias in the review process. We used a comprehensive search strategy and adhered to the protocol. Two review authors (HP, AC) independently assessed the risk of bias. We contacted the corresponding authors of all the studies for raw data to include in the meta‐analysis. AC and the review editor (Christopher Cates) independently checked the data extraction, 'Risk of bias' assessment, and downgrading decisions for the 'Summary of findings' table in order to minimise the risk of bias in the review process.
The inclusion of Malerba 2015 in the meta‐analyses would have introduced bias, as the strategy used included FeNO in addition to sputum eosinophil counts.
Agreements and disagreements with other studies or reviews
This is an update of a previous Cochrane Review (Petsky 2007) and has been strengthened by the addition of three RCTs (Cao 2007; Fleming 2012; Malerba 2015). The findings of both Cochrane Reviews are in agreement, with fewer asthma exacerbations occurring in the group that had their asthma treatment adjusted based on sputum eosinophil percentage.
A recent literature review (Seys 2017) concluded that monitoring eosinophilic inflammation using sputum cell counts is helpful to monitor asthma severity, control and progression of disease.

In the control group 82 people out of 100 had people with one or more exacerbations over 16 months, compared to 62 (95% CI 49 to 74) out of 100 for the active treatment group.

In the control group 24 people out of 100 had people with one or more hospitalisations over 16 months, compared to 8 (95% CI 3 to 21) out of 100 for the active treatment group.
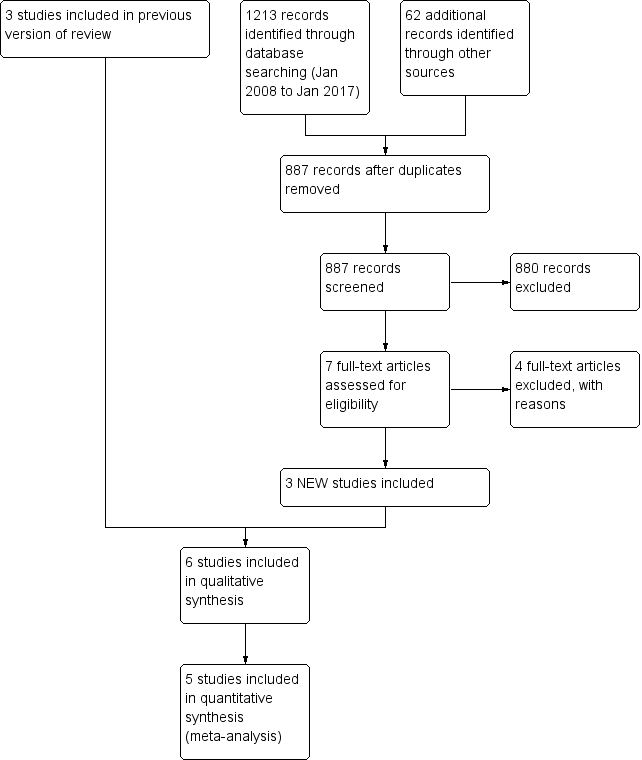
Study flow diagram for 2008‐2017 literature searches.

Methodological quality summary: review authors' judgements about each methodological quality item for each included study.

Comparison 1 Asthma treatment tailored on sputum esoinophils versus symptoms, Outcome 1 Occurrence of any exacerbation.

Comparison 1 Asthma treatment tailored on sputum esoinophils versus symptoms, Outcome 2 Number of participants who had one or more exacerbations over the study period.

Comparison 1 Asthma treatment tailored on sputum esoinophils versus symptoms, Outcome 3 Number of participants with exacerbations regarding hospitalisations over the study period.

Comparison 1 Asthma treatment tailored on sputum esoinophils versus symptoms, Outcome 4 Number of severe exacerbations requiring oral corticosteroids.

Comparison 1 Asthma treatment tailored on sputum esoinophils versus symptoms, Outcome 5 MIld exacerbations over study period.

Comparison 1 Asthma treatment tailored on sputum esoinophils versus symptoms, Outcome 6 Eosinophilic v Noneosinophilic exacerbations.

Comparison 1 Asthma treatment tailored on sputum esoinophils versus symptoms, Outcome 7 Exacerbations subgrouped by asthma severity: Mild vs Severe.
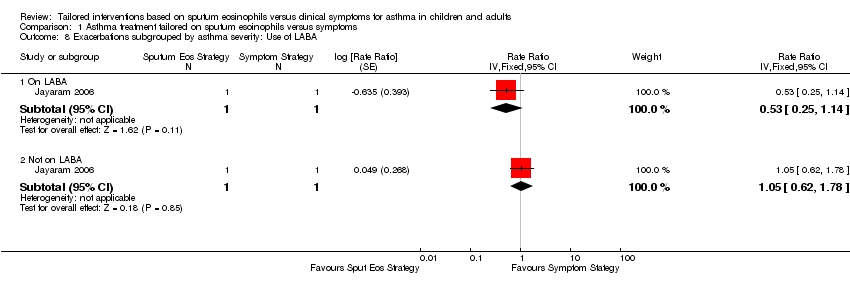
Comparison 1 Asthma treatment tailored on sputum esoinophils versus symptoms, Outcome 8 Exacerbations subgrouped by asthma severity: Use of LABA.

Comparison 1 Asthma treatment tailored on sputum esoinophils versus symptoms, Outcome 9 Mean dose of inhaled corticosteroids per person per day (Bud equiv).

Comparison 1 Asthma treatment tailored on sputum esoinophils versus symptoms, Outcome 10 Mean dose of oral corticosteroids per person per day.

Comparison 1 Asthma treatment tailored on sputum esoinophils versus symptoms, Outcome 11 Yearly cost per person (USD).
| Tailored interventions based on sputum eosinophils compared to tailored interventions based on clinical symptoms for asthma in adults and children | ||||||
| Patient or population: adults and children with asthma | ||||||
| Outcomes | Illustrative comparative risks* (95% CI) | Relative effect | No of Participants | Quality of the evidence | Comments | |
| Assumed risk at one year | Corresponding risk | |||||
| Tailored interventions based on clinical symptoms | Tailored interventions based on sputum eosinophils | |||||
| Number of participants who had one or more exacerbations over the study period Follow‐up: 12 to 24 months | 82 per 100 | 62 per 100 (49 to 74) | OR 0.36 | 228 | ⊕⊕⊕⊝ | see Figure 1 |
| Hospitalisations | 24 per 100 | 8 per 100 | OR 0.28 | 269 | ⊕⊕⊕⊝ | see Figure 2 |
| Mean dose of inhaled corticosteroids per person per day (BUD equivalent mcg/day) | The mean dose of inhaled corticosteroids per person per day in the intervention groups was | 316 | ⊕⊕⊝⊝ | |||
| Mean daily use of oral corticosteroids per person per day | See comment | See comment | Not estimable | 68 | Not estimable | |
| Yearly cost per person (USD) | See comment | See comment | Not estimable | 68 | Not estimable | |
| *The basis for the assumed risk is the mean of the two studies with a duration of one year. The corresponding risk (and its 95% confidence interval) is based on the assumed risk in the comparison group and the relative effect of the intervention (and its 95% CI). | ||||||
| GRADE Working Group grades of evidence | ||||||
| 1 One paper (Chlumsky 2006) was open labelled , but results were similar without this study. Our confidence in these results was downgraded by one point because of inconsistency in defining exacerbations 3The dose of inhaled steroids varied considerably within and between studies and results are compatible with both important reduction or decrease in dose of inhaled corticosteroids using sputum eosinophils. | ||||||
| Study | Exacerbation definition | Sputum eosinophil cut‐off (%) | Control arm | Study duration (months) |
| Cao 2007 | Unknown | Decrease ICS < 1 Keep same 1 to 3 Increase ICS > 3 | "Standard clinical guidelines" | 6 |
| Chlumsky 2006 | Doubling of the frequency of symptoms and/or number of puffs of rescue salbutamol and/or reduction in morning PEF by 30% or more on at least 2 consecutive days. A decrease in FEV₁ by > 30% at any study visit | Decrease ICS ≤ 3 Keep same 4 to 8 Increase ICS ≥ 8 | GINA guidelines | 18 |
| Fleming 2012 | Minor exacerbation: use of bronchodilators > 5 times/week (excl. routine or pre‐exercise) Major exacerbation: deterioration requiring high‐dose OCS (≥ 20 mg/day) for at least 2 days | Decrease ICS < 0.1 (or FeNO < 22 ppb) Keep same 0.1 to 2.5 (or FeNO 22 to 30 ppb) Increase ICS > 2.5 (or FeNO > 30 ppb) | Based on number of major exacerbations in preceding 3 months and SABA use in preceding 2 weeks | 12 |
| Green 2002 | Severe exacerbations: decrease in morning PEF > 30% on 2 or more consecutive days, or deterioration in symptoms needing OCS. | Decrease ICS < 1 Keep same 1 to 3 Increase ICS > 3 | BTS guidelines | 12 |
| Jayaram 2006 | Worsening of symptoms requiring increased use of SABA by ≥ 4 puffs/day for a minimum of 48 hours, or early morning wakening due to respiratory symptoms > 2 times/week, with or without reduction in FEV₁ of at least 20%. Severe exacerbation: course of OCS as determined by study investigator. | Decrease ICS ≤ 2 Increase ICS ≥ 2 | Canadian Asthma Consensus Group Guidelines | 24 |
| Malerba 2015 | Moderate exacerbation: requiring an unscheduled visit with a course of OCS. Severe exacerbation: hospital admission and requiring > 3 days OCS. | Sputum eosinophil (%) & FeNO (ppb) Decrease ICS < 2% & ≤ 10 pbb Keep same 2% to 3% & 11 to 20 ppb Increase ICS > 3% & ≥ 20 ppb | Symptom scores, use of SABA and night time symptoms | 24 |
| FeNO: exhaled nitric oxide; FEV₁: forced expiratory volume in one second; ICS: inhaled corticosteroids; OCS: oral corticosteroids; PEF: peak expiratory flow; ppb: parts per billion | ||||
| Outcome or subgroup title | No. of studies | No. of participants | Statistical method | Effect size |
| 1 Occurrence of any exacerbation Show forest plot | 4 | 269 | Rate Ratio (Random, 95% CI) | 0.57 [0.38, 0.86] |
| 1.1 Adults | 3 | 215 | Rate Ratio (Random, 95% CI) | 0.45 [0.24, 0.86] |
| 1.2 Children | 1 | 54 | Rate Ratio (Random, 95% CI) | 0.75 [0.54, 1.04] |
| 2 Number of participants who had one or more exacerbations over the study period Show forest plot | 4 | 269 | Odds Ratio (M‐H, Fixed, 95% CI) | 0.36 [0.21, 0.62] |
| 2.1 Adult | 3 | 215 | Odds Ratio (M‐H, Fixed, 95% CI) | 0.36 [0.20, 0.64] |
| 2.2 Children | 1 | 54 | Odds Ratio (M‐H, Fixed, 95% CI) | 0.39 [0.09, 1.71] |
| 3 Number of participants with exacerbations regarding hospitalisations over the study period Show forest plot | 4 | 269 | Odds Ratio (M‐H, Fixed, 95% CI) | 0.28 [0.09, 0.84] |
| 3.1 Adult | 3 | 215 | Odds Ratio (M‐H, Fixed, 95% CI) | 0.14 [0.02, 1.25] |
| 3.2 Children | 1 | 54 | Odds Ratio (M‐H, Fixed, 95% CI) | 0.38 [0.10, 1.45] |
| 4 Number of severe exacerbations requiring oral corticosteroids Show forest plot | 1 | Rate Ratio (Fixed, 95% CI) | Totals not selected | |
| 5 MIld exacerbations over study period Show forest plot | 2 | 150 | Rate Ratio (Fixed, 95% CI) | 0.82 [0.67, 1.00] |
| 6 Eosinophilic v Noneosinophilic exacerbations Show forest plot | 1 | Risk Ratio (Fixed, 95% CI) | Subtotals only | |
| 6.1 Eosinophilic Exacerbations | 1 | 2 | Risk Ratio (Fixed, 95% CI) | 0.28 [0.10, 0.76] |
| 6.2 Noneosinophilic Exacerbations | 1 | 2 | Risk Ratio (Fixed, 95% CI) | 1.07 [0.62, 1.85] |
| 7 Exacerbations subgrouped by asthma severity: Mild vs Severe Show forest plot | 1 | Rate Ratio (Fixed, 95% CI) | Subtotals only | |
| 7.1 Very mild to mild asthma | 1 | 2 | Rate Ratio (Fixed, 95% CI) | 1.34 [0.52, 3.43] |
| 7.2 Moderate to severe asthma | 1 | 2 | Rate Ratio (Fixed, 95% CI) | 0.63 [0.38, 1.04] |
| 8 Exacerbations subgrouped by asthma severity: Use of LABA Show forest plot | 1 | Rate Ratio (Fixed, 95% CI) | Subtotals only | |
| 8.1 On LABA | 1 | 2 | Rate Ratio (Fixed, 95% CI) | 0.53 [0.25, 1.14] |
| 8.2 Not on LABA | 1 | 2 | Rate Ratio (Fixed, 95% CI) | 1.05 [0.62, 1.78] |
| 9 Mean dose of inhaled corticosteroids per person per day (Bud equiv) Show forest plot | 5 | 316 | Mean Difference (Fixed, 95% CI) | 12.56 [‐127.92, 153.04] |
| 9.1 Adults | 4 | 262 | Mean Difference (Fixed, 95% CI) | 0.67 [‐154.39, 155.73] |
| 9.2 Children | 1 | 54 | Mean Difference (Fixed, 95% CI) | 67.0 [‐264.81, 398.81] |
| 10 Mean dose of oral corticosteroids per person per day Show forest plot | 1 | Mean Difference (Fixed, 95% CI) | Totals not selected | |
| 11 Yearly cost per person (USD) Show forest plot | 1 | Mean Difference (IV, Fixed, 95% CI) | Totals not selected | |