Scolaris Content Display Scolaris Content Display

Comparison 1 Artemether‐lumefantrine vs amodiaquine, Outcome 1 Total failure by day 28.
Figuras y tablas -
Analysis 1.1

Comparison 1 Artemether‐lumefantrine vs amodiaquine, Outcome 1 Total failure by day 28.

Comparison 1 Artemether‐lumefantrine vs amodiaquine, Outcome 2 Total failure by day 14.
Figuras y tablas -
Analysis 1.2

Comparison 1 Artemether‐lumefantrine vs amodiaquine, Outcome 2 Total failure by day 14.

Comparison 1 Artemether‐lumefantrine vs amodiaquine, Outcome 3 Gametocyte carriage on day 14.
Figuras y tablas -
Analysis 1.3

Comparison 1 Artemether‐lumefantrine vs amodiaquine, Outcome 3 Gametocyte carriage on day 14.

Comparison 2 Artemether‐lumefantrine vs chloroquine plus sulfadoxine‐pyrimethamine, Outcome 1 Total failure by day 28.
Figuras y tablas -
Analysis 2.1

Comparison 2 Artemether‐lumefantrine vs chloroquine plus sulfadoxine‐pyrimethamine, Outcome 1 Total failure by day 28.

Comparison 2 Artemether‐lumefantrine vs chloroquine plus sulfadoxine‐pyrimethamine, Outcome 2 Total failure by days 42, 14, and 7.
Figuras y tablas -
Analysis 2.2

Comparison 2 Artemether‐lumefantrine vs chloroquine plus sulfadoxine‐pyrimethamine, Outcome 2 Total failure by days 42, 14, and 7.

Comparison 2 Artemether‐lumefantrine vs chloroquine plus sulfadoxine‐pyrimethamine, Outcome 3 Gametocyte carriage on days 28, 14, and 7.
Figuras y tablas -
Analysis 2.3

Comparison 2 Artemether‐lumefantrine vs chloroquine plus sulfadoxine‐pyrimethamine, Outcome 3 Gametocyte carriage on days 28, 14, and 7.

Comparison 3 Artemether‐lumefantrine vs amodiaquine plus sulfadoxine‐pyrimethamine, Outcome 1 Total failure by day 28.
Figuras y tablas -
Analysis 3.1

Comparison 3 Artemether‐lumefantrine vs amodiaquine plus sulfadoxine‐pyrimethamine, Outcome 1 Total failure by day 28.

Comparison 3 Artemether‐lumefantrine vs amodiaquine plus sulfadoxine‐pyrimethamine, Outcome 2 Total failure by day 14.
Figuras y tablas -
Analysis 3.2

Comparison 3 Artemether‐lumefantrine vs amodiaquine plus sulfadoxine‐pyrimethamine, Outcome 2 Total failure by day 14.

Comparison 3 Artemether‐lumefantrine vs amodiaquine plus sulfadoxine‐pyrimethamine, Outcome 3 Gametocyte carriage on day 14.
Figuras y tablas -
Analysis 3.3

Comparison 3 Artemether‐lumefantrine vs amodiaquine plus sulfadoxine‐pyrimethamine, Outcome 3 Gametocyte carriage on day 14.

Comparison 4 Artemether‐lumefantrine vs amodiaquine plus artesunate, Outcome 1 Total failure by day 28.
Figuras y tablas -
Analysis 4.1

Comparison 4 Artemether‐lumefantrine vs amodiaquine plus artesunate, Outcome 1 Total failure by day 28.

Comparison 4 Artemether‐lumefantrine vs amodiaquine plus artesunate, Outcome 2 Total failure by day 14.
Figuras y tablas -
Analysis 4.2

Comparison 4 Artemether‐lumefantrine vs amodiaquine plus artesunate, Outcome 2 Total failure by day 14.

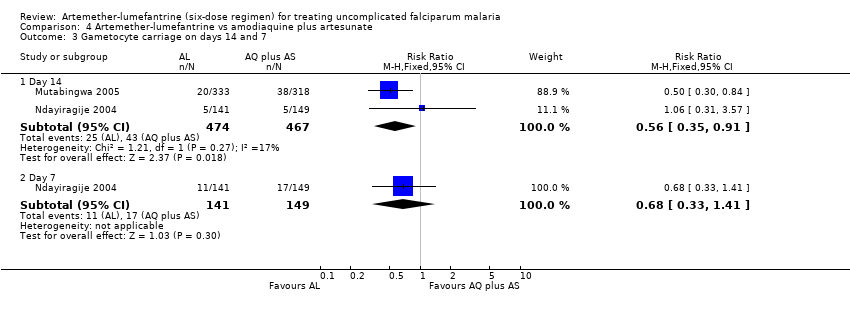
Comparison 4 Artemether‐lumefantrine vs amodiaquine plus artesunate, Outcome 3 Gametocyte carriage on days 14 and 7.
Figuras y tablas -
Analysis 4.3

Comparison 4 Artemether‐lumefantrine vs amodiaquine plus artesunate, Outcome 3 Gametocyte carriage on days 14 and 7.

Comparison 5 Artemether‐lumefantrine vs mefloquine plus artesunate, Outcome 1 Total failure by day 28.
Figuras y tablas -
Analysis 5.1

Comparison 5 Artemether‐lumefantrine vs mefloquine plus artesunate, Outcome 1 Total failure by day 28.

Comparison 5 Artemether‐lumefantrine vs mefloquine plus artesunate, Outcome 2 Total failure by day 28: PCR adjusted.
Figuras y tablas -
Analysis 5.2

Comparison 5 Artemether‐lumefantrine vs mefloquine plus artesunate, Outcome 2 Total failure by day 28: PCR adjusted.

Comparison 5 Artemether‐lumefantrine vs mefloquine plus artesunate, Outcome 3 Total failure by day 42.
Figuras y tablas -
Analysis 5.3

Comparison 5 Artemether‐lumefantrine vs mefloquine plus artesunate, Outcome 3 Total failure by day 42.

Comparison 5 Artemether‐lumefantrine vs mefloquine plus artesunate, Outcome 4 Total failure by day 42: PCR adjusted.
Figuras y tablas -
Analysis 5.4

Comparison 5 Artemether‐lumefantrine vs mefloquine plus artesunate, Outcome 4 Total failure by day 42: PCR adjusted.

Comparison 5 Artemether‐lumefantrine vs mefloquine plus artesunate, Outcome 5 Gametocyte carriage on day 7 and in first 72 h.
Figuras y tablas -
Analysis 5.5

Comparison 5 Artemether‐lumefantrine vs mefloquine plus artesunate, Outcome 5 Gametocyte carriage on day 7 and in first 72 h.

Comparison 6 Artemether‐lumefantrine vs dihydroartemisinin‐napthoquine‐trimethoprim (DNP), Outcome 1 Total failure by day 28.
Figuras y tablas -
Analysis 6.1

Comparison 6 Artemether‐lumefantrine vs dihydroartemisinin‐napthoquine‐trimethoprim (DNP), Outcome 1 Total failure by day 28.

Comparison 7 Artemether‐lumefantrine: supervised vs unsupervised treatment, Outcome 1 Total failure by day 28.
Figuras y tablas -
Analysis 7.1

Comparison 7 Artemether‐lumefantrine: supervised vs unsupervised treatment, Outcome 1 Total failure by day 28.

Table 1. Risk of bias of each included studya

Study

Allocation sequence generation

Allocation concealment

Blinding

Inclusionb

Krudsood 2003

Not described

Not described

No

Inadequate

Lefevre 2001

Not described

Not described

No

Adequate

Mayxay 2004

Not described

Adequate

No

Adequate

Mutabingwa 2005

Adequate

Adequate

No

Adequate

Ndayiragije 2004

Not described

Not described

No

Adequate

Piola 2005

Adequate

Adequate

No

Adequate

Stohrer 2004

Not described

Adequate

No

Adequate

Sutherland 2005

Not described

Adequate

Single

Inadequate

Van Vugt 2000

Not described

Adequate

No

Inadequate

aInclusion of all randomized participants in the analysis; see the 'Methods of the review' for the assessment methods, and the 'Characteristics of included studies' for the methods used in each trial.

Figuras y tablas -
Table 1. Risk of bias of each included studya
Comparison 1. Artemether‐lumefantrine vs amodiaquine

Outcome or subgroup title

No. of studies

No. of participants

Statistical method

Effect size

1 Total failure by day 28 Show forest plot

1

Risk Ratio (M‐H, Fixed, 95% CI)

Totals not selected

2 Total failure by day 14 Show forest plot

1

Risk Ratio (M‐H, Fixed, 95% CI)

Totals not selected

3 Gametocyte carriage on day 14 Show forest plot

1

Risk Ratio (M‐H, Fixed, 95% CI)

Totals not selected

Figuras y tablas -
Comparison 1. Artemether‐lumefantrine vs amodiaquine
Comparison 2. Artemether‐lumefantrine vs chloroquine plus sulfadoxine‐pyrimethamine

Outcome or subgroup title

No. of studies

No. of participants

Statistical method

Effect size

1 Total failure by day 28 Show forest plot

1

Risk Ratio (M‐H, Fixed, 95% CI)

Totals not selected

2 Total failure by days 42, 14, and 7 Show forest plot

2

Risk Ratio (M‐H, Fixed, 95% CI)

Totals not selected

2.1 Day 42

1

Risk Ratio (M‐H, Fixed, 95% CI)

0.0 [0.0, 0.0]

2.2 Day 14

1

Risk Ratio (M‐H, Fixed, 95% CI)

0.0 [0.0, 0.0]

2.3 Day 7

1

Risk Ratio (M‐H, Fixed, 95% CI)

0.0 [0.0, 0.0]

3 Gametocyte carriage on days 28, 14, and 7 Show forest plot

1

Risk Ratio (M‐H, Fixed, 95% CI)

Totals not selected

3.1 Day 28

1

Risk Ratio (M‐H, Fixed, 95% CI)

0.0 [0.0, 0.0]

3.2 Day 14

1

Risk Ratio (M‐H, Fixed, 95% CI)

0.0 [0.0, 0.0]

3.3 Day 7

1

Risk Ratio (M‐H, Fixed, 95% CI)

0.0 [0.0, 0.0]

Figuras y tablas -
Comparison 2. Artemether‐lumefantrine vs chloroquine plus sulfadoxine‐pyrimethamine
Comparison 3. Artemether‐lumefantrine vs amodiaquine plus sulfadoxine‐pyrimethamine

Outcome or subgroup title

No. of studies

No. of participants

Statistical method

Effect size

1 Total failure by day 28 Show forest plot

1

Risk Ratio (M‐H, Fixed, 95% CI)

Totals not selected

2 Total failure by day 14 Show forest plot

1

Risk Ratio (M‐H, Fixed, 95% CI)

Totals not selected

3 Gametocyte carriage on day 14 Show forest plot

1

Risk Ratio (M‐H, Fixed, 95% CI)

Totals not selected

Figuras y tablas -
Comparison 3. Artemether‐lumefantrine vs amodiaquine plus sulfadoxine‐pyrimethamine
Comparison 4. Artemether‐lumefantrine vs amodiaquine plus artesunate

Outcome or subgroup title

No. of studies

No. of participants

Statistical method

Effect size

1 Total failure by day 28 Show forest plot

1

Risk Ratio (M‐H, Fixed, 95% CI)

Totals not selected

2 Total failure by day 14 Show forest plot

2

1283

Risk Ratio (M‐H, Fixed, 95% CI)

0.11 [0.05, 0.23]

3 Gametocyte carriage on days 14 and 7 Show forest plot

2

Risk Ratio (M‐H, Fixed, 95% CI)

Subtotals only

3.1 Day 14

2

941

Risk Ratio (M‐H, Fixed, 95% CI)

0.56 [0.35, 0.91]

3.2 Day 7

1

290

Risk Ratio (M‐H, Fixed, 95% CI)

0.68 [0.33, 1.41]

Figuras y tablas -
Comparison 4. Artemether‐lumefantrine vs amodiaquine plus artesunate
Comparison 5. Artemether‐lumefantrine vs mefloquine plus artesunate

Outcome or subgroup title

No. of studies

No. of participants

Statistical method

Effect size

1 Total failure by day 28 Show forest plot

2

389

Risk Ratio (M‐H, Fixed, 95% CI)

4.20 [0.55, 31.93]

2 Total failure by day 28: PCR adjusted Show forest plot

2

Risk Ratio (M‐H, Fixed, 95% CI)

Subtotals only

2.1 Adjusted for new infections

2

389

Risk Ratio (M‐H, Fixed, 95% CI)

3.50 [0.45, 27.03]

2.2 Not adjusted for new infections

2

389

Risk Ratio (M‐H, Fixed, 95% CI)

4.20 [0.55, 31.93]

3 Total failure by day 42 Show forest plot

2

315

Risk Ratio (M‐H, Fixed, 95% CI)

2.93 [1.48, 5.80]

4 Total failure by day 42: PCR adjusted Show forest plot

1

Risk Ratio (M‐H, Fixed, 95% CI)

Totals not selected

4.1 AL vs. mefloquine plus artesunate, adjusted for new infections

1

Risk Ratio (M‐H, Fixed, 95% CI)

0.0 [0.0, 0.0]

4.2 AL vs. mefloquine plus artesunate, not adjusted for new infections

1

Risk Ratio (M‐H, Fixed, 95% CI)

0.0 [0.0, 0.0]

5 Gametocyte carriage on day 7 and in first 72 h Show forest plot

3

Risk Ratio (M‐H, Fixed, 95% CI)

Subtotals only

5.1 Day 7

1

100

Risk Ratio (M‐H, Fixed, 95% CI)

1.35 [0.44, 4.15]

5.2 72 h

2

240

Risk Ratio (M‐H, Fixed, 95% CI)

1.09 [0.58, 2.06]

Figuras y tablas -
Comparison 5. Artemether‐lumefantrine vs mefloquine plus artesunate
Comparison 6. Artemether‐lumefantrine vs dihydroartemisinin‐napthoquine‐trimethoprim (DNP)

Outcome or subgroup title

No. of studies

No. of participants

Statistical method

Effect size

1 Total failure by day 28 Show forest plot

1

Risk Ratio (M‐H, Fixed, 95% CI)

Subtotals only

Figuras y tablas -
Comparison 6. Artemether‐lumefantrine vs dihydroartemisinin‐napthoquine‐trimethoprim (DNP)
Comparison 7. Artemether‐lumefantrine: supervised vs unsupervised treatment

Outcome or subgroup title

No. of studies

No. of participants

Statistical method

Effect size

1 Total failure by day 28 Show forest plot

1

Risk Ratio (M‐H, Fixed, 95% CI)

Totals not selected

Figuras y tablas -
Comparison 7. Artemether‐lumefantrine: supervised vs unsupervised treatment