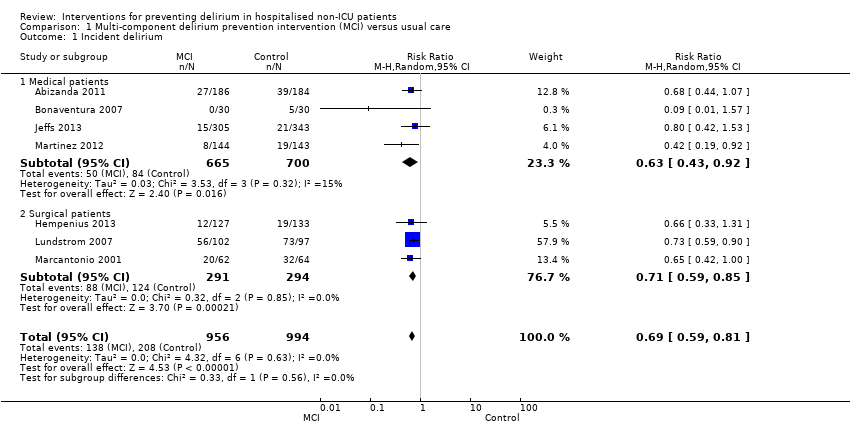
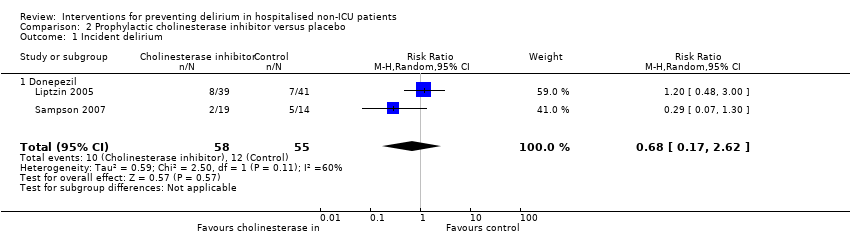
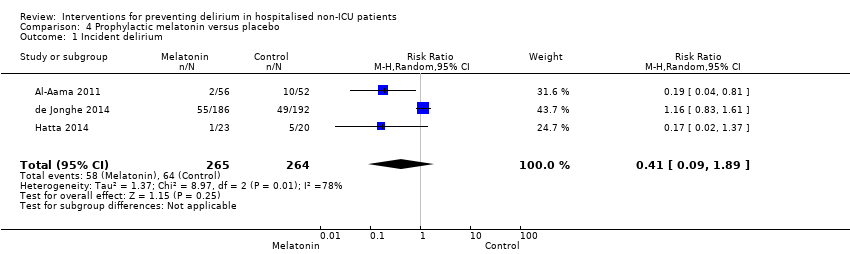
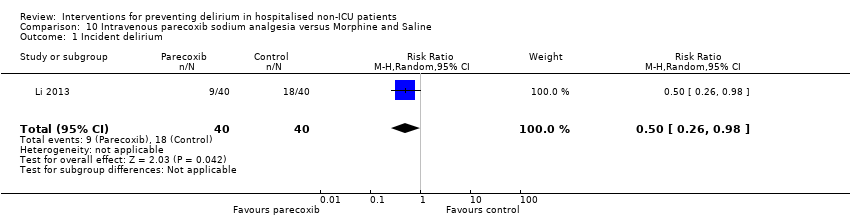
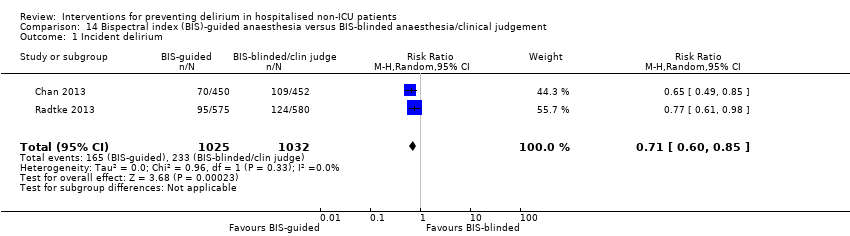
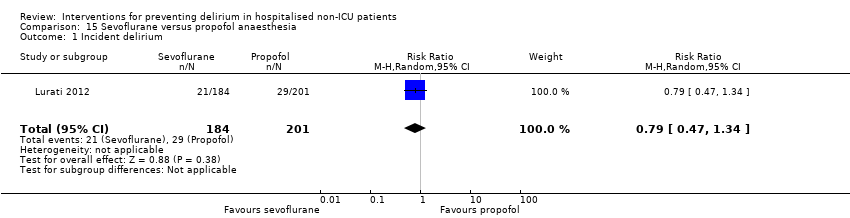
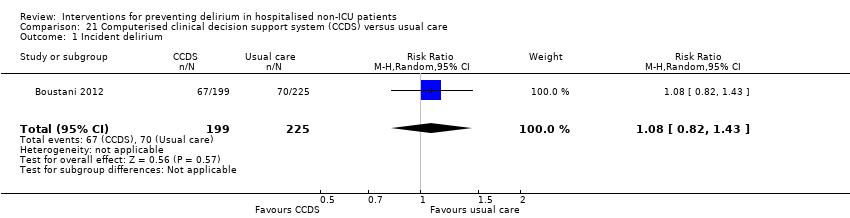
| 1 Incident delirium Show forest plot | 7 | 1950 | Risk Ratio (M‐H, Random, 95% CI) | 0.69 [0.59, 0.81] |
|
| 1.1 Medical patients | 4 | 1365 | Risk Ratio (M‐H, Random, 95% CI) | 0.63 [0.43, 0.92] |
| 1.2 Surgical patients | 3 | 585 | Risk Ratio (M‐H, Random, 95% CI) | 0.71 [0.59, 0.85] |
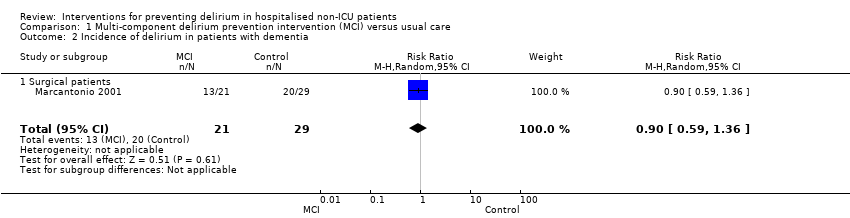
| 2 Incidence of delirium in patients with dementia Show forest plot | 1 | 50 | Risk Ratio (M‐H, Random, 95% CI) | 0.90 [0.59, 1.36] |
|
| 2.1 Surgical patients | 1 | 50 | Risk Ratio (M‐H, Random, 95% CI) | 0.90 [0.59, 1.36] |
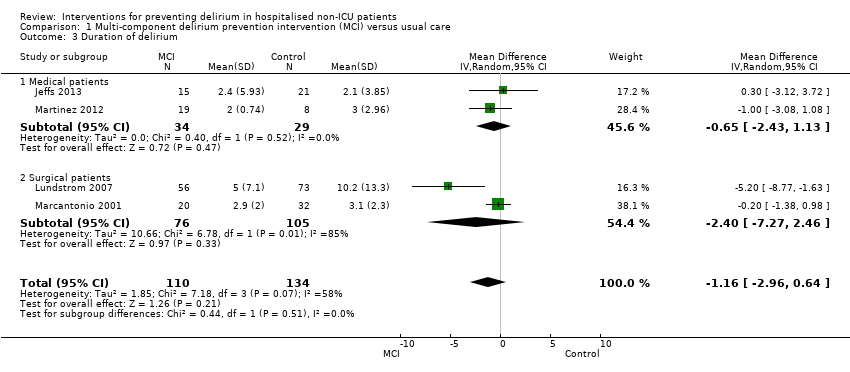
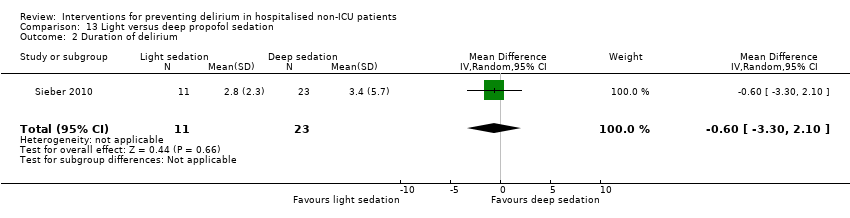
| 3 Duration of delirium Show forest plot | 4 | 244 | Mean Difference (IV, Random, 95% CI) | ‐1.16 [‐2.96, 0.64] |
|
| 3.1 Medical patients | 2 | 63 | Mean Difference (IV, Random, 95% CI) | ‐0.65 [‐2.43, 1.13] |
| 3.2 Surgical patients | 2 | 181 | Mean Difference (IV, Random, 95% CI) | ‐2.40 [‐7.27, 2.46] |
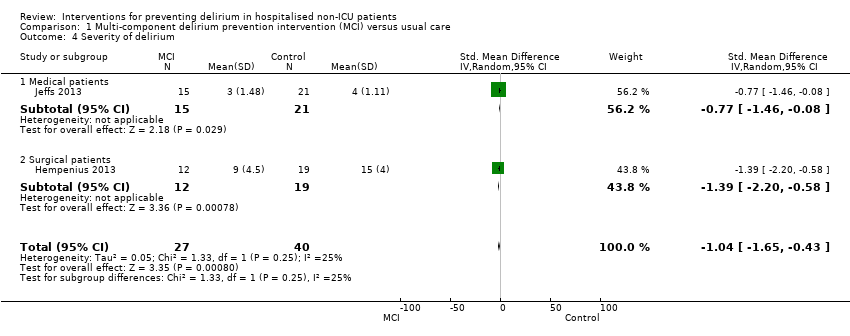
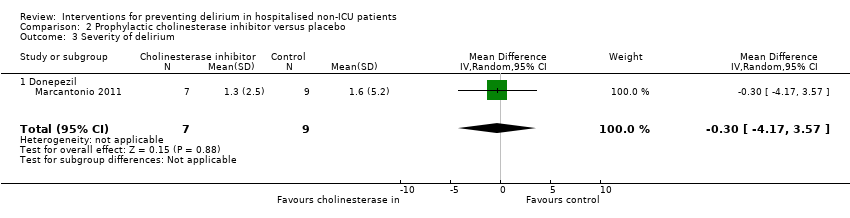
| 4 Severity of delirium Show forest plot | 2 | 67 | Std. Mean Difference (IV, Random, 95% CI) | ‐1.04 [‐1.65, ‐0.43] |
|
| 4.1 Medical patients | 1 | 36 | Std. Mean Difference (IV, Random, 95% CI) | ‐0.77 [‐1.46, ‐0.08] |
| 4.2 Surgical patients | 1 | 31 | Std. Mean Difference (IV, Random, 95% CI) | ‐1.39 [‐2.20, ‐0.58] |
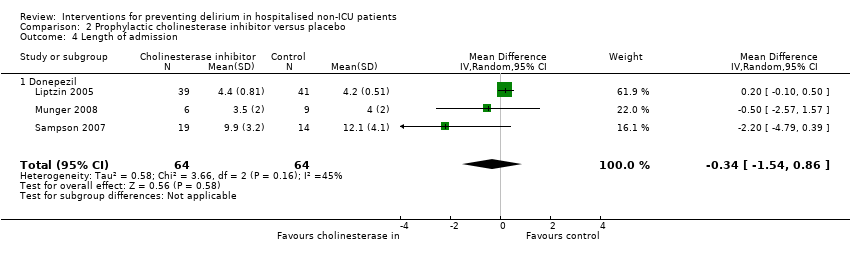
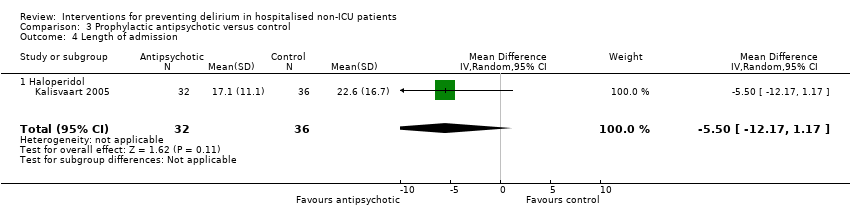
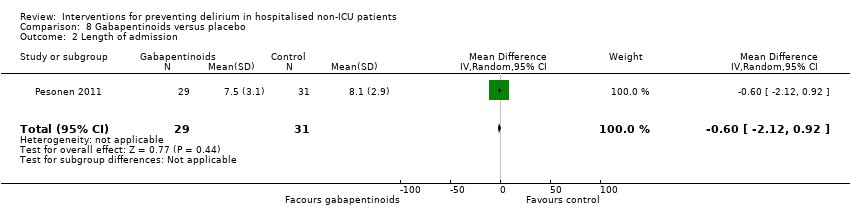
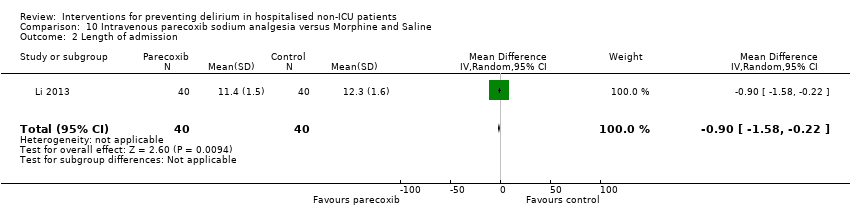
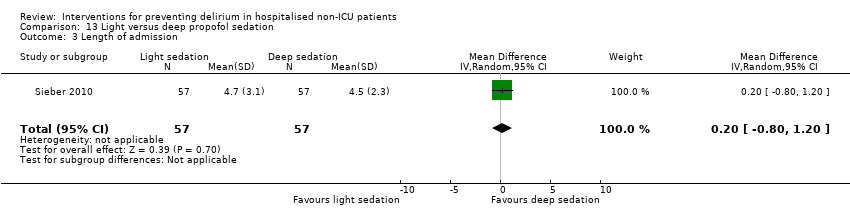
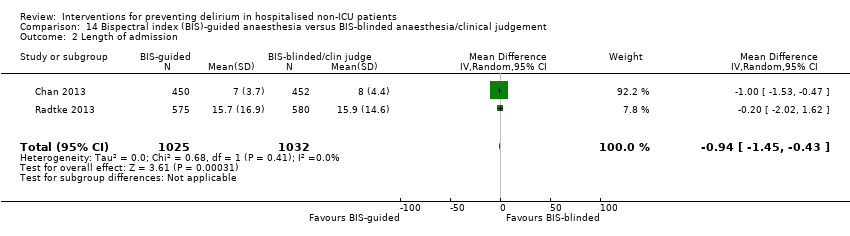
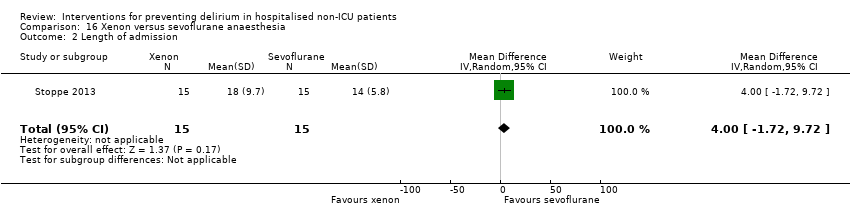
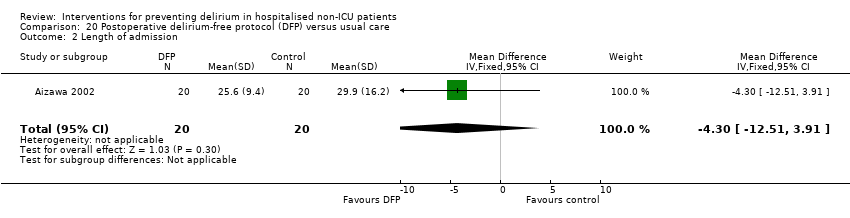
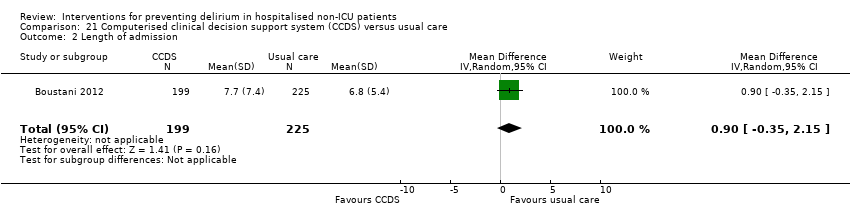
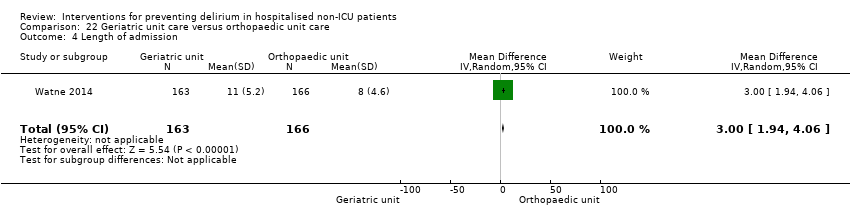
| 5 Length of admission Show forest plot | 6 | 1920 | Mean Difference (IV, Random, 95% CI) | 0.01 [‐0.48, 0.51] |
|
| 5.1 Medical patients | 3 | 1335 | Mean Difference (IV, Random, 95% CI) | 0.04 [‐0.44, 0.52] |
| 5.2 Surgical patients | 3 | 585 | Mean Difference (IV, Random, 95% CI) | ‐1.24 [‐4.74, 2.25] |
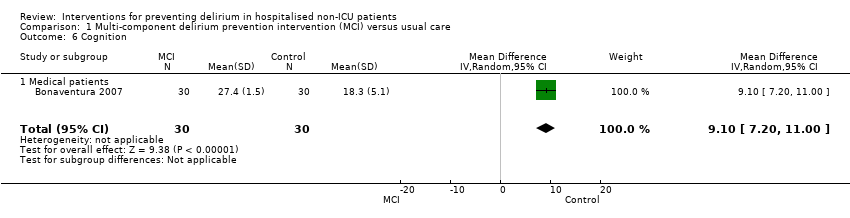
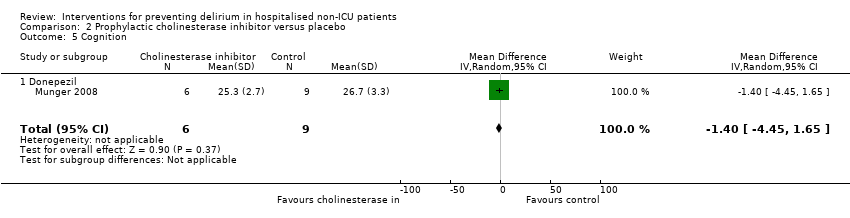
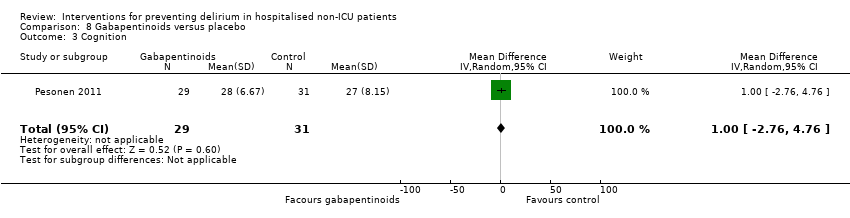
| 6 Cognition Show forest plot | 1 | 60 | Mean Difference (IV, Random, 95% CI) | 9.10 [7.20, 11.00] |
|
| 6.1 Medical patients | 1 | 60 | Mean Difference (IV, Random, 95% CI) | 9.10 [7.20, 11.00] |
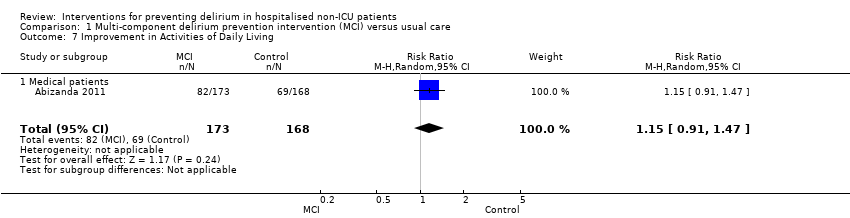
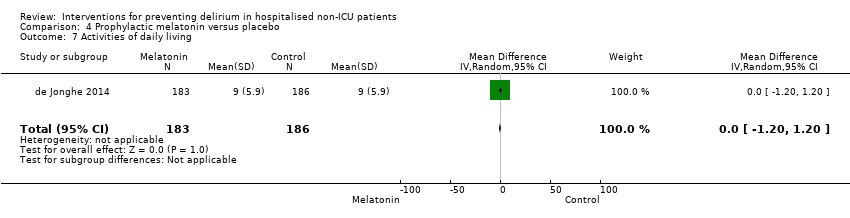
| 7 Improvement in Activities of Daily Living Show forest plot | 1 | 341 | Risk Ratio (M‐H, Random, 95% CI) | 1.15 [0.91, 1.47] |
|
| 7.1 Medical patients | 1 | 341 | Risk Ratio (M‐H, Random, 95% CI) | 1.15 [0.91, 1.47] |
| 8 Return to independent living Show forest plot | 4 | 1116 | Risk Ratio (M‐H, Random, 95% CI) | 0.95 [0.85, 1.06] |
|
| 8.1 Medical patients | 1 | 648 | Risk Ratio (M‐H, Random, 95% CI) | 0.96 [0.88, 1.06] |
| 8.2 Surgical patients | 3 | 468 | Risk Ratio (M‐H, Random, 95% CI) | 0.94 [0.75, 1.19] |
| 9 Depression Show forest plot | 1 | 149 | Mean Difference (IV, Random, 95% CI) | 0.70 [‐0.44, 1.84] |
|
| 9.1 Surgical patients | 1 | 149 | Mean Difference (IV, Random, 95% CI) | 0.70 [‐0.44, 1.84] |
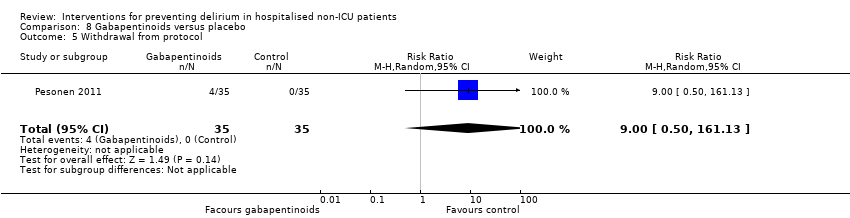
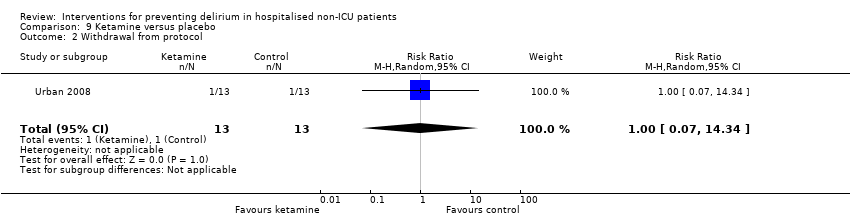
| 10 Withdrawal from protocol Show forest plot | 1 | 126 | Risk Ratio (M‐H, Random, 95% CI) | 0.0 [0.0, 0.0] |
|
| 10.1 Surgical patients | 1 | 126 | Risk Ratio (M‐H, Random, 95% CI) | 0.0 [0.0, 0.0] |
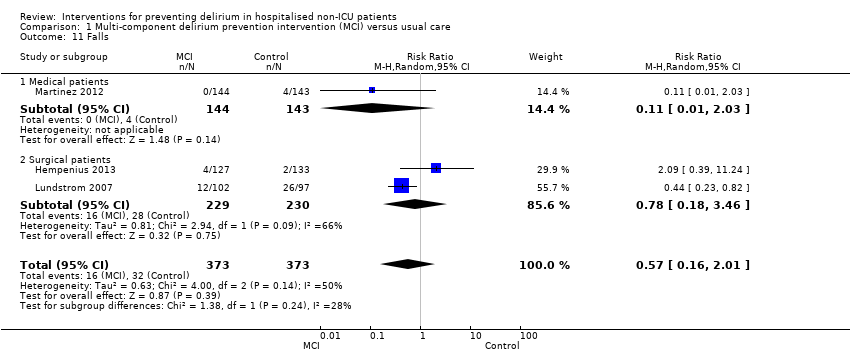
| 11 Falls Show forest plot | 3 | 746 | Risk Ratio (M‐H, Random, 95% CI) | 0.57 [0.16, 2.01] |
|
| 11.1 Medical patients | 1 | 287 | Risk Ratio (M‐H, Random, 95% CI) | 0.11 [0.01, 2.03] |
| 11.2 Surgical patients | 2 | 459 | Risk Ratio (M‐H, Random, 95% CI) | 0.78 [0.18, 3.46] |
| 12 Pressure ulcers Show forest plot | 2 | 457 | Risk Ratio (M‐H, Random, 95% CI) | 0.48 [0.26, 0.89] |
|
| 12.1 Surgical patients | 2 | 457 | Risk Ratio (M‐H, Random, 95% CI) | 0.48 [0.26, 0.89] |
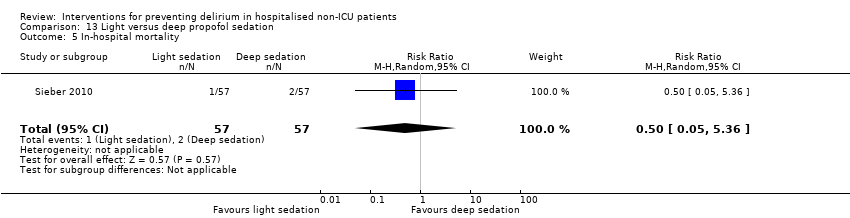
| 13 Inpatient mortality Show forest plot | 3 | 859 | Risk Ratio (M‐H, Fixed, 95% CI) | 0.90 [0.56, 1.43] |
|
| 13.1 Medical patients | 1 | 400 | Risk Ratio (M‐H, Fixed, 95% CI) | 0.64 [0.34, 1.18] |
| 13.2 Surgical patients | 2 | 459 | Risk Ratio (M‐H, Fixed, 95% CI) | 1.45 [0.69, 3.05] |
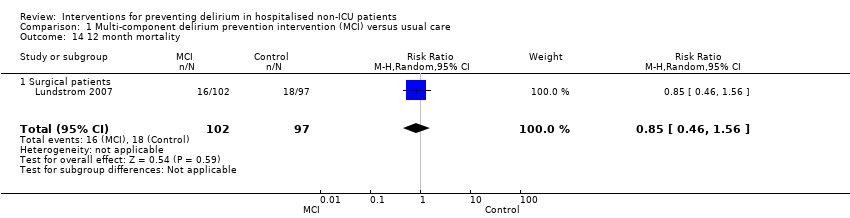
| 14 12 month mortality Show forest plot | 1 | 199 | Risk Ratio (M‐H, Random, 95% CI) | 0.85 [0.46, 1.56] |
|
| 14.1 Surgical patients | 1 | 199 | Risk Ratio (M‐H, Random, 95% CI) | 0.85 [0.46, 1.56] |
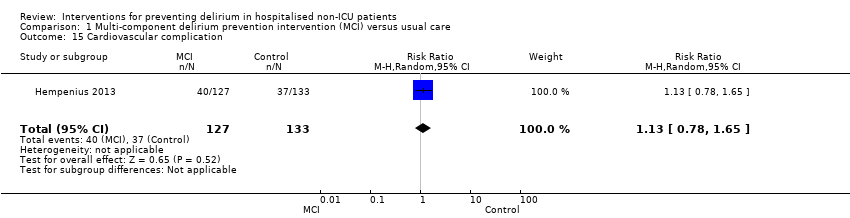
| 15 Cardiovascular complication Show forest plot | 1 | 260 | Risk Ratio (M‐H, Random, 95% CI) | 1.13 [0.78, 1.65] |
|
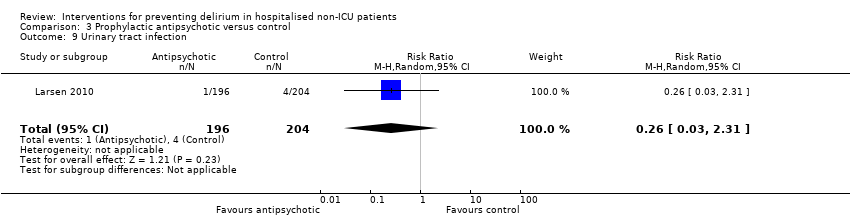
| 16 Urinary tract infection Show forest plot | 1 | 260 | Risk Ratio (M‐H, Random, 95% CI) | 1.20 [0.45, 3.20] |
|
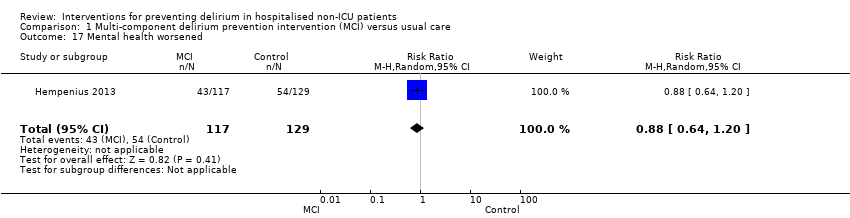
| 17 Mental health worsened Show forest plot | 1 | 246 | Risk Ratio (M‐H, Random, 95% CI) | 0.88 [0.64, 1.20] |
|