| 1 # patients with exacerbations requiring systemic steroids Show forest plot | 17 | 4027 | Risk Ratio (M‐H, Fixed, 95% CI) | 0.81 [0.73, 0.90] |
|
| 1.1 Mean baseline FEV 1 >/= 80% of predicted | 7 | 1510 | Risk Ratio (M‐H, Fixed, 95% CI) | 0.70 [0.56, 0.86] |
| 1.2 Mean baseline FEV1 61‐79% of predicted | 9 | 2186 | Risk Ratio (M‐H, Fixed, 95% CI) | 0.83 [0.72, 0.97] |
| 1.3 Mean baseline FEV 1 not reported | 1 | 331 | Risk Ratio (M‐H, Fixed, 95% CI) | 0.92 [0.79, 1.07] |
| 2 # patients with exacerbations requiring hospitalisation Show forest plot | 11 | 4162 | Risk Ratio (M‐H, Fixed, 95% CI) | 0.81 [0.50, 1.33] |
|
| 2.1 Mean baseline FEV 1 >/= 80% of predicted | 2 | 139 | Risk Ratio (M‐H, Fixed, 95% CI) | 0.99 [0.18, 5.39] |
| 2.2 Mean baseline FEV 1 61‐79% of predicted | 7 | 2781 | Risk Ratio (M‐H, Fixed, 95% CI) | 1.06 [0.58, 1.96] |
| 2.3 Mean baseline FEV 1 not reported | 2 | 1242 | Risk Ratio (M‐H, Fixed, 95% CI) | 0.39 [0.14, 1.08] |
| 3 FEV1 (L) at endpoint Show forest plot | 6 | 914 | Mean Difference (IV, Fixed, 95% CI) | 0.15 [0.07, 0.22] |
|
| 3.1 Mean Baseline FEV1 >/‐80% of predicted | 0 | 0 | Mean Difference (IV, Fixed, 95% CI) | 0.0 [0.0, 0.0] |
| 3.2 Mean baseline FEV 1 61‐79% of predicted | 6 | 914 | Mean Difference (IV, Fixed, 95% CI) | 0.15 [0.07, 0.22] |
| 4 Change in FEV1 at endpoint (L) stratifying on baseline FEV1 Show forest plot | 9 | 1847 | Mean Difference (IV, Random, 95% CI) | 0.17 [0.11, 0.24] |
|
| 4.1 Mean baseline FEV1 >=80% of predicted | 1 | 21 | Mean Difference (IV, Random, 95% CI) | 0.42 [0.21, 0.63] |
| 4.2 Mean baseline FEV1 61‐79% of predicted | 8 | 1826 | Mean Difference (IV, Random, 95% CI) | 0.16 [0.10, 0.22] |
| 5 Change in FEV1 at endpoint (% predicted) stratifying on baseline FEV1 Show forest plot | 4 | 1428 | Mean Difference (IV, Fixed, 95% CI) | 2.79 [1.89, 3.69] |
|
| 5.1 Mean baseline FEV1 >/= 80 % predicted | 4 | 1428 | Mean Difference (IV, Fixed, 95% CI) | 2.79 [1.89, 3.69] |
| 6 FEV1 % predicted at endpoint Show forest plot | 3 | 881 | Mean Difference (IV, Fixed, 95% CI) | 5.93 [3.74, 8.11] |
|
| 6.1 Mean Baseline FEV1 >‐80% of predicted | 1 | 29 | Mean Difference (IV, Fixed, 95% CI) | 6.25 [‐2.58, 15.08] |
| 6.2 Mean Baseline FEV1 61‐79% of predicted | 2 | 852 | Mean Difference (IV, Fixed, 95% CI) | 5.90 [3.65, 8.16] |
| 7 Change in FEV1 (L or % pred )stratifying on trial duration Show forest plot | 13 | 3926 | Std. Mean Difference (IV, Random, 95% CI) | 0.35 [0.28, 0.42] |
|
| 7.1 Change in FEV1 (L) or (% predicted) at 6 +/‐ 2 weeks of treatment | 2 | 299 | Std. Mean Difference (IV, Random, 95% CI) | 0.41 [0.18, 0.64] |
| 7.2 Change in FEV1 (L) or (% predicted) at 12 +/‐ 4 weeks of treatment | 11 | 2003 | Std. Mean Difference (IV, Random, 95% CI) | 0.36 [0.24, 0.49] |
| 7.3 Change in FEV1 (L) or (% predicted) at 24 +/‐ 4 weeks of treatment | 2 | 352 | Std. Mean Difference (IV, Random, 95% CI) | 0.30 [0.09, 0.51] |
| 7.4 Change in FEV1 (L) or (% predicted) at 52 +/‐ 4 weeks of treatment | 2 | 1272 | Std. Mean Difference (IV, Random, 95% CI) | 0.32 [0.21, 0.43] |
| 8 Morning PEF (L/min) at endpoint Show forest plot | 6 | 1156 | Mean Difference (IV, Random, 95% CI) | 22.62 [4.34, 40.90] |
|
| 8.1 Mean baseline FEV1 >/= 80% | 1 | 29 | Mean Difference (IV, Random, 95% CI) | 86.0 [17.11, 154.89] |
| 8.4 Mean baseline FEV1 61‐79% of predicted | 5 | 1127 | Mean Difference (IV, Random, 95% CI) | 19.14 [2.93, 35.34] |
| 9 Change in morning PEF (L/min) at endpoint stratifying on baseline FEV1 Show forest plot | 17 | 4885 | Mean Difference (IV, Random, 95% CI) | 23.28 [18.38, 28.18] |
|
| 9.1 Mean Baseline FEV1 >/= 80% of predicted | 4 | 1410 | Mean Difference (IV, Random, 95% CI) | 14.76 [7.47, 22.04] |
| 9.2 Mean Baseline FEV1 61‐79% of predicted | 12 | 3144 | Mean Difference (IV, Random, 95% CI) | 25.46 [19.47, 31.44] |
| 9.4 Mean Baseline FEV1 not reported | 1 | 331 | Mean Difference (IV, Random, 95% CI) | 24.30 [15.04, 33.56] |
| 10 Evening PEF (L/min) at endpoint Show forest plot | 1 | | Mean Difference (IV, Fixed, 95% CI) | Totals not selected |
|
| 10.1 Mean baseline FEV1 61‐79% of predicted | 1 | | Mean Difference (IV, Fixed, 95% CI) | 0.0 [0.0, 0.0] |
| 11 Change in evening PEF (L/min) at endpoint Show forest plot | 9 | 2230 | Mean Difference (IV, Random, 95% CI) | 21.33 [14.53, 28.12] |
|
| 11.1 Mean baseline FEV1 61‐79% of predicted | 8 | 2209 | Mean Difference (IV, Random, 95% CI) | 19.93 [14.09, 25.77] |
| 11.2 Mean baseline FEV1 > /= 80% of predicted | 1 | 21 | Mean Difference (IV, Random, 95% CI) | 90.0 [39.82, 140.18] |
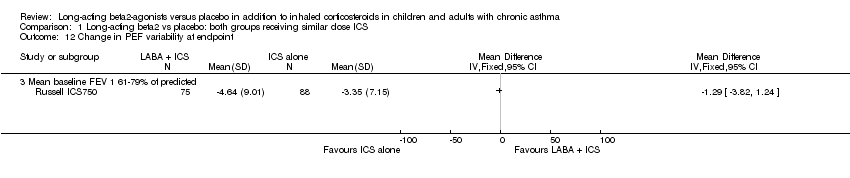
| 12 Change in PEF variability at endpoint Show forest plot | 1 | | Mean Difference (IV, Fixed, 95% CI) | Totals not selected |
|
| 12.3 Mean baseline FEV 1 61‐79% of predicted | 1 | | Mean Difference (IV, Fixed, 95% CI) | 0.0 [0.0, 0.0] |
| 13 Change in daytime symptom score at endpoint Show forest plot | 5 | 1371 | Std. Mean Difference (IV, Fixed, 95% CI) | ‐0.34 [‐0.44, ‐0.23] |
|
| 13.3 Mean baseline FEV1 61‐79% of predicted | 5 | 1371 | Std. Mean Difference (IV, Fixed, 95% CI) | ‐0.34 [‐0.44, ‐0.23] |
| 14 Change in nightime symptom score at endpoint Show forest plot | 2 | 922 | Std. Mean Difference (IV, Fixed, 95% CI) | ‐0.18 [‐0.31, ‐0.05] |
|
| 14.1 Mean baseline FEV 1 61‐79% of predicted | 2 | 922 | Std. Mean Difference (IV, Fixed, 95% CI) | ‐0.18 [‐0.31, ‐0.05] |
| 15 Change in 24 hour symptom score at endpoint Show forest plot | 2 | 362 | Mean Difference (IV, Fixed, 95% CI) | ‐0.28 [‐0.45, ‐0.11] |
|
| 15.1 Mean baseline FEV 1 61‐79% of predicted | 2 | 362 | Mean Difference (IV, Fixed, 95% CI) | ‐0.28 [‐0.45, ‐0.11] |
| 16 % symptom‐free days Show forest plot | 4 | 1678 | Std. Mean Difference (IV, Random, 95% CI) | 0.32 [0.02, 0.62] |
|
| 16.1 Mean baseline FEV1 61‐79% of predicted | 3 | 1051 | Std. Mean Difference (IV, Random, 95% CI) | 0.37 [‐0.04, 0.78] |
| 16.2 Mean baseline FEV1 >/=80% of predicted | 1 | 627 | Std. Mean Difference (IV, Random, 95% CI) | 0.18 [0.03, 0.34] |
| 17 Change in % symptom‐free days at endpoint Show forest plot | 6 | 1317 | Mean Difference (IV, Random, 95% CI) | 17.21 [12.06, 22.36] |
|
| 17.1 Mean baseline FEV 1 >/=80% of predicted | 0 | 0 | Mean Difference (IV, Random, 95% CI) | 0.0 [0.0, 0.0] |
| 17.2 Mean baseline FEV 1 61‐79% of predicted | 6 | 1317 | Mean Difference (IV, Random, 95% CI) | 17.21 [12.06, 22.36] |
| 18 % symptom‐free nights at 12 +/‐ 4 weeks Show forest plot | 1 | | Mean Difference (IV, Fixed, 95% CI) | Totals not selected |
|
| 18.1 Mean baseline FEV 1 61‐79% of predicted | 1 | | Mean Difference (IV, Fixed, 95% CI) | 0.0 [0.0, 0.0] |
| 19 Change in % symptom‐free nights at endpoint Show forest plot | 4 | 1052 | Std. Mean Difference (IV, Random, 95% CI) | 0.51 [0.28, 0.74] |
|
| 19.1 Mean baseline FEV 1 61‐79% of predicted | 4 | 1052 | Std. Mean Difference (IV, Random, 95% CI) | 0.51 [0.28, 0.74] |
| 20 Change in Asthma Control days % @ 12 +/‐ 4 weeks Show forest plot | 2 | 362 | Mean Difference (IV, Fixed, 95% CI) | 15.61 [8.51, 22.70] |
|
| 20.1 Mean baseline FEV 1 61‐79% of predicted | 2 | 362 | Mean Difference (IV, Fixed, 95% CI) | 15.61 [8.51, 22.70] |
| 21 # daytime rescue inhalations (puffs per day) at endpoint Show forest plot | 2 | 277 | Mean Difference (IV, Random, 95% CI) | ‐0.73 [‐1.24, ‐0.22] |
|
| 21.1 Mean baseline FEV 1 61‐79% of predicted | 2 | 277 | Mean Difference (IV, Random, 95% CI) | ‐0.73 [‐1.24, ‐0.22] |
| 22 Change in # daytime rescue inhalations (puffs per day) at endpoint Show forest plot | 9 | 3003 | Mean Difference (IV, Random, 95% CI) | ‐0.82 [‐1.17, ‐0.47] |
|
| 22.1 Mean baseline FEV 1 61‐79% of predicted | 9 | 3003 | Mean Difference (IV, Random, 95% CI) | ‐0.82 [‐1.17, ‐0.47] |
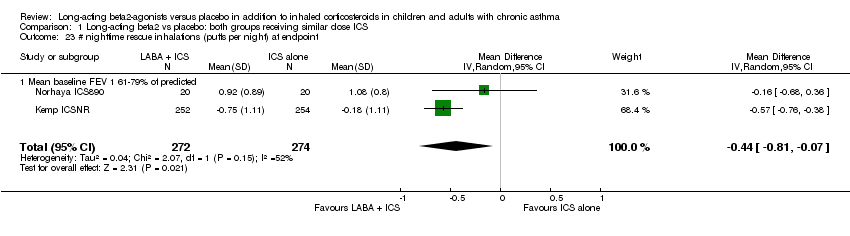
| 23 # nighttime rescue inhalations (puffs per night) at endpoint Show forest plot | 2 | 546 | Mean Difference (IV, Random, 95% CI) | ‐0.44 [‐0.81, ‐0.07] |
|
| 23.1 Mean baseline FEV 1 61‐79% of predicted | 2 | 546 | Mean Difference (IV, Random, 95% CI) | ‐0.44 [‐0.81, ‐0.07] |
| 24 Change in # nighttime rescue inhalations at endpoint Show forest plot | 6 | 2051 | Mean Difference (IV, Random, 95% CI) | ‐0.33 [‐0.57, ‐0.10] |
|
| 24.3 Mean baseline FEV1 61‐79% of predicted | 6 | 2051 | Mean Difference (IV, Random, 95% CI) | ‐0.33 [‐0.57, ‐0.10] |
| 25 Change in # overall daily rescue inhalations at endpoint Show forest plot | 8 | 2745 | Mean Difference (IV, Random, 95% CI) | ‐0.81 [‐1.17, ‐0.44] |
|
| 25.1 Mean baseline FEV 1 >/=80% of predicted | 2 | 1272 | Mean Difference (IV, Random, 95% CI) | ‐0.17 [‐0.29, ‐0.05] |
| 25.2 Mean baseline FEV 1 61‐79% of predicted | 6 | 1473 | Mean Difference (IV, Random, 95% CI) | ‐1.29 [‐2.20, ‐0.38] |
| 26 Change in mean % rescue free days at 12 +/‐ 4 weeks Show forest plot | 2 | 362 | Mean Difference (IV, Fixed, 95% CI) | 19.1 [12.19, 26.01] |
|
| 26.1 Mean baseline FEV 1 61‐79% of predicted | 2 | 362 | Mean Difference (IV, Fixed, 95% CI) | 19.1 [12.19, 26.01] |
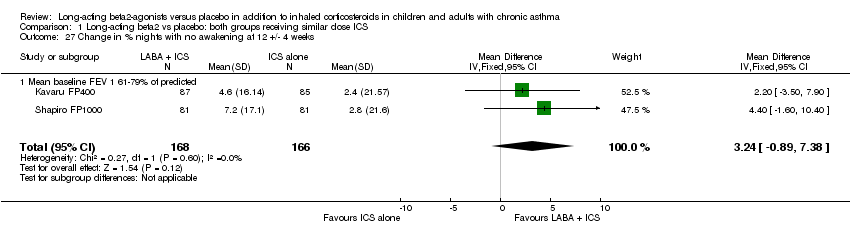
| 27 Change in % nights with no awakening at 12 +/‐ 4 weeks Show forest plot | 2 | 334 | Mean Difference (IV, Fixed, 95% CI) | 3.24 [‐0.89, 7.38] |
|
| 27.1 Mean baseline FEV 1 61‐79% of predicted | 2 | 334 | Mean Difference (IV, Fixed, 95% CI) | 3.24 [‐0.89, 7.38] |
| 28 % nights with awakening Show forest plot | 2 | 913 | Mean Difference (IV, Fixed, 95% CI) | ‐1.37 [‐2.75, 0.02] |
|
| 28.1 Mean Baseline FEV1 >/= 80% of predicted | 1 | 627 | Mean Difference (IV, Fixed, 95% CI) | ‐1.50 [‐3.19, 0.19] |
| 28.2 Mean baseline FEV 1 61‐79% of predicted | 1 | 286 | Mean Difference (IV, Fixed, 95% CI) | ‐1.10 [‐3.51, 1.31] |
| 29 Change in night time awakening ( number of nights) at endpoint Show forest plot | 3 | 648 | Mean Difference (IV, Fixed, 95% CI) | ‐0.22 [‐2.24, 1.81] |
|
| 29.1 Mean baseline FEV 1 61‐79% of predicted | 3 | 648 | Mean Difference (IV, Fixed, 95% CI) | ‐0.22 [‐2.24, 1.81] |
| 30 Change in quality of life (AQLQ score) at endpoint Show forest plot | 2 | 1169 | Mean Difference (IV, Random, 95% CI) | 0.33 [0.05, 0.60] |
|
| 30.1 Mean baseline FEV 1 61‐79% of predicted | 2 | 1169 | Mean Difference (IV, Random, 95% CI) | 0.33 [0.05, 0.60] |
| 31 Total # withdrawals Show forest plot | 26 | 6571 | Risk Ratio (M‐H, Fixed, 95% CI) | 0.87 [0.77, 0.97] |
|
| 31.1 Mean baseline FEV1 >/=80% of predicted | 5 | 248 | Risk Ratio (M‐H, Fixed, 95% CI) | 0.53 [0.22, 1.30] |
| 31.2 Mean baseline FEV 1 61‐79% of predicted | 19 | 5081 | Risk Ratio (M‐H, Fixed, 95% CI) | 0.87 [0.75, 0.99] |
| 31.4 Mean baseline FEV1 not reported | 2 | 1242 | Risk Ratio (M‐H, Fixed, 95% CI) | 0.90 [0.72, 1.13] |
| 32 # withdrawals due to poor asthma control or exacerbation Show forest plot | 23 | 5409 | Risk Ratio (M‐H, Fixed, 95% CI) | 0.50 [0.36, 0.70] |
|
| 32.1 Mean baseline FEV 1 >/=80% of predicted | 4 | 205 | Risk Ratio (M‐H, Fixed, 95% CI) | 0.82 [0.20, 3.40] |
| 32.2 Mean baseline FEV 1 61‐79% of predicted | 18 | 4293 | Risk Ratio (M‐H, Fixed, 95% CI) | 0.52 [0.37, 0.73] |
| 32.3 Mean baseline FEV 1 not reported | 1 | 911 | Risk Ratio (M‐H, Fixed, 95% CI) | 0.27 [0.08, 0.97] |
| 33 # withdrawals due to adverse events Show forest plot | 22 | 5892 | Risk Ratio (M‐H, Fixed, 95% CI) | 1.29 [0.96, 1.75] |
|
| 33.1 Mean baseline FEV 1 >/=80% of predicted | 3 | 175 | Risk Ratio (M‐H, Fixed, 95% CI) | 4.67 [0.23, 95.24] |
| 33.2 Mean baseline FEV 1 61‐79% of predicted | 18 | 4475 | Risk Ratio (M‐H, Fixed, 95% CI) | 1.24 [0.85, 1.79] |
| 33.3 Mean baseline FEV 1 not reported | 2 | 1242 | Risk Ratio (M‐H, Fixed, 95% CI) | 1.34 [0.79, 2.27] |
| 34 # withdrawals due to serious non‐respiratory event Show forest plot | 2 | | Risk Ratio (M‐H, Random, 95% CI) | Totals not selected |
|
| 34.1 Mean baseline FEV 1 61‐79% of predicted | 2 | | Risk Ratio (M‐H, Random, 95% CI) | 0.0 [0.0, 0.0] |
| 35 Total # adverse events Show forest plot | 12 | 2393 | Risk Ratio (M‐H, Fixed, 95% CI) | 0.98 [0.92, 1.05] |
|
| 35.1 Mean baseline FEV 1 >/=80% of predicted | 2 | 140 | Risk Ratio (M‐H, Fixed, 95% CI) | 1.10 [1.00, 1.20] |
| 35.2 Mean baseline FEV 1 61‐79% of predicted | 10 | 2253 | Risk Ratio (M‐H, Fixed, 95% CI) | 0.97 [0.90, 1.05] |
| 36 Serious adverse event including respiratory Show forest plot | 4 | 886 | Risk Ratio (M‐H, Fixed, 95% CI) | 1.16 [0.30, 4.42] |
|
| 36.1 Mean baseline FEV 1 61‐79% of predicted | 4 | 886 | Risk Ratio (M‐H, Fixed, 95% CI) | 1.16 [0.30, 4.42] |
| 37 # patients with headache Show forest plot | 14 | 3221 | Risk Ratio (M‐H, Fixed, 95% CI) | 1.13 [0.92, 1.41] |
|
| 37.1 Mean baseline FEV 1 >/=80%% of predicted | 1 | 117 | Risk Ratio (M‐H, Fixed, 95% CI) | 1.03 [0.67, 1.60] |
| 37.2 Mean baseline FEV 1 61‐79% of predicted | 13 | 3104 | Risk Ratio (M‐H, Fixed, 95% CI) | 1.16 [0.91, 1.48] |
| 38 # patients with hoarseness Show forest plot | 3 | 544 | Risk Ratio (M‐H, Random, 95% CI) | 0.71 [0.16, 3.18] |
|
| 38.1 Mean baseline FEV 1 61‐79% of predicted | 3 | 544 | Risk Ratio (M‐H, Random, 95% CI) | 0.71 [0.16, 3.18] |
| 39 # patients with oral thrush Show forest plot | 6 | 828 | Risk Ratio (M‐H, Fixed, 95% CI) | 1.04 [0.35, 3.06] |
|
| 39.1 Mean baseline FEV 1 61‐79% of predicted | 4 | 675 | Risk Ratio (M‐H, Fixed, 95% CI) | 1.04 [0.35, 3.06] |
| 39.2 FEV1 >/=80% predicted | 2 | 153 | Risk Ratio (M‐H, Fixed, 95% CI) | 0.0 [0.0, 0.0] |
| 40 # patients with tremor Show forest plot | 10 | 2419 | Risk Ratio (M‐H, Random, 95% CI) | 2.48 [0.78, 7.89] |
|
| 40.1 Mean baseline FEV 1 >/=80% of predicted | 1 | 116 | Risk Ratio (M‐H, Random, 95% CI) | 0.0 [0.0, 0.0] |
| 40.2 Mean baseline FEV 1 61‐79% of predicted | 9 | 2303 | Risk Ratio (M‐H, Random, 95% CI) | 2.48 [0.78, 7.89] |
| 41 # patients with tachycardia or palpitations Show forest plot | 11 | 2580 | Risk Ratio (M‐H, Fixed, 95% CI) | 2.13 [0.77, 5.88] |
|
| 41.1 Mean baseline FEV 1 >/=80% of predicted | 1 | 116 | Risk Ratio (M‐H, Fixed, 95% CI) | 0.0 [0.0, 0.0] |
| 41.2 Mean baseline FEV 1 61‐79% of predicted | 10 | 2464 | Risk Ratio (M‐H, Fixed, 95% CI) | 2.13 [0.77, 5.88] |
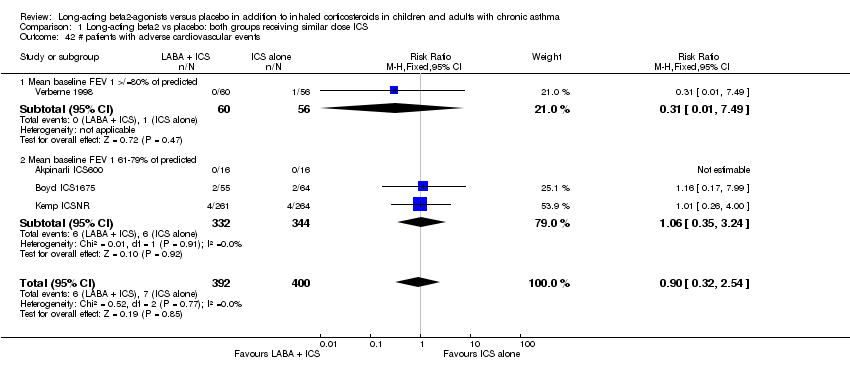
| 42 # patients with adverse cardiovascular events Show forest plot | 4 | 792 | Risk Ratio (M‐H, Fixed, 95% CI) | 0.90 [0.32, 2.54] |
|
| 42.1 Mean baseline FEV 1 >/=80% of predicted | 1 | 116 | Risk Ratio (M‐H, Fixed, 95% CI) | 0.31 [0.01, 7.49] |
| 42.2 Mean baseline FEV 1 61‐79% of predicted | 3 | 676 | Risk Ratio (M‐H, Fixed, 95% CI) | 1.06 [0.35, 3.24] |
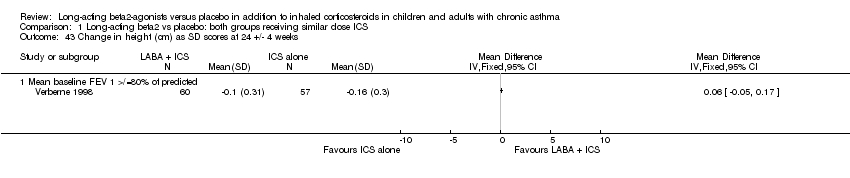
| 43 Change in height (cm) as SD scores at 24 +/‐ 4 weeks Show forest plot | 1 | | Mean Difference (IV, Fixed, 95% CI) | Totals not selected |
|
| 43.1 Mean baseline FEV 1 >/=80% of predicted | 1 | | Mean Difference (IV, Fixed, 95% CI) | 0.0 [0.0, 0.0] |
| 44 PC20 Methacholine‐adjusted odds ratio increase from baseline Show forest plot | 1 | | Mean Difference (IV, Random, 95% CI) | Totals not selected |
|
| 44.1 Mean baseline FEV 1 61‐79% of predicted | 1 | | Mean Difference (IV, Random, 95% CI) | 0.0 [0.0, 0.0] |
| 45 ACTH induced cortisol <18microg/dl at endpoint Show forest plot | 1 | | Risk Ratio (M‐H, Fixed, 95% CI) | Totals not selected |
|
| 45.1 Mean baseline FEV 1 61‐79% of predicted | 1 | | Risk Ratio (M‐H, Fixed, 95% CI) | 0.0 [0.0, 0.0] |
| 46 Am cortisol < 5 microg/dl at endpoint Show forest plot | 1 | | Risk Ratio (M‐H, Fixed, 95% CI) | Totals not selected |
|
| 46.1 Mean baseline FEV 1 61‐79% of predicted | 1 | | Risk Ratio (M‐H, Fixed, 95% CI) | 0.0 [0.0, 0.0] |
| 47 Deaths Show forest plot | 1 | | Risk Ratio (M‐H, Fixed, 95% CI) | Totals not selected |
|
| 47.1 Mean baseline FEV 1 not reported | 1 | | Risk Ratio (M‐H, Fixed, 95% CI) | 0.0 [0.0, 0.0] |
| 48 Change in # of symptom‐free nights at endpoint Show forest plot | 1 | | Mean Difference (IV, Fixed, 95% CI) | Totals not selected |
|
| 48.1 Mean baseline FEV 1 61‐79% of predicted | 1 | | Mean Difference (IV, Fixed, 95% CI) | 0.0 [0.0, 0.0] |
| 49 # Worsening asthma Show forest plot | 1 | | Risk Ratio (M‐H, Fixed, 95% CI) | Totals not selected |
|
| 49.1 Mean baseline FEV 1 61‐79% of predicted | 1 | | Risk Ratio (M‐H, Fixed, 95% CI) | 0.0 [0.0, 0.0] |
| 50 Change in % PC 20 at endpoint Show forest plot | 1 | 39 | Mean Difference (IV, Fixed, 95% CI) | 0.30 [‐0.68, 1.28] |
|
| 50.1 Mean baseline FEV1 >/=80% of predicted | 1 | 39 | Mean Difference (IV, Fixed, 95% CI) | 0.30 [‐0.68, 1.28] |