Contenido relacionado
Revisiones y protocolos relacionados
Veerasamy Yengopal, Soraya Yasin Harnekar, Naren Patel, Nandi Siegfried | 17 octubre 2016
Falk Schwendicke, Tanya Walsh, Thomas Lamont, Waraf Al-yaseen, Lars Bjørndal, Janet E Clarkson, Margherita Fontana, Jesus Gomez Rossi, Gerd Göstemeyer, Colin Levey, Anne Müller, David Ricketts, Mark Robertson, Ruth M Santamaria, Nicola PT Innes | 19 julio 2021
Patrick Sequeira‐Byron, Zbys Fedorowicz, Ben Carter, Mona Nasser, Eman F Alrowaili | 25 septiembre 2015
Mojtaba Dorri, Stephen M Dunne, Tanya Walsh, Falk Schwendicke | 5 noviembre 2015
Mojtaba Dorri, Maria José Martinez‐Zapata, Tanya Walsh, Valeria CC Marinho, Aubrey Sheiham (deceased)a, Carlos Zaror | 28 diciembre 2017
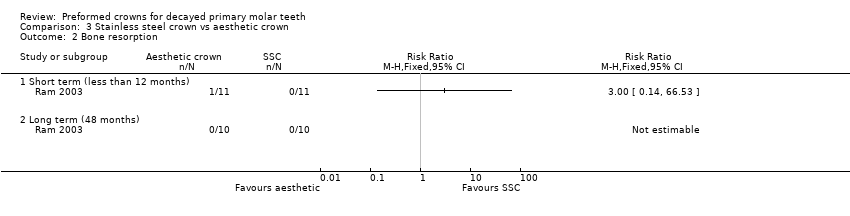
Violaine Smaïl‐Faugeron, Anne‐Marie Glenny, Frédéric Courson, Pierre Durieux, Michele Muller‐Bolla, Helene Fron Chabouis | 31 mayo 2018
Andrew B Schenkel, Analia Veitz‐Keenan | 5 marzo 2019
Valeria CC Marinho, Helen V Worthington, Tanya Walsh, Jan E Clarkson | 11 julio 2013
Marco Esposito, Maria Gabriella Grusovin, Helen V Worthington | 18 enero 2012
Carlo E Poggio, Carlo Ercoli, Lorena Rispoli, Carlo Maiorana, Marco Esposito | 20 diciembre 2017
Respuestas clínicas Cochrane
Mojtaba Dorri | 28 diciembre 2016