سیلدنافیل در درمان هیپرتانسیون ریوی در نوزادان
Appendices
Appendix 1. Standard search methods
PubMed: ((infant, newborn[MeSH] OR newborn OR neonate OR neonatal OR premature OR low birth weight OR VLBW OR LBW or infan* or neonat*) AND (randomized controlled trial [pt] OR controlled clinical trial [pt] OR randomized [tiab] OR placebo [tiab] OR drug therapy [sh] OR randomly [tiab] OR trial [tiab] OR groups [tiab]) NOT (animals [mh] NOT humans [mh]))
Embase: (infant, newborn or newborn or neonate or neonatal or premature or very low birth weight or low birth weight or VLBW or LBW or Newborn or infan* or neonat*) AND (human not animal) AND (randomized controlled trial or controlled clinical trial or randomized or placebo or clinical trials as topic or randomly or trial or clinical trial)
CINAHL: (infant, newborn OR newborn OR neonate OR neonatal OR premature OR low birth weight OR VLBW OR LBW or Newborn or infan* or neonat*) AND (randomized controlled trial OR controlled clinical trial OR randomized OR placebo OR clinical trials as topic OR randomly OR trial OR PT clinical trial)
Cochrane Library: (infant or newborn or neonate or neonatal or premature or preterm or very low birth weight or low birth weight or VLBW or LBW)
Appendix 2. Risk of bias tool
We used the standard methods of Cochrane and Cochrane Neonatal to assess the methodological quality (to meet the validity criteria) of trials. For each trial, we sought information regarding the method of randomisation, and blinding and reporting of all outcomes of all infants enrolled in the trial. We assessed each criterion as having low, high, or unclear risk. Two review authors separately assessed each study. We resolved disagreements by discussion. We added this information to the Characteristics of included studies table. We evaluated the following issues and entered the findings into the risk of bias table.
1. Sequence generation (checking for possible selection bias). Was the allocation sequence adequately generated?
For each included study, we categorised the method used to generate the allocation sequence as:
a. Low risk (any truly random process, e.g. random number table; computer random number generator);
b. High risk (any non‐random process, e.g. odd or even date of birth; hospital or clinic record number); or
c. Unclear risk.
2. Allocation concealment (checking for possible selection bias). Was allocation adequately concealed?
For each included study, we categorised the method used to conceal the allocation sequence as:
a. Low risk (e.g. telephone or central randomisation; consecutively numbered sealed opaque envelopes);
b. High risk (open random allocation; unsealed or non‐opaque envelopes, alternation; date of birth); or
c. Unclear risk.
3. Blinding of participants and personnel (checking for possible performance bias). Was knowledge of the allocated intervention adequately prevented during the study?
For each included study, we categorised the methods used to blind study participants and personnel from knowledge of which intervention a participant received. Blinding was assessed separately for different outcomes or classes of outcomes. We categorised the methods as:
a. Low risk, high risk, or unclear risk for participants; and
b. Low risk, high risk, or unclear risk for personnel;
4. Blinding of outcome assessment (checking for possible detection bias). Was knowledge of the allocated intervention adequately prevented at the time of outcome assessment?
For each included study, we categorised the methods used to blind outcome assessment. Blinding was assessed separately for different outcomes or classes of outcomes. We categorised the methods as:
a. Low risk for outcome assessors;.
b. High risk for outcome assessors; or
c. Unclear risk for outcome assessors.
5. Incomplete outcome data (checking for possible attrition bias through withdrawals, dropouts, protocol deviations). Were incomplete outcome data adequately addressed?
For each included study and for each outcome, we described the completeness of data including attrition and exclusions from the analysis. We noted whether attrition and exclusions were reported, the numbers included in the analysis at each stage (compared with the total randomised participants), reasons for attrition or exclusion when reported, and whether missing data were balanced across groups or were related to outcomes. When sufficient information was reported or supplied by trial authors, we re‐included missing data in the analyses. We categorised the methods as:
a. Low risk (< 20% missing data);
b. High risk (≥ 20% missing data); or
c. Unclear risk.
6. Selective reporting bias. Are reports of the study free of the suggestion of selective outcome reporting?
For each included study, we described how we investigated the possibility of selective outcome reporting bias and what we found. We assessed the methods as:
a. Low risk (when it is clear that all of the study's prespecified outcomes and all expected outcomes of interest to the review have been reported);
b. High risk (when not all of the study's prespecified outcomes have been reported; one or more reported primary outcomes were not prespecified outcomes of interest and are reported incompletely and so cannot be used; study fails to include results of a key outcome that would have been expected to have been reported); or
c. Unclear risk.
7. Other sources of bias. Was the study apparently free of other problems that could put it at high risk of bias?
For each included study, we described any important concerns we had about other possible sources of bias (e.g. whether a potential source of bias was related to the specific study design, whether the trial was stopped early owing to some data‐dependent process). We assessed whether each study was free of other problems that could put it at risk of bias as:
a. Low risk;
b. High risk; or
c. Unclear risk.
If needed, we explored the impact of the level of bias by undertaking sensitivity analyses.

Study flow diagram: review update.

Risk of bias graph: review authors' judgements about each risk of bias item presented as percentages across all included studies.

Risk of bias summary: review authors' judgements about each risk of bias item for each included study.
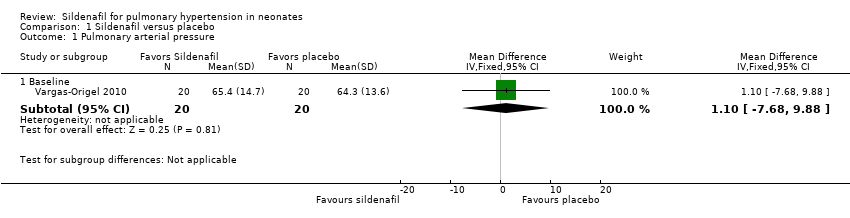
Comparison 1 Sildenafil versus placebo, Outcome 1 Pulmonary arterial pressure.

Comparison 1 Sildenafil versus placebo, Outcome 2 PaO2 in mmHg (absolute values).

Comparison 1 Sildenafil versus placebo, Outcome 3 Mean arterial blood pressure in mmHg.
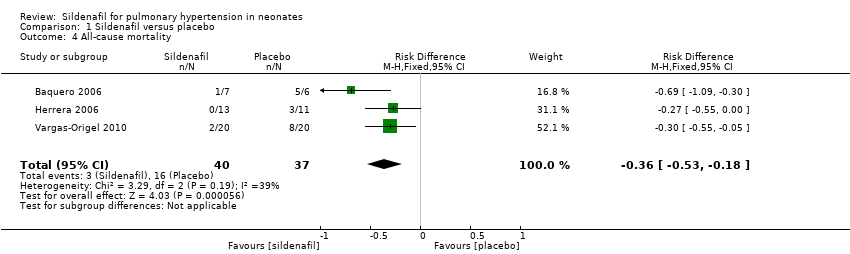
Comparison 1 Sildenafil versus placebo, Outcome 4 All‐cause mortality.

Comparison 1 Sildenafil versus placebo, Outcome 5 Oxygenation index (absolute values).
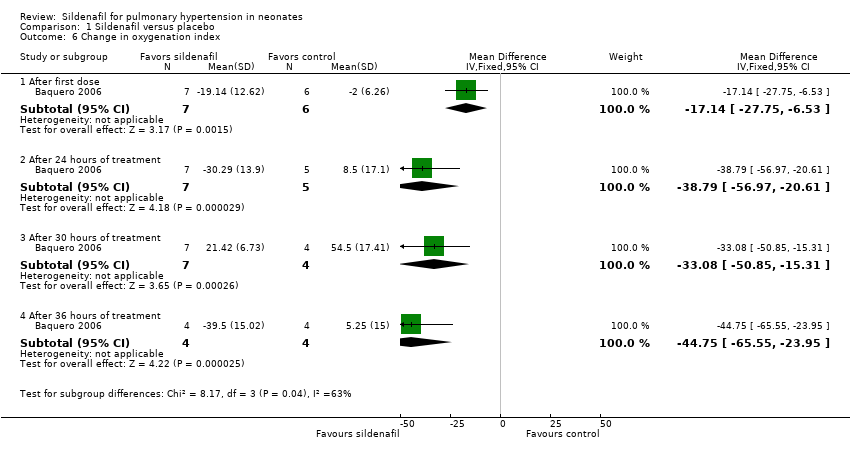
Comparison 1 Sildenafil versus placebo, Outcome 6 Change in oxygenation index.

Comparison 1 Sildenafil versus placebo, Outcome 7 A‐a DO2 difference.

Comparison 1 Sildenafil versus placebo, Outcome 8 Mean airway pressure.
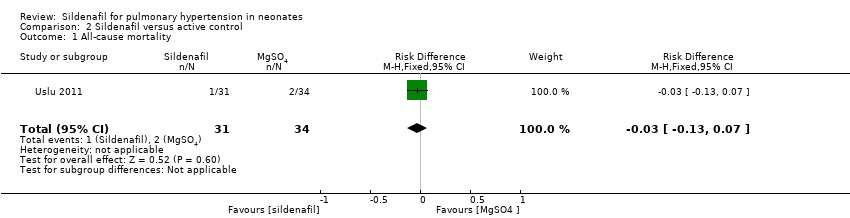
Comparison 2 Sildenafil versus active control, Outcome 1 All‐cause mortality.
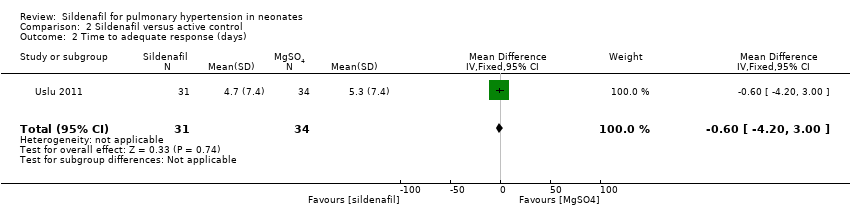
Comparison 2 Sildenafil versus active control, Outcome 2 Time to adequate response (days).
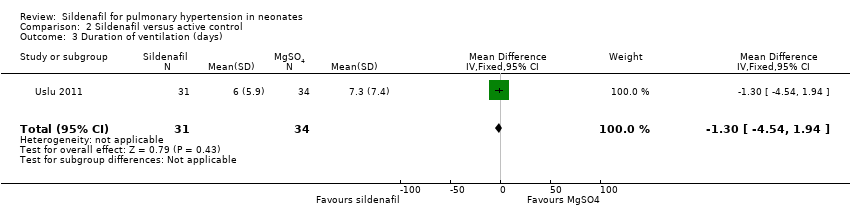
Comparison 2 Sildenafil versus active control, Outcome 3 Duration of ventilation (days).

Comparison 2 Sildenafil versus active control, Outcome 4 Inotropic agent.
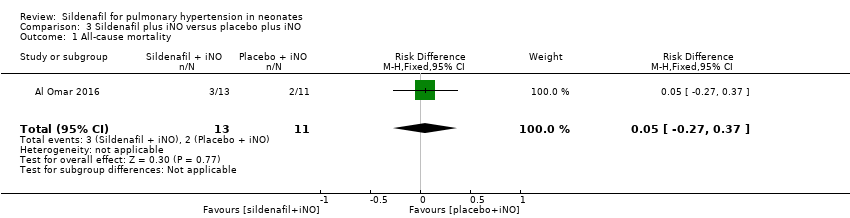
Comparison 3 Sildenafil plus iNO versus placebo plus iNO, Outcome 1 All‐cause mortality.
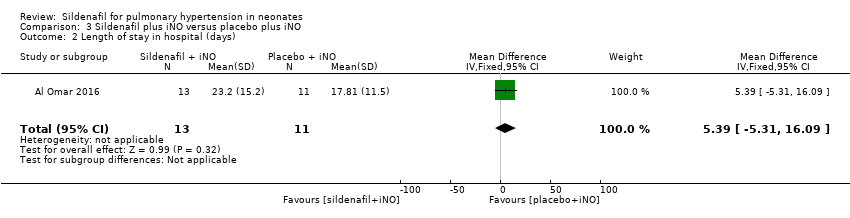
Comparison 3 Sildenafil plus iNO versus placebo plus iNO, Outcome 2 Length of stay in hospital (days).

Comparison 3 Sildenafil plus iNO versus placebo plus iNO, Outcome 3 Inotropic agent.
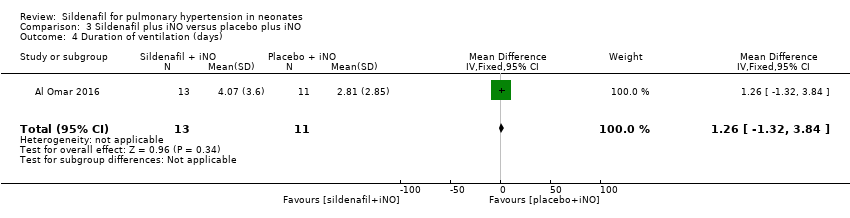
Comparison 3 Sildenafil plus iNO versus placebo plus iNO, Outcome 4 Duration of ventilation (days).

Comparison 3 Sildenafil plus iNO versus placebo plus iNO, Outcome 5 Retinopathy of prematurity.
| Sildenafil compared with placebo for pulmonary hypertension in neonates | ||||||
| Patient or population: pulmonary hypertension in neonates | ||||||
| Outcomes | Anticipated absolute effects* (95% CI) | Relative effect | No. of participants | Quality of the evidence | Comments | |
| Risk with placebo | Risk with sildenafil | |||||
| PaO2 in mmHg (absolute values) After 24‐25 hours | Mean PaO2 in mmHg (absolute values) | MD 15.31 higher | ‐ | 57 | ⊕⊕⊝⊝ | Evidence was downgraded due to unreported methodological features and imprecision (small sample size) |
| Change in oxygenation index | Mean change in oxygenation index | MD 38.79 lower | ‐ | 12 | ⊕⊕⊝⊝ | Evidence was downgraded due to unreported methodological features and imprecision (small sample size) |
| All‐cause mortality | Study population | RR 0.20 | 77 | ⊕⊕⊝⊝ | Evidence was downgraded due to unreported methodological features and imprecision (small sample size) | |
| 432 per 1000 | 77 per 1000 | |||||
| *The risk in the intervention group (and its 95% confidence interval) is based on assumed risk in the comparison group and relative effect of the intervention (and its 95% CI) | ||||||
| GRADE Working Group grades of evidence | ||||||
| aImprecise due to small sample size bRisk of bias due to unclear randomisation allocation and lack of clinical trial registration | ||||||
| Sildenafil compared with active control for pulmonary hypertension in neonates | ||||||
| Patient or population: pulmonary hypertension in neonates | ||||||
| Outcomes | Anticipated absolute effects* (95% CI) | Relative effect | No. of participants | Quality of the evidence | Comments | |
| Risk with magnesium sulphate | Risk with sildenafil | |||||
| All‐cause mortality | Study population | RR 0.55 | 65 | ⊕⊝⊝⊝ | Evidence was downgraded due to very serious imprecision, as results from this single study have not been replicated and risk of bias is evident in study design (missing data) | |
| 59 per 1000 | 32 per 1000 | |||||
| *The risk in the intervention group (and its 95% confidence interval) is based on assumed risk in the comparison group and relative effect of the intervention (and its 95% CI) | ||||||
| GRADE Working Group grades of evidence | ||||||
| aImprecise due to small sample size; only one included study bRisk of bias due to missing data (not analysed as intent to treat) | ||||||
| Sildenafil plus iNO compared with placebo plus iNO for pulmonary hypertension in neonates | ||||||
| Patient or population: pulmonary hypertension in neonates | ||||||
| Outcomes | Anticipated absolute effects* (95% CI) | Relative effect | No. of participants | Quality of the evidence | Comments | |
| Risk with placebo plus iNO | Risk with sildenafil plus iNO | |||||
| All‐cause mortality | Study population | RR 1.27 | 24 | ⊕⊕⊝⊝ | Evidence was downgraded due to imprecision . | |
| 182 per 1000 | 231 per 1000 | |||||
| Length of stay in hospital (days) | Mean length of stay in hospital was 17.81 days. | MD 5.39 higher | ‐ | 24 | ⊕⊕⊝⊝ | Evidence was downgraded due to imprecision . |
| *The risk in the intervention group (and its 95% confidence interval) is based on assumed risk in the comparison group and relative effect of the intervention (and its 95% CI) | ||||||
| GRADE Working Group grades of evidence | ||||||
| aImprecise due to very small sample size; only one included study | ||||||
| Outcome or subgroup title | No. of studies | No. of participants | Statistical method | Effect size |
| 1 Pulmonary arterial pressure Show forest plot | 1 | Mean Difference (IV, Fixed, 95% CI) | Subtotals only | |
| 1.1 Baseline | 1 | 40 | Mean Difference (IV, Fixed, 95% CI) | 1.10 [‐7.68, 9.88] |
| 2 PaO2 in mmHg (absolute values) Show forest plot | 2 | Mean Difference (IV, Fixed, 95% CI) | Subtotals only | |
| 2.1 At baseline | 2 | 64 | Mean Difference (IV, Fixed, 95% CI) | 8.06 [1.58, 14.54] |
| 2.2 After first dose | 2 | 64 | Mean Difference (IV, Fixed, 95% CI) | 11.09 [1.65, 20.52] |
| 2.3 After 6 to 7 hours of treatment | 2 | 64 | Mean Difference (IV, Fixed, 95% CI) | 14.30 [5.25, 23.34] |
| 2.4 After 24 to 25 hours of treatment | 2 | 58 | Mean Difference (IV, Fixed, 95% CI) | 15.31 [6.49, 24.13] |
| 2.5 After 72 hours or at the end of treatment | 1 | 24 | Mean Difference (IV, Fixed, 95% CI) | 20.98 [14.81, 27.15] |
| 3 Mean arterial blood pressure in mmHg Show forest plot | 2 | Mean Difference (IV, Fixed, 95% CI) | Subtotals only | |
| 3.1 Before initiation of therapy | 2 | 53 | Mean Difference (IV, Fixed, 95% CI) | 5.65 [2.69, 8.61] |
| 3.2 At the end of therapy | 2 | 40 | Mean Difference (IV, Fixed, 95% CI) | 22.70 [1.23, 44.17] |
| 4 All‐cause mortality Show forest plot | 3 | 77 | Risk Difference (M‐H, Fixed, 95% CI) | ‐0.36 [‐0.53, ‐0.18] |
| 5 Oxygenation index (absolute values) Show forest plot | 3 | Mean Difference (IV, Fixed, 95% CI) | Subtotals only | |
| 5.1 At baseline | 3 | 77 | Mean Difference (IV, Fixed, 95% CI) | ‐0.74 [‐8.11, 6.64] |
| 5.2 After first dose | 3 | 77 | Mean Difference (IV, Fixed, 95% CI) | ‐12.53 [‐18.60, ‐6.47] |
| 5.3 After 6 to 7 hours of treatment | 2 | 75 | Mean Difference (IV, Fixed, 95% CI) | ‐20.07 [‐26.12, ‐14.02] |
| 5.4 After 24 to 25 hours of treatment | 3 | 69 | Mean Difference (IV, Fixed, 95% CI) | ‐19.15 [‐24.52, ‐13.77] |
| 5.5 After 30 hours of treatment | 1 | 11 | Mean Difference (IV, Fixed, 95% CI) | ‐45.46 [‐61.87, ‐29.05] |
| 5.6 After 36 hours of treatment | 1 | 8 | Mean Difference (IV, Fixed, 95% CI) | ‐31.75 [‐45.74, ‐17.76] |
| 5.7 After 72 hours or at the end of treatment | 1 | 24 | Mean Difference (IV, Fixed, 95% CI) | ‐19.47 [‐23.42, ‐15.52] |
| 6 Change in oxygenation index Show forest plot | 1 | Mean Difference (IV, Fixed, 95% CI) | Subtotals only | |
| 6.1 After first dose | 1 | 13 | Mean Difference (IV, Fixed, 95% CI) | ‐17.14 [‐27.75, ‐6.53] |
| 6.2 After 24 hours of treatment | 1 | 12 | Mean Difference (IV, Fixed, 95% CI) | ‐38.79 [‐56.97, ‐20.61] |
| 6.3 After 30 hours of treatment | 1 | 11 | Mean Difference (IV, Fixed, 95% CI) | ‐33.08 [‐50.85, ‐15.31] |
| 6.4 After 36 hours of treatment | 1 | 8 | Mean Difference (IV, Fixed, 95% CI) | ‐44.75 [‐65.55, ‐23.95] |
| 7 A‐a DO2 difference Show forest plot | 2 | Mean Difference (IV, Fixed, 95% CI) | Subtotals only | |
| 7.1 Baseline | 2 | 64 | Mean Difference (IV, Fixed, 95% CI) | 0.99 [‐11.54, 13.51] |
| 7.2 At 6 to 7 hours of treatment | 1 | 24 | Mean Difference (IV, Fixed, 95% CI) | 0.01 [‐27.72, 27.74] |
| 7.3 At 24 to 25 hours of treament | 2 | 57 | Mean Difference (IV, Fixed, 95% CI) | 1.59 [‐18.98, 22.16] |
| 7.4 At 72 hours or at the end of treatment | 1 | 24 | Mean Difference (IV, Fixed, 95% CI) | ‐18.34 [‐26.59, ‐10.09] |
| 8 Mean airway pressure Show forest plot | 2 | Mean Difference (IV, Fixed, 95% CI) | Subtotals only | |
| 8.1 Baseline | 2 | 64 | Mean Difference (IV, Fixed, 95% CI) | ‐2.09 [‐3.30, ‐0.88] |
| 8.2 At 6 to 7 hours of treatment | 2 | 63 | Mean Difference (IV, Fixed, 95% CI) | ‐5.94 [‐7.36, ‐4.52] |
| 8.3 At 24 to 25 hours of treatment | 2 | 57 | Mean Difference (IV, Fixed, 95% CI) | ‐6.64 [‐8.49, ‐4.80] |
| 8.4 At 72 hours or at the end of treatment | 1 | 24 | Mean Difference (IV, Fixed, 95% CI) | ‐8.58 [‐10.37, ‐6.79] |
| Outcome or subgroup title | No. of studies | No. of participants | Statistical method | Effect size |
| 1 All‐cause mortality Show forest plot | 1 | 65 | Risk Difference (M‐H, Fixed, 95% CI) | ‐0.03 [‐0.13, 0.07] |
| 2 Time to adequate response (days) Show forest plot | 1 | 65 | Mean Difference (IV, Fixed, 95% CI) | ‐0.60 [‐4.20, 3.00] |
| 3 Duration of ventilation (days) Show forest plot | 1 | 65 | Mean Difference (IV, Fixed, 95% CI) | ‐1.30 [‐4.54, 1.94] |
| 4 Inotropic agent Show forest plot | 1 | 65 | Risk Difference (M‐H, Fixed, 95% CI) | ‐0.37 [‐0.59, ‐0.15] |
| Outcome or subgroup title | No. of studies | No. of participants | Statistical method | Effect size |
| 1 All‐cause mortality Show forest plot | 1 | 24 | Risk Difference (M‐H, Fixed, 95% CI) | 0.05 [‐0.27, 0.37] |
| 2 Length of stay in hospital (days) Show forest plot | 1 | 24 | Mean Difference (IV, Fixed, 95% CI) | 5.39 [‐5.31, 16.09] |
| 3 Inotropic agent Show forest plot | 1 | 24 | Risk Ratio (M‐H, Fixed, 95% CI) | 1.06 [0.37, 3.00] |
| 4 Duration of ventilation (days) Show forest plot | 1 | 24 | Mean Difference (IV, Fixed, 95% CI) | 1.26 [‐1.32, 3.84] |
| 5 Retinopathy of prematurity Show forest plot | 1 | 24 | Odds Ratio (M‐H, Fixed, 95% CI) | 0.0 [0.0, 0.0] |