Scolaris Content Display Scolaris Content Display

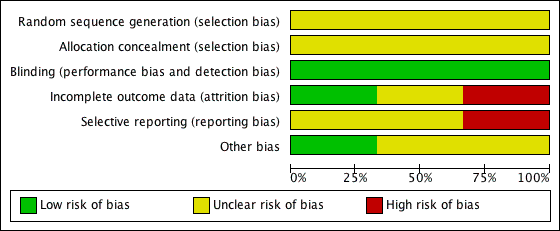
Risk of bias graph: review authors' judgements about each risk of bias item presented as percentages across all included studies.
Figuras y tablas -
Figure 1

Risk of bias graph: review authors' judgements about each risk of bias item presented as percentages across all included studies.

Risk of bias summary: review authors' judgements about each risk of bias item for each included study.
Figuras y tablas -
Figure 2

Risk of bias summary: review authors' judgements about each risk of bias item for each included study.

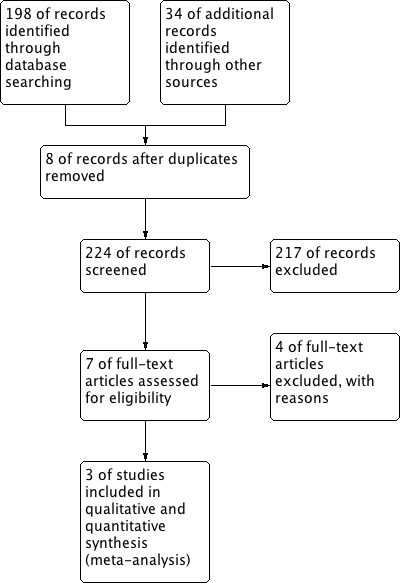
Study flow diagram.
Figuras y tablas -
Figure 3

Study flow diagram.

Comparison 1 Sildenafil versus placebo, Outcome 1 Pulmonary arterial pressure.
Figuras y tablas -
Analysis 1.1

Comparison 1 Sildenafil versus placebo, Outcome 1 Pulmonary arterial pressure.

Comparison 1 Sildenafil versus placebo, Outcome 2 PaO2 in mm of Hg (absolute values).
Figuras y tablas -
Analysis 1.2

Comparison 1 Sildenafil versus placebo, Outcome 2 PaO2 in mm of Hg (absolute values).

Comparison 1 Sildenafil versus placebo, Outcome 3 Mean arterial blood pressure in mm of Hg.
Figuras y tablas -
Analysis 1.3

Comparison 1 Sildenafil versus placebo, Outcome 3 Mean arterial blood pressure in mm of Hg.

Comparison 1 Sildenafil versus placebo, Outcome 4 All‐cause mortality.
Figuras y tablas -
Analysis 1.4

Comparison 1 Sildenafil versus placebo, Outcome 4 All‐cause mortality.

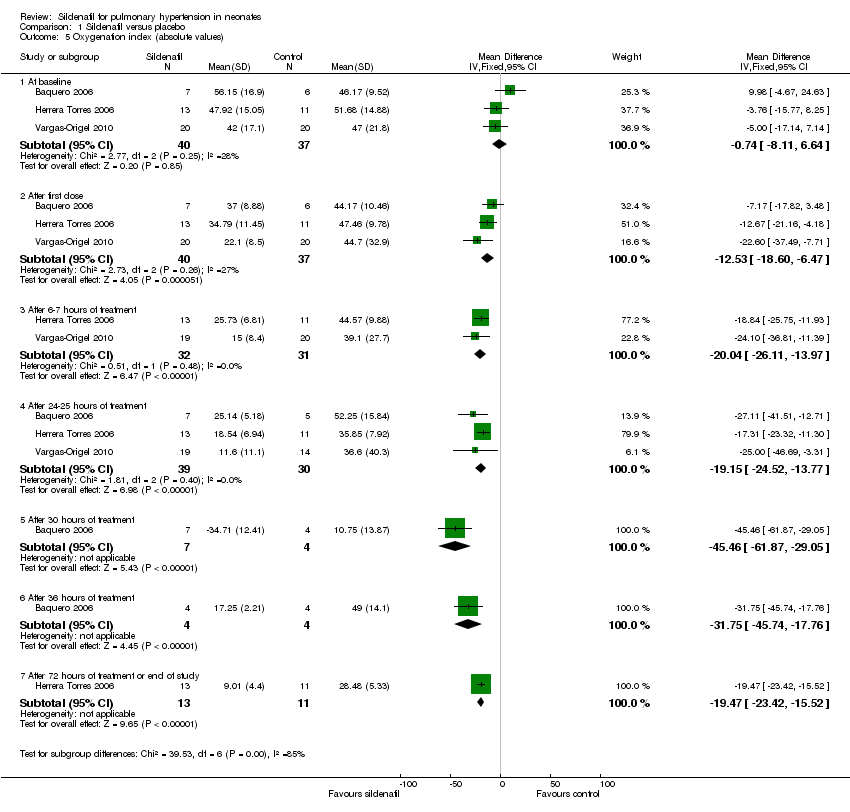
Comparison 1 Sildenafil versus placebo, Outcome 5 Oxygenation index (absolute values).
Figuras y tablas -
Analysis 1.5

Comparison 1 Sildenafil versus placebo, Outcome 5 Oxygenation index (absolute values).

Comparison 1 Sildenafil versus placebo, Outcome 6 Change in oxygenation index.
Figuras y tablas -
Analysis 1.6

Comparison 1 Sildenafil versus placebo, Outcome 6 Change in oxygenation index.

Comparison 1 Sildenafil versus placebo, Outcome 7 Mean airway pressure.
Figuras y tablas -
Analysis 1.7

Comparison 1 Sildenafil versus placebo, Outcome 7 Mean airway pressure.

Comparison 1 Sildenafil versus placebo, Outcome 8 A‐a DO2.
Figuras y tablas -
Analysis 1.8

Comparison 1 Sildenafil versus placebo, Outcome 8 A‐a DO2.

Sildenafil compared with placebo or other treatment for pulmonary hypertension of newborn

Patient or population: Neonates with pulmonary hypertension

Settings: Neonatal Intensive Care Unit

Intervention:Sildenafil

Comparison: Placebo or other treatment

Outcomes

Illustrative comparative risks* (95% CI)

Relative effect
(95% CI)

No of Participants
(studies)

Quality of the evidence
(GRADE)

Comments

Assumed risk

Corresponding risk

Placebo

Sildenafil

All‐cause mortality

High risk population

RR 0.20, 95% CI 0.07, 0.57

77 (3)

⊕⊕⊕⊝
moderate

432 per 1000

75 per 1000

Oxygenation index (absolute values) after 24 hours of treatment

The mean oxygenation index ranged across control groups from
36‐52

The mean oxygenation index in the intervention groups was
11 to 25

MD ‐19 (95% CI ‐25, ‐14)

76 (3)

⊕⊕⊕⊝
moderate

Change in oxygenation index ‐ After 24 hours of treatment

The increase in oxygenation index was by 8.5 after 24 hours of treatment

The decrease in oxygenation index was by 30 after 36 hours of treatment

MD (‐39, 95% CI ‐57, ‐21)

1 (8)

⊕⊕⊝⊝⊝
very low

Changes in PaO2 after 24 hours of treatment

The mean PaO2 ranged across control groups from
56‐62 mm of Hg

The mean PaO2 in the intervention groups was
70‐85 mm of Hg

MD 16 (95% CI 7, 24 mm of Hg)

64 (2)

⊕⊕⊕⊝
moderate

*The basis for the assumed risk (e.g. the median control group risk across studies) is provided in footnotes. The corresponding risk (and its 95% confidence interval) is based on the assumed risk in the comparison group and the relative effect of the intervention (and its 95% CI).
CI: Confidence interval; RR: Risk Ratio; MD: Mean difference; PaO2: Partial pressure of oxygen in blood

GRADE Working Group grades of evidence
High quality: Further research is very unlikely to change our confidence in the estimate of effect.
Moderate quality: Further research is likely to have an important impact on our confidence in the estimate of effect and may change the estimate.
Low quality: Further research is very likely to have an important impact on our confidence in the estimate of effect and is likely to change the estimate.
Very low quality: We are very uncertain about the estimate.

Figuras y tablas -
Comparison 1. Sildenafil versus placebo

Outcome or subgroup title

No. of studies

No. of participants

Statistical method

Effect size

1 Pulmonary arterial pressure Show forest plot

1

Mean Difference (IV, Fixed, 95% CI)

Subtotals only

1.1 Baseline

1

40

Mean Difference (IV, Fixed, 95% CI)

1.10 [‐7.68, 9.88]

2 PaO2 in mm of Hg (absolute values) Show forest plot

2

Mean Difference (IV, Fixed, 95% CI)

Subtotals only

2.1 At baseline

2

64

Mean Difference (IV, Fixed, 95% CI)

8.06 [1.58, 14.54]

2.2 After first dose

2

64

Mean Difference (IV, Fixed, 95% CI)

11.09 [1.65, 20.52]

2.3 After 6‐7 hours

2

63

Mean Difference (IV, Fixed, 95% CI)

14.28 [5.18, 23.37]

2.4 After 24‐25 hours

2

57

Mean Difference (IV, Fixed, 95% CI)

15.28 [6.44, 24.12]

2.5 After 72 hours or at the end of treatment

1

24

Mean Difference (IV, Fixed, 95% CI)

20.98 [14.81, 27.15]

3 Mean arterial blood pressure in mm of Hg Show forest plot

2

Mean Difference (IV, Fixed, 95% CI)

Subtotals only

3.1 Before initiation of therapy

2

53

Mean Difference (IV, Fixed, 95% CI)

5.65 [2.69, 8.61]

3.2 At the end of therapy

2

40

Mean Difference (IV, Fixed, 95% CI)

22.70 [1.23, 44.17]

4 All‐cause mortality Show forest plot

3

77

Risk Difference (M‐H, Random, 95% CI)

‐0.38 [‐0.60, ‐0.16]

5 Oxygenation index (absolute values) Show forest plot

3

Mean Difference (IV, Fixed, 95% CI)

Subtotals only

5.1 At baseline

3

77

Mean Difference (IV, Fixed, 95% CI)

‐0.74 [‐8.11, 6.64]

5.2 After first dose

3

77

Mean Difference (IV, Fixed, 95% CI)

‐12.53 [‐18.60, ‐6.47]

5.3 After 6‐7 hours of treatment

2

63

Mean Difference (IV, Fixed, 95% CI)

‐20.04 [‐26.11, ‐13.97]

5.4 After 24‐25 hours of treatment

3

69

Mean Difference (IV, Fixed, 95% CI)

‐19.15 [‐24.52, ‐13.77]

5.5 After 30 hours of treatment

1

11

Mean Difference (IV, Fixed, 95% CI)

‐45.46 [‐61.87, ‐29.05]

5.6 After 36 hours of treatment

1

8

Mean Difference (IV, Fixed, 95% CI)

‐31.75 [‐45.74, ‐17.76]

5.7 After 72 hours of treatment or end of study

1

24

Mean Difference (IV, Fixed, 95% CI)

‐19.47 [‐23.42, ‐15.52]

6 Change in oxygenation index Show forest plot

1

Mean Difference (IV, Fixed, 95% CI)

Subtotals only

6.1 After first dose

1

13

Mean Difference (IV, Fixed, 95% CI)

‐17.14 [‐27.75, ‐6.53]

6.2 After 24 hours of treatment

1

12

Mean Difference (IV, Fixed, 95% CI)

‐38.79 [‐56.97, ‐20.61]

6.3 After 30 hours of treatment

1

11

Mean Difference (IV, Fixed, 95% CI)

‐33.08 [‐50.85, ‐15.31]

6.4 After 36 hours of treatment

1

8

Mean Difference (IV, Fixed, 95% CI)

‐44.75 [‐65.55, ‐23.95]

7 Mean airway pressure Show forest plot

2

Mean Difference (IV, Fixed, 95% CI)

Subtotals only

7.1 Baseline

2

64

Mean Difference (IV, Fixed, 95% CI)

‐2.09 [‐3.30, ‐0.88]

7.2 At 6‐7 hours

2

63

Mean Difference (IV, Fixed, 95% CI)

‐5.94 [‐7.36, ‐4.52]

7.3 At 24‐25 hours

2

57

Mean Difference (IV, Fixed, 95% CI)

‐6.64 [‐8.49, ‐4.80]

7.4 At 72 hours

1

24

Mean Difference (IV, Fixed, 95% CI)

‐8.58 [‐10.37, ‐6.79]

8 A‐a DO2 Show forest plot

2

Mean Difference (IV, Fixed, 95% CI)

Subtotals only

8.1 Baseline

2

64

Mean Difference (IV, Fixed, 95% CI)

0.99 [‐11.54, 13.51]

8.2 At 6‐7 hours of age

1

24

Mean Difference (IV, Fixed, 95% CI)

0.01 [‐27.72, 27.74]

8.3 At 24‐25 hours of age

2

57

Mean Difference (IV, Fixed, 95% CI)

1.59 [‐18.98, 22.16]

8.4 At 72 hours

1

24

Mean Difference (IV, Fixed, 95% CI)

‐18.34 [‐26.59, ‐10.09]

Figuras y tablas -
Comparison 1. Sildenafil versus placebo