Scolaris Content Display Scolaris Content Display

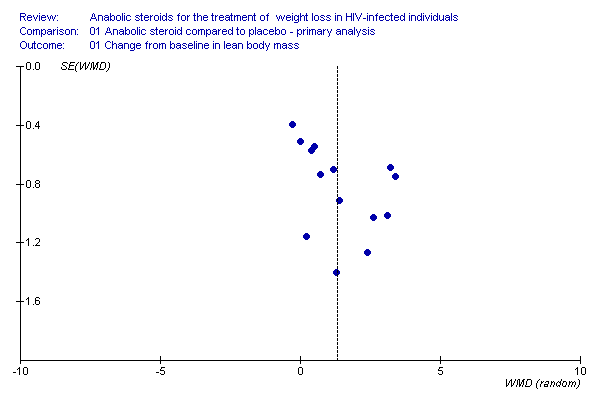
Figure 1. Funnel plot of results for change from baseline in lean body mass
Figuras y tablas -
Figure 1

Figure 1. Funnel plot of results for change from baseline in lean body mass

Figure 2. Funnel plot of results for change from baseline in body weight
Figuras y tablas -
Figure 2

Figure 2. Funnel plot of results for change from baseline in body weight

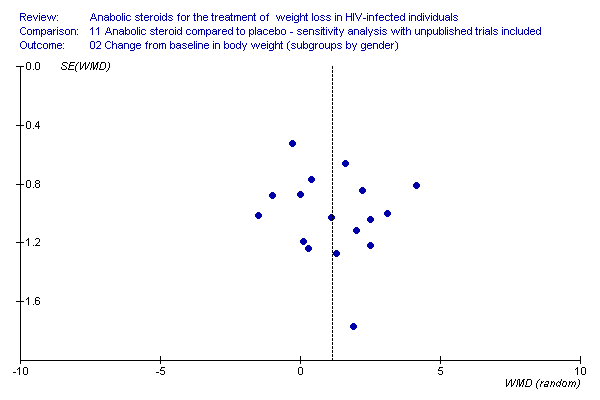
Figure 1. Funnel plot for change from baseline in body weight with unpublished trial included
Figuras y tablas -
Figure 3

Figure 1. Funnel plot for change from baseline in body weight with unpublished trial included

Comparison 1 Anabolic steroid compared to placebo ‐ primary analysis, Outcome 1 Change from baseline in lean body mass.
Figuras y tablas -
Analysis 1.1

Comparison 1 Anabolic steroid compared to placebo ‐ primary analysis, Outcome 1 Change from baseline in lean body mass.

Comparison 1 Anabolic steroid compared to placebo ‐ primary analysis, Outcome 2 Change from baseline in body weight.
Figuras y tablas -
Analysis 1.2

Comparison 1 Anabolic steroid compared to placebo ‐ primary analysis, Outcome 2 Change from baseline in body weight.

Comparison 1 Anabolic steroid compared to placebo ‐ primary analysis, Outcome 3 Deaths.
Figuras y tablas -
Analysis 1.3

Comparison 1 Anabolic steroid compared to placebo ‐ primary analysis, Outcome 3 Deaths.

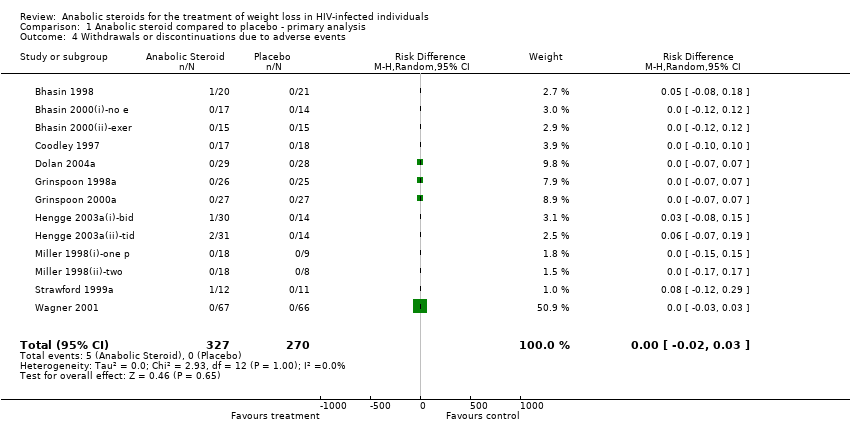
Comparison 1 Anabolic steroid compared to placebo ‐ primary analysis, Outcome 4 Withdrawals or discontinuations due to adverse events.
Figuras y tablas -
Analysis 1.4

Comparison 1 Anabolic steroid compared to placebo ‐ primary analysis, Outcome 4 Withdrawals or discontinuations due to adverse events.

Comparison 2 Anabolic steroid compared to placebo ‐ subgroups by gender, Outcome 1 Change from baseline in lean body mass.
Figuras y tablas -
Analysis 2.1

Comparison 2 Anabolic steroid compared to placebo ‐ subgroups by gender, Outcome 1 Change from baseline in lean body mass.

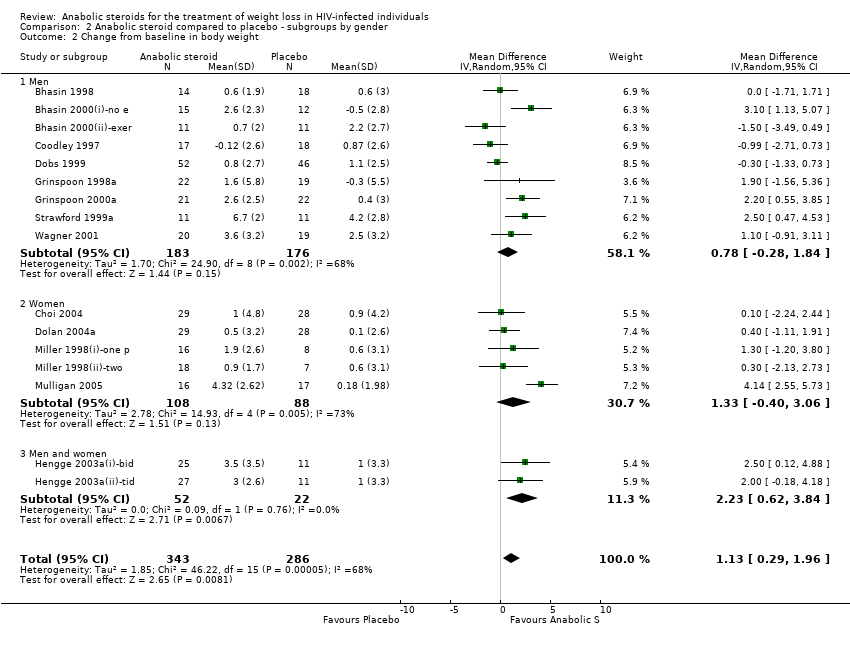
Comparison 2 Anabolic steroid compared to placebo ‐ subgroups by gender, Outcome 2 Change from baseline in body weight.
Figuras y tablas -
Analysis 2.2

Comparison 2 Anabolic steroid compared to placebo ‐ subgroups by gender, Outcome 2 Change from baseline in body weight.

Comparison 2 Anabolic steroid compared to placebo ‐ subgroups by gender, Outcome 3 Deaths.
Figuras y tablas -
Analysis 2.3

Comparison 2 Anabolic steroid compared to placebo ‐ subgroups by gender, Outcome 3 Deaths.

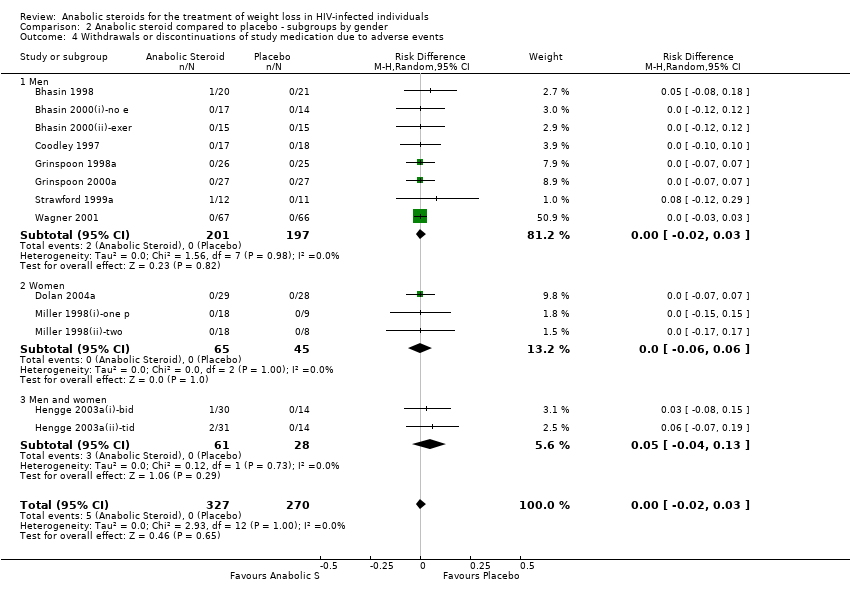
Comparison 2 Anabolic steroid compared to placebo ‐ subgroups by gender, Outcome 4 Withdrawals or discontinuations of study medication due to adverse events.
Figuras y tablas -
Analysis 2.4

Comparison 2 Anabolic steroid compared to placebo ‐ subgroups by gender, Outcome 4 Withdrawals or discontinuations of study medication due to adverse events.

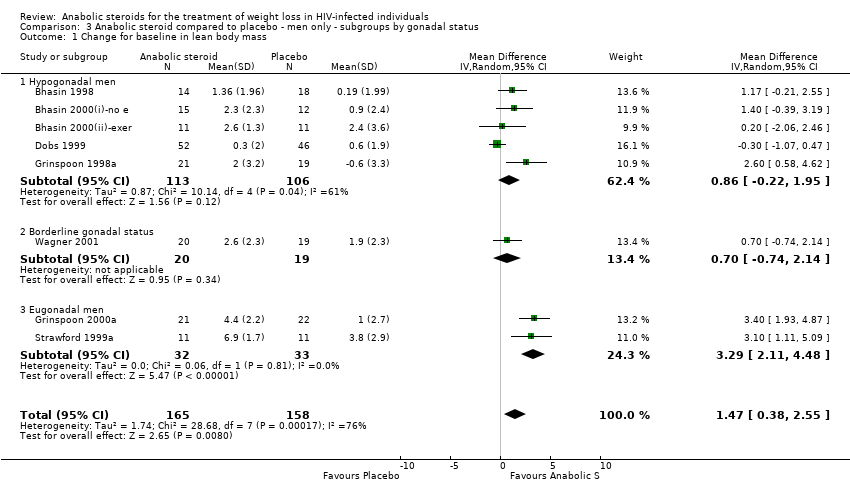
Comparison 3 Anabolic steroid compared to placebo ‐ men only ‐ subgroups by gonadal status, Outcome 1 Change for baseline in lean body mass.
Figuras y tablas -
Analysis 3.1

Comparison 3 Anabolic steroid compared to placebo ‐ men only ‐ subgroups by gonadal status, Outcome 1 Change for baseline in lean body mass.

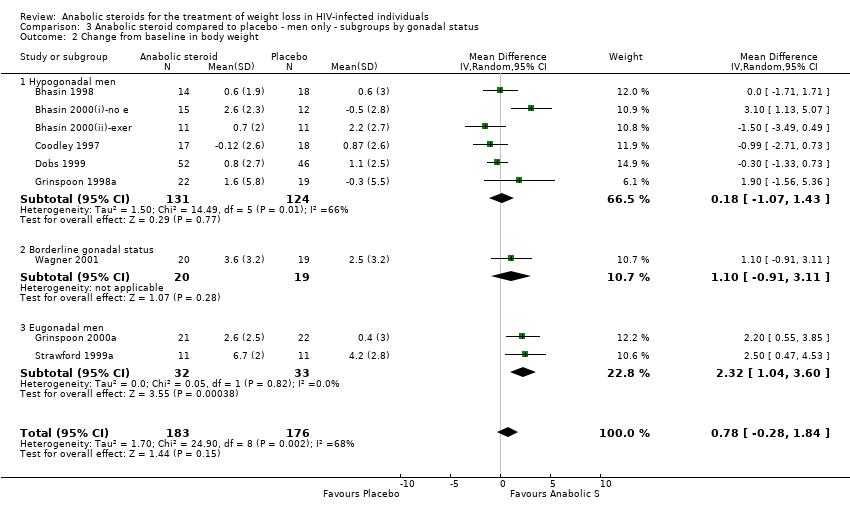
Comparison 3 Anabolic steroid compared to placebo ‐ men only ‐ subgroups by gonadal status, Outcome 2 Change from baseline in body weight.
Figuras y tablas -
Analysis 3.2

Comparison 3 Anabolic steroid compared to placebo ‐ men only ‐ subgroups by gonadal status, Outcome 2 Change from baseline in body weight.

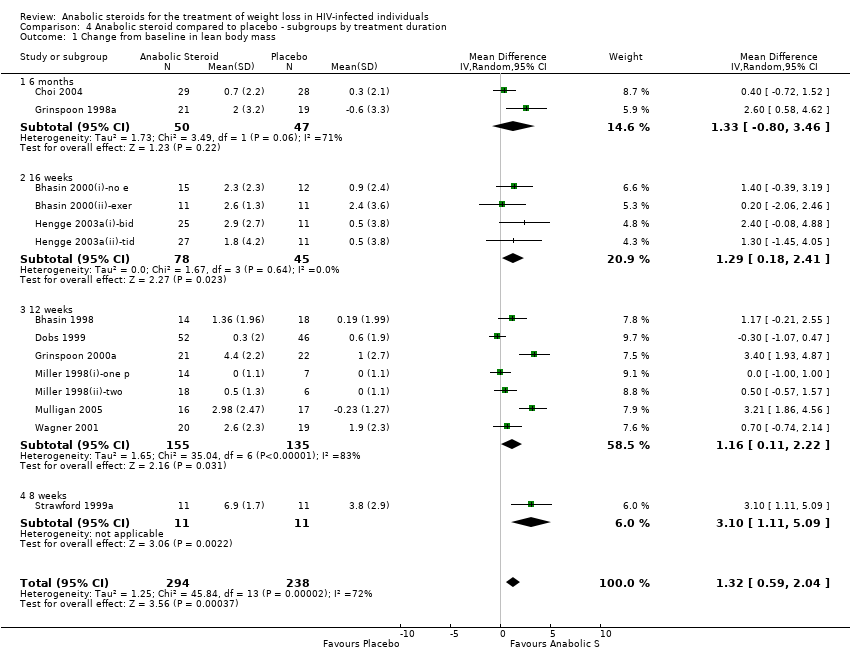
Comparison 4 Anabolic steroid compared to placebo ‐ subgroups by treatment duration, Outcome 1 Change from baseline in lean body mass.
Figuras y tablas -
Analysis 4.1

Comparison 4 Anabolic steroid compared to placebo ‐ subgroups by treatment duration, Outcome 1 Change from baseline in lean body mass.

Comparison 4 Anabolic steroid compared to placebo ‐ subgroups by treatment duration, Outcome 2 Change from baseline in body weight.
Figuras y tablas -
Analysis 4.2

Comparison 4 Anabolic steroid compared to placebo ‐ subgroups by treatment duration, Outcome 2 Change from baseline in body weight.

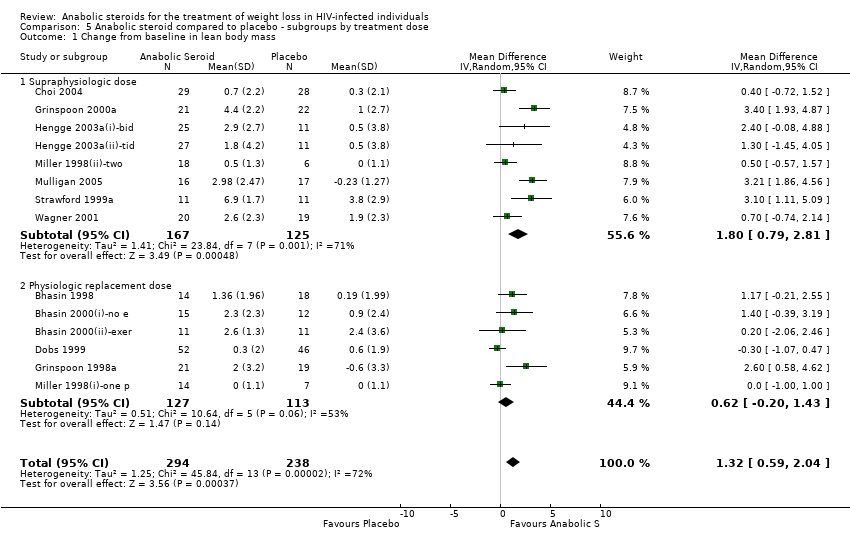
Comparison 5 Anabolic steroid compared to placebo ‐ subgroups by treatment dose, Outcome 1 Change from baseline in lean body mass.
Figuras y tablas -
Analysis 5.1

Comparison 5 Anabolic steroid compared to placebo ‐ subgroups by treatment dose, Outcome 1 Change from baseline in lean body mass.

Comparison 5 Anabolic steroid compared to placebo ‐ subgroups by treatment dose, Outcome 2 Change from baseline in body weight.
Figuras y tablas -
Analysis 5.2

Comparison 5 Anabolic steroid compared to placebo ‐ subgroups by treatment dose, Outcome 2 Change from baseline in body weight.

Comparison 6 Anabolic steroid compared to placebo ‐ subgroups by proportion of study participants on protease inhibitors, Outcome 1 Change from baseline in lean body mass.
Figuras y tablas -
Analysis 6.1

Comparison 6 Anabolic steroid compared to placebo ‐ subgroups by proportion of study participants on protease inhibitors, Outcome 1 Change from baseline in lean body mass.

Comparison 6 Anabolic steroid compared to placebo ‐ subgroups by proportion of study participants on protease inhibitors, Outcome 2 Change from baseline in body weight.
Figuras y tablas -
Analysis 6.2

Comparison 6 Anabolic steroid compared to placebo ‐ subgroups by proportion of study participants on protease inhibitors, Outcome 2 Change from baseline in body weight.

Comparison 7 Anabolic steroid compared to placebo ‐ subgroups by measurement technique, Outcome 1 Change from baseline in lean body mass.
Figuras y tablas -
Analysis 7.1

Comparison 7 Anabolic steroid compared to placebo ‐ subgroups by measurement technique, Outcome 1 Change from baseline in lean body mass.

Comparison 8 Anabolic steroid compared to placebo ‐ subgroups by methodologic quality score, Outcome 1 Change from baseline in lean body mass.
Figuras y tablas -
Analysis 8.1

Comparison 8 Anabolic steroid compared to placebo ‐ subgroups by methodologic quality score, Outcome 1 Change from baseline in lean body mass.

Comparison 8 Anabolic steroid compared to placebo ‐ subgroups by methodologic quality score, Outcome 2 Change from baseline in body weight.
Figuras y tablas -
Analysis 8.2

Comparison 8 Anabolic steroid compared to placebo ‐ subgroups by methodologic quality score, Outcome 2 Change from baseline in body weight.

Comparison 9 Anabolic steroid compared to placebo ‐ subgroups by adequacy of allocation concealment, Outcome 1 Change from baseline in lean body mass.
Figuras y tablas -
Analysis 9.1

Comparison 9 Anabolic steroid compared to placebo ‐ subgroups by adequacy of allocation concealment, Outcome 1 Change from baseline in lean body mass.

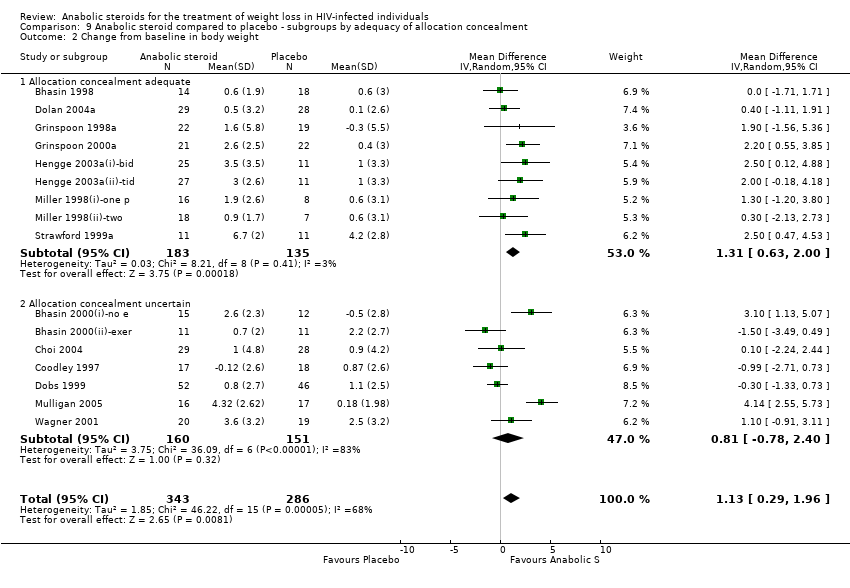
Comparison 9 Anabolic steroid compared to placebo ‐ subgroups by adequacy of allocation concealment, Outcome 2 Change from baseline in body weight.
Figuras y tablas -
Analysis 9.2

Comparison 9 Anabolic steroid compared to placebo ‐ subgroups by adequacy of allocation concealment, Outcome 2 Change from baseline in body weight.

Comparison 10 Anabolic steroid compared to placebo ‐ subgroups by score on randomization, Outcome 1 Change from baseline in lean body mass.
Figuras y tablas -
Analysis 10.1

Comparison 10 Anabolic steroid compared to placebo ‐ subgroups by score on randomization, Outcome 1 Change from baseline in lean body mass.

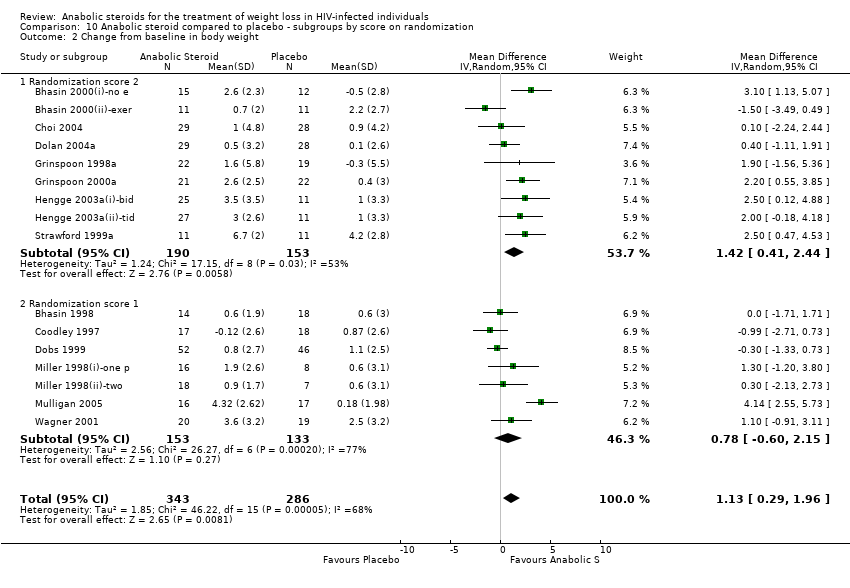
Comparison 10 Anabolic steroid compared to placebo ‐ subgroups by score on randomization, Outcome 2 Change from baseline in body weight.
Figuras y tablas -
Analysis 10.2

Comparison 10 Anabolic steroid compared to placebo ‐ subgroups by score on randomization, Outcome 2 Change from baseline in body weight.

Comparison 11 Anabolic steroid compared to placebo ‐ subgroups by score on description of withdrawals, Outcome 1 Change from baseline in lean body mass.
Figuras y tablas -
Analysis 11.1

Comparison 11 Anabolic steroid compared to placebo ‐ subgroups by score on description of withdrawals, Outcome 1 Change from baseline in lean body mass.

Comparison 11 Anabolic steroid compared to placebo ‐ subgroups by score on description of withdrawals, Outcome 2 Change from baseline in body weight.
Figuras y tablas -
Analysis 11.2

Comparison 11 Anabolic steroid compared to placebo ‐ subgroups by score on description of withdrawals, Outcome 2 Change from baseline in body weight.

Comparison 12 Anabolic steroid compared to placebo ‐ subgroups by total sample size of trial, Outcome 1 Change from baseline in lean body mass.
Figuras y tablas -
Analysis 12.1

Comparison 12 Anabolic steroid compared to placebo ‐ subgroups by total sample size of trial, Outcome 1 Change from baseline in lean body mass.

Comparison 12 Anabolic steroid compared to placebo ‐ subgroups by total sample size of trial, Outcome 2 Change from baseline in body weight.
Figuras y tablas -
Analysis 12.2

Comparison 12 Anabolic steroid compared to placebo ‐ subgroups by total sample size of trial, Outcome 2 Change from baseline in body weight.

Comparison 13 Anabolic steroid compared to placebo ‐ sensitivity analysis with unpublished trials included, Outcome 2 Change from baseline in body weight (subgroups by gender).
Figuras y tablas -
Analysis 13.2

Comparison 13 Anabolic steroid compared to placebo ‐ sensitivity analysis with unpublished trials included, Outcome 2 Change from baseline in body weight (subgroups by gender).

Comparison 14 Anabolic steroid compared to placebo ‐ sensitivity analysis with trials with quality score < 4 excluded, Outcome 1 Change from baseline in lean body mass.
Figuras y tablas -
Analysis 14.1

Comparison 14 Anabolic steroid compared to placebo ‐ sensitivity analysis with trials with quality score < 4 excluded, Outcome 1 Change from baseline in lean body mass.

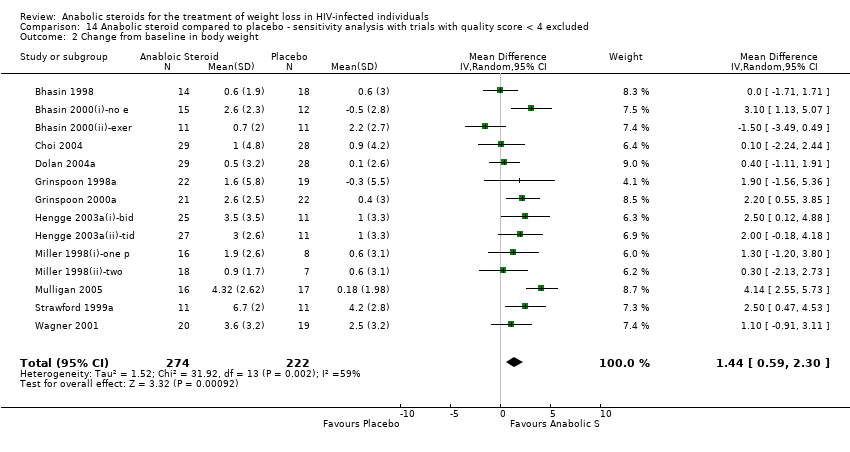
Comparison 14 Anabolic steroid compared to placebo ‐ sensitivity analysis with trials with quality score < 4 excluded, Outcome 2 Change from baseline in body weight.
Figuras y tablas -
Analysis 14.2

Comparison 14 Anabolic steroid compared to placebo ‐ sensitivity analysis with trials with quality score < 4 excluded, Outcome 2 Change from baseline in body weight.

Comparison 1. Anabolic steroid compared to placebo ‐ primary analysis

Outcome or subgroup title

No. of studies

No. of participants

Statistical method

Effect size

1 Change from baseline in lean body mass Show forest plot

14

532

Mean Difference (IV, Random, 95% CI)

1.32 [0.59, 2.04]

2 Change from baseline in body weight Show forest plot

16

629

Mean Difference (IV, Random, 95% CI)

1.13 [0.29, 1.96]

3 Deaths Show forest plot

13

512

Risk Difference (M‐H, Random, 95% CI)

0.00 [‐0.03, 0.03]

4 Withdrawals or discontinuations due to adverse events Show forest plot

13

597

Risk Difference (M‐H, Random, 95% CI)

0.00 [‐0.02, 0.03]

Figuras y tablas -
Comparison 1. Anabolic steroid compared to placebo ‐ primary analysis
Comparison 2. Anabolic steroid compared to placebo ‐ subgroups by gender

Outcome or subgroup title

No. of studies

No. of participants

Statistical method

Effect size

1 Change from baseline in lean body mass Show forest plot

14

532

Mean Difference (IV, Random, 95% CI)

1.32 [0.59, 2.04]

1.1 Men

8

323

Mean Difference (IV, Random, 95% CI)

1.47 [0.38, 2.55]

1.2 Women

4

135

Mean Difference (IV, Random, 95% CI)

0.97 [‐0.31, 2.24]

1.3 Men and women

2

74

Mean Difference (IV, Random, 95% CI)

1.91 [0.06, 3.75]

2 Change from baseline in body weight Show forest plot

16

629

Mean Difference (IV, Random, 95% CI)

1.13 [0.29, 1.96]

2.1 Men

9

359

Mean Difference (IV, Random, 95% CI)

0.78 [‐0.28, 1.84]

2.2 Women

5

196

Mean Difference (IV, Random, 95% CI)

1.33 [‐0.40, 3.06]

2.3 Men and women

2

74

Mean Difference (IV, Random, 95% CI)

2.23 [0.62, 3.84]

3 Deaths Show forest plot

13

512

Risk Difference (M‐H, Random, 95% CI)

0.00 [‐0.03, 0.03]

3.1 Men

7

275

Risk Difference (M‐H, Random, 95% CI)

‐0.00 [‐0.04, 0.04]

3.2 Women

4

148

Risk Difference (M‐H, Random, 95% CI)

0.01 [‐0.04, 0.07]

3.3 Men and women

2

89

Risk Difference (M‐H, Random, 95% CI)

0.0 [‐0.07, 0.07]

4 Withdrawals or discontinuations of study medication due to adverse events Show forest plot

13

597

Risk Difference (M‐H, Random, 95% CI)

0.00 [‐0.02, 0.03]

4.1 Men

8

398

Risk Difference (M‐H, Random, 95% CI)

0.00 [‐0.02, 0.03]

4.2 Women

3

110

Risk Difference (M‐H, Random, 95% CI)

0.0 [‐0.06, 0.06]

4.3 Men and women

2

89

Risk Difference (M‐H, Random, 95% CI)

0.05 [‐0.04, 0.13]

Figuras y tablas -
Comparison 2. Anabolic steroid compared to placebo ‐ subgroups by gender
Comparison 3. Anabolic steroid compared to placebo ‐ men only ‐ subgroups by gonadal status

Outcome or subgroup title

No. of studies

No. of participants

Statistical method

Effect size

1 Change for baseline in lean body mass Show forest plot

8

323

Mean Difference (IV, Random, 95% CI)

1.47 [0.38, 2.55]

1.1 Hypogonadal men

5

219

Mean Difference (IV, Random, 95% CI)

0.86 [‐0.22, 1.95]

1.2 Borderline gonadal status

1

39

Mean Difference (IV, Random, 95% CI)

0.70 [‐0.74, 2.14]

1.3 Eugonadal men

2

65

Mean Difference (IV, Random, 95% CI)

3.29 [2.11, 4.48]

2 Change from baseline in body weight Show forest plot

9

359

Mean Difference (IV, Random, 95% CI)

0.78 [‐0.28, 1.84]

2.1 Hypogonadal men

6

255

Mean Difference (IV, Random, 95% CI)

0.18 [‐1.07, 1.43]

2.2 Borderline gonadal status

1

39

Mean Difference (IV, Random, 95% CI)

1.1 [‐0.91, 3.11]

2.3 Eugonadal men

2

65

Mean Difference (IV, Random, 95% CI)

2.32 [1.04, 3.60]

Figuras y tablas -
Comparison 3. Anabolic steroid compared to placebo ‐ men only ‐ subgroups by gonadal status
Comparison 4. Anabolic steroid compared to placebo ‐ subgroups by treatment duration

Outcome or subgroup title

No. of studies

No. of participants

Statistical method

Effect size

1 Change from baseline in lean body mass Show forest plot

14

532

Mean Difference (IV, Random, 95% CI)

1.32 [0.59, 2.04]

1.1 6 months

2

97

Mean Difference (IV, Random, 95% CI)

1.33 [‐0.80, 3.46]

1.2 16 weeks

4

123

Mean Difference (IV, Random, 95% CI)

1.29 [0.18, 2.41]

1.3 12 weeks

7

290

Mean Difference (IV, Random, 95% CI)

1.16 [0.11, 2.22]

1.4 8 weeks

1

22

Mean Difference (IV, Random, 95% CI)

3.10 [1.11, 5.09]

2 Change from baseline in body weight Show forest plot

16

629

Mean Difference (IV, Random, 95% CI)

1.13 [0.29, 1.96]

2.1 6 months

3

155

Mean Difference (IV, Random, 95% CI)

0.50 [‐0.69, 1.69]

2.2 16 weeks

4

123

Mean Difference (IV, Random, 95% CI)

1.50 [‐0.64, 3.64]

2.3 12 weeks

8

329

Mean Difference (IV, Random, 95% CI)

0.96 [‐0.29, 2.21]

2.4 8 weeks

1

22

Mean Difference (IV, Random, 95% CI)

2.5 [0.47, 4.53]

Figuras y tablas -
Comparison 4. Anabolic steroid compared to placebo ‐ subgroups by treatment duration
Comparison 5. Anabolic steroid compared to placebo ‐ subgroups by treatment dose

Outcome or subgroup title

No. of studies

No. of participants

Statistical method

Effect size

1 Change from baseline in lean body mass Show forest plot

14

532

Mean Difference (IV, Random, 95% CI)

1.32 [0.59, 2.04]

1.1 Supraphysiologic dose

8

292

Mean Difference (IV, Random, 95% CI)

1.80 [0.79, 2.81]

1.2 Physiologic replacement dose

6

240

Mean Difference (IV, Random, 95% CI)

0.62 [‐0.20, 1.43]

2 Change from baseline in body weight Show forest plot

16

629

Mean Difference (IV, Random, 95% CI)

1.13 [0.29, 1.96]

2.1 Supraphysiologic dose

7

236

Mean Difference (IV, Random, 95% CI)

2.25 [1.31, 3.19]

2.3 Physiologic replacement dose

9

393

Mean Difference (IV, Random, 95% CI)

0.26 [‐0.60, 1.12]

Figuras y tablas -
Comparison 5. Anabolic steroid compared to placebo ‐ subgroups by treatment dose
Comparison 6. Anabolic steroid compared to placebo ‐ subgroups by proportion of study participants on protease inhibitors

Outcome or subgroup title

No. of studies

No. of participants

Statistical method

Effect size

1 Change from baseline in lean body mass Show forest plot

8

261

Mean Difference (IV, Random, 95% CI)

2.43 [1.67, 3.20]

1.1 Proportion on proteases inhibitors less than 60%

5

144

Mean Difference (IV, Random, 95% CI)

2.24 [1.18, 3.31]

1.2 Proportion on proteases inhibitors 60% or greater

3

117

Mean Difference (IV, Random, 95% CI)

2.82 [1.67, 3.97]

2 Change from baseline in body weight Show forest plot

9

319

Mean Difference (IV, Random, 95% CI)

1.92 [0.75, 3.08]

2.1 Proportion on protease inhibitors less than 60%

5

145

Mean Difference (IV, Random, 95% CI)

2.07 [‐0.02, 4.15]

2.2 Proportion on protease inhibitors 60% or greater

4

174

Mean Difference (IV, Random, 95% CI)

1.59 [0.57, 2.60]

Figuras y tablas -
Comparison 6. Anabolic steroid compared to placebo ‐ subgroups by proportion of study participants on protease inhibitors
Comparison 7. Anabolic steroid compared to placebo ‐ subgroups by measurement technique

Outcome or subgroup title

No. of studies

No. of participants

Statistical method

Effect size

1 Change from baseline in lean body mass Show forest plot

14

532

Mean Difference (IV, Random, 95% CI)

1.32 [0.59, 2.04]

1.1 Measurement by DEXA

9

288

Mean Difference (IV, Random, 95% CI)

1.31 [0.47, 2.14]

1.2 Measurement by BIA

5

244

Mean Difference (IV, Random, 95% CI)

1.37 [‐0.21, 2.96]

Figuras y tablas -
Comparison 7. Anabolic steroid compared to placebo ‐ subgroups by measurement technique
Comparison 8. Anabolic steroid compared to placebo ‐ subgroups by methodologic quality score

Outcome or subgroup title

No. of studies

No. of participants

Statistical method

Effect size

1 Change from baseline in lean body mass Show forest plot

14

532

Mean Difference (IV, Random, 95% CI)

1.32 [0.59, 2.04]

1.1 Quality score 5

7

228

Mean Difference (IV, Random, 95% CI)

2.23 [1.36, 3.09]

1.2 Quality score 4

6

206

Mean Difference (IV, Random, 95% CI)

0.94 [0.07, 1.82]

1.3 Quality score 3

1

98

Mean Difference (IV, Random, 95% CI)

‐0.3 [‐1.07, 0.47]

2 Change from baseline in body weight Show forest plot

16

629

Mean Difference (IV, Random, 95% CI)

1.13 [0.29, 1.96]

2.1 Quality score 5

8

286

Mean Difference (IV, Random, 95% CI)

1.57 [0.49, 2.66]

2.2 Quality score 4

6

210

Mean Difference (IV, Random, 95% CI)

1.24 [‐0.26, 2.73]

2.3 Quality score 3

2

133

Mean Difference (IV, Random, 95% CI)

‐0.48 [‐1.37, 0.40]

Figuras y tablas -
Comparison 8. Anabolic steroid compared to placebo ‐ subgroups by methodologic quality score
Comparison 9. Anabolic steroid compared to placebo ‐ subgroups by adequacy of allocation concealment

Outcome or subgroup title

No. of studies

No. of participants

Statistical method

Effect size

1 Change from baseline in lean body mass Show forest plot

14

532

Mean Difference (IV, Random, 95% CI)

1.32 [0.59, 2.04]

1.1 Allocation concealment adequate

8

256

Mean Difference (IV, Random, 95% CI)

1.67 [0.67, 2.67]

1.2 Allocation concealment uncertain

6

276

Mean Difference (IV, Random, 95% CI)

0.91 [‐0.19, 2.01]

2 Change from baseline in body weight Show forest plot

16

629

Mean Difference (IV, Random, 95% CI)

1.13 [0.29, 1.96]

2.1 Allocation concealment adequate

9

318

Mean Difference (IV, Random, 95% CI)

1.31 [0.63, 2.00]

2.2 Allocation concealment uncertain

7

311

Mean Difference (IV, Random, 95% CI)

0.81 [‐0.78, 2.40]

Figuras y tablas -
Comparison 9. Anabolic steroid compared to placebo ‐ subgroups by adequacy of allocation concealment
Comparison 10. Anabolic steroid compared to placebo ‐ subgroups by score on randomization

Outcome or subgroup title

No. of studies

No. of participants

Statistical method

Effect size

1 Change from baseline in lean body mass Show forest plot

14

532

Mean Difference (IV, Random, 95% CI)

1.32 [0.59, 2.04]

1.1 Randomization score 2

8

285

Mean Difference (IV, Random, 95% CI)

1.84 [0.86, 2.81]

1.2 Randomization score 1

6

247

Mean Difference (IV, Random, 95% CI)

0.80 [‐0.15, 1.75]

2 Change from baseline in body weight Show forest plot

16

629

Mean Difference (IV, Random, 95% CI)

1.13 [0.29, 1.96]

2.1 Randomization score 2

9

343

Mean Difference (IV, Random, 95% CI)

1.42 [0.41, 2.44]

2.2 Randomization score 1

7

286

Mean Difference (IV, Random, 95% CI)

0.78 [‐0.60, 2.15]

Figuras y tablas -
Comparison 10. Anabolic steroid compared to placebo ‐ subgroups by score on randomization
Comparison 11. Anabolic steroid compared to placebo ‐ subgroups by score on description of withdrawals

Outcome or subgroup title

No. of studies

No. of participants

Statistical method

Effect size

1 Change from baseline in lean body mass Show forest plot

14

532

Mean Difference (IV, Random, 95% CI)

1.32 [0.59, 2.04]

1.1 Description of withdrawals score 1

12

377

Mean Difference (IV, Random, 95% CI)

1.60 [0.82, 2.38]

1.2 Description of withdrawals score 0

2

155

Mean Difference (IV, Random, 95% CI)

‐0.07 [‐0.71, 0.57]

2 Change from baseline in body weight Show forest plot

16

629

Mean Difference (IV, Random, 95% CI)

1.13 [0.29, 1.96]

2.1 Description of withdrawals score 1

13

439

Mean Difference (IV, Random, 95% CI)

1.54 [0.64, 2.43]

2.2 Description of withdrawals score 0

3

190

Mean Difference (IV, Random, 95% CI)

‐0.41 [‐1.24, 0.42]

Figuras y tablas -
Comparison 11. Anabolic steroid compared to placebo ‐ subgroups by score on description of withdrawals
Comparison 12. Anabolic steroid compared to placebo ‐ subgroups by total sample size of trial

Outcome or subgroup title

No. of studies

No. of participants

Statistical method

Effect size

1 Change from baseline in lean body mass Show forest plot

14

532

Mean Difference (IV, Random, 95% CI)

1.32 [0.59, 2.04]

1.1 Sample size less than 40

2

55

Mean Difference (IV, Random, 95% CI)

3.18 [2.06, 4.29]

1.2 Sample size 40 to 49

2

71

Mean Difference (IV, Random, 95% CI)

0.95 [‐0.05, 1.94]

1.3 Sample size 50 to 59

5

185

Mean Difference (IV, Random, 95% CI)

1.24 [0.03, 2.44]

1.4 Sample size 60 or greater

5

221

Mean Difference (IV, Random, 95% CI)

0.68 [‐0.39, 1.74]

2 Change from baseline in body weight Show forest plot

16

629

Mean Difference (IV, Random, 95% CI)

1.13 [0.29, 1.96]

2.1 Sample size less than 40

3

90

Mean Difference (IV, Random, 95% CI)

1.89 [‐1.25, 5.02]

2.2 Sample size 40 to 49

2

71

Mean Difference (IV, Random, 95% CI)

0.46 [‐0.84, 1.76]

2.3 Sample size 50 to 59

6

247

Mean Difference (IV, Random, 95% CI)

1.01 [0.17, 1.86]

2.4 Sample size 60 or greater

5

221

Mean Difference (IV, Random, 95% CI)

1.06 [‐0.65, 2.76]

Figuras y tablas -
Comparison 12. Anabolic steroid compared to placebo ‐ subgroups by total sample size of trial
Comparison 13. Anabolic steroid compared to placebo ‐ sensitivity analysis with unpublished trials included

Outcome or subgroup title

No. of studies

No. of participants

Statistical method

Effect size

2 Change from baseline in body weight (subgroups by gender) Show forest plot

17

685

Mean Difference (IV, Random, 95% CI)

1.16 [0.39, 1.93]

2.1 Men

10

415

Mean Difference (IV, Random, 95% CI)

0.87 [‐0.08, 1.83]

2.2 Women

5

196

Mean Difference (IV, Random, 95% CI)

1.33 [‐0.40, 3.06]

2.3 Men and women

2

74

Mean Difference (IV, Random, 95% CI)

2.23 [0.62, 3.84]

Figuras y tablas -
Comparison 13. Anabolic steroid compared to placebo ‐ sensitivity analysis with unpublished trials included
Comparison 14. Anabolic steroid compared to placebo ‐ sensitivity analysis with trials with quality score < 4 excluded

Outcome or subgroup title

No. of studies

No. of participants

Statistical method

Effect size

1 Change from baseline in lean body mass Show forest plot

13

434

Mean Difference (IV, Random, 95% CI)

1.48 [0.76, 2.20]

2 Change from baseline in body weight Show forest plot

14

496

Mean Difference (IV, Random, 95% CI)

1.44 [0.59, 2.30]

Figuras y tablas -
Comparison 14. Anabolic steroid compared to placebo ‐ sensitivity analysis with trials with quality score < 4 excluded