Scolaris Content Display Scolaris Content Display

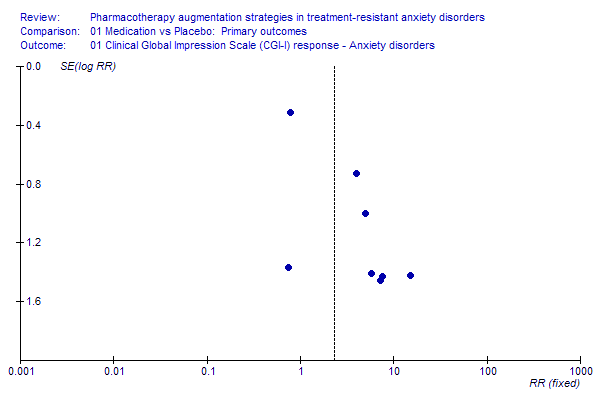
Pub Bias ‐ Response.Evidence of small sample effect on the CGI‐I
Figuras y tablas -
Figure 1

Pub Bias ‐ Response.

Evidence of small sample effect on the CGI‐I

Pub Bias ‐ Symptoms.Evidence of small sample effect on measures of symptom severity
Figuras y tablas -
Figure 2

Pub Bias ‐ Symptoms.

Evidence of small sample effect on measures of symptom severity

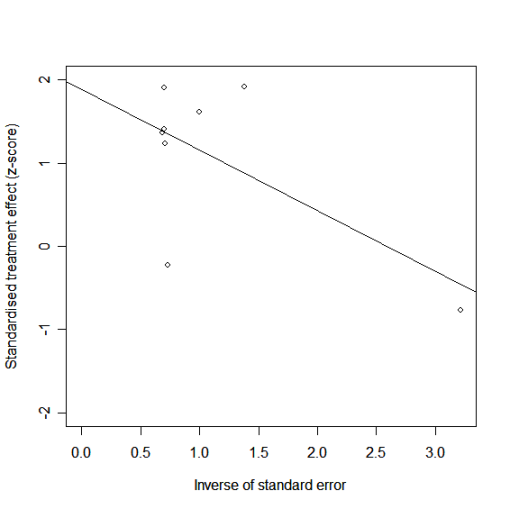
Egger plot (CGI‐I).Regression of standardised treatment estimate for treatment response on measure of precision
Figuras y tablas -
Figure 3

Egger plot (CGI‐I).

Regression of standardised treatment estimate for treatment response on measure of precision

Egger plot (SMD).Regression of standardised treatment estimate for continuous outcomes on measure of precision
Figuras y tablas -
Figure 4

Egger plot (SMD).

Regression of standardised treatment estimate for continuous outcomes on measure of precision

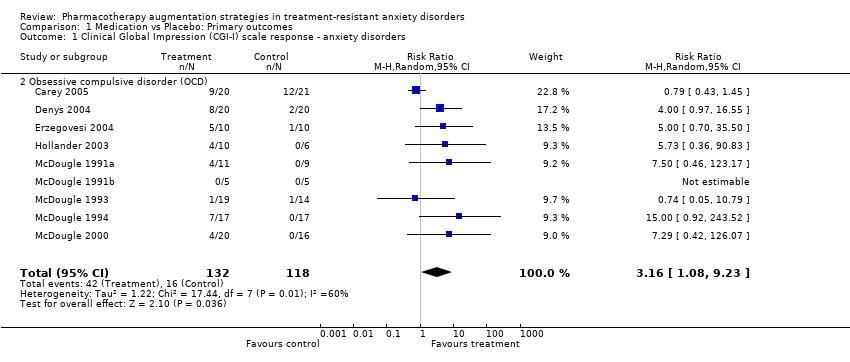
Comparison 1 Medication vs Placebo: Primary outcomes, Outcome 1 Clinical Global Impression (CGI‐I) scale response ‐ anxiety disorders.
Figuras y tablas -
Analysis 1.1

Comparison 1 Medication vs Placebo: Primary outcomes, Outcome 1 Clinical Global Impression (CGI‐I) scale response ‐ anxiety disorders.

Comparison 1 Medication vs Placebo: Primary outcomes, Outcome 2 Clinical Global Impressions (CGI‐I) scale response ‐ augmentation agents.
Figuras y tablas -
Analysis 1.2

Comparison 1 Medication vs Placebo: Primary outcomes, Outcome 2 Clinical Global Impressions (CGI‐I) scale response ‐ augmentation agents.

Comparison 1 Medication vs Placebo: Primary outcomes, Outcome 3 Clinical Global Impressions (CGI‐I) scale response ‐ antipsychotics.
Figuras y tablas -
Analysis 1.3

Comparison 1 Medication vs Placebo: Primary outcomes, Outcome 3 Clinical Global Impressions (CGI‐I) scale response ‐ antipsychotics.

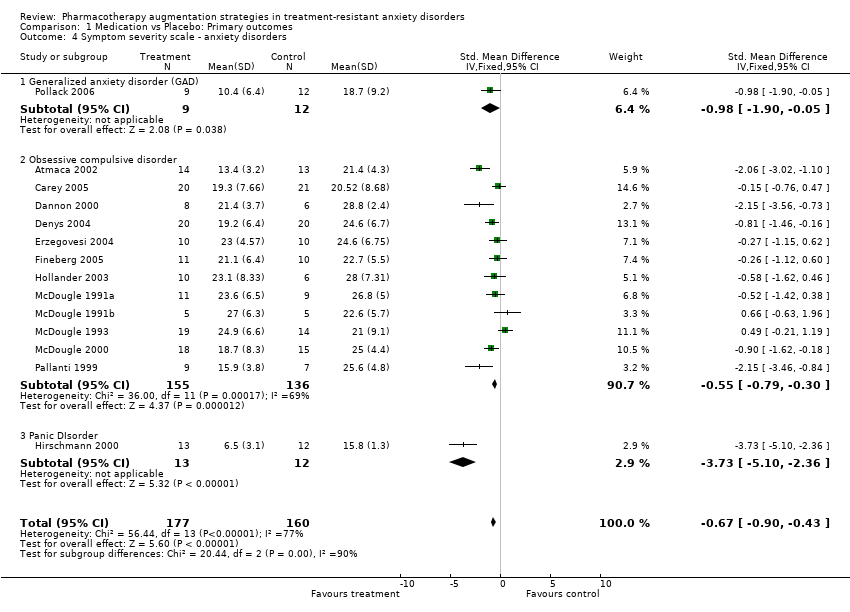
Comparison 1 Medication vs Placebo: Primary outcomes, Outcome 4 Symptom severity scale ‐ anxiety disorders.
Figuras y tablas -
Analysis 1.4

Comparison 1 Medication vs Placebo: Primary outcomes, Outcome 4 Symptom severity scale ‐ anxiety disorders.

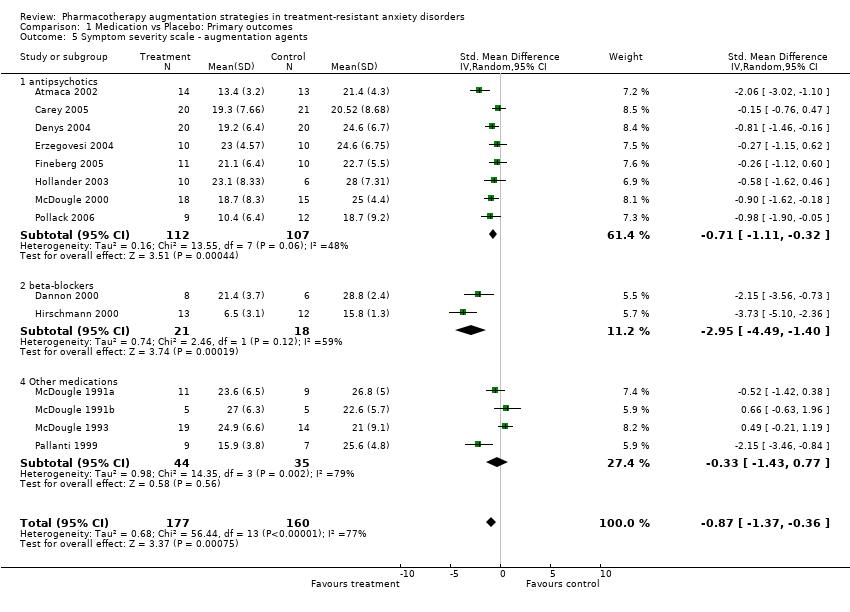
Comparison 1 Medication vs Placebo: Primary outcomes, Outcome 5 Symptom severity scale ‐ augmentation agents.
Figuras y tablas -
Analysis 1.5

Comparison 1 Medication vs Placebo: Primary outcomes, Outcome 5 Symptom severity scale ‐ augmentation agents.

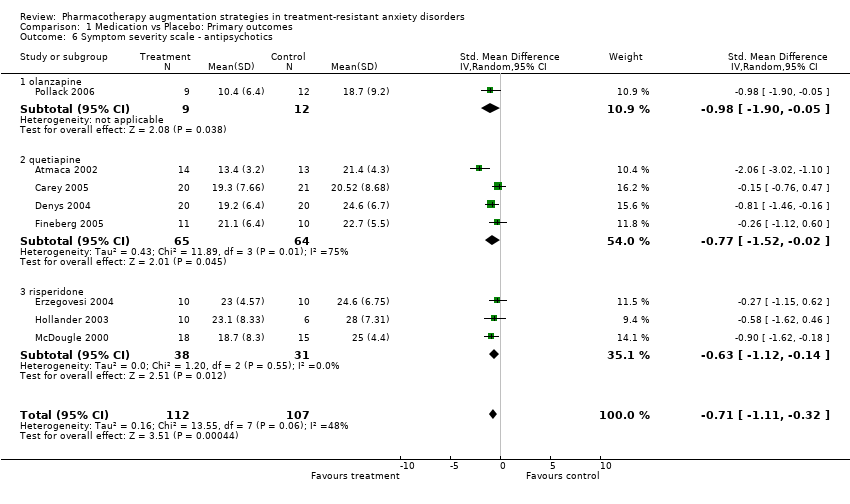
Comparison 1 Medication vs Placebo: Primary outcomes, Outcome 6 Symptom severity scale ‐ antipsychotics.
Figuras y tablas -
Analysis 1.6

Comparison 1 Medication vs Placebo: Primary outcomes, Outcome 6 Symptom severity scale ‐ antipsychotics.

Comparison 2 Medication vs Placebo: Comorbid symptoms, Outcome 1 Depression scale (typically Hamilton Depression Scale) ‐ Anxiety disorders.
Figuras y tablas -
Analysis 2.1

Comparison 2 Medication vs Placebo: Comorbid symptoms, Outcome 1 Depression scale (typically Hamilton Depression Scale) ‐ Anxiety disorders.

Comparison 2 Medication vs Placebo: Comorbid symptoms, Outcome 2 Depression scale (typically Hamilton Depression Scale) ‐ Augmentation agents.
Figuras y tablas -
Analysis 2.2

Comparison 2 Medication vs Placebo: Comorbid symptoms, Outcome 2 Depression scale (typically Hamilton Depression Scale) ‐ Augmentation agents.

Comparison 2 Medication vs Placebo: Comorbid symptoms, Outcome 3 Hamilton Anxiety Rating Scale (HAM‐A) ‐ Anxiety disorders.
Figuras y tablas -
Analysis 2.3

Comparison 2 Medication vs Placebo: Comorbid symptoms, Outcome 3 Hamilton Anxiety Rating Scale (HAM‐A) ‐ Anxiety disorders.

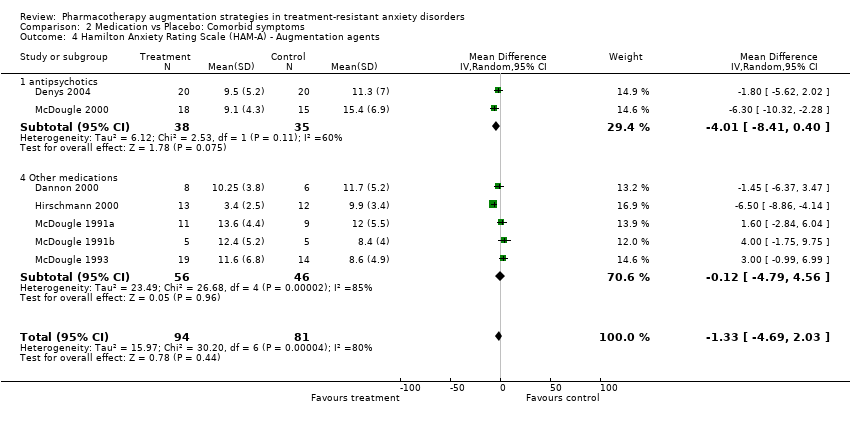
Comparison 2 Medication vs Placebo: Comorbid symptoms, Outcome 4 Hamilton Anxiety Rating Scale (HAM‐A) ‐ Augmentation agents.
Figuras y tablas -
Analysis 2.4

Comparison 2 Medication vs Placebo: Comorbid symptoms, Outcome 4 Hamilton Anxiety Rating Scale (HAM‐A) ‐ Augmentation agents.

Comparison 3 Medication vs Placebo: Quality of Life Scales, Outcome 1 Sheehan Disability Scale.
Figuras y tablas -
Analysis 3.1

Comparison 3 Medication vs Placebo: Quality of Life Scales, Outcome 1 Sheehan Disability Scale.

Comparison 4 Medication vs Placebo: Drop‐out Rate, Outcome 1 Drop‐out rate due to treatment emergent adverse effects.
Figuras y tablas -
Analysis 4.1

Comparison 4 Medication vs Placebo: Drop‐out Rate, Outcome 1 Drop‐out rate due to treatment emergent adverse effects.

Comparison 5 Subgroup analyses ‐ Methodological criteria, Outcome 5 Industry versus non‐industry funded trials.
Figuras y tablas -
Analysis 5.5

Comparison 5 Subgroup analyses ‐ Methodological criteria, Outcome 5 Industry versus non‐industry funded trials.

Comparison 5 Subgroup analyses ‐ Methodological criteria, Outcome 7 Industry versus non‐industry funded trials.
Figuras y tablas -
Analysis 5.7

Comparison 5 Subgroup analyses ‐ Methodological criteria, Outcome 7 Industry versus non‐industry funded trials.

Comparison 6 Subgroup analyses ‐ Clinical criteria, Outcome 1 Inclusion of major depression vs. non‐inclusion: CGI‐I.
Figuras y tablas -
Analysis 6.1

Comparison 6 Subgroup analyses ‐ Clinical criteria, Outcome 1 Inclusion of major depression vs. non‐inclusion: CGI‐I.

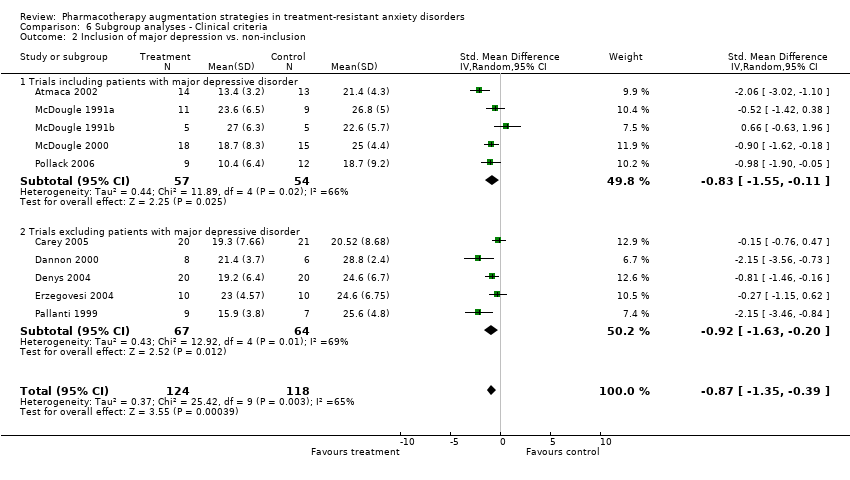
Comparison 6 Subgroup analyses ‐ Clinical criteria, Outcome 2 Inclusion of major depression vs. non‐inclusion.
Figuras y tablas -
Analysis 6.2

Comparison 6 Subgroup analyses ‐ Clinical criteria, Outcome 2 Inclusion of major depression vs. non‐inclusion.

Comparison 6 Subgroup analyses ‐ Clinical criteria, Outcome 3 Adequate previous trials versus inadequate trials: CGI‐I.
Figuras y tablas -
Analysis 6.3

Comparison 6 Subgroup analyses ‐ Clinical criteria, Outcome 3 Adequate previous trials versus inadequate trials: CGI‐I.

Comparison 6 Subgroup analyses ‐ Clinical criteria, Outcome 4 Adequate previous trials versus inadequate trials.
Figuras y tablas -
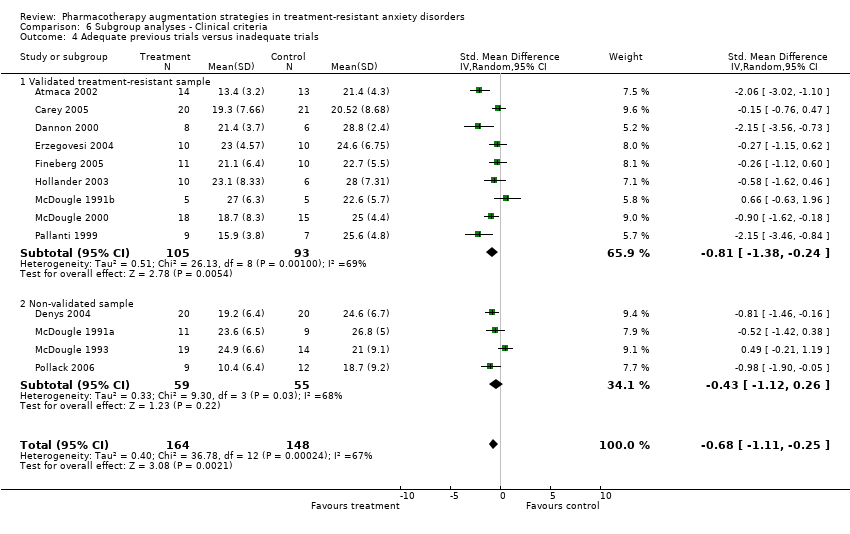
Analysis 6.4

Comparison 6 Subgroup analyses ‐ Clinical criteria, Outcome 4 Adequate previous trials versus inadequate trials.

Comparison 6 Subgroup analyses ‐ Clinical criteria, Outcome 5 Non‐responders versus partial responders: CGI‐I.
Figuras y tablas -
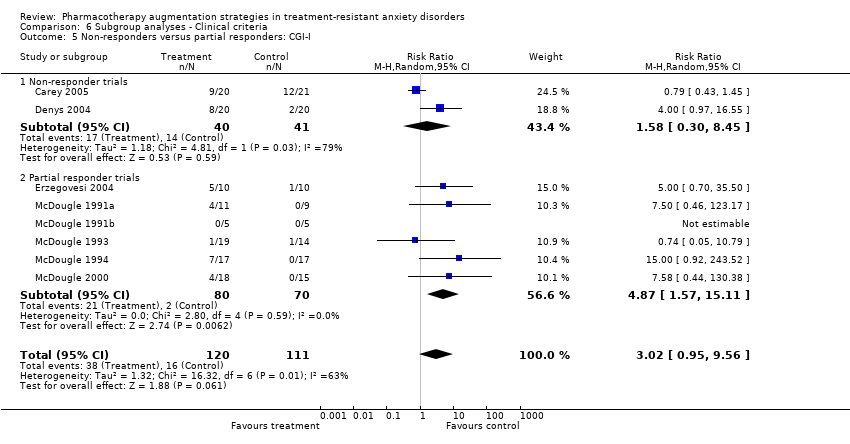
Analysis 6.5

Comparison 6 Subgroup analyses ‐ Clinical criteria, Outcome 5 Non‐responders versus partial responders: CGI‐I.

Comparison 6 Subgroup analyses ‐ Clinical criteria, Outcome 6 Non‐responders versus partial responders.
Figuras y tablas -
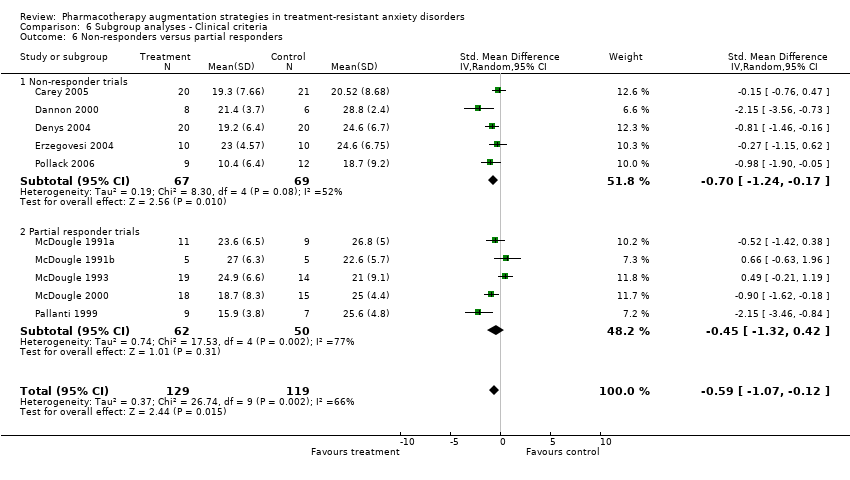
Analysis 6.6

Comparison 6 Subgroup analyses ‐ Clinical criteria, Outcome 6 Non‐responders versus partial responders.

Comparison 1. Medication vs Placebo: Primary outcomes

Outcome or subgroup title

No. of studies

No. of participants

Statistical method

Effect size

1 Clinical Global Impression (CGI‐I) scale response ‐ anxiety disorders Show forest plot

9

250

Risk Ratio (M‐H, Random, 95% CI)

3.16 [1.08, 9.23]

1.2 Obsessive compulsive disorder (OCD)

9

250

Risk Ratio (M‐H, Random, 95% CI)

3.16 [1.08, 9.23]

2 Clinical Global Impressions (CGI‐I) scale response ‐ augmentation agents Show forest plot

9

250

Risk Ratio (M‐H, Random, 95% CI)

3.16 [1.08, 9.23]

2.1 antipsychotics

6

187

Risk Ratio (M‐H, Random, 95% CI)

3.55 [0.99, 12.72]

2.4 Other medications

3

63

Risk Ratio (M‐H, Random, 95% CI)

2.27 [0.22, 23.37]

3 Clinical Global Impressions (CGI‐I) scale response ‐ antipsychotics Show forest plot

6

187

Risk Ratio (M‐H, Random, 95% CI)

3.55 [0.99, 12.72]

3.1 haloperidol

1

34

Risk Ratio (M‐H, Random, 95% CI)

15.0 [0.92, 243.52]

3.2 quetiapine

2

81

Risk Ratio (M‐H, Random, 95% CI)

1.58 [0.30, 8.45]

3.3 risperidone

3

72

Risk Ratio (M‐H, Random, 95% CI)

5.66 [1.40, 22.84]

4 Symptom severity scale ‐ anxiety disorders Show forest plot

14

337

Std. Mean Difference (IV, Fixed, 95% CI)

‐0.67 [‐0.90, ‐0.43]

4.1 Generalized anxiety disorder (GAD)

1

21

Std. Mean Difference (IV, Fixed, 95% CI)

‐0.98 [‐1.90, ‐0.05]

4.2 Obsessive compulsive disorder

12

291

Std. Mean Difference (IV, Fixed, 95% CI)

‐0.55 [‐0.79, ‐0.30]

4.3 Panic DIsorder

1

25

Std. Mean Difference (IV, Fixed, 95% CI)

‐3.73 [‐5.10, ‐2.36]

5 Symptom severity scale ‐ augmentation agents Show forest plot

14

337

Std. Mean Difference (IV, Random, 95% CI)

‐0.87 [‐1.37, ‐0.36]

5.1 antipsychotics

8

219

Std. Mean Difference (IV, Random, 95% CI)

‐0.71 [‐1.11, ‐0.32]

5.2 beta‐blockers

2

39

Std. Mean Difference (IV, Random, 95% CI)

‐2.95 [‐4.49, ‐1.40]

5.4 Other medications

4

79

Std. Mean Difference (IV, Random, 95% CI)

‐0.33 [‐1.43, 0.77]

6 Symptom severity scale ‐ antipsychotics Show forest plot

8

219

Std. Mean Difference (IV, Random, 95% CI)

‐0.71 [‐1.11, ‐0.32]

6.1 olanzapine

1

21

Std. Mean Difference (IV, Random, 95% CI)

‐0.98 [‐1.90, ‐0.05]

6.2 quetiapine

4

129

Std. Mean Difference (IV, Random, 95% CI)

‐0.77 [‐1.52, ‐0.02]

6.3 risperidone

3

69

Std. Mean Difference (IV, Random, 95% CI)

‐0.63 [‐1.12, ‐0.14]

Figuras y tablas -
Comparison 1. Medication vs Placebo: Primary outcomes
Comparison 2. Medication vs Placebo: Comorbid symptoms

Outcome or subgroup title

No. of studies

No. of participants

Statistical method

Effect size

1 Depression scale (typically Hamilton Depression Scale) ‐ Anxiety disorders Show forest plot

13

310

Std. Mean Difference (IV, Random, 95% CI)

‐0.23 [‐0.70, 0.23]

1.1 Generalized anxiety disorder (GAD)

1

21

Std. Mean Difference (IV, Random, 95% CI)

‐0.91 [‐1.83, 0.01]

1.2 Obsessive compulsive disorder

11

264

Std. Mean Difference (IV, Random, 95% CI)

‐0.04 [‐0.49, 0.41]

1.3 Panic Disorder

1

25

Std. Mean Difference (IV, Random, 95% CI)

‐1.87 [‐2.83, ‐0.90]

2 Depression scale (typically Hamilton Depression Scale) ‐ Augmentation agents Show forest plot

13

310

Std. Mean Difference (IV, Random, 95% CI)

‐0.23 [‐0.70, 0.23]

2.1 antipsychotics

7

192

Std. Mean Difference (IV, Random, 95% CI)

‐0.23 [‐0.88, 0.42]

2.4 Other medications

6

118

Std. Mean Difference (IV, Random, 95% CI)

‐0.24 [‐0.96, 0.49]

3 Hamilton Anxiety Rating Scale (HAM‐A) ‐ Anxiety disorders Show forest plot

7

175

Mean Difference (IV, Random, 95% CI)

‐1.33 [‐4.69, 2.03]

3.1 Panic Disorder

1

25

Mean Difference (IV, Random, 95% CI)

‐6.5 [‐8.86, ‐4.14]

3.2 Obsessive compulsive disorder

6

150

Mean Difference (IV, Random, 95% CI)

‐0.33 [‐3.43, 2.77]

4 Hamilton Anxiety Rating Scale (HAM‐A) ‐ Augmentation agents Show forest plot

7

175

Mean Difference (IV, Random, 95% CI)

‐1.33 [‐4.69, 2.03]

4.1 antipsychotics

2

73

Mean Difference (IV, Random, 95% CI)

‐4.01 [‐8.41, 0.40]

4.4 Other medications

5

102

Mean Difference (IV, Random, 95% CI)

‐0.12 [‐4.79, 4.56]

Figuras y tablas -
Comparison 2. Medication vs Placebo: Comorbid symptoms
Comparison 3. Medication vs Placebo: Quality of Life Scales

Outcome or subgroup title

No. of studies

No. of participants

Statistical method

Effect size

1 Sheehan Disability Scale Show forest plot

3

102

Mean Difference (IV, Random, 95% CI)

‐1.18 [‐2.55, 0.19]

Figuras y tablas -
Comparison 3. Medication vs Placebo: Quality of Life Scales
Comparison 4. Medication vs Placebo: Drop‐out Rate

Outcome or subgroup title

No. of studies

No. of participants

Statistical method

Effect size

1 Drop‐out rate due to treatment emergent adverse effects Show forest plot

9

241

Risk Ratio (M‐H, Random, 95% CI)

2.16 [0.64, 7.28]

1.1 antipsychotics

7

209

Risk Ratio (M‐H, Random, 95% CI)

3.60 [0.94, 13.70]

1.3 beta‐blockers

1

16

Risk Ratio (M‐H, Random, 95% CI)

0.2 [0.01, 3.61]

1.5 Other medication

1

16

Risk Ratio (M‐H, Random, 95% CI)

0.0 [0.0, 0.0]

Figuras y tablas -
Comparison 4. Medication vs Placebo: Drop‐out Rate
Comparison 5. Subgroup analyses ‐ Methodological criteria

Outcome or subgroup title

No. of studies

No. of participants

Statistical method

Effect size

5 Industry versus non‐industry funded trials Show forest plot

9

250

Risk Ratio (M‐H, Random, 95% CI)

3.16 [1.08, 9.23]

5.1 Industry funded trials

5

164

Risk Ratio (M‐H, Random, 95% CI)

2.34 [0.61, 8.97]

5.2 Non‐industry funded trials

4

86

Risk Ratio (M‐H, Random, 95% CI)

6.06 [1.50, 24.54]

7 Industry versus non‐industry funded trials Show forest plot

10

255

Std. Mean Difference (IV, Random, 95% CI)

‐0.36 [‐0.69, ‐0.03]

7.1 Industry funded trials

5

151

Std. Mean Difference (IV, Random, 95% CI)

‐0.37 [‐0.90, 0.17]

7.2 Non‐industry funded trials

5

104

Std. Mean Difference (IV, Random, 95% CI)

‐0.40 [‐0.83, 0.03]

Figuras y tablas -
Comparison 5. Subgroup analyses ‐ Methodological criteria
Comparison 6. Subgroup analyses ‐ Clinical criteria

Outcome or subgroup title

No. of studies

No. of participants

Statistical method

Effect size

1 Inclusion of major depression vs. non‐inclusion: CGI‐I Show forest plot

6

158

Risk Ratio (M‐H, Random, 95% CI)

3.97 [0.75, 20.98]

1.1 Trials including patients with major depressive disorder

4

97

Risk Ratio (M‐H, Random, 95% CI)

9.52 [1.88, 48.21]

1.2 Trials excluding patients with major depressive disorder

2

61

Risk Ratio (M‐H, Random, 95% CI)

1.60 [0.25, 10.38]

2 Inclusion of major depression vs. non‐inclusion Show forest plot

10

242

Std. Mean Difference (IV, Random, 95% CI)

‐0.87 [‐1.35, ‐0.39]

2.1 Trials including patients with major depressive disorder

5

111

Std. Mean Difference (IV, Random, 95% CI)

‐0.83 [‐1.55, ‐0.11]

2.2 Trials excluding patients with major depressive disorder

5

131

Std. Mean Difference (IV, Random, 95% CI)

‐0.92 [‐1.63, ‐0.20]

3 Adequate previous trials versus inadequate trials: CGI‐I Show forest plot

9

250

Risk Ratio (M‐H, Random, 95% CI)

3.16 [1.08, 9.23]

3.1 Validated treatment‐resistant sample

5

123

Risk Ratio (M‐H, Random, 95% CI)

2.63 [0.56, 12.38]

3.2 Non‐validated sample

4

127

Risk Ratio (M‐H, Random, 95% CI)

4.07 [1.41, 11.74]

4 Adequate previous trials versus inadequate trials Show forest plot

13

312

Std. Mean Difference (IV, Random, 95% CI)

‐0.68 [‐1.11, ‐0.25]

4.1 Validated treatment‐resistant sample

9

198

Std. Mean Difference (IV, Random, 95% CI)

‐0.81 [‐1.38, ‐0.24]

4.2 Non‐validated sample

4

114

Std. Mean Difference (IV, Random, 95% CI)

‐0.43 [‐1.12, 0.26]

5 Non‐responders versus partial responders: CGI‐I Show forest plot

8

231

Risk Ratio (M‐H, Random, 95% CI)

3.02 [0.95, 9.56]

5.1 Non‐responder trials

2

81

Risk Ratio (M‐H, Random, 95% CI)

1.58 [0.30, 8.45]

5.2 Partial responder trials

6

150

Risk Ratio (M‐H, Random, 95% CI)

4.87 [1.57, 15.11]

6 Non‐responders versus partial responders Show forest plot

10

248

Std. Mean Difference (IV, Random, 95% CI)

‐0.59 [‐1.07, ‐0.12]

6.1 Non‐responder trials

5

136

Std. Mean Difference (IV, Random, 95% CI)

‐0.70 [‐1.24, ‐0.17]

6.2 Partial responder trials

5

112

Std. Mean Difference (IV, Random, 95% CI)

‐0.45 [‐1.32, 0.42]

Figuras y tablas -
Comparison 6. Subgroup analyses ‐ Clinical criteria