Peginterferón más ribavirina versus interferón más ribavirina para la hepatitis C crónica
Resumen
Antecedentes
El interferón pegilado (peginterferón) más ribavirina es el tratamiento recomendado para los pacientes con hepatitis C crónica, aunque se necesita la evaluación sistemática del efecto de este tratamiento en comparación con interferón más ribavirina.
Objetivos
Evaluar sistemáticamente los efectos beneficiosos y perjudiciales del peginterferón más ribavirina versus interferón más ribavirina en pacientes con hepatitis C crónica.
Métodos de búsqueda
Se hicieron búsquedas en el registro de ensayos controlados del Grupo Cochrane Hepatobiliar (Cochrane Hepato‐Biliary Group), en el Registro Cochrane Central de Ensayos Controlados (Cochrane Central Register of Controlled Trials) (CENTRAL), MEDLINE, EMBASE, Science Citation Index‐Expanded y en LILACS. También se buscó en los resúmenes de congresos, revistas y en la literatura gris. Las últimas búsquedas se realizaron en septiembre 2013.
Criterios de selección
Se incluyeron los ensayos clínicos aleatorios que comparaban peginterferón más ribavirina versus interferón más ribavirina con o sin cointervención/es (p.ej. otros fármacos antivirales) para la hepatitis C crónica. Los estudios cuasialeatorios y observacionales recuperados mediante las búsquedas de los ensayos clínicos aleatorios también se consideraron en cuanto a los informes de los efectos perjudiciales. Los resultados primarios fueron la morbilidad relacionada con el hígado, la mortalidad por cualquier causa, los eventos adversos graves, los eventos adversos que dieron lugar a la interrupción del tratamiento, otros eventos adversos y la calidad de vida. El resultado secundario fue la respuesta virológica sostenida en el suero, o sea, el ARN del virus de la hepatitis C no detectable en el suero con pruebas sensibles seis meses después del final del tratamiento.
Obtención y análisis de los datos
Dos autores de la revisión utilizaron de forma independiente un formulario estándar de recogida de datos. Se metanalizaron los datos con los modelos de efectos fijos y de efectos aleatorios. Para cada resultado, se calculó el odds ratio (OR) (para la morbilidad relacionada con el hígado o la mortalidad por todas las causas) o el cociente de riesgos (CR) junto con intervalos de confianza (IC) del 95% basado en el análisis de intención de tratar. Se utilizaron los dominios de los ensayos para evaluar el riesgo de errores sistemáticos (sesgo) y los análisis secuenciales de los ensayos para evaluar el riesgo de errores aleatorios (intervención del azar).
Para cada resultado, se calculó el CR con IC del 95% sobre la base del análisis por intención de tratar. Los efectos de las intervenciones sobre los resultados se evaluaron según GRADE.
Resultados principales
Se incluyeron 27 ensayos aleatorios con 5938 participantes. Todos los ensayos presentaban un riesgo de sesgo elevado. Se consideró que el riesgo de sesgo no repercutió en la calidad de las pruebas para los resultados de la mortalidad relacionada con el hígado y de los eventos adversos, aunque sí lo hizo para la respuesta virológica. Todos los ensayos compararon peginterferón alfa‐2a o peginterferón alfa‐2b más ribavirina versus interferón más ribavirina en participantes con hepatitis C crónica. Tres ensayos administraron cointervenciones (200 mg diarios de clorhidrato de amantadina a ambos grupos de intervención), y 24 ensayos se realizaron sin cointervenciones. El efecto observado entre los dos grupos de intervención con respecto a la morbilidad relacionada con el hígado más la mortalidad por todas las causas (5/907 [0,55%] versus 4/882 [0,45%] fue impreciso: (OR 1,14; IC del 95%: 0,38 a 3,42; cinco ensayos; pruebas de baja calidad), al igual que el riesgo de eventos adversos que dieron lugar a la interrupción del tratamiento (332/2692 [12,3%] versus 409/2176 [18,8%]; CR 0,86; IC del 95%: 0,68 a 1,09; 15 ensayos; pruebas de baja calidad) o con respecto a los eventos adversos que dieron lugar a la interrupción del tratamiento (332/2692 [12,3%] versus 409/2176 [18,8%]; CR 0,86; IC del 95%: 0,66 a 1,12; 17 ensayos; pruebas de baja calidad). Sin embargo, el peginterferón más ribavirina versus interferón más ribavirina aumentó significativamente el riesgo de neutropenia (332/2202 [15,1%] versus 117/1653 [7,1%]; CR 2,15; IC del 95%: 1,76 a 2,61; 13 ensayos), trombocitopenia (65/1113 [5,8%] versus 23/1082 [2,1%]; CR 2,63; IC del 95%: 1,68 a 4,11; 10 ensayos), artralgia (517/1740 [29,7%] versus 282/1194 [23,6%]; CR 1,19; IC del 95%: 1,05 a 1,35; cuatro ensayos), reacción en el sitio de inyección (627/1168 [53,7%] versus 186/649 [28,7%]; CR 1,71; IC del 95%: 1,50 a 1,93; cuatro ensayos) y náuseas (606/1784 [34,0%] versus 354/1239 [28,6%]; CR 1,13; IC del 95%: 1,01 a 1,26; cuatro ensayos). El evento adverso más frecuente fue la fatiga, que ocurrió en un 57% de los participantes (2024/3608). No se observó ninguna diferencia significativa entre el peginterferón más ribavirina versus interferón más ribavirina en cuanto a la fatiga (1177/2062 [57,1%] versus 847/1546 [54,8%]; CR 1,01; IC del 95%: 0,96 a 1,07; 12 ensayos). No se informó ninguna diferencia significativa entre los dos grupos de tratamiento con respecto a la anemia, la cefalea, la rigidez, la mialgia, la pirexia, la pérdida de peso, la astenia, la depresión, el insomnio, la irritabilidad, la alopecia, el prurito, la erupción cutánea, la disfunción tiroidea, la reducción del apetito o la diarrea. No se pudo identificar ningún dato sobre la calidad de vida. El peginterferón más ribavirina versus interferón más ribavirina pareció aumentar significativamente el número de participantes que lograron una respuesta virológica sostenida (1673/3300 participantes [50,7%] versus 1081/2804 pacientes [36,7%]; CR 1,39; IC del 95%: 1,25 a 1,56; I2 = 64%; 27 ensayos; pruebas de muy baja calidad). Sin embargo, el riesgo de sesgo en los 13/27 ensayos (48,1%) que informaban este resultado fue alto y se consideró sólo “menor” en los restantes. Debido a que el metanálisis convencional no alcanzó el tamaño necesario de información (n = 14 486 participantes), se utilizó el análisis secuencial de los ensayos para controlar los riesgos de errores aleatorios. Nuevamente, en este análisis, el efecto calculado fue estadísticamente significativo a favor del peginterferón. Los análisis de subgrupos según el riesgo de sesgo, el genotipo vírico, la carga viral inicial, los antecedentes del tratamiento previo y el tipo de intervención dieron lugar a resultados significativos similares a favor del peginterferón sobre el interferón en el resultado de la respuesta virológica sostenida.
Conclusiones de los autores
El peginterferón más ribavirina versus interferón más ribavirina parece aumentar significativamente la proporción de pacientes con respuesta virológica sostenida, así como el riesgo de determinados eventos adversos. Sin embargo, no hay pruebas suficientes para recomendar o rechazar el peginterferón más ribavirina para la morbilidad relacionada con el hígado más la mortalidad por cualquier causa en comparación con interferón más ribavirina. No se conocen las consecuencias clínicas de la respuesta virológica sostenida lograda, debido a que la respuesta virológica sostenida todavía es un resultado indirecto no validado. No se hallaron pruebas de los beneficios potenciales en la calidad de vida en los pacientes en los que se logró una respuesta virológica sostenida. Es probable que la investigación adicional de alta calidad tenga un impacto importante sobre la confianza en el cálculo de los resultados relevantes para los pacientes y que cambie los cálculos. Hay pruebas de muy baja calidad de que el peginterferón más ribavirina aumenta la proporción de pacientes con respuesta virológica sostenida en comparación con interferón más ribavirina. Hay pruebas de que también aumenta el riesgo de determinados eventos adversos.
Resumen en términos sencillos
El peginterferón más ribavirina es más efectivo que el interferón más ribavirina para eliminar el virus de la hepatitis C
Importancia de la revisión/antecedentes sobre la enfermedad
La hepatitis C es una enfermedad del hígado causada por el virus de la hepatitis C. A nivel mundial, se calcula que 170 000 000 de personas están infectadas de forma crónica por el virus de la hepatitis C. La hepatitis C crónica puede causar daño hepático en forma de inflamación y formación de cicatrices en el hígado (cirrosis). El daño hepático puede dar lugar a insuficiencia hepática y a otras complicaciones, incluido el cáncer de hígado. El objetivo del tratamiento de la hepatitis C crónica es prevenir las complicaciones de la infección por hepatitis C, lo cual posiblemente podría lograrse al eliminar el virus de la sangre del paciente (respuesta virológica sostenida, o sea, ARN del virus de la hepatitis C no detectable en el suero con las pruebas de sensibilidad seis meses después del final de tratamiento). Sin embargo, todavía se necesita comprender si el resultado de la respuesta virológica sostenida inducida mediante el tratamiento antiviral tiene una asociación con los resultados de relevancia clínica y para el paciente. La combinación de inyecciones semanales de peginterferón y ribavirina oral representa el estándar de atención actual.
Principales hallazgos de la revisión
La revisión identificó e incluyó 27 ensayos clínicos aleatorios que comparaban peginterferón más ribavirina versus interferón más ribavirina en pacientes con hepatitis C crónica. Todos los ensayos presentaron un riesgo alto de sesgo, es decir, riesgo de sobrestimación de los beneficios y subestimación de los efectos perjudiciales. Si no se tiene en cuenta el sesgo proveniente de la falta de cegamiento y del apoyo de la industria, entonces se considera que 14 ensayos presentaron un riesgo menor de sesgo. Todos los ensayos pudieron informar sobre la eliminación del virus de la sangre seis meses después del final del tratamiento (respuesta virológica sostenida). No fue posible tener la seguridad de que el peginterferón más ribavirina tiene un efecto sobre la morbilidad relacionada con el hígado más la mortalidad por cualquier causa en comparación con interferón más ribavirina. Debido a que ocurrieron muy pocos eventos, no se posible excluir efectos beneficiosos o perjudiciales importantes. Esta revisión indica que el peginterferón más ribavirina en comparación con interferón más ribavirina significativamente aumenta el número de pacientes con una respuesta virológica sostenida (50,2% en comparación con 38,5%), aunque todavía no se conocen los resultados relevantes para el paciente.
Efectos adversos
El peginterferón más ribavirina en comparación con interferón más ribavirina aumentó significativamente el riesgo de eventos adversos como neutropenia (falta de leucocitos en la sangre), trombocitopenia (falta de plaquetas en la sangre), artralgia (dolor en las articulaciones), reacción en el sitio de inyección, y náuseas, aunque los eventos adversos que dieron lugar a la interrupción del tratamiento continuaron siendo equivalentes para ambos tratamientos (12,3% versus 18,7%). Los datos acerca de la influencia del tratamiento sobre la calidad de vida son insuficientes.
Limitaciones de la revisión
Este efecto sobre la respuesta virológica parece consistente al realizar el análisis que controla el riesgo de errores aleatorios (“intervención del azar”), aunque puede deberse al hecho de que todos los ensayos se consideraron en riesgo alto de sesgo. Además, aún se necesitan pruebas de que la respuesta virológica sostenida inducida por el tratamiento antiviral presenta alguna asociación con los resultados de relevancia clínica y para el paciente.
Authors' conclusions
Summary of findings
| Peginterferon plus ribavirin versus non‐pegylated interferon plus ribavirin for chronic hepatitis C | ||||||
| Patient or population: patients with chronic hepatitis C. | ||||||
| Outcomes | Illustrative comparative risks* (95% CI) | Relative effect | No of participants | Quality of the evidence | Comments | |
| Assumed risk | Corresponding risk | |||||
| Non‐pegylated | Peginterferon | |||||
| Liver‐related morbidity plus all‐cause mortality | Five per 1000 | Six per 1000 | OR 1.14 | 1789 | ⊕⊕⊝⊝ | |
| Adverse events leading to treatment discontinuation | 207 per 1000 | 178 per 1000 | RR 0.86 | 4571 | ⊕⊕⊝⊝ | |
| Sustained virological response | 386 per 1000 | 537 per 1000 | RR 1.39 | 6104 | ⊕⊝⊝⊝4,5 | All trials had high risks of bias. Only an unvalidated surrogate outcome. |
| *The basis for the assumed risk (e.g., the median control group risk across studies) is provided in footnotes. The corresponding risk (and its 95% confidence interval) is based on the assumed risk in the comparison group and the relative effect of the intervention (and its 95% CI). | ||||||
| GRADE Working Group grades of evidence. | ||||||
| 1Low due to imprecision and indirectness wide confidence interval. The meta‐analysis included only nine events. 2Low due to imprecision and indirectness.The proportions of observed adverse events differ substantially across trials, and the direction of effect is heterogeneous. However, because the event rate is still relatively low across trials, all of the included trials may be subject to considerable random error, thus explaining the apparent heterogeneity in the direction of estimates. 4Sustained virological response does not seem to be a valid surrogate marker for assessing hepatitis C virus treatment efficacy of interferon treatment. Very low due to high risk of bias in all trials and imprecision and indirectness due to surrogate | ||||||
Background
Description of the condition
Globally, an estimated 170 million people are chronically infected with hepatitis C virus, and three to four million persons are infected each year (WHO 1999). In most patients, hepatitis C infection is asymptomatic in the initial phase. Hepatitis C infection generally is first recognised in the chronic phase (Hodgson 2003). Around 85% of patients who become infected with hepatitis C fail to clear the virus and become chronic carriers. A number of these individuals are reported to develop cirrhosis over a period of approximately 20 to 25 years (Seeff 2002; Seeff 2009). Patients with advanced fibrosis or cirrhosis develop liver complications such as hepatocellular carcinoma at the annual rate of approximately 2% to 4% (Benvegnu 2001; Fattovich 2002). Chronic hepatitis C is the single most common indication for liver transplantation (OPTN 2008). Chronic hepatitis C is expected to become a greater burden during the next decades.
Hepatitis C virus is an enveloped RNA virus that constitutes the genus Hepacivirus within the Flaviviridae family (van Regenmortel 2000; Penin 2004). Hepatitis C virus is divided into six genotypes, which differ from each other by up to 30% in the nucleotide sequence (Rosenberg 2001). Furthermore, hepatitis C virus genotypes differ by geographic region (Davis 1999). Although a genotype does not predict the outcome of the infection, it does predict the likelihood of virological response to treatment and in many cases determines the duration of treatment (Manns 2001; Fried 2002; Hadziyannis 2004).
Description of the intervention
The goal of treatment of chronic hepatitis C is to prevent complications of hepatitis C infection; this is principally sought by eradication of the infection (Ghany 2009). Accordingly, treatment is aimed at achieving a virological response, defined as the absence of hepatitis C virus RNA in serum by sensitive testssix months after the end of treatment (sustained virological response). It is not known whether this outcome bears any relevance to the patient regarding mortality, morbidity, or quality of life (Gluud 2007).
How the intervention might work
Interferons work through complicated cellular mechanisms, leading to a reduction of viral load in patients with chronic hepatitis C. Monotherapy with interferon produces sustained virological response in less than 20% of study participants (Myers 2002). The introduction of combination therapy with interferon plus ribavirin was considered a major advance because of its increased effect on sustained virological response. Combination therapy produces sustained virological response in approximately 40% of previously untreated participants, that is, participants who were previously naive to antiviral drugs (Brok 2009a). A combination of weekly subcutaneous injections of long‐acting peginterferon alpha plus oral ribavirin has achieved the highest overall sustained virological response of 56% of participants (Ghany 2009). This represents the current standard of treatment according to the guidelines of the American Association for the Study of Liver Diseases (Ghany 2009) and the European Association for the Study of the Liver (EASL 2012).
Pegylation involves the addition of polyethylene glycol molecules to the interferon molecule, thus altering metabolism, decreasing renal clearance, and increasing the half‐life of the peginterferon molecule in the circulation, thereby necessitating fewer doses (Reddy 2001). Currently, two licenced products of peginterferon are available: peginterferon alpha‐2a (Pegasys®, Roche), which consists of a 40‐kDa branched pegylated chain linked to the interferon molecule (Bailon 2001), and peginterferon alpha‐2b (Peg‐Intron®, Merck Corporation), which consists of a 12‐kDa linear pegylated chain linked to the interferon molecule (Glue 2000). The two forms of peginterferon differ substantially in terms of chemical and structural characteristics, as well as pharmacokinetic and pharmacodynamic properties (Foster 2004; Awad 2010; Hauser 2014). In the present systematic review, we consider peginterferon alpha‐2a and peginterferon alpha‐2b as a single intervention, but in a subgroup analysis, we analyse them separately.
Why it is important to do this review
Previous reviews, including narrative reviews, meta‐analyses, and health technology assessments, have compared pegylated interferon versus interferon given with or without co‐interventions (Chander 2002; Zaman 2003; Khuroo 2004; Shepherd 2005; Siebert 2005). The overall conclusion of these review authors was that the combination of pegylated interferon plus ribavirin was more efficient than interferon plus ribavirin in obtaining sustained virological response. However, these reviews relied on a sparse number of included trials. Intervention research for hepatitis C is high‐paced, and new trials have emerged since these reviews were completed. This Cochrane systematic review aimed to include and critically assess evidence obtained through extensive searches for randomised clinical trials.
Objectives
To systematically evaluate the benefits and harms of peginterferon plus ribavirin versus interferon plus ribavirin for patients with chronic hepatitis C.
Methods
Criteria for considering studies for this review
Types of studies
We included randomised clinical trials, irrespective of language, publication status, sample size, or year of publication, for assessment of benefits and harms. We also included for assessment of harms quasi‐randomised studies and observational studies that were identified during our searches for randomised trials.
Types of participants
We included patients with chronic hepatitis C. The diagnosis was based on the presence of hepatitis C virus RNA for longer than six months, or the presence of hepatitis C virus RNA plus elevated transaminases in the blood for longer than six months, or histological evidence of chronic hepatitis C. Based on history of previous antiviral treatment, included patients were classified as treatment‐naive (not previously treated with antiviral drugs), relapsers (patients with a transient response to previous treatment), or non‐responders (patients without response to previous treatment). Patients who had undergone liver transplantation and patients with hepatitis B or human immunodeficiency virus coinfection were excluded.
Types of interventions
This review included randomised clinical trials comparing peginterferon alpha‐2a or peginterferon alpha‐2b plus ribavirin versus interferon plus ribavirin for participants with chronic hepatitis C. Trials were included regardless of the type, the dose, or the duration of the interventions. Cointerventions were permitted if they were received by and applied equally to all intervention groups.
Types of outcome measures
Primary outcomes
-
Liver‐related morbidity plus all‐cause mortality: number of participants who developed cirrhosis, ascites, variceal bleeding, hepatic encephalopathy, or hepatocellular carcinoma, or who died.
-
Adverse events leading to treatment discontinuation.
-
Numbers and types of adverse events, defined as participants with any untoward medical occurrence not necessarily having a causal relationship to the treatment. We reported separately on adverse events that led to treatment discontinuation and those that did not lead to treatment discontinuation. We defined a serious adverse event according to the guidelines of the International Conference on Harmonisation (ICH‐GCP 1997) as any event that leads to death, is life threatening, requires in‐patient hospitalisation or prolongation of existing hospitalisation, or results in persistent or significant disability, as well as any important medical event that may have jeopardised the participant or required an intervention to prevent it. All other adverse events were considered non‐serious.
-
Other adverse events: haematological effects, fatigue, flu‐like symptoms, psychiatric symptoms, dermatological symptoms, thyroid malfunction, gastrointestinal symptoms (other than liver related).
-
-
Quality of life.
Secondary outcomes
-
Sustained virological response: number of participants with undetectable hepatitis C virus RNA in serum by sensitive tests six months after the end of treatment.
Search methods for identification of studies
Electronic searches
We searched the Cochrane Hepato‐Biliary Group Controlled Trials Register (Gluud 2013), the Cochrane Central Register of Controlled Trials (CENTRAL), MEDLINE, EMBASE, Science Citation Index‐Expanded (Royle 2003), and LILACS, using the search strategies and time spans given in Appendix 1. The searches were conducted until September 2013.
Searching other resources
We identified further trials by searching national and topic‐specific databases, bibliographies, conference abstracts, journals, and grey literature. Furthermore, we reviewed the reference lists of the included trials and contacted the principal authors of the identified trials.
Data collection and analysis
We performed the review and meta‐analyses according to the recommendations of The Cochrane Collaboration (Higgins 2011) and the Cochrane Hepato‐Biliary Group Module (Gluud 2013). The analyses were performed using Review Manager 5.2 (RevMan 2012) and Trial Sequential Analysis version 0.9 (CTU 2011; Thorlund 2011).
Selection of studies
We listed the identified trials, and two of the review authors (GH and TA) independently assessed their fulfilment of the inclusion criteria. We listed the excluded trials along with the reasons for exclusion. Disagreements were resolved by discussion and were arbitrated with a third review author (CG).
Data extraction and management
A standardised template or data collection form was used to extract data regarding source identification, eligibility, methods, participants, interventions, outcomes, and results obtained from published reports or by contact with the study authors. Two review authors (GH and TA) extracted all the data independently. Disagreements were resolved by discussion and were arbitrated with a third review author (CG). Any further information required of the original authors was requested by written correspondence, and any relevant information obtained in this manner was included in the review.
Assessment of risk of bias in included studies
Methodological quality was defined as the level of confidence that the design and the report of the randomised clinical trial would restrict bias in the comparison of interventions (Moher 1998). According to empirical evidence (Schulz 1995; Moher 1998; Kjaergard 2001; Wood 2008; Lundh 2012; Savovic 2012; Savovic 2012a), the methodological quality of the trials, hence the risk of bias, was based on the following.
Sequence generation
-
Low risk of bias: Sequence generation was achieved by using computer random number generation or a random number table. Drawing lots, tossing a coin, shuffling cards, and throwing dice are adequate if performed by an independent person not otherwise involved in the trial.
-
Uncertain risk of bias: The method of sequence generation was not specified.
-
High risk of bias: The sequence generation method was not random.
Allocation concealment
-
Low risk of bias: The participant allocations could not have been foreseen in advance of, or during, enrolment. Allocation was controlled by a central and independent randomisation unit. The allocation sequence was unknown to the investigators (e.g., if the allocation sequence was hidden in sequentially numbered, opaque, and sealed envelopes).
-
Uncertain risk of bias: The method used to conceal the allocation was not described so that intervention allocations may have been foreseen in advance of, or during, enrolment.
-
High risk of bias: The allocation sequence was likely to be known to the investigators who assigned the participants.
Blinding of outcome assessors
-
Low risk of bias: Blinding was performed adequately, or assessment of outcomes was not likely to be influenced by lack of blinding.
-
Uncertain risk of bias: Information was insufficient to permit assessment of whether blinding was likely to induce bias for the results.
-
High risk of bias: No blinding or incomplete blinding was performed, and assessment of outcomes was likely to be influenced by lack of blinding.
Incomplete outcome data
-
Low risk of bias: Missing data were unlikely to make treatment effects depart from plausible values. Sufficient methods, such as multiple imputation, were employed in handling missing data.
-
Uncertain risk of bias: Information was insufficient to permit assessment of whether missing data in combination with the method used to handle missing data were likely to induce bias for the results.
-
High risk of bias: The results were likely to be biased as the result of missing data.
Selective outcome reporting
-
Low risk of bias: All outcomes were predefined and reported, or all clinically relevant and reasonably expected outcomes were reported.
-
Uncertain risk of bias: It is unclear whether all predefined and clinically relevant and reasonably expected outcomes were reported.
-
High risk of bias: One or more clinically relevant and reasonably expected outcomes were not reported, and data on these outcomes were likely to have been recorded.
Other sources of bias
-
Low risk of bias: The trial appears to be free of other components (e.g., academic bias) that could put it at risk of bias.
-
Uncertain risk of bias: The trial may or may not be free of other components that could put it at risk of bias.
-
High risk of bias: Other factors in the trial could put it at risk of bias (e.g., authors have conducted trials on the same topic).
The risk of bias of the trials was assessed independently by two review authors, and disagreements were resolved by discussion and were arbitrated with a third review author. Trials with adequate sequence generation and allocation concealment and free of incomplete outcome data and selective outcome reporting were considered trials with lower risk of bias, as we expected all or most trials to be unblinded and to have obtained industry support.
Measures of treatment effect
Dichotomous data
Dichotomous data were expressed as risk ratios (RRs) and risk differences (RDs) with 95% confidence intervals (CIs). Furthermore, the number needed to treat for an additional beneficial outcome was derived from the RD in meta‐analyses in which the 95% CI did not include zero. Rare events (morbidity and mortality) were estimated by using the odds ratio (OR) as a measure of effect.
Dealing with missing data
We planned to perform all analyses according to the intention‐to‐treat method, including all participants, irrespective of compliance or follow‐up. However, we performed analyses according to the intention‐to‐treat method only for dichotomous outcomes. For continuous outcomes, we performed available case analyses and included data only on those whose results were known. Regarding the primary outcome measures, we planned to include participants with incomplete or missing data in the sensitivity analyses by imputing them according to the two scenarios described below (Hollis 1999; Gluud 2013).
-
'Best‐worst' case scenario analyses: Participants with missing outcomes are considered successes in the experimental group and failures in the control group. The denominator will include all participants in the trial.
-
'Worst‐best' case scenario analyses: Participants with missing outcomes data are considered failures in the experimental group and successes in the control group. The denominator will include all participants in the trial.
As very few data were available, we decided not to conduct these extreme case scenario analyses. When sufficient data become available in the future, we will conduct such analyses.
Assessment of heterogeneity
Heterogeneity was explored by the Chi2 test, and the quantity of heterogeneity was measured by the I2 statistic (Higgins 2002;Higgins 2011). Sources of heterogeneity were assessed by subgroup analyses and meta‐regression when possible. Subgroup analyses were carried out only when data from at least two trials were available for each subgroup. Meta‐regression was carried out only for meta‐analyses that included more than 10 trials. Whether sensitivity analyses needed to be performed was determined during the review process.
Assessment of reporting biases
Different types of reporting biases (e.g., publication bias, time lag bias, outcome reporting bias) were handled according to the recommendations of The Cochrane Collaboration (Higgins 2011). For dichotomous outcomes with intervention effects measured as odds ratios, the arcsine test proposed by Rücker 2008 was used to test for funnel plot asymmetry. Nevertheless, asymmetrical funnel plots are not necessarily caused by publication bias, and publication bias does not necessarily cause asymmetry in a funnel plot (Egger 1997).
Data synthesis
Meta‐analysis
For all analyses, we used both random‐effects (DerSimonian 1986) and fixed‐effect models (DeMets 1987). Because of underlying assumptive differences, results from the random‐effects model and from the fixed‐effect model may differ to a non‐ignorable extent. In case such discrepancies were observed, P values were ignored, and results were interpreted according to the implications of the subgroup and heterogeneity analyses according to confidence intervals of the two models.
Trial sequential analysis
Random errors may play an important role in the evaluation of cumulative meta‐analyses as the result of sparse data and multiplicity from repetitive testing of accumulating data. To assess the reliability of inferences from our meta‐analysis on sustained virological response, we calculated the diversity‐adjusted required information size (DARIS). We defined DARIS as the required sample size for the meta‐analysis to detect a 10% relative risk reduction in sustained virological response, assuming an average outcome proportion of 50% in the control group, a diversity observed in the meta‐analysis, and statistical error levels of alpha = 5% and beta = 10% (90% power). Meta‐analyses conducted before they surpassed the DARIS are considered analogous to interim analyses in a single randomised trial, and thus they necessitate adjustment of the threshold for statistical significance to maintain the predetermined maximum risk of obtaining a false positive (set to alpha = 5% in our analysis). Therefore, we substituted the conventional 5% threshold for statistical significance with those of Lan‐DeMets trial sequential monitoring boundaries (Bangalore 2008; Brok 2008; Wetterslev 2008; Brok 2009; Thorlund 2009, Wetterslev 2009; Thorlund 2010). To minimise the risk of random errors, we used trial sequential analysis (CTU 2011; Thorlund 2011). On the basis of the required information size and the risk for type I (5%) and type II (10% or 20%) errors, trial sequential monitoring boundaries were constructed (Wetterslev 2008; CTU 2011; Thorlund 2011). These boundaries determine the statistical inference that one may draw regarding the cumulative meta‐analysis that has not reached the required information size. If the cumulative Z‐score crosses a trial sequential monitoring boundary before the required information size is reached in a cumulative meta‐analysis, firm evidence may have been established, and further trials may be superfluous, provided that systematic errors can be excluded. On the other hand, if the monitoring boundaries are not surpassed, it is most probably necessary to continue doing further trials to detect or reject a certain intervention effect. We used as default a type I error of 5%, a type II error of 10%, and adjusted information size for heterogeneity with diversity, unless otherwise stated (Wetterslev 2008; Wetterslev 2009; CTU 2011; Thorlund 2011). Posthoc, we also challenged the trial sequential analysis on sustained virological response by a type I error of 1%.
Subgroup analysis and investigation of heterogeneity
The following subgroup analyses were considered and performed when feasible.
-
Risk of bias: trials assessed to have low risk of bias compared to trials with high risk of bias.
-
Participants: trials with treatment‐naive participants compared to trials with relapsers or non‐responders.
-
Genotype: comparisons of trials with participants infected with different hepatitis C virus genotypes.
-
Baseline viral load: trials assessed as having high or low risk of viral load on the basis of 800,000 IU (˜ four million copies/mL) threshold.
-
Type of peginterferon: trials with peginterferon alpha‐2a compared to trials with peginterferon alpha‐2b.
We performed a test of interaction between subgroups within each of the five categories. We performed tests of interaction only between subgroups that both included at least three trials.
Sensitivity analysis
Suitable sensitivity analyses were identified during the review process. For example, if zero‐event trials occurred, we employed a number of different continuity corrections according to the sensitivity analysis proposed by Bradburn 2006 using the TSA programme (CTU 2011; Thorlund 2011). We also carried out a sensitivity analysis from which we excluded trials that provided triple therapy with amantadine.
Summary of findings table
To minimise wrong interpretations of our findings and recommendations, we planned to rate the available evidence for all outcomes following the Grading of Recommendations Assessment, Development, and Evaluation (GRADE) guidelines in order to prepare a Summary of Findings (SoFs) table (Guyatt 2008). A SoFs table consists of three parts: information about the review, a summary of the statistical results, and the grade of the quality of evidence. The quality assessment comprises three parts: the number of studies, the types of studies (randomised or observational), and the factors that affect the quality of the evidence (see below).
Factors that affect the quality of the evidence
| Decrease quality | Increase quality |
| Risk of bias | Large magnitude of effect |
| Inconsistency of results | Demonstrated effect reduced by all plausible confounding |
| Indirectness of evidence | Dose‐response gradient |
| Imprecision |
|
| Publication bias |
|
Results
Description of studies
Results of the search
We identified a total of 8089 references through electronic searches until September 2013. The Cochrane Hepato‐Biliary Group Controlled Trials Register identified 923 references. We excluded 2459 duplicates and 3346 clearly irrelevant references by reading abstracts. Accordingly, 2284 references were retrieved for further assessment. We excluded 2225 references because they were not randomised clinical trials or because interventions or participants did not meet our inclusion criteria.
Fifty‐nine references describing a total of 27 randomised clinical trials fulfilled our inclusion criteria (see the Characteristics of included studies table) (Manns 2001; Cariti 2002; Fried 2002; Hinrichsen 2002; Esmat 2003; Shobokshi 2003; Thakeb 2003; Al‐Faleh 2004; Bruno 2004; Fargion 2004; Izumi 2004; Derbala 2005; Dollinger 2005; Lee 2005; Mangia 2005; Napoli 2005; PRETTY 2005; Scotto 2005; Tsubota 2005; Derbala 2006; Wakil 2006; Rahman 2007a; Rahman 2007b; Sjögren 2007; Horsmans 2008; Roffi 2008; Nevens 2010). Accordingly, several of the trials were published multiple times. Seventeen trials were published as full‐paper articles, and 10 trials were published in abstract form only.
Included studies
Participants
A total of 5938 participants were randomly assigned in the 27 trials. The number of participants in each trial ranged from 40 to 1530. Twenty‐three trials included treatment‐naive participants, and four trials included non‐responders or relapsers. In 10 trials, all participants were infected with hepatitis C virus genotype one. In two trials, all participants were infected with genotype two or three. In seven trials, all participants were infected with genotype four. In eight trials, participants infected with different genotypes were included.
Experimental interventions
The type of peginterferon was alpha‐2a (nine trials) or alpha‐2b (18 trials).
The dose of peginterferon alpha‐2a was 180 μg/wk (Cariti 2002; Fried 2002; Shobokshi 2003; Thakeb 2003; Fargion 2004; Mangia 2005; PRETTY 2005; Derbala 2006; Nevens 2010).
The dose of peginterferon alpha‐2b was 1.0 μg/kg/wk (Hinrichsen 2002; Esmat 2003; Al‐Faleh 2004) or 1.5 μg/kg/wk (Manns 2001; Izumi 2004; Derbala 2005; Dollinger 2005; Lee 2005; Napoli 2005; Scotto 2005; Tsubota 2005; Wakil 2006; Rahman 2007a; Rahman 2007b; Sjögren 2007). In the Manns 2001 trial, a third intervention group was given peginterferon alpha‐2b 1.5 μg/kg/wk for four weeks, followed by 0.5 μg/kg/wk for an additional 44 weeks. In the Roffi 2008 trial, participants were given peginterferon alpha‐2b 1.0 μg/kg/wk for four weeks, followed by 0.5 μg/kg/wk for an additional two weeks.
Control interventions
The type of interferon was alpha‐2a (eight trials), alpha‐2b (14 trials), consensus interferon (four trials), or leucocyte interferon‐alpha (one trial).
The dose of interferon alpha‐2a was 3 MU (Thakeb 2003; Mangia 2005;Derbala 2006), 4.5 MU (Shobokshi 2003), or 6 MU (Cariti 2002; PRETTY 2005), given thrice weekly. In the Fargion 2004 trial, participants were given interferon alpha‐2a 6 MU daily for four weeks, then 3 MU daily for an additional 20 weeks, and then 3 MU thrice weekly for an additional 24 weeks. In the Nevens 2010 trial, participants were given interferon alpha‐2a at a dose of 6 MU for eight weeks, and then 3 MU for an additional 40 weeks.
The dose of interferon alpha‐2b was 3 MU (Manns 2001; Fried 2002; Hinrichsen 2002; Esmat 2003; Al‐Faleh 2004; Lee 2005; Scotto 2005; Wakil 2006), 5 MU (Wakil 2006), or 6 MU (Bruno 2004; Derbala 2005; Scotto 2005), given thrice weekly. In one trial (Izumi 2004), interferon alpha‐2b was given daily at a dose of 3 MU for the first two weeks, and then thrice weekly for an additional 46 weeks. In the Tsubota 2005 trial, interferon alpha‐2b was given daily at a dose of 6 MU for the first two weeks, and then thrice weekly for an additional 46 weeks. In the Bruno 2004 trial, peginterferon alpha‐2b 100 µg was given to participants weighing 65 kg or more, and 80 µg to those weighing less than 65 kg, for the first eight weeks, followed by a fixed dose of 50 µg for the next 40 weeks.
The dose of consensus interferon was 9 µg (Rahman 2007a; Rahman 2007b) or 15 µg (Sjögren 2007) for 48 weeks. In the Dollinger 2005 trial, consensus interferon was given at a dose of 18 µg/d for six weeks followed by 9 µg/d for 42 weeks.
In the Rahman 2007a trial, consensus interferon was given at a dose of 27 to 18 µg once a day for 12 weeks followed by 9 µg once a day for 36 weeks.The dose of leucocyte interferon‐alpha was 6 MIU daily (Napoli 2005).
Two trials (Shobokshi 2003; Horsmans 2008) included three intervention groups. In the first trial (Shobokshi 2003), group one was given peginterferon alpha‐2a 180 µg plus ribavirin 800 mg for 48 weeks (n = 60); group two was given peginterferon alpha‐2a 180 µg (n = 60); and group three was given interferon alpha‐2a 4.5 MU plus ribavirin 800 mg for 48 weeks (n = 60). In the second trial (Horsmans 2008), group one was given daily interferon alpha‐2b at a dose of 4 MIU for participants weighing more than 65 kg, and 0.06 MIU/kg for those weighing 65 kg or less; group two was given interferon alpha‐2b three times a week at a dose of 3 MIU; and group three was given peginterferon alpha‐2b at a dose of 100 mcg/wk for participants weighing more than 65 kg, and 1.5 mcg/kg/d for participants weighing 65 kg or less. Participants were followed up for 24 weeks after the end of treatment.
Cointerventions in both intervention groups
The dose of ribavirin was 600 mg, 800 mg, 1000 mg, or 1200 mg daily, based on body weight. Three trials also administered amantadine hydrochloride 200 mg daily to both intervention groups (Fargion 2004; Mangia 2005; PRETTY 2005).
Excluded studies
Seven publications were excluded for the reasons shown in the Characteristics of excluded studies table (APRICOT 2004; Asahina 2004; Gromova 2004; Laguno 2004; RIBAVIC 2004; ACTG 2005; Ali 2010).
Risk of bias in included studies
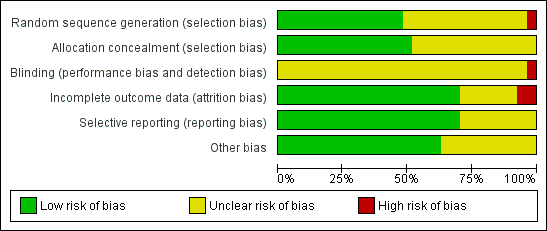
The risk of bias was unclearly reported in a considerable number of included trials, hence giving them a high risk of bias (Figure 1; Figure 2). Fourteen trials reported adequate sequence generation (generation of the allocation sequence ) (e.g., computer‐generated random numbers, table of random numbers, minimisation). Fourteen trials used adequate allocation concealment (e.g., central independent unit, sealed opaque envelopes). None of the trials were blinded. It is unclear to what extent the outcome assessors or the participants were blinded; therefore, a risk of bias might be present in the registration of subjective outcome measures (e.g., diagnosis of complications, adverse events). Only one trial had adequate blinding for the outcome assessors for sustained virological response (Sjögren 2007). Nineteen trials addressed incomplete outcome data adequately. Protocols were not available for any of the included trials, but most trials reported on the primary outcomes of our review. Several trials had possible vested interest bias (Manns 2001; Fried 2002; Shobokshi 2003; Al‐Faleh 2004; Bruno 2004; Dollinger 2005; Lee 2005; Mangia 2005; Horsmans 2008), and in the remainder, the risk of vested interest bias was unclear. The risk of bias was high in all of the trials from one or more domains.

Methodological quality graph: review authors' judgements about all methodological quality items presented as percentages across all included studies.

Methodological quality summary: review authors' judgements about each methodological quality item for each included study.
Disregarding the risk of bias from lack of blinding and vested interests, we considered 14/27 trials (51.9%) as having a lower risk of bias according to the following domains: generation of the allocation sequence, allocation concealment, incomplete outcome reporting, and selective outcome reporting.
Effects of interventions
Liver‐related morbidity plus all‐cause mortality
Four deaths (suicide (suspected drug overdose), ruptured oesophageal varices, traffic‐related, and unexplained) on peginterferon plus ribavirin versus three deaths (following surgery for colon cancer, hypertensive heart disease, and brain tumour) on interferon plus ribavirin were reported (Analysis 1.1). Two participants developed hepatocellular carcinoma, one on each intervention. No significant difference in liver‐related morbidity or all‐cause mortality was noted between participants receiving peginterferon plus ribavirin versus interferon plus ribavirin (Peto OR 1.14, 95% CI 0.38 to 3.42; five trials).
Adverse events
Data from 17 trials yielded a non‐significant difference regarding adverse events leading to treatment discontinuation of peginterferon plus ribavirin when compared with interferon plus ribavirin (332/2692 (12.3%) versus 409/2176 (18.8%); RR 0.86, 95% CI 0.66 to 1.12; 17 trials). When RR was used as the association measure of intervention effect, the Cochrane homogeneity test statistic yielded a P value of 0.003, and the heterogeneity was I2 = 56% (Analysis 1.2). Funnel plot visual inspection did not reveal significant evidence of publication bias (Figure 3).
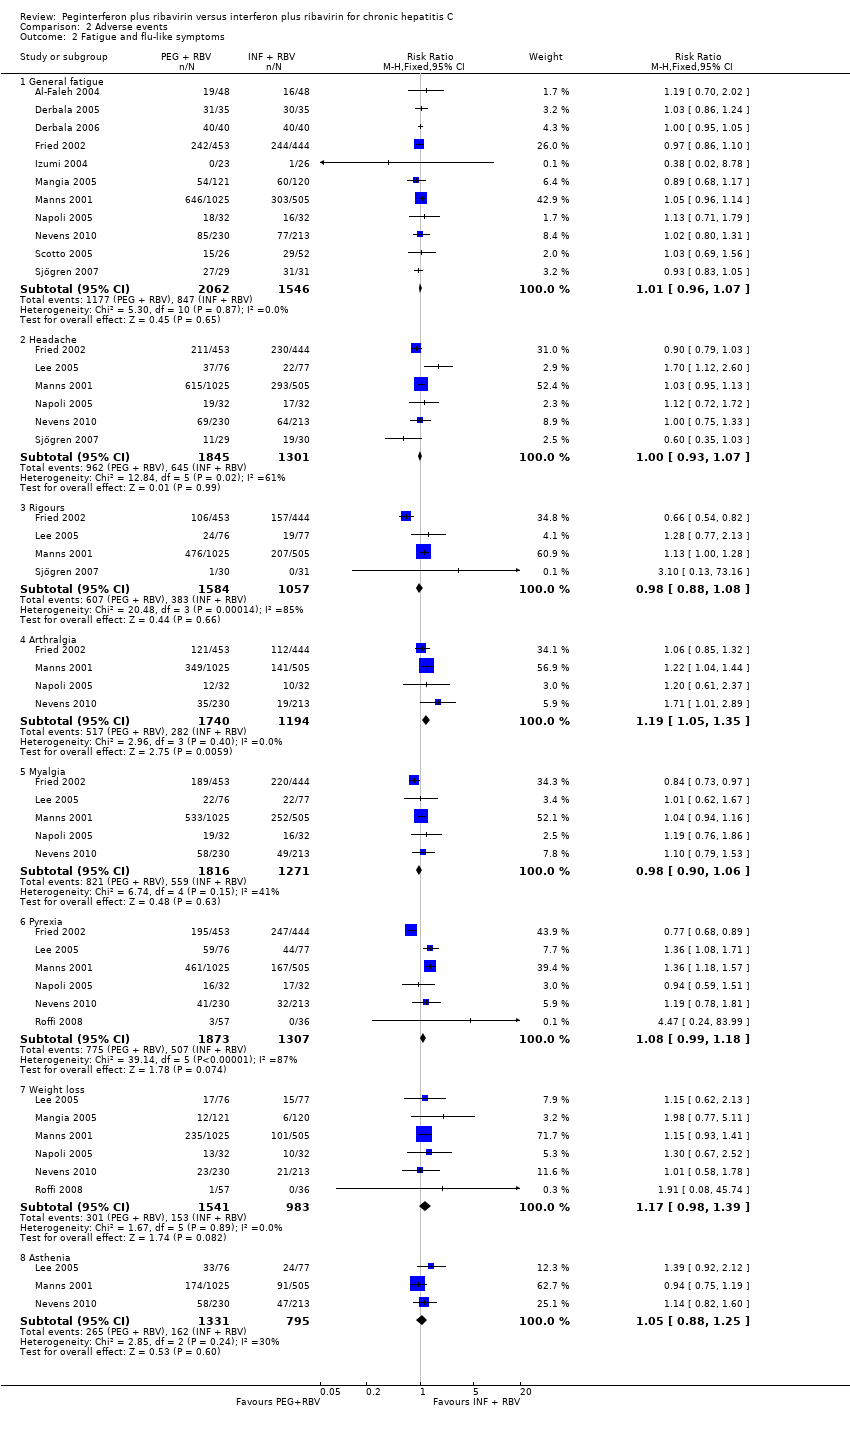
Peginterferon plus ribavirin compared with interferon plus ribavirin significantly increased the risk of neutropenia (RR 2.15, 95% CI 1.76 to 2.61; 13 trials) (Analysis 2.1), thrombocytopenia (RR 2.63, 95% CI 1.68 to 4.11; 10 trials) (Analysis 2.1), arthralgia (RR 1.19, 95% CI 1.05 to 1.35; four trials) (Analysis 2.4), injection site reaction (RR 1.71, 95% CI 1.50 to 1.93; four trials) (Analysis 2.4; Figure 1), or nausea (RR 1.13, 95% CI 1.01 to 1.26; four trials) (Analysis 2.6).
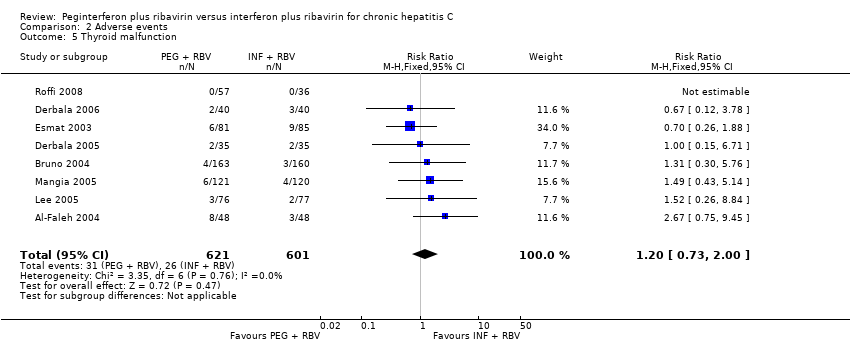
The most frequent adverse event was fatigue, which overall occurred in 57% (2024/3608). No significant difference was seen between the effects of peginterferon plus ribavirin versus interferon plus ribavirin on fatigue (RR 1.01, 95% CI 0.96 to 1.07; 10 trials) (Analysis 2.2). No significant differences were noted between the two interventions regarding anaemia (Analysis 2.1), headache, rigours, myalgia, pyrexia, weight loss, asthenia (Analysis 2.4), depression, insomnia, irritability (Analysis 2.3), alopecia, pruritus, skin rash (Analysis 2.4), thyroid malfunction (Analysis 2.5), or regarding decreased appetite and diarrhoea (Analysis 2.6).
Funnel plot of comparison: peginterferon plus ribavirin versus non‐pegylated interferon plus ribavirin, outcome: 1.2 Adverse events leading to treatment discontinuation.
Quality of life
Only one trial reported quality of life in the Methods section (Hinrichsen 2002). This trial is published only as an abstract, and we could not find the data in the Results section. We contacted the study authors to ask for further information, but no answer has been received.
Sustained virological response
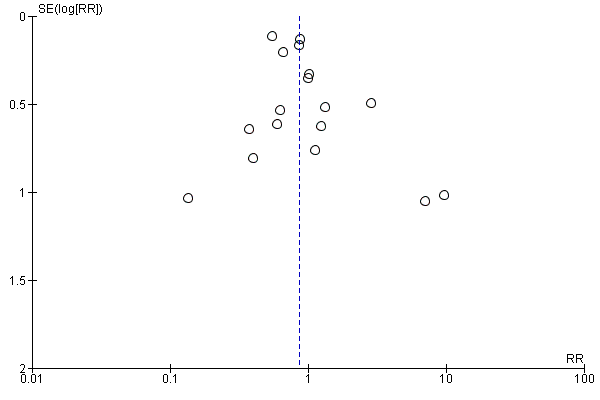
Peginterferon plus ribavirin seems to significantly increase the number of participants achieving sustained virological response compared with interferon plus ribavirin (1673/3300 (50.7%) versus 1081/2804 (38.6%); RR 1.39, 95% CI 1. 25 to 1.56; I2 = 64%; 27 trials) (Analysis 1.3; Figure 4). When RR was used as the measure of effect, the Cochran homogeneity test statistic yielded a P value less than 0.00001 and the heterogeneity was I2 = 64%. The estimated number needed to treat for an additional beneficial outcome to achieve an extra participant with sustained virological response is seven participants (95% CI 5 to 10 participants) with peginterferon plus ribavirin versus interferon plus ribavirin. Funnel plot visual inspection did not reveal significant risk of publication bias (Figure 5).

Forest plot of comparison: pegylated interferon plus ribavirin versus interferon plus ribavirin, outcome: 1.1 Sustained virological response.

Funnel plot of comparison: pegylated interferon plus ribavirin versus interferon plus ribavirin, outcome: 1.1 Sustained virological response.
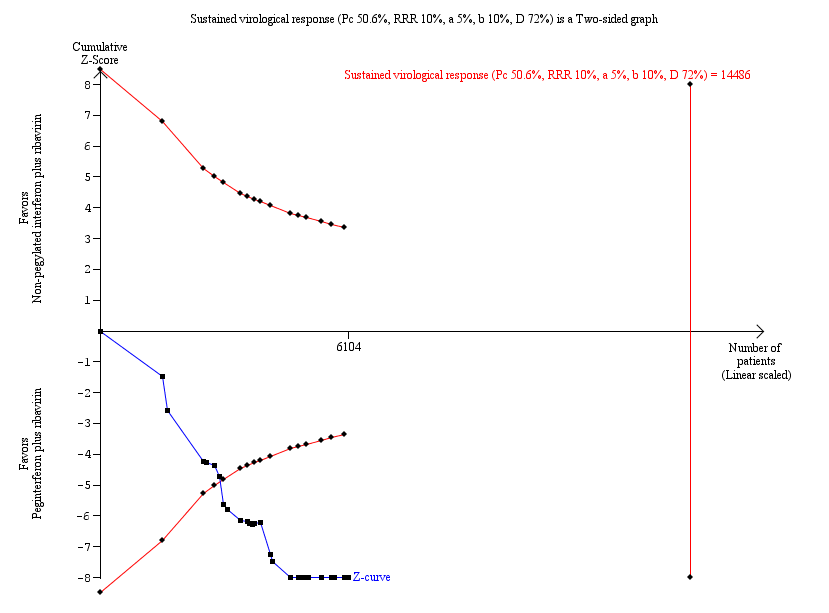
Because this meta‐analysis did not reach its required information size of 14,486 participants based on the assumption of a maximum type I error of 5%, we used a trial sequential analysis to assess the statistical significance. Based on the assumption of a maximum type I error of 1%, the required information size was 20,513 participants. Again, the estimated effects were statistically significant in favour of peginterferon plus ribavirin (Figure 6; Figure 7).

Trial sequential analysis (TSA): pegylated interferon plus ribavirin versus interferon plus ribavirin ‐ sustained virological response.
Lan‐DeMets statistical monitoring boundaries for assessing statistical significance regarding sustained virological response to pegylated interferon plus ribavirin versus interferon plus ribavirin. The diversity‐adjusted required information size of n = 14,486 was calculated based on an event proportion of 50.6% of participants in the interferon‐treated group (Pc) with a risk ratio (RR) reduction of 10% in pegylated interferon group; an alpha (a, type I error) of 5%, a beta (b, type II error) of 10%, and the observed diversity D = 72%.
The solid blue curve presents the cumulative meta‐analysis test Z‐score and the inward sloping red curves present the adjusted threshold for statistical significance according to the two‐sided Lan‐DeMets trial sequential boundaries. The cumulative Z‐score crosses the boundaries for superiority, and this corresponds with superiority of pegylated interferon.

Trial sequential analysis (TSA): pegylated interferon plus ribavirin versus interferon plus ribavirin ‐ sustained virological response.
Lan‐DeMets statistical monitoring boundaries for assessing statistical significance regarding sustained virological response to pegylated interferon plus ribavirin versus interferon plus ribavirin. The diversity‐adjusted required information size of n = 20,513 was calculated based on an event proportion of 50.6% of participants in the interferon‐treated group (Pc) with a risk ratio (RR) reduction of 10% in the pegylated interferon group; an alpha (a, type I error) of 1%, a beta (b, type II error) of 10%, and the observed diversity D = 72%.
The solid blue curve presents the cumulative meta‐analysis test Z‐score and the inward sloping red curves present the adjusted threshold for statistical significance according to the two‐sided Lan‐DeMets trial sequential monitoring boundaries. The cumulative Z‐score crosses the boundaries for superiority, and this corresponds with the superiority of pegylated interferon.
Subgroup analyses showed pronounced differences in comparative treatment effects according to the genotype of the virus (Analysis 3.3). Data from 16 trials (Manns 2001; Cariti 2002; Fried 2002; Bruno 2004; Izumi 2004; Dollinger 2005; Lee 2005; Mangia 2005; Napoli 2005; PRETTY 2005; Scotto 2005; Tsubota 2005; Rahman 2007a; Sjögren 2007; Roffi 2008; Nevens 2010) for genotype one yielded RR 1.47, 95% CI 1.27 to 1.70, when the random‐effects model was used. Data from nine trials (Manns 2001; Fried 2002; Hinrichsen 2002; Fargion 2004; Mangia 2005; Napoli 2005; Rahman 2007b; Horsmans 2008; Roffi 2008) for genotype two or three yielded RR 1.10, 95% CI 1.03 to 1.19, when the random‐effects model was used. Data from nine trials (Manns 2001; Fried 2002; Esmat 2003; Shobokshi 2003; Thakeb 2003; Al‐Faleh 2004; Derbala 2005; Derbala 2006; Wakil 2006) for genotype four yielded RR 1.76, 95% CI 1.30 to 2.39, when the random‐effects model was used. These differences were substantiated by tests of interaction that yielded statistically significant differences between genotype one and genotype two or three (P value < 0.002) and between genotype two or three and genotype four (P value < 0.029).
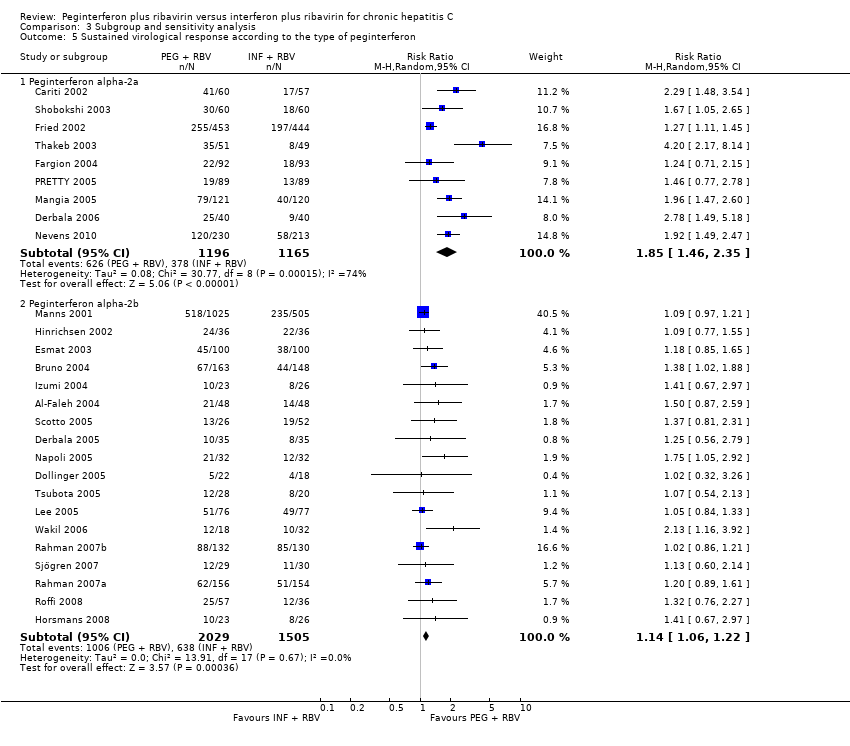
Subgroup analyses showed a pronounced difference in comparative treatment effects by type of peginterferon (Analysis 3.5; Analysis 3.6). Data from nine trials (Cariti 2002; Fried 2002; Shobokshi 2003; Thakeb 2003; Fargion 2004; Mangia 2005; PRETTY 2005; Derbala 2006; Nevens 2010) assessing peginterferon alpha‐2a yielded RR 1.85 (95% CI 1.46 to 2.35) by using the random‐effects model. Data from 18 trials (Manns 2001; Hinrichsen 2002; Esmat 2003; Al‐Faleh 2004; Bruno 2004; Izumi 2004; Derbala 2005; Dollinger 2005; Lee 2005; Napoli 2005; Scotto 2005; Tsubota 2005; Wakil 2006; Rahman 2007a; Rahman 2007b; Sjögren 2007; Horsmans 2008; Roffi 2008) assessing peginterferon alpha‐2b yielded RR 1.14, 95% CI 1.06 to 1.22, when the random‐effects model was used. These differences were substantiated by tests of interaction that yielded statistically significant differences between peginterferon alpha‐2a plus ribavirin and peginterferon alpha‐2b plus ribavirin (P < 0.001).
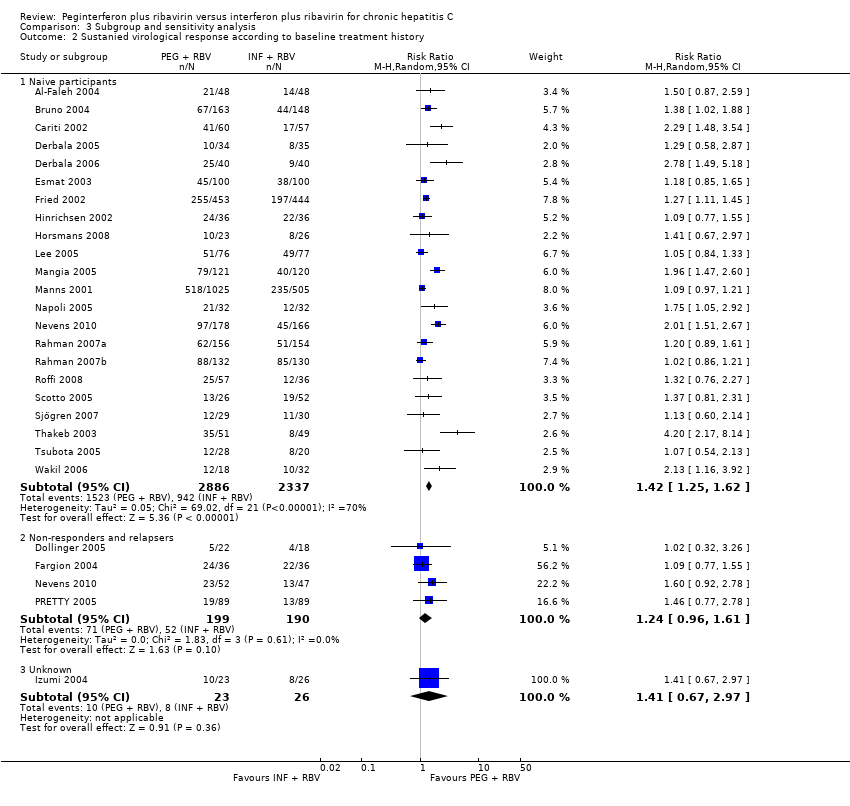
Subgroup analyses on risk of bias (Analysis 3.1), treatment history (Analysis 3.2), and baseline viral load (Analysis 3.4) using RR as the measure of effect yielded similar results favouring peginterferon over interferon. Tests of interactions of the latter subgroup analyses were non‐significant.
A sensitivity analysis from which we excluded the three trials in which amantadine was used as triple therapy in both the peginterferon plus ribavirin group and the interferon plus ribavirin group yielded similar significant results favouring peginterferon (Analysis 3.7).
Summary of findings table
We prepared a Summary of Findings (SoFs) table for all outcomes but one, ie, quality of life (summary of findings Table for the main comparison). The SoFs table presents that we can have low confidence in the current evidence on harms measured as morbidity plus mortality and adverse events leading to treatment discontinuation. The meta‐analysis on morbidity plus mortality showed a very serious imprecision because only nine events were included in the meta‐analysis with five trials. In the meta‐analysis on adverse events, serious discrepancies across trials and lack of precision were evident. The proportions of observed adverse events differ substantially across the trials, and the direction of effect is heterogeneous. However, because the event proportion is still relatively low across the trials, all included trials may be subject to a considerable risk of random errors, thus explaining the apparent heterogeneity in direction of estimates. The observed treatment effects differ in magnitude as well, but most confidence intervals show considerable overlap. In addition, we can have a very low confidence in the current evidence on treatment benefits measured as sustained virological response.
Discussion
Summary of main results
A major obstacle to treatment and patient compliance is the association of combined antiviral therapy with frequent and sometimes serious adverse events. Timely recognition of adverse events has a crucial role in the continuation of antiviral therapy with a hope for successful virological treatment results. In clinical trials, approximately 10% to 15% of participants discontinue peginterferon and ribavirin therapy because of adverse effects; in clinical practice, the rate of treatment discontinuation has been reported as substantially higher (Sulkowski 2011). The adverse effects of combined antiviral therapy are numerous and can be observed in many organ systems. The most common adverse effects are haematological, dermatological, neurological, immunological, gastrointestinal, pulmonary, cardiovascular, and ocular (Sulkowski 2011). We are lacking data on direct comparisons of different types of interferons. Among the most frequent adverse effects is myelosuppression. Neutrophil count decreases by an average of 34% (Soza 2002), and mean platelet drop is around 42% (Roomer 2010). Regarding haemoglobin levels, more than 50% of participants experienced a decrease in haemoglobin to around 30 g/L. Women are more prone to experiencing a haemoglobin level less than 100 g/L (Sulkowski 2004). Many of those adverse effects usually require only adjustment of antiviral therapy. In some patients, application of growth factors is needed because of haematological disturbances. Psychiatric disturbances and mood alterations associated with long‐term interferon therapy are well described. In some trials (Constant 2005), mood alterations occurred in 32% of participants, and significant depressive symptoms were noted in 21% to 58% of participants (Raison 2005). Retinopathy associated with pegylated interferon therapy has been reported in 21% of participants, but the vast majority of participants recovered without cessation of treatment (Lim 2010). Among the rare adverse events that could be linked to combined antiviral therapy are some potentially fatal disorders that are usually reported as case reports. Pulmonary complications such as pneumonitis and pulmonary hypertension are rare but require early detection and premature cessation of antiviral therapy (Kumar 2002; Dhillon 2010; Slavenburg 2010). In one trial, mortality secondary to pneumonitis was seen exclusively with peginterferon alpha‐2b (Slavenburg 2010).
In this systematic review, we have summarised the available evidence from randomised clinical trials comparing peginterferon alpha versus interferon alpha, both given in combination with ribavirin. Because of the high risk of bias in the trials, our results seem to suggest that the combination of peginterferon plus ribavirin is associated with a moderate or low beneficial effect on sustained virological response when compared with interferon plus ribavirin. Our results show that evidence on liver‐related morbidity plus all‐cause mortality is sparse, and that the meta‐analysis is underpowered to detect any difference in risk of liver‐related morbidity plus all‐cause mortality. However, regarding adverse events, the two regimens seem to differ significantly, with interferon plus ribavirin causing less harm than peginterferon plus ribavirin.
Both peginterferon alpha‐2a and peginterferon alpha‐2b plus ribavirin were superior in terms of sustained virological response when compared with interferon plus ribavirin for participants with chronic hepatitis. Our subgroup analyses demonstrated that peginterferon alpha‐2a was associated with a significantly higher sustained virological response than peginterferon alpha‐2b versus interferon. This indirect observation is in harmony with our previous observations from head‐to‐head trials that peginterferon alpha‐2a leads to sustained virological response in a greater number of participants than is seen with peginterferon alpha‐2b (Awad 2010; Hauser 2014).
Overall completeness and applicability of evidence
The Summary of Findings table that we have prepared reveals that, in generalwe can have only low confidence in the current evidence on harms measured as liver‐related morbidity plus all‐cause mortality, and adverse events or adverse events leading to treatment discontinuation. In addition, we can have very low confidence in the current evidence on treatment benefits measured as sustained virological response (summary of findings Table for the main comparison). All trials had high risks of bias. If we disregarded bias due to lack of blinding and due to vested interests, about half of the trials could be considered trials with a lower risk of bias. Our sensitivity analyses, however, showed no important influence of bias risk on our estimates of intervention effects. This may be due to the fact that we were unable to identify trials with a lower risk of bias. In our study, trials that adequately reported on the methodology of trial performance are large trials that dominate the pooled estimates of effect. Therefore, it is less likely that the pooled estimates are biased. In the meta‐analysis for sustained virological response, no serious inconsistencies were seen across trials, and the meta‐analyses crossed the Lan‐DeMets monitoring boundary, leaving out any random error. The only trial with blinded assessment of sustained virological response showed no significant differences between the two interventions but suffered from the fact that it was very small (Sjögren 2007).
Subgroup analyses for sustained virological response showed a pronounced difference in comparative treatment effects by genotype and type of peginterferon. Data from 16 trials for genotype one yielded RR 1.5, 95% CI 1.3 to 1.7. Data from nine trials for genotype two or three yielded RR 1.1, 95% CI 1.0 to 1.2. Data from nine trials for genotype four yielded RR 1.8, 95% CI 1.3 to 2.4. These differences were substantiated by tests of interaction that yielded statistically significant differences between genotype one and genotype two or three (P value 0.0002) and between genotype two or three and genotype four (P value 0.029). The larger effects of peginterferons versus interferons on sustained virological response were observed in participants infected with genotype one and genotype four, whereas the difference between peginterferon and interferon was least for participants infected with genotype two or three.
Moreover, peginterferon alpha‐2a plus ribavirin seemed significantly more effective than peginterferon alpha‐2b plus ribavirin when compared with interferon plus ribavirin in subgroup analyses. Data from nine trials for peginterferon alpha‐2a yielded RR 1.9, 95% CI 1.5 to 2.4. Data from 18 trials for peginterferon alpha‐2b yielded only RR 1.1, 95% CI 1.1 to 1.2. These differences were substantiated by tests of interaction that yielded statistically significant differences between peginterferon alpha‐2a plus ribavirin and peginterferon alpha‐2b plus ribavirin trials (P < 0.0001). This is in accordance with our previous observations based on head‐to‐head randomised clinical trials comparing peginterferon alpha‐2a versus peginterferon alpha‐2b (Awad 2010; Hauser 2014).
All other tests of interaction regarding risk of bias (lower risk of bias compared with high risk of bias), treatment history, and baseline viral load yielded non‐significant results.
We found three trials that used amantadine cointervention, four trials that used consensus interferon, and one trial that used leucocyte interferon. However, the paucity of evidence precludes any firm conclusions on effects of triple therapy regimens with the use of amantadine, leucocyte interferon, or consensus interferon. Our analyses strengthen the evidence that peginterferon plus ribavirin increases sustained virological response for participants with chronic hepatitis C, irrespective of genotype, previous antiviral status, or viral load, and with or without amantadine as cointervention.
Quality of the evidence
The methodological quality was unclearly reported in a considerable number of included trials. Only 14 of the 27 trials (51.9%) reported adequate randomisation and allocation concealment. Most trial reports described unclearly blinded outcome assessment. These aspects may be essential in minimising the risks of selection, performance, and ascertainment bias in individual trials (Schulz 1995; Moher 1998; Kjaergard 2001; Wood 2008; Lundh 2012; Savovic 2012; Savovic 2012a). However, we found no significant association between methodological quality and trial results (Analysis 3.1).These findings may support the robustness of our results but do not exclude the possibility of bias, especially as we could not assess risk of bias from blinding and vested interests. Industry support is known to significantly bias trial results (Lundh 2012). Regarding blinding, only one trial assessed sustained virological response with blinding and found no significant effect of pegylated interferon versus interferon (Sjögren 2007). However, this trial was small, and the confidence interval was accordingly wide (Sjögren 2007).
Selective outcome reporting was difficult to assess in this review. None of the included trials was adequately registered or had its protocol publicly available before trial completion (Krleza‐Jeric 2005; WHO 2009). It is hoped that the initiation of the World Health Organization International Clinical Trials Registry Platform will facilitate such assessments for future trials (WHO 2009). Another limitation in this review was insufficient design and reporting. Investigators of future trials therefore are well advised to adhere to the guidelines of Standard Protocol Items: Recommendations for Interventional Trials (SPIRIT) (Chan 2013) and the Consolidated Standards for Reporting of Trials (CONSORT) (Moher 2012) to improve the quality of trials.
In general, we can have only low confidence in the current evidence on harms measured as morbidity plus mortality and adverse events leading to discontinuation, whereas we can have moderate confidence in the current evidence on treatment benefits measured as sustained virological response (summary of findings Table for the main comparison). In the meta‐analysis for morbidity plus mortality, very serious imprecision was evident because only nine events were included in the meta‐analysis from five trials (Fried 2002; Esmat 2003; Al‐Faleh 2004; Lee 2005; Nevens 2010).
In the meta‐analysis on adverse events, serious discrepancies across trials and lack of precision were noted. The proportions of observed adverse events differ substantially across trials, and the direction of effect is heterogeneous. However, because the event rate is still relatively low across trials, all of the included trials may be subject to considerable random error, thus explaining the apparent heterogeneity in direction of estimates. The observed treatment effects differ in magnitude as well, but most confidence intervals show considerable overlap. In the meta‐analysis for sustained virological response, no serious inconsistencies across studies were evident, and the meta‐analyses showed adequate precision (i.e., the TSA alpha‐spending monitoring boundary for benefit was crossed, favouring pegylated interferon). Nonetheless, we had some concerns regarding bias (which was high in all trials) and indirectness, as all included randomised clinical trials had virological response as the predominant measure of benefit. Many of the trials measured sustained virological response, which is currently the commonly used surrogate outcome measure of benefit. Recent large cohort studies show a positive correlation between the presence of viraemia and mortality (Adeel 2009; Hirofumi 2009). However, it is important to remember that sustained virological response still is only a putative (unvalidated) surrogate outcome for the patient‐relevant intervention effects of antivirals (Gluud 2007; Koretz 2013; Gurusamy 2013). Because randomised clinical trials need to inform clinical practice, clinical outcomes such as risk of liver failure, hepatocellular carcinoma, mortality, and quality of life would be of greater interest to patients and clinicians. Such measures nevertheless require a follow‐up of maybe up to five years. Currently, no randomised clinical trials assessing the two pegylated interferons are of such long duration.
Potential biases in the review process
The included meta‐analyses had a seemingly reasonable mix of small and large studies, yielding fairly consistent results, thus causing little concern about the presence of publication bias.
The strengths of this Cochrane Hepato‐Biliary Group systematic review are that it builds on a peer‐reviewed published protocol, uses extensive searches until recently (Appendix 1), considers risks of systematic errors (‘bias’) (Schulz 1995; Moher 1998; Kjaergard 2001; Wood 2008; Lundh 2012; Savovic 2012; Savovic 2012a), and considers risks of random errors (‘play of chance’) by adjusting the threshold for statistical significance according to the information and strength of evidence present in the cumulative meta‐analysis (Brok 2008; Wetterslev 2008; Brok 2009; Thorlund 2009, Wetterslev 2009; Thorlund 2010). Furthermore, to avoid publication and ascertainment bias, we included trials regardless of publication status and language, and all data were abstracted independently by at least two review authors to avoid information bias. However, our review has potential limitations that may lower our confidence in the estimates of intervention effect. First, we are aware of possible inclusion bias in excluding special patient groups (hepatitis B virus, human immunodeficiency virus, cancer, and liver‐transplanted patients). Future systematic reviews should assess the intervention effects of antivirals in these patient groups. Second, a possible limitation of our review is the lack of availability of full reports of all included trials. Ten of the 27 included trials were available only as abstracts. However, including these abstracts in our systematic review may likely be a strength rather than a limitation. By including abstracts, we are looking at the complete available body of evidence. By excluding abstracts, we would have been looking only at a subset defined through present‐day publication mechanisms, favouring trials that show beneficial effects. This would considerably increase the likelihood of publication bias. Third, in general, adverse events were reported insufficiently. Most of the participants treated with peginterferon alpha or interferon alpha experience one or more adverse effects (e.g., influenza‐like symptoms, depression, neutropenia, thrombocytopenia). The proportions of observed adverse events differed greatly across trials, and the direction of effect was heterogeneous.
Agreements and disagreements with other studies or reviews
By comparing our results with those of the other meta‐analyses, we have found two main differences. Our searches of the literature were much more detailed than searches previously conducted. In previous meta‐analyses, authors usually did not perform grey literature searches and did not include meeting abstracts. Some authors excluded trials that were not published in English or used just two databases (Chander 2002; Zaman 2003), performed only cost‐effectives analysis (Shepherd 2005; Siebert 2005), or evaluated only one genotype (Khuroo 2004; Aljumah 2013). Second, we performed several sensitivity analyses to ensure the robustness of the results of our systematic review; this procedure is lacking in previously published meta‐analyses. Moreover, our number of included trials is much higher than the number included in the meta‐analyses mentioned above. Fourth, we considered risk of bias. Fifth, we also took precautions to interpret the statistical inference according to the strength of the evidence. In this vein, we constructed adjusted thresholds for statistical significance by using TSA.
Methodological quality graph: review authors' judgements about all methodological quality items presented as percentages across all included studies.

Methodological quality summary: review authors' judgements about each methodological quality item for each included study.

Funnel plot of comparison: peginterferon plus ribavirin versus non‐pegylated interferon plus ribavirin, outcome: 1.2 Adverse events leading to treatment discontinuation.
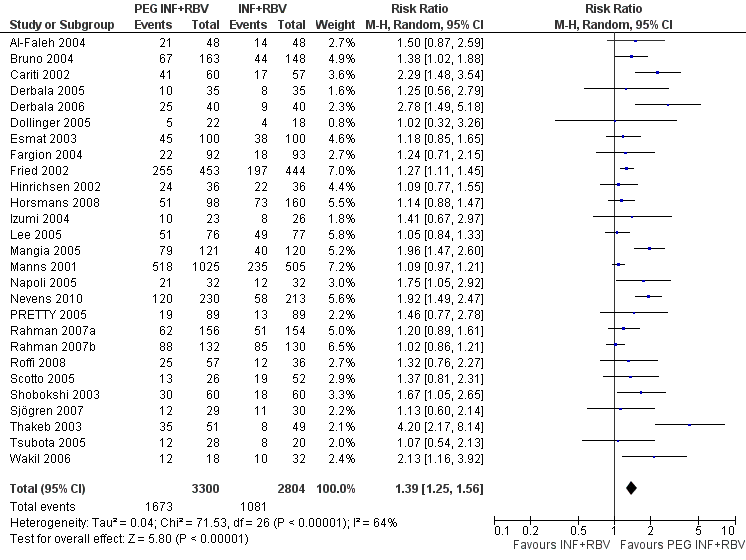
Forest plot of comparison: pegylated interferon plus ribavirin versus interferon plus ribavirin, outcome: 1.1 Sustained virological response.

Funnel plot of comparison: pegylated interferon plus ribavirin versus interferon plus ribavirin, outcome: 1.1 Sustained virological response.
Trial sequential analysis (TSA): pegylated interferon plus ribavirin versus interferon plus ribavirin ‐ sustained virological response.
Lan‐DeMets statistical monitoring boundaries for assessing statistical significance regarding sustained virological response to pegylated interferon plus ribavirin versus interferon plus ribavirin. The diversity‐adjusted required information size of n = 14,486 was calculated based on an event proportion of 50.6% of participants in the interferon‐treated group (Pc) with a risk ratio (RR) reduction of 10% in pegylated interferon group; an alpha (a, type I error) of 5%, a beta (b, type II error) of 10%, and the observed diversity D = 72%.
The solid blue curve presents the cumulative meta‐analysis test Z‐score and the inward sloping red curves present the adjusted threshold for statistical significance according to the two‐sided Lan‐DeMets trial sequential boundaries. The cumulative Z‐score crosses the boundaries for superiority, and this corresponds with superiority of pegylated interferon.

Trial sequential analysis (TSA): pegylated interferon plus ribavirin versus interferon plus ribavirin ‐ sustained virological response.
Lan‐DeMets statistical monitoring boundaries for assessing statistical significance regarding sustained virological response to pegylated interferon plus ribavirin versus interferon plus ribavirin. The diversity‐adjusted required information size of n = 20,513 was calculated based on an event proportion of 50.6% of participants in the interferon‐treated group (Pc) with a risk ratio (RR) reduction of 10% in the pegylated interferon group; an alpha (a, type I error) of 1%, a beta (b, type II error) of 10%, and the observed diversity D = 72%.
The solid blue curve presents the cumulative meta‐analysis test Z‐score and the inward sloping red curves present the adjusted threshold for statistical significance according to the two‐sided Lan‐DeMets trial sequential monitoring boundaries. The cumulative Z‐score crosses the boundaries for superiority, and this corresponds with the superiority of pegylated interferon.

Comparison 1 Peginterferon plus ribavirin versus non‐pegylated interferon plus ribavirin, Outcome 1 Liver‐related morbidity plus all‐cause mortality.

Comparison 1 Peginterferon plus ribavirin versus non‐pegylated interferon plus ribavirin, Outcome 2 Adverse events leading to treatment discontinuation.

Comparison 1 Peginterferon plus ribavirin versus non‐pegylated interferon plus ribavirin, Outcome 3 Sustained virological response.

Comparison 2 Adverse events, Outcome 1 Haematological effects.
Comparison 2 Adverse events, Outcome 2 Fatigue and flu‐like symptoms.

Comparison 2 Adverse events, Outcome 3 Psychiatric symptoms.

Comparison 2 Adverse events, Outcome 4 Dermatological symptoms.
Comparison 2 Adverse events, Outcome 5 Thyroid malfunction.

Comparison 2 Adverse events, Outcome 6 Gastrointestinal symptoms.

Comparison 3 Subgroup and sensitivity analysis, Outcome 1 Sustanied virological response according to trial methodological quality.
Comparison 3 Subgroup and sensitivity analysis, Outcome 2 Sustanied virological response according to baseline treatment history.

Comparison 3 Subgroup and sensitivity analysis, Outcome 3 Sustained virological response according to genotype.

Comparison 3 Subgroup and sensitivity analysis, Outcome 4 Sustained virological response according to baseline viral load.
Comparison 3 Subgroup and sensitivity analysis, Outcome 5 Sustained virological response according to the type of peginterferon.

Comparison 3 Subgroup and sensitivity analysis, Outcome 6 Sustained virological response according to the type of peginterferon and the type of interferon.

Comparison 3 Subgroup and sensitivity analysis, Outcome 7 Sustained virological response in trials with or without amantadine.
| Peginterferon plus ribavirin versus non‐pegylated interferon plus ribavirin for chronic hepatitis C | ||||||
| Patient or population: patients with chronic hepatitis C. | ||||||
| Outcomes | Illustrative comparative risks* (95% CI) | Relative effect | No of participants | Quality of the evidence | Comments | |
| Assumed risk | Corresponding risk | |||||
| Non‐pegylated | Peginterferon | |||||
| Liver‐related morbidity plus all‐cause mortality | Five per 1000 | Six per 1000 | OR 1.14 | 1789 | ⊕⊕⊝⊝ | |
| Adverse events leading to treatment discontinuation | 207 per 1000 | 178 per 1000 | RR 0.86 | 4571 | ⊕⊕⊝⊝ | |
| Sustained virological response | 386 per 1000 | 537 per 1000 | RR 1.39 | 6104 | ⊕⊝⊝⊝4,5 | All trials had high risks of bias. Only an unvalidated surrogate outcome. |
| *The basis for the assumed risk (e.g., the median control group risk across studies) is provided in footnotes. The corresponding risk (and its 95% confidence interval) is based on the assumed risk in the comparison group and the relative effect of the intervention (and its 95% CI). | ||||||
| GRADE Working Group grades of evidence. | ||||||
| 1Low due to imprecision and indirectness wide confidence interval. The meta‐analysis included only nine events. 2Low due to imprecision and indirectness.The proportions of observed adverse events differ substantially across trials, and the direction of effect is heterogeneous. However, because the event rate is still relatively low across trials, all of the included trials may be subject to considerable random error, thus explaining the apparent heterogeneity in the direction of estimates. 4Sustained virological response does not seem to be a valid surrogate marker for assessing hepatitis C virus treatment efficacy of interferon treatment. Very low due to high risk of bias in all trials and imprecision and indirectness due to surrogate | ||||||
| Outcome or subgroup title | No. of studies | No. of participants | Statistical method | Effect size |
| 1 Liver‐related morbidity plus all‐cause mortality Show forest plot | 5 | 1789 | Odds Ratio (M‐H, Fixed, 95% CI) | 1.14 [0.38, 3.42] |
| 2 Adverse events leading to treatment discontinuation Show forest plot | 17 | 4868 | Risk Ratio (M‐H, Random, 95% CI) | 0.86 [0.66, 1.12] |
| 3 Sustained virological response Show forest plot | 27 | 6104 | Risk Ratio (M‐H, Random, 95% CI) | 1.39 [1.25, 1.56] |
| Outcome or subgroup title | No. of studies | No. of participants | Statistical method | Effect size |
| 1 Haematological effects Show forest plot | 13 | Risk Ratio (M‐H, Fixed, 95% CI) | Subtotals only | |
| 1.1 Anaemia | 13 | 3854 | Risk Ratio (M‐H, Fixed, 95% CI) | 1.12 [0.98, 1.27] |
| 1.2 Neutropenia | 13 | 3855 | Risk Ratio (M‐H, Fixed, 95% CI) | 2.15 [1.76, 2.61] |
| 1.3 Thrombocytopenia | 10 | 2195 | Risk Ratio (M‐H, Fixed, 95% CI) | 2.63 [1.68, 4.11] |
| 2 Fatigue and flu‐like symptoms Show forest plot | 13 | Risk Ratio (M‐H, Fixed, 95% CI) | Subtotals only | |
| 2.1 General fatigue | 11 | 3608 | Risk Ratio (M‐H, Fixed, 95% CI) | 1.01 [0.96, 1.07] |
| 2.2 Headache | 6 | 3146 | Risk Ratio (M‐H, Fixed, 95% CI) | 1.00 [0.93, 1.07] |
| 2.3 Rigours | 4 | 2641 | Risk Ratio (M‐H, Fixed, 95% CI) | 0.98 [0.88, 1.08] |
| 2.4 Arthralgia | 4 | 2934 | Risk Ratio (M‐H, Fixed, 95% CI) | 1.19 [1.05, 1.35] |
| 2.5 Myalgia | 5 | 3087 | Risk Ratio (M‐H, Fixed, 95% CI) | 0.98 [0.90, 1.06] |
| 2.6 Pyrexia | 6 | 3180 | Risk Ratio (M‐H, Fixed, 95% CI) | 1.08 [0.99, 1.18] |
| 2.7 Weight loss | 6 | 2524 | Risk Ratio (M‐H, Fixed, 95% CI) | 1.17 [0.98, 1.39] |
| 2.8 Asthenia | 3 | 2126 | Risk Ratio (M‐H, Fixed, 95% CI) | 1.05 [0.88, 1.25] |
| 3 Psychiatric symptoms Show forest plot | 12 | Risk Ratio (M‐H, Fixed, 95% CI) | Subtotals only | |
| 3.1 Depression | 12 | 3743 | Risk Ratio (M‐H, Fixed, 95% CI) | 0.91 [0.82, 1.02] |
| 3.2 Insomnia | 5 | 3087 | Risk Ratio (M‐H, Fixed, 95% CI) | 1.00 [0.91, 1.10] |
| 3.3 Irritability | 3 | 2491 | Risk Ratio (M‐H, Fixed, 95% CI) | 0.97 [0.86, 1.09] |
| 4 Dermatological symptoms Show forest plot | 8 | Risk Ratio (M‐H, Fixed, 95% CI) | Subtotals only | |
| 4.1 Alopecia | 5 | 3087 | Risk Ratio (M‐H, Fixed, 95% CI) | 0.98 [0.88, 1.09] |
| 4.2 Pruritus | 5 | 3027 | Risk Ratio (M‐H, Fixed, 95% CI) | 1.10 [0.96, 1.25] |
| 4.3 Skin rash | 5 | 2740 | Risk Ratio (M‐H, Fixed, 95% CI) | 1.08 [0.93, 1.25] |
| 4.4 Injection site reaction | 4 | 1817 | Risk Ratio (M‐H, Fixed, 95% CI) | 1.71 [1.50, 1.93] |
| 5 Thyroid malfunction Show forest plot | 8 | 1222 | Risk Ratio (M‐H, Fixed, 95% CI) | 1.20 [0.73, 2.00] |
| 6 Gastrointestinal symptoms Show forest plot | 6 | Risk Ratio (M‐H, Fixed, 95% CI) | Subtotals only | |
| 6.1 Decreased appetite | 6 | 3136 | Risk Ratio (M‐H, Fixed, 95% CI) | 1.05 [0.93, 1.19] |
| 6.2 Nausea | 4 | 3023 | Risk Ratio (M‐H, Fixed, 95% CI) | 1.13 [1.01, 1.26] |
| 6.3 Diarrhoea | 3 | 2126 | Risk Ratio (M‐H, Fixed, 95% CI) | 1.15 [0.93, 1.41] |
| Outcome or subgroup title | No. of studies | No. of participants | Statistical method | Effect size |
| 1 Sustanied virological response according to trial methodological quality Show forest plot | 27 | Risk Ratio (M‐H, Random, 95% CI) | Subtotals only | |
| 1.1 Lower risk of bias trials | 14 | 4285 | Risk Ratio (M‐H, Random, 95% CI) | 1.33 [1.17, 1.51] |
| 1.2 High risk of bias trials | 13 | 1819 | Risk Ratio (M‐H, Random, 95% CI) | 1.55 [1.23, 1.95] |
| 2 Sustanied virological response according to baseline treatment history Show forest plot | 26 | Risk Ratio (M‐H, Random, 95% CI) | Subtotals only | |
| 2.1 Naive participants | 22 | 5223 | Risk Ratio (M‐H, Random, 95% CI) | 1.42 [1.25, 1.62] |
| 2.2 Non‐responders and relapsers | 4 | 389 | Risk Ratio (M‐H, Random, 95% CI) | 1.24 [0.96, 1.61] |
| 2.3 Unknown | 1 | 49 | Risk Ratio (M‐H, Random, 95% CI) | 1.41 [0.67, 2.97] |
| 3 Sustained virological response according to genotype Show forest plot | 27 | Risk Ratio (M‐H, Random, 95% CI) | Subtotals only | |
| 3.1 Genotype one | 16 | 3548 | Risk Ratio (M‐H, Random, 95% CI) | 1.47 [1.27, 1.70] |
| 3.2 Genotypes two and three | 9 | 1659 | Risk Ratio (M‐H, Random, 95% CI) | 1.10 [1.03, 1.19] |
| 3.3 Genotype four | 9 | 721 | Risk Ratio (M‐H, Random, 95% CI) | 1.76 [1.30, 2.39] |
| 4 Sustained virological response according to baseline viral load Show forest plot | 27 | Risk Ratio (M‐H, Random, 95% CI) | Subtotals only | |
| 4.1 High viral load | 5 | 1777 | Risk Ratio (M‐H, Random, 95% CI) | 1.33 [1.01, 1.75] |
| 4.2 Low viral Load | 5 | 1027 | Risk Ratio (M‐H, Random, 95% CI) | 1.29 [1.05, 1.58] |
| 4.3 Predominantly high viral load (more than 65% of total participants) | 1 | 96 | Risk Ratio (M‐H, Random, 95% CI) | 1.5 [0.87, 2.59] |
| 4.4 Predominantly low viral load (more than 65% of total participants) | 6 | 920 | Risk Ratio (M‐H, Random, 95% CI) | 1.58 [1.22, 2.06] |
| 4.5 Similar proportions of high and low baseline viral loads | 4 | 607 | Risk Ratio (M‐H, Random, 95% CI) | 1.31 [1.01, 1.70] |
| 4.6 Unknown baseline viral load | 11 | 1690 | Risk Ratio (M‐H, Random, 95% CI) | 1.38 [1.11, 1.71] |
| 5 Sustained virological response according to the type of peginterferon Show forest plot | 27 | Risk Ratio (M‐H, Random, 95% CI) | Subtotals only | |
| 5.1 Peginterferon alpha‐2a | 9 | 2361 | Risk Ratio (M‐H, Random, 95% CI) | 1.85 [1.46, 2.35] |
| 5.2 Peginterferon alpha‐2b | 18 | 3534 | Risk Ratio (M‐H, Random, 95% CI) | 1.14 [1.06, 1.22] |
| 6 Sustained virological response according to the type of peginterferon and the type of interferon Show forest plot | 27 | Risk Ratio (M‐H, Random, 95% CI) | Subtotals only | |
| 6.1 Peginterferon alpha‐2a versus interferon alpha‐2a | 8 | 1464 | Risk Ratio (M‐H, Random, 95% CI) | 1.98 [1.63, 2.40] |
| 6.2 Peginterferon alpha‐2a versus interferon alpha‐2b | 1 | 897 | Risk Ratio (M‐H, Random, 95% CI) | 1.27 [1.11, 1.45] |
| 6.3 Peginterferon alpha‐2b versus interferon alpha‐2b | 13 | 2799 | Risk Ratio (M‐H, Random, 95% CI) | 1.15 [1.06, 1.25] |
| 6.4 Peginterferon alpha‐2b versus consensus interferon | 4 | 671 | Risk Ratio (M‐H, Random, 95% CI) | 1.07 [0.92, 1.23] |
| 6.5 Peginterferon alpha‐2b versus leucocyte interferon | 1 | 64 | Risk Ratio (M‐H, Random, 95% CI) | 1.75 [1.05, 2.92] |
| 7 Sustained virological response in trials with or without amantadine Show forest plot | 27 | Risk Ratio (M‐H, Random, 95% CI) | Subtotals only | |
| 7.1 Trial without amantadine | 24 | 5500 | Risk Ratio (M‐H, Random, 95% CI) | 1.37 [1.22, 1.53] |
| 7.2 Trial with amantadine | 3 | 604 | Risk Ratio (M‐H, Random, 95% CI) | 1.68 [1.26, 2.23] |