| 1 Sustanied virological response according to trial methodological quality Show forest plot | 27 | | Risk Ratio (M‐H, Random, 95% CI) | Subtotals only |
|
| 1.1 Lower risk of bias trials | 14 | 4285 | Risk Ratio (M‐H, Random, 95% CI) | 1.33 [1.17, 1.51] |
| 1.2 High risk of bias trials | 13 | 1819 | Risk Ratio (M‐H, Random, 95% CI) | 1.55 [1.23, 1.95] |
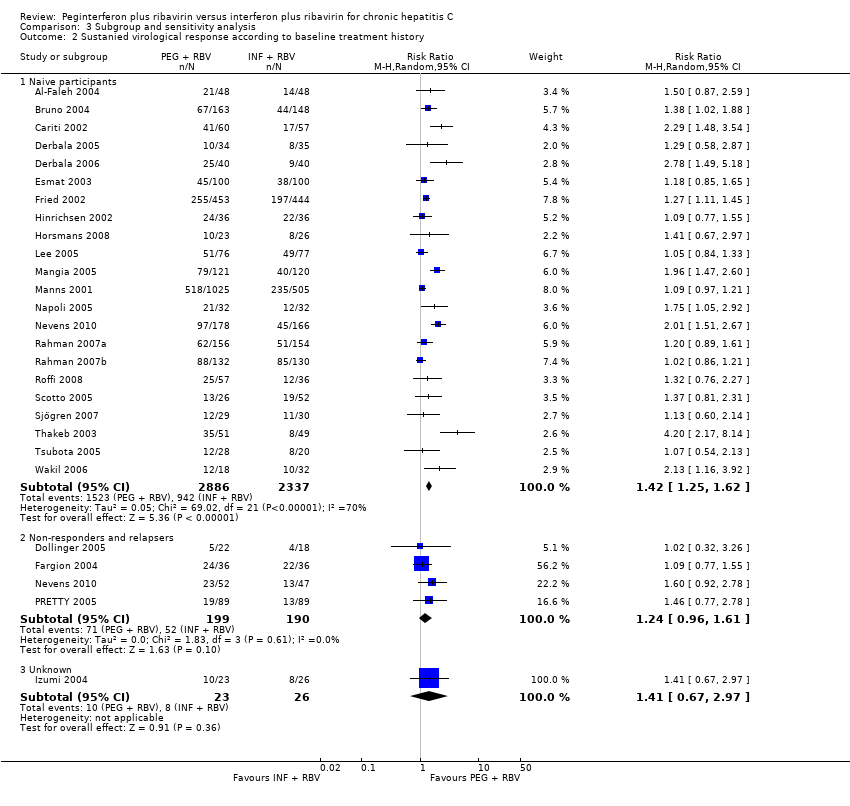
| 2 Sustanied virological response according to baseline treatment history Show forest plot | 26 | | Risk Ratio (M‐H, Random, 95% CI) | Subtotals only |
|
| 2.1 Naive participants | 22 | 5223 | Risk Ratio (M‐H, Random, 95% CI) | 1.42 [1.25, 1.62] |
| 2.2 Non‐responders and relapsers | 4 | 389 | Risk Ratio (M‐H, Random, 95% CI) | 1.24 [0.96, 1.61] |
| 2.3 Unknown | 1 | 49 | Risk Ratio (M‐H, Random, 95% CI) | 1.41 [0.67, 2.97] |
| 3 Sustained virological response according to genotype Show forest plot | 27 | | Risk Ratio (M‐H, Random, 95% CI) | Subtotals only |
|
| 3.1 Genotype one | 16 | 3548 | Risk Ratio (M‐H, Random, 95% CI) | 1.47 [1.27, 1.70] |
| 3.2 Genotypes two and three | 9 | 1659 | Risk Ratio (M‐H, Random, 95% CI) | 1.10 [1.03, 1.19] |
| 3.3 Genotype four | 9 | 721 | Risk Ratio (M‐H, Random, 95% CI) | 1.76 [1.30, 2.39] |
| 4 Sustained virological response according to baseline viral load Show forest plot | 27 | | Risk Ratio (M‐H, Random, 95% CI) | Subtotals only |
|
| 4.1 High viral load | 5 | 1777 | Risk Ratio (M‐H, Random, 95% CI) | 1.33 [1.01, 1.75] |
| 4.2 Low viral Load | 5 | 1027 | Risk Ratio (M‐H, Random, 95% CI) | 1.29 [1.05, 1.58] |
| 4.3 Predominantly high viral load (more than 65% of total participants) | 1 | 96 | Risk Ratio (M‐H, Random, 95% CI) | 1.5 [0.87, 2.59] |
| 4.4 Predominantly low viral load (more than 65% of total participants) | 6 | 920 | Risk Ratio (M‐H, Random, 95% CI) | 1.58 [1.22, 2.06] |
| 4.5 Similar proportions of high and low baseline viral loads | 4 | 607 | Risk Ratio (M‐H, Random, 95% CI) | 1.31 [1.01, 1.70] |
| 4.6 Unknown baseline viral load | 11 | 1690 | Risk Ratio (M‐H, Random, 95% CI) | 1.38 [1.11, 1.71] |
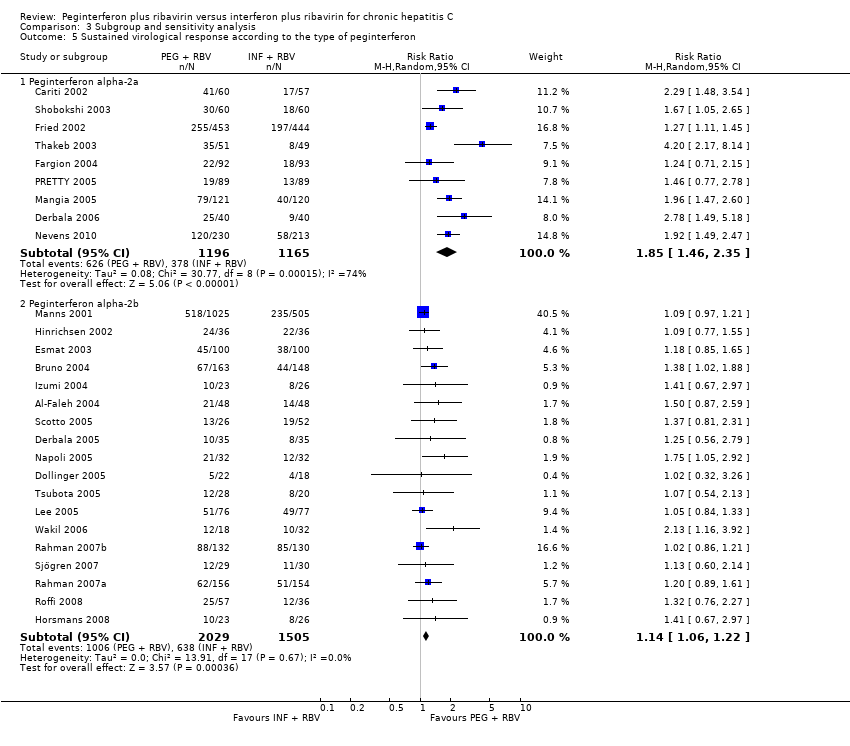
| 5 Sustained virological response according to the type of peginterferon Show forest plot | 27 | | Risk Ratio (M‐H, Random, 95% CI) | Subtotals only |
|
| 5.1 Peginterferon alpha‐2a | 9 | 2361 | Risk Ratio (M‐H, Random, 95% CI) | 1.85 [1.46, 2.35] |
| 5.2 Peginterferon alpha‐2b | 18 | 3534 | Risk Ratio (M‐H, Random, 95% CI) | 1.14 [1.06, 1.22] |
| 6 Sustained virological response according to the type of peginterferon and the type of interferon Show forest plot | 27 | | Risk Ratio (M‐H, Random, 95% CI) | Subtotals only |
|
| 6.1 Peginterferon alpha‐2a versus interferon alpha‐2a | 8 | 1464 | Risk Ratio (M‐H, Random, 95% CI) | 1.98 [1.63, 2.40] |
| 6.2 Peginterferon alpha‐2a versus interferon alpha‐2b | 1 | 897 | Risk Ratio (M‐H, Random, 95% CI) | 1.27 [1.11, 1.45] |
| 6.3 Peginterferon alpha‐2b versus interferon alpha‐2b | 13 | 2799 | Risk Ratio (M‐H, Random, 95% CI) | 1.15 [1.06, 1.25] |
| 6.4 Peginterferon alpha‐2b versus consensus interferon | 4 | 671 | Risk Ratio (M‐H, Random, 95% CI) | 1.07 [0.92, 1.23] |
| 6.5 Peginterferon alpha‐2b versus leucocyte interferon | 1 | 64 | Risk Ratio (M‐H, Random, 95% CI) | 1.75 [1.05, 2.92] |
| 7 Sustained virological response in trials with or without amantadine Show forest plot | 27 | | Risk Ratio (M‐H, Random, 95% CI) | Subtotals only |
|
| 7.1 Trial without amantadine | 24 | 5500 | Risk Ratio (M‐H, Random, 95% CI) | 1.37 [1.22, 1.53] |
| 7.2 Trial with amantadine | 3 | 604 | Risk Ratio (M‐H, Random, 95% CI) | 1.68 [1.26, 2.23] |