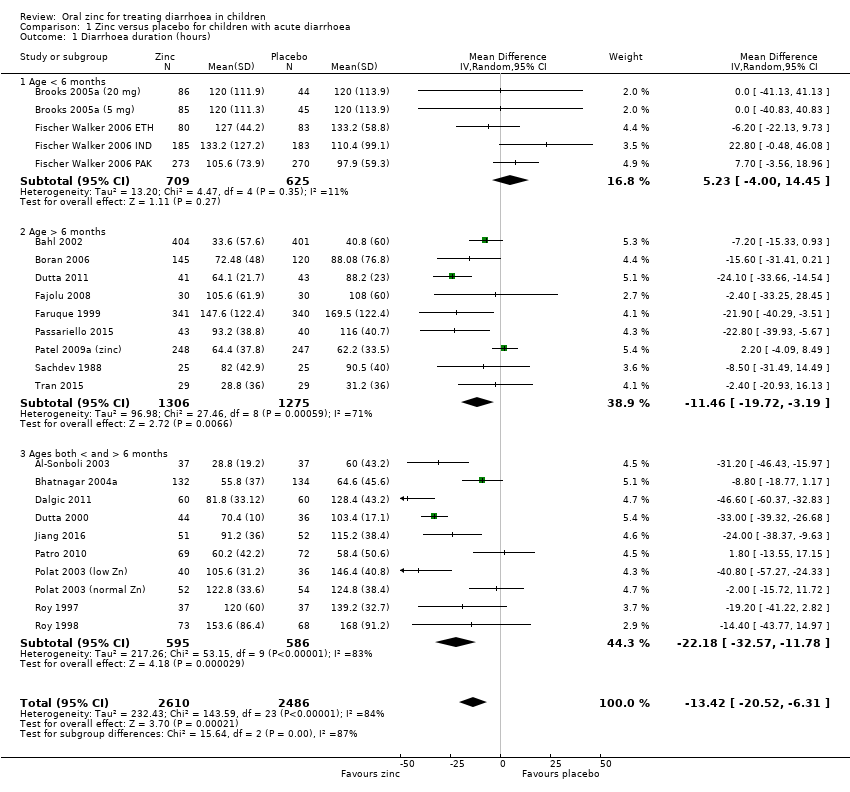
| 1 Diarrhoea duration (hours) Show forest plot | 24 | 5096 | Mean Difference (IV, Random, 95% CI) | ‐13.42 [‐20.52, ‐6.31] |
|
| 1.1 Age < 6 months | 5 | 1334 | Mean Difference (IV, Random, 95% CI) | 5.23 [‐2.00, 14.45] |
| 1.2 Age > 6 months | 9 | 2581 | Mean Difference (IV, Random, 95% CI) | ‐11.46 [‐19.72, ‐3.19] |
| 1.3 Ages both < and > 6 months | 10 | 1181 | Mean Difference (IV, Random, 95% CI) | ‐22.18 [‐32.57, ‐11.78] |
| 2 Diarrhoea duration (hours): subgrouped by nutritional status Show forest plot | 17 | 3518 | Mean Difference (IV, Random, 95% CI) | ‐17.54 [‐25.49, ‐9.58] |
|
| 2.1 Nutritional status: only well‐nourished | 2 | 406 | Mean Difference (IV, Random, 95% CI) | ‐6.79 [‐23.84, 10.26] |
| 2.2 Nutritional status: well‐nourished plus moderately malnourished | 10 | 2693 | Mean Difference (IV, Random, 95% CI) | ‐15.46 [‐25.55, ‐5.36] |
| 2.3 Nutritional status: malnourished | 5 | 419 | Mean Difference (IV, Random, 95% CI) | ‐26.39 [‐36.54, ‐16.23] |
| 3 Diarrhoea duration (hours): subgrouped by sex Show forest plot | 18 | 3621 | Mean Difference (IV, Random, 95% CI) | ‐17.33 [‐25.03, ‐9.62] |
|
| 3.1 Sex: male | 3 | 430 | Mean Difference (IV, Random, 95% CI) | ‐22.35 [‐36.40, ‐8.31] |
| 3.2 Sex: male and female | 15 | 3191 | Mean Difference (IV, Random, 95% CI) | ‐16.13 [‐24.71, ‐7.55] |
| 4 Diarrhoea duration (hours); subgrouped by continent Show forest plot | 18 | 3621 | Mean Difference (IV, Random, 95% CI) | ‐17.33 [‐25.03, ‐9.62] |
|
| 4.1 Continent: Africa | 1 | 60 | Mean Difference (IV, Random, 95% CI) | ‐2.40 [‐33.25, 28.45] |
| 4.2 Continent: Asia | 13 | 3205 | Mean Difference (IV, Random, 95% CI) | ‐19.01 [‐28.19, ‐9.82] |
| 4.3 Continent: South America | 1 | 74 | Mean Difference (IV, Random, 95% CI) | ‐31.20 [‐46.43, ‐15.97] |
| 4.4 Continent: Europe | 2 | 224 | Mean Difference (IV, Random, 95% CI) | ‐10.19 [‐34.29, 13.91] |
| 4.5 Continent: Australia | 1 | 58 | Mean Difference (IV, Random, 95% CI) | ‐2.40 [‐20.93, 16.13] |
| 5 Diarrhoea duration (hours): subgrouped by national risk of zinc deficiency Show forest plot | 16 | 3253 | Mean Difference (IV, Random, 95% CI) | ‐16.99 [‐25.49, ‐8.50] |
|
| 5.1 Region: countries ranked as high risk of zinc deficiency | 8 | 2535 | Mean Difference (IV, Random, 95% CI) | ‐14.97 [‐26.21, ‐3.72] |
| 5.2 Region: countries ranked as medium risk of zinc deficiency | 5 | 436 | Mean Difference (IV, Random, 95% CI) | ‐25.92 [‐44.80, ‐7.04] |
| 5.3 Region: countries ranked as low risk of zinc deficiency | 3 | 282 | Mean Difference (IV, Random, 95% CI) | ‐7.63 [‐22.74, 7.48] |
| 6 Diarrhoea duration (hours): subgrouped by zinc dose Show forest plot | 13 | 2018 | Mean Difference (IV, Random, 95% CI) | ‐20.24 [‐28.84, ‐11.63] |
|
| 6.1 Zinc dose:≤ 20 mg | 9 | 976 | Mean Difference (IV, Random, 95% CI) | ‐18.45 [‐30.19, ‐6.71] |
| 6.2 Zinc dose: > 20 mg | 4 | 1042 | Mean Difference (IV, Random, 95% CI) | ‐23.33 [‐38.30, ‐8.35] |
| 7 Diarrhoea duration (hours): subgrouped by zinc type Show forest plot | 16 | 3454 | Mean Difference (IV, Random, 95% CI) | ‐16.50 [‐25.11, ‐7.89] |
|
| 7.1 Zinc type: zinc acetate | 3 | 875 | Mean Difference (IV, Random, 95% CI) | ‐30.55 [‐49.29, ‐11.82] |
| 7.2 Zinc type: gluconate | 2 | 908 | Mean Difference (IV, Random, 95% CI) | ‐14.51 [‐30.84, 1.81] |
| 7.3 Zinc type: zinc sulphate | 11 | 1671 | Mean Difference (IV, Random, 95% CI) | ‐13.21 [‐24.16, ‐2.27] |
| 8 Diarrhoea duration (hours): subgrouped by study setting Show forest plot | 18 | 3621 | Mean Difference (IV, Random, 95% CI) | ‐17.33 [‐25.03, ‐9.62] |
|
| 8.1 Study setting: hospital | 15 | 2468 | Mean Difference (IV, Random, 95% CI) | ‐17.86 [‐27.01, ‐8.70] |
| 8.2 Study setting:community | 3 | 1153 | Mean Difference (IV, Random, 95% CI) | ‐12.65 [‐21.76, ‐3.54] |
| 9 Diarrhoea duration (hours): subgrouped by concomitant treatment Show forest plot | 18 | 3777 | Mean Difference (IV, Random, 95% CI) | ‐15.68 [‐23.53, ‐7.82] |
|
| 9.1 Concomitant treatment: zinc alone | 17 | 3394 | Mean Difference (IV, Random, 95% CI) | ‐16.95 [‐24.85, ‐9.05] |
| 9.2 Concomitant treatment: zinc plus copper | 1 | 383 | Mean Difference (IV, Random, 95% CI) | 2.20 [‐5.08, 9.48] |
| 10 Diarrhoea on day 3 Show forest plot | 9 | 2063 | Risk Ratio (M‐H, Fixed, 95% CI) | 0.77 [0.69, 0.86] |
|
| 10.1 Age > 6 months | 4 | 1599 | Risk Ratio (M‐H, Fixed, 95% CI) | 0.83 [0.72, 0.94] |
| 10.2 Ages both < and > 6 months | 5 | 464 | Risk Ratio (M‐H, Fixed, 95% CI) | 0.66 [0.56, 0.79] |
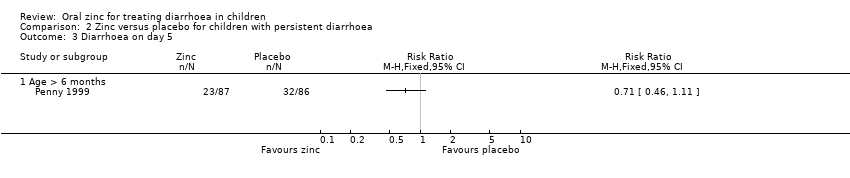
| 11 Diarrhoea on day 5 Show forest plot | 8 | 2307 | Risk Ratio (M‐H, Fixed, 95% CI) | 0.76 [0.64, 0.91] |
|
| 11.1 Age > 6 months | 3 | 1384 | Risk Ratio (M‐H, Fixed, 95% CI) | 0.72 [0.52, 1.01] |
| 11.2 Ages both < and > 6 months | 5 | 923 | Risk Ratio (M‐H, Fixed, 95% CI) | 0.78 [0.64, 0.96] |
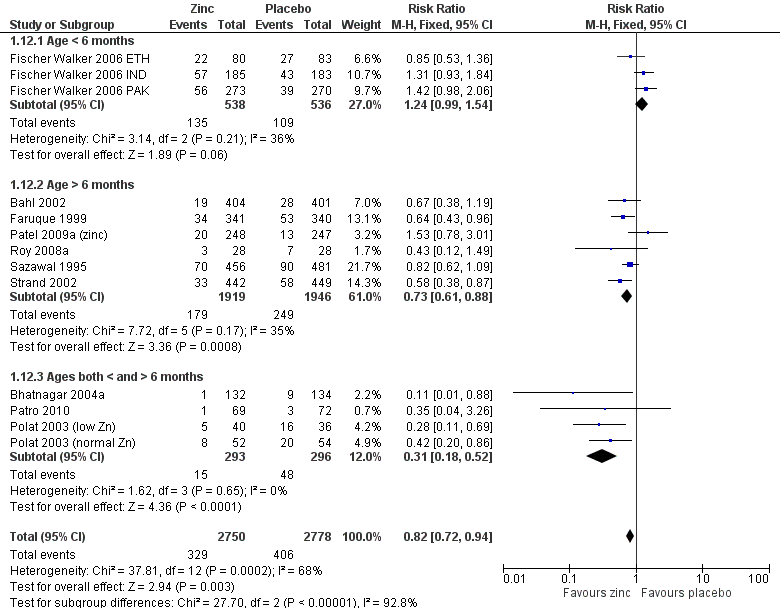
| 12 Diarrhoea on day 7 Show forest plot | 13 | 5528 | Risk Ratio (M‐H, Fixed, 95% CI) | 0.82 [0.72, 0.94] |
|
| 12.1 Age < 6 months | 3 | 1074 | Risk Ratio (M‐H, Fixed, 95% CI) | 1.24 [0.99, 1.54] |
| 12.2 Age > 6 months | 6 | 3865 | Risk Ratio (M‐H, Fixed, 95% CI) | 0.73 [0.61, 0.88] |
| 12.3 Ages both < and > 6 months | 4 | 589 | Risk Ratio (M‐H, Fixed, 95% CI) | 0.31 [0.18, 0.52] |
| 13 Diarrhoea on day 7: subgrouped by nutritional status Show forest plot | 10 | | Risk Ratio (M‐H, Fixed, 95% CI) | Subtotals only |
|
| 13.1 Nutritional status: only well‐nourished | 1 | 141 | Risk Ratio (M‐H, Fixed, 95% CI) | 0.35 [0.04, 3.26] |
| 13.2 Nutritional status: well‐nourished plus moderately malnourished | 6 | 4075 | Risk Ratio (M‐H, Fixed, 95% CI) | 0.72 [0.60, 0.86] |
| 13.3 Nutritional status: malnourished | 3 | 238 | Risk Ratio (M‐H, Fixed, 95% CI) | 0.37 [0.22, 0.61] |
| 14 Diarrhoea on day 7: subgrouped by sex Show forest plot | 10 | | Risk Ratio (M‐H, Fixed, 95% CI) | Subtotals only |
|
| 14.1 Sex: male | 1 | 266 | Risk Ratio (M‐H, Fixed, 95% CI) | 0.11 [0.01, 0.88] |
| 14.2 Sex: male and female | 9 | 4188 | Risk Ratio (M‐H, Fixed, 95% CI) | 0.68 [0.58, 0.81] |
| 15 Diarrhoea on day 7: subgrouped by continent Show forest plot | 10 | | Risk Ratio (M‐H, Fixed, 95% CI) | Subtotals only |
|
| 15.1 Region: Asia | 9 | 4313 | Risk Ratio (M‐H, Fixed, 95% CI) | 0.67 [0.56, 0.79] |
| 15.2 Region: Europe | 1 | 141 | Risk Ratio (M‐H, Fixed, 95% CI) | 0.35 [0.04, 3.26] |
| 16 Diarrhoea on day 7: subgrouped by national risk of zinc deficiency Show forest plot | 10 | | Risk Ratio (M‐H, Fixed, 95% CI) | Subtotals only |
|
| 16.1 Region: countries ranked as high risk of zinc deficiency | 6 | 3240 | Risk Ratio (M‐H, Fixed, 95% CI) | 0.75 [0.62, 0.92] |
| 16.2 Region: countries ranked as medium risk of zinc deficiency | 3 | 1073 | Risk Ratio (M‐H, Fixed, 95% CI) | 0.49 [0.35, 0.68] |
| 16.3 Region: countries ranked as low risk of zinc deficiency | 1 | 141 | Risk Ratio (M‐H, Fixed, 95% CI) | 0.35 [0.04, 3.26] |
| 17 Diarrhoea on day 7: subgrouped by zinc dose Show forest plot | 9 | | Risk Ratio (M‐H, Fixed, 95% CI) | Subtotals only |
|
| 17.1 Zinc dose: 20 mg | 8 | 3154 | Risk Ratio (M‐H, Fixed, 95% CI) | 0.62 [0.51, 0.74] |
| 17.2 Zinc dose: >20mg | 1 | 805 | Risk Ratio (M‐H, Fixed, 95% CI) | 0.67 [0.38, 1.19] |
| 18 Diarrhoea on day 7: subgrouped by zinc type Show forest plot | 10 | | Risk Ratio (M‐H, Fixed, 95% CI) | Subtotals only |
|
| 18.1 Zinc type: zinc acetate | 3 | 1628 | Risk Ratio (M‐H, Fixed, 95% CI) | 0.60 [0.45, 0.79] |
| 18.2 Zinc type:gluconate | 1 | 805 | Risk Ratio (M‐H, Fixed, 95% CI) | 0.67 [0.38, 1.19] |
| 18.3 Zinc type: zinc sulphate | 6 | 2021 | Risk Ratio (M‐H, Fixed, 95% CI) | 0.72 [0.57, 0.90] |
| 19 Diarrhoea on day 7: subgrouped by study setting Show forest plot | 10 | | Risk Ratio (M‐H, Fixed, 95% CI) | Subtotals only |
|
| 19.1 Study setting: hospital | 8 | 2758 | Risk Ratio (M‐H, Fixed, 95% CI) | 0.69 [0.56, 0.84] |
| 19.2 Study setting: community | 2 | 1696 | Risk Ratio (M‐H, Fixed, 95% CI) | 0.61 [0.44, 0.85] |
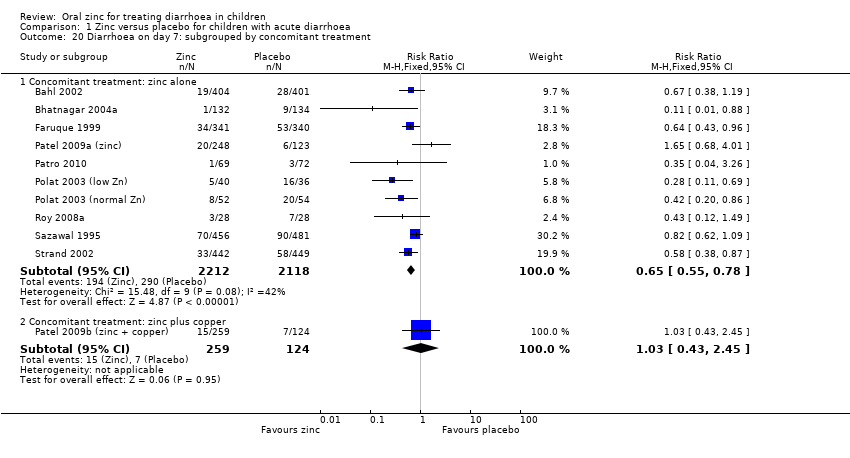
| 20 Diarrhoea on day 7: subgrouped by concomitant treatment Show forest plot | 11 | | Risk Ratio (M‐H, Fixed, 95% CI) | Subtotals only |
|
| 20.1 Concomitant treatment: zinc alone | 10 | 4330 | Risk Ratio (M‐H, Fixed, 95% CI) | 0.65 [0.55, 0.78] |
| 20.2 Concomitant treatment: zinc plus copper | 1 | 383 | Risk Ratio (M‐H, Fixed, 95% CI) | 1.03 [0.43, 2.45] |
| 21 Stool frequency (stools /day) Show forest plot | 10 | 2643 | Mean Difference (IV, Fixed, 95% CI) | ‐0.10 [‐0.25, 0.04] |
|
| 21.1 Age < 6 months | 5 | 1334 | Mean Difference (IV, Fixed, 95% CI) | 0.0 [‐0.17, 0.17] |
| 21.2 Age > 6 months | 4 | 1235 | Mean Difference (IV, Fixed, 95% CI) | ‐0.32 [‐0.58, ‐0.06] |
| 21.3 Ages both < and > 6 months | 1 | 74 | Mean Difference (IV, Fixed, 95% CI) | ‐5.9 [‐9.44, ‐2.36] |
| 22 Death Show forest plot | 8 | 2609 | Risk Ratio (M‐H, Fixed, 95% CI) | 0.31 [0.09, 1.07] |
|
| 22.1 Age < 6 months | 2 | 1334 | Risk Ratio (M‐H, Fixed, 95% CI) | 1.00 [0.06, 15.89] |
| 22.2 Age > 6 months | 5 | 1134 | Risk Ratio (M‐H, Fixed, 95% CI) | 0.29 [0.04, 2.20] |
| 22.3 Ages both < and > 6 months | 1 | 141 | Risk Ratio (M‐H, Fixed, 95% CI) | 0.19 [0.02, 1.55] |
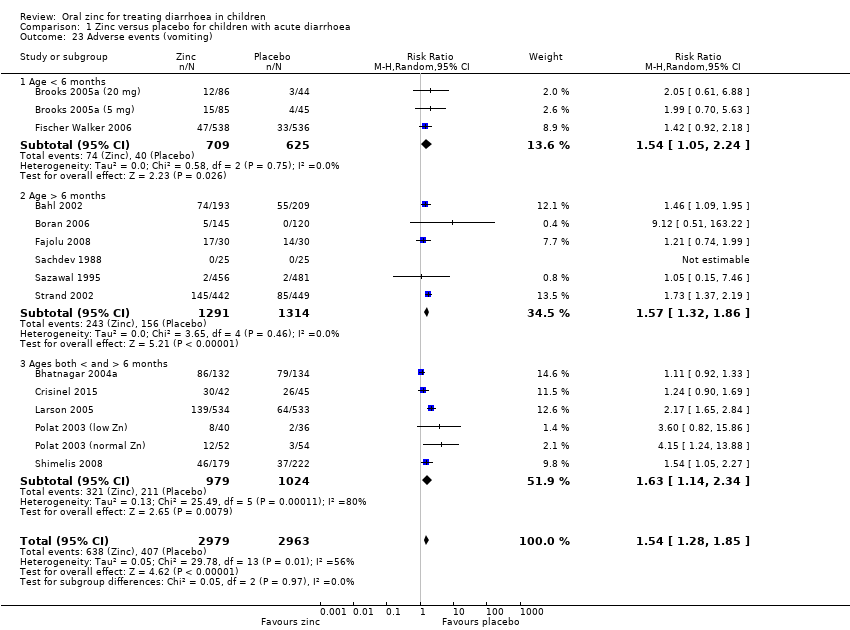
| 23 Adverse events (vomiting) Show forest plot | 15 | 5942 | Risk Ratio (M‐H, Random, 95% CI) | 1.54 [1.28, 1.85] |
|
| 23.1 Age < 6 months | 3 | 1334 | Risk Ratio (M‐H, Random, 95% CI) | 1.54 [1.05, 2.24] |
| 23.2 Age > 6 months | 6 | 2605 | Risk Ratio (M‐H, Random, 95% CI) | 1.57 [1.32, 1.86] |
| 23.3 Ages both < and > 6 months | 6 | 2003 | Risk Ratio (M‐H, Random, 95% CI) | 1.63 [1.14, 2.34] |
| 24 Difficulties in treatment administration Show forest plot | 1 | 87 | Odds Ratio (M‐H, Fixed, 95% CI) | 1.03 [0.44, 2.41] |
|