限制液体量治疗早产儿慢性肺病
Referencias
References to studies included in this review
Ir a:
Additional references
Ir a:
Characteristics of studies
Characteristics of included studies [ordered by study ID]
| Methods | Randomised controlled trial | |
| Participants | 60 preterm infants < 1500 grams and < 32 weeks, dependent on oxygen at more than 28 days of age | |
| Interventions | Standard formula (24 kcal/oz) at 180 mL/kg/day compared to high nutrient‐density formula (30 kcal/oz) at 145 mL/kg/day | |
| Outcomes | Growth variables, respiratory outcomes. | |
| Notes | ||
| Risk of bias | ||
| Bias | Authors' judgement | Support for judgement |
| Random sequence generation (selection bias) | Low risk | Pre‐determined randomisation sequence in block of 4 and 6. |
| Allocation concealment (selection bias) | Low risk | Randomisation sequences maintained in opaque envelopes. |
| Blinding of participants and personnel (performance bias) | High risk | Not feasible to mask the intervention. |
| Blinding of outcome assessment (detection bias) | High risk | Outcome measures done by a research nurse not blind to the dietary randomisation. |
| Incomplete outcome data (attrition bias) | Low risk | All subjects accounted for in the results. |
| Selective reporting (reporting bias) | Unclear risk | No published or registered protocol was found. |
| Other bias | Unclear risk | The lack on concealment may have had an impact on the intervention itself: the medical staff were apparently reluctant to increase daily fluids, so the high‐volume group did not receive as much fluid as planned. |
| Funding Source | Unclear risk | Study was funded by industry (Ross Laboratories) who also created the formulae. No indication is given about other roles of the funding source. |
Data and analyses
| Outcome or subgroup title | No. of studies | No. of participants | Statistical method | Effect size |
| 1 Duration of hospitalisation Show forest plot | 1 | 60 | Mean Difference (IV, Fixed, 95% CI) | 3.0 [‐7.64, 13.64] |
| Analysis 1.1  Comparison 1 Fluid restricted compared to liberal fluids, Outcome 1 Duration of hospitalisation. | ||||
| 2 Daily weight gain Show forest plot | 1 | 60 | Mean Difference (IV, Fixed, 95% CI) | 0.5 [‐1.22, 2.22] |
| Analysis 1.2 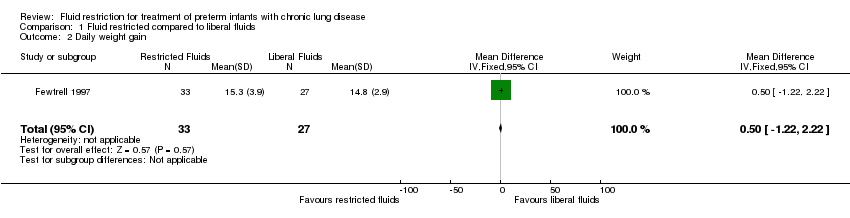 Comparison 1 Fluid restricted compared to liberal fluids, Outcome 2 Daily weight gain. | ||||
| 3 Proportion with apnoea Show forest plot | 1 | 60 | Risk Difference (M‐H, Fixed, 95% CI) | 0.22 [‐0.00, 0.44] |
| Analysis 1.3  Comparison 1 Fluid restricted compared to liberal fluids, Outcome 3 Proportion with apnoea. | ||||

Study flow diagram.

Comparison 1 Fluid restricted compared to liberal fluids, Outcome 1 Duration of hospitalisation.

Comparison 1 Fluid restricted compared to liberal fluids, Outcome 2 Daily weight gain.
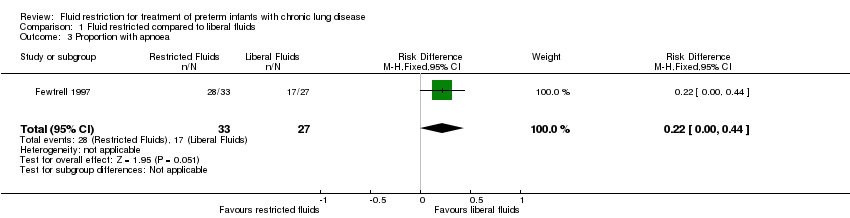
Comparison 1 Fluid restricted compared to liberal fluids, Outcome 3 Proportion with apnoea.
| Fluid restricted compared to liberal fluids compared to placebo for treatment of preterm babies with chronic lung disease | ||||||
| Participant or population: treatment of preterm babies with chronic lung disease | ||||||
| Outcomes | Anticipated absolute effects* (95% CI) | Relative effect | № of participants | Quality of the evidence | Comments | |
| Risk with placebo | Risk with fluid restricted compared to liberal fluids | |||||
| Duration of oxygen therapy | The mean duration of oxygen therapy was 27.5 days | median 0.5 days higher | ‐ | 60 | ⊕⊕⊝⊝ | |
| Duration of hospitalisation | The mean duration of hospitalisation was 85 days | MD 3 Days higher | ‐ | 60 | ⊕⊕⊝⊝ | |
| Daily weight gain | The mean daily weight gain was 14.8 g/kg/d | MD 0.5 g/kg/d higher | ‐ | 60 | ⊕⊕⊝⊝ | |
| Proportion with apnoea | Study population | RR 1.35 | 60 | ⊕⊕⊝⊝ | ||
| 630 per 1000 | 850 per 1000 | |||||
| Moderate | ||||||
| 630 per 1000 | 850 per 1000 | |||||
| *The risk in the intervention group (and its 95% CI) is based on the assumed risk in the comparison group and the relative effect of the intervention (and its 95% CI). | ||||||
| GRADE Working Group grades of evidence | ||||||
| 1 Unmasked study 2 Wide confidence limits | ||||||
| Outcome or subgroup title | No. of studies | No. of participants | Statistical method | Effect size |
| 1 Duration of hospitalisation Show forest plot | 1 | 60 | Mean Difference (IV, Fixed, 95% CI) | 3.0 [‐7.64, 13.64] |
| 2 Daily weight gain Show forest plot | 1 | 60 | Mean Difference (IV, Fixed, 95% CI) | 0.5 [‐1.22, 2.22] |
| 3 Proportion with apnoea Show forest plot | 1 | 60 | Risk Difference (M‐H, Fixed, 95% CI) | 0.22 [‐0.00, 0.44] |