급성 허혈성 뇌졸중에서 혈당 조절을 위한 인슐린
Referencias
References to studies included in this review
References to studies excluded from this review
References to ongoing studies
Additional references
References to other published versions of this review
Characteristics of studies
Characteristics of included studies [ordered by study ID]
| Methods | Randomised, parallel design | |
| Participants | 34 consecutive acute ischaemic strokes; 14 randomised to intensive insulin therapy and 20 control carbohydrate | |
| Interventions | Continous intravenous insulin infusion Control: carbohydrate restrictive strategy, intravenous infusion glucose‐free and enteral nutrition 33.3% carbohydrates, regular insulin SQ Goal < 150 mg/dL | |
| Outcomes | Follow‐up until discharge | |
| Notes | Abstract format only Author contacted and provided extra information | |
| Risk of bias | ||
| Bias | Authors' judgement | Support for judgement |
| Random sequence generation (selection bias) | Low risk | Computer‐generated random‐number table and sealed envelopes |
| Allocation concealment (selection bias) | Unclear risk | Not reported |
| Blinding of participants and personnel (performance bias) | High risk | Not blinded |
| Blinding of outcome assessment (detection bias) | High risk | Not blinded |
| Incomplete outcome data (attrition bias) | Unclear risk | Not reported |
| Methods | Randomised, parallel design | |
| Participants | 933 participants: 464 in the intervention group and 469 in the control group | |
| Interventions | Glucose‐insulin‐potassium (10% dextrose, 20 mmol KCl, 16 units insulin); continuous intravenous infusion for 24 hours to maintain capillary glycaemia 4 to 7 mmol/L, plasma glucose 4.6 to 8 mmol/L, measured every 8 hours | |
| Outcomes | At 90 days | |
| Notes | 71/464 (15.3%) non‐ischaemic strokes in the intervention group, 78/469 (16.6%) non‐ischaemic strokes in the control group; stopped early | |
| Risk of bias | ||
| Bias | Authors' judgement | Support for judgement |
| Random sequence generation (selection bias) | Low risk | Adequate |
| Allocation concealment (selection bias) | Low risk | Adequate |
| Blinding of participants and personnel (performance bias) | High risk | Not blinded |
| Blinding of outcome assessment (detection bias) | Low risk | Blinded |
| Incomplete outcome data (attrition bias) | High risk | 7.4% lost to follow‐up and early termination |
| Methods | Randomised, parallel design, stratified by glucose concentration | |
| Participants | 74 participants (3 arms): 24 participants in the intervention group (tight control), 50 participants in the control group | |
| Interventions | Intravenous insulin infusion in normal saline (plus glucose 5% and 20 mEq/L potassium infusion) and subcutaneous insulin with each meal; continuous intravenous insulin infusion individually adjusted; target 70 to 110 mg/dL, or 3.9 to 6.1 mmol/L in the tight control group, with capillary glucose check every 1 to 4 hours for 5 days or discharge | |
| Outcomes | At 90 days | |
| Notes | ||
| Risk of bias | ||
| Bias | Authors' judgement | Support for judgement |
| Random sequence generation (selection bias) | Low risk | Adequate |
| Allocation concealment (selection bias) | Low risk | Adequate |
| Blinding of participants and personnel (performance bias) | High risk | Not blinded |
| Blinding of outcome assessment (detection bias) | Low risk | Blinded |
| Incomplete outcome data (attrition bias) | Low risk | 1.4% lost to follow‐up |
| Methods | Randomised, parallel design, not blinded | |
| Participants | 180 enrolled: 90 each arm, ITT and 85 each arm per protocol analysis | |
| Interventions | Intravneous continuous infusion of Actrapid insulin with 1 hourly glucose check and dose adjustment; aim to get glucose < 7; continued for 24 hours Control subcutaneous insulin, glucose check every 4 hours x 24 hours; stop point of 8 mmol/L at which no insulin given | |
| Outcomes | At 90 days | |
| Notes | ||
| Risk of bias | ||
| Bias | Authors' judgement | Support for judgement |
| Random sequence generation (selection bias) | Low risk | Adequate |
| Allocation concealment (selection bias) | Low risk | Adequate |
| Blinding of participants and personnel (performance bias) | High risk | Not blinded |
| Blinding of outcome assessment (detection bias) | High risk | Not blinded |
| Incomplete outcome data (attrition bias) | Low risk | Adequate |
| Methods | Randomised, parallel design | |
| Participants | 40 participants: 20 in each arm | |
| Interventions | Continuous intravenous insulin infusion individually adjusted; target 80 to 110 mg/dL, or 4.44 to 6.1 mmol/L with capillary glucose check every 1 to 4 hours for 5 days | |
| Outcomes | 120 days | |
| Notes | Main objective of the study was feasibility of insulin for control of glycaemia and hypoglycaemic events | |
| Risk of bias | ||
| Bias | Authors' judgement | Support for judgement |
| Random sequence generation (selection bias) | Low risk | Adequate |
| Allocation concealment (selection bias) | Unclear risk | Not enough information |
| Blinding of participants and personnel (performance bias) | High risk | Not blinded |
| Blinding of outcome assessment (detection bias) | High risk | Not blinded |
| Incomplete outcome data (attrition bias) | Low risk | 10% lost to follow‐up (4 of 40 lost to clinical follow‐up, 1 of 40 (2.5%) lost to survival follow‐up) |
| Methods | Randomised, parallel design, placebo controlled | |
| Participants | 40 participants: 25 intervention, 15 control | |
| Interventions | Glucose‐insulin‐potassium Continuous intravenous infusion 100ml/hour x 24 hours (10 participants), 48 hours (5 participants) or 72 hours (10 participants); dose adjusted to keep capillary blood glucose between 4 to 7 mmol/L; glucose checked 1 hourly until euglycaemia achieved and subsequently 2 hourly | |
| Outcomes | Hypoglycaemia, Rankin Scale, death | |
| Notes | 3 different durations of treatment | |
| Risk of bias | ||
| Bias | Authors' judgement | Support for judgement |
| Random sequence generation (selection bias) | Low risk | Adequate |
| Allocation concealment (selection bias) | Unclear risk | Not enough information |
| Blinding of participants and personnel (performance bias) | High risk | Not blinded |
| Blinding of outcome assessment (detection bias) | High risk | Not blinded |
| Incomplete outcome data (attrition bias) | Unclear risk | Not reported |
| Methods | Randomised, parallel design | |
| Participants | 50 participants: 26 intervention and 24 controls | |
| Interventions | Continuous intravenous insulin infusion adjusted to maintain euglycaemia (4.5 to 7 mmol/L); capillary glucose every 1 hour initially (every 4 hours once the participant was stable) for 24 hours | |
| Outcomes | At 30 days | |
| Notes | Same study used in 2007 with unpublished results. Now has been published | |
| Risk of bias | ||
| Bias | Authors' judgement | Support for judgement |
| Random sequence generation (selection bias) | Low risk | Adequate |
| Allocation concealment (selection bias) | High risk | Inadequate (random list was read by investigator) |
| Blinding of participants and personnel (performance bias) | High risk | Not blinded |
| Blinding of outcome assessment (detection bias) | Low risk | Blinded |
| Incomplete outcome data (attrition bias) | Low risk | None lost to follow‐up |
| Methods | Randomised, parallel design | |
| Participants | 46 participants: 31 in the intervention group, 15 in the control group | |
| Interventions | Continuous intravenous insulin infusion individually adjusted; target 5 to 7.2 mmol/L; capillary glucose every 1 hour for 72 hours | |
| Outcomes | At 90 days | |
| Notes | Almost all had diabetes mellitus (100% of intervention and 73% of control participants) | |
| Risk of bias | ||
| Bias | Authors' judgement | Support for judgement |
| Random sequence generation (selection bias) | Low risk | Adequate |
| Allocation concealment (selection bias) | Low risk | Adequate |
| Blinding of participants and personnel (performance bias) | High risk | Participants were blinded, clinicians and data collectors were not blinded |
| Blinding of outcome assessment (detection bias) | Low risk | Blinded |
| Incomplete outcome data (attrition bias) | Low risk | None lost to follow‐up |
| Methods | Randomised, parallel design | |
| Participants | 128 participants: 61 intervention, 67 control | |
| Interventions | Continuous intravenous infusion 100 ml/hour per 4 hours with insulin doses adjusted by glucose level, until desired glucose level reached (< 7 mmol/L); measured every 4 hours | |
| Outcomes | At 30 days | |
| Notes | Diabetes mellitus and non‐diabetes mellitus cohorts reported separately | |
| Risk of bias | ||
| Bias | Authors' judgement | Support for judgement |
| Random sequence generation (selection bias) | Low risk | Adequate |
| Allocation concealment (selection bias) | Low risk | Adequate |
| Blinding of participants and personnel (performance bias) | High risk | Not blinded |
| Blinding of outcome assessment (detection bias) | High risk | Not blinded |
| Incomplete outcome data (attrition bias) | High risk | Reported none lost to follow‐up; however, estimated to be at least 2.3% based on the percentages of the figures at follow‐up |
| Methods | Randomised, parallel design | |
| Participants | 33 participants: 13 basal insulin, 10 meal‐related insulin, 10 controls | |
| Interventions | Stopped oral glucose lowering drugs Meal group: SQ long acting as basal and SQ rapid acting as meal related insulin, measured before and 2 hours after meals, and twice at night to detect hypoglycaemia Target: 4.4 to 6.1 mmol/l | |
| Outcomes | At 5 days | |
| Notes | ||
| Risk of bias | ||
| Bias | Authors' judgement | Support for judgement |
| Random sequence generation (selection bias) | High risk | Consecutive envelopes |
| Allocation concealment (selection bias) | High risk | Consecutive envelopes stratified for dysphagia and diabetes mellitus |
| Blinding of participants and personnel (performance bias) | High risk | Not blinded |
| Blinding of outcome assessment (detection bias) | High risk | Not blinded |
| Incomplete outcome data (attrition bias) | High risk | 15% without outcome documented at 5 days |
| Methods | Randomised, parallel design | |
| Participants | 25 participants: 13 in the intervention group, 12 in the control group | |
| Interventions | Continuous intravenous insulin infusion for 48 hours; target 5 to 7.9 mmol/L; monitored every 2 hours | |
| Outcomes | 30 days | |
| Notes | Pilot study looking at feasibility | |
| Risk of bias | ||
| Bias | Authors' judgement | Support for judgement |
| Random sequence generation (selection bias) | Low risk | Adequate |
| Allocation concealment (selection bias) | Low risk | Adequate |
| Blinding of participants and personnel (performance bias) | High risk | Not blinded |
| Blinding of outcome assessment (detection bias) | High risk | Not blinded |
| Incomplete outcome data (attrition bias) | Low risk | None lost to follow‐up |
ESS: European Stroke Scale
ITT: intention‐to‐treat
MRI: magnetic resonance imaging
NIHSS: National Institutes of Health Stroke Scale
Characteristics of excluded studies [ordered by study ID]
| Study | Reason for exclusion |
| Not stroke participants; stroke is an outcome | |
| Intervention is diet; both groups received the same regimen of insulin | |
| Overlapping cohort with GIST‐UK 2007 | |
| Not randomised clinical trial design, these are cohorts with intervention | |
| Only 3.7% of the cohort is ischaemic stroke | |
| Not stroke participants; stroke is an outcome | |
| Not stroke participants; stroke is an outcome |
Characteristics of ongoing studies [ordered by study ID]
| Trial name or title | Effect of insulin on infarct size and neurologic outcome after acute stroke |
| Methods | RCT |
| Participants | Adults with acute stroke |
| Interventions | Insulin |
| Outcomes | Primary outcome is change in infarct volume measured on diffusion‐perfusion MRI |
| Starting date | January 2004 to January 2010 |
| Contact information | Nina T Gentile, MD |
| Notes | clinicaltrials.gov NCT00373269 |
| Trial name or title | Stroke Hyperglycemia Insulin Network Effort (SHINE) |
| Methods | RCT |
| Participants | Acute ischaemic stroke < 12 hours from onset |
| Interventions | Intravenous insulin to maintain target glucose concentration of 80 to 130 mg/dL |
| Outcomes | Modified Rankin Scale score at 3 months Hypoglycaemia |
| Starting date | April 2012 |
| Contact information | Karen C Johnston, MD |
| Notes | ClinicalTrials.gov NCT01369069 |
MRI: magnetic resonance imaging
RCT: randomised controlled trial
Data and analyses
| Outcome or subgroup title | No. of studies | No. of participants | Statistical method | Effect size |
| 1 Dependency or death at the end of the follow‐up Show forest plot | 9 | 1516 | Odds Ratio (M‐H, Fixed, 95% CI) | 0.99 [0.79, 1.23] |
| Analysis 1.1  Comparison 1 Dependency or death, Outcome 1 Dependency or death at the end of the follow‐up. | ||||
| 2 Death Show forest plot | 9 | 1422 | Odds Ratio (M‐H, Fixed, 95% CI) | 1.09 [0.85, 1.41] |
| Analysis 1.2  Comparison 1 Dependency or death, Outcome 2 Death. | ||||
| 3 Diabetes mellitus versus no diabetes mellitus Show forest plot | 8 | 1482 | Odds Ratio (M‐H, Fixed, 95% CI) | 0.97 [0.77, 1.21] |
| Analysis 1.3  Comparison 1 Dependency or death, Outcome 3 Diabetes mellitus versus no diabetes mellitus. | ||||
| 3.1 Diabetes mellitus | 3 | 194 | Odds Ratio (M‐H, Fixed, 95% CI) | 0.66 [0.35, 1.24] |
| 3.2 No diabetes mellitus | 6 | 1288 | Odds Ratio (M‐H, Fixed, 95% CI) | 1.02 [0.81, 1.30] |
| 4 Less than 30 days versus 90 days of follow‐up Show forest plot | 9 | 1516 | Odds Ratio (M‐H, Fixed, 95% CI) | 0.99 [0.79, 1.23] |
| Analysis 1.4 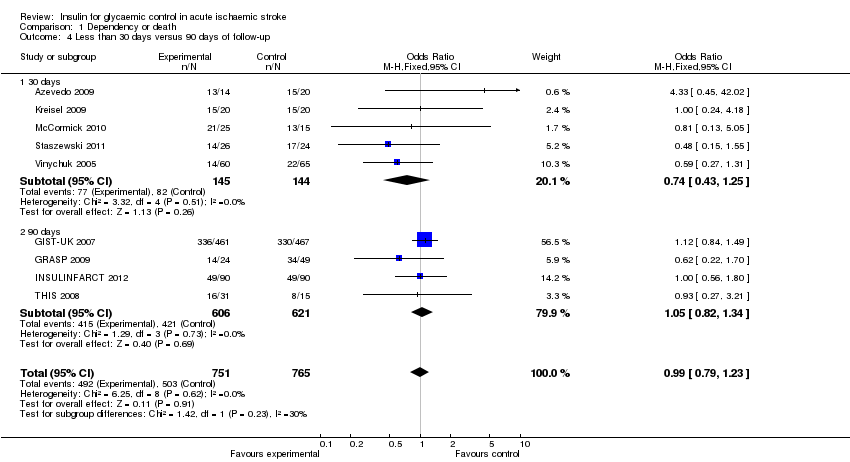 Comparison 1 Dependency or death, Outcome 4 Less than 30 days versus 90 days of follow‐up. | ||||
| 4.1 30 days | 5 | 289 | Odds Ratio (M‐H, Fixed, 95% CI) | 0.74 [0.43, 1.25] |
| 4.2 90 days | 4 | 1227 | Odds Ratio (M‐H, Fixed, 95% CI) | 1.05 [0.82, 1.34] |
| Outcome or subgroup title | No. of studies | No. of participants | Statistical method | Effect size |
| 1 NIHSS or ESS at the end of the follow‐up Show forest plot | 8 | 1432 | Std. Mean Difference (IV, Fixed, 95% CI) | ‐0.09 [‐0.19, 0.01] |
| Analysis 2.1  Comparison 2 Functional neurological outcome, Outcome 1 NIHSS or ESS at the end of the follow‐up. | ||||
| 2 Independent in daily activities Show forest plot | 9 | 1224 | Odds Ratio (M‐H, Fixed, 95% CI) | 1.03 [0.81, 1.32] |
| Analysis 2.2  Comparison 2 Functional neurological outcome, Outcome 2 Independent in daily activities. | ||||
| 3 Diabetes mellitus versus no diabetes mellitus Show forest plot | 8 | 1432 | Std. Mean Difference (IV, Fixed, 95% CI) | ‐0.07 [‐0.18, 0.03] |
| Analysis 2.3  Comparison 2 Functional neurological outcome, Outcome 3 Diabetes mellitus versus no diabetes mellitus. | ||||
| 3.1 Diabetes mellitus | 3 | 146 | Std. Mean Difference (IV, Fixed, 95% CI) | ‐0.06 [‐0.43, 0.31] |
| 3.2 No diabetes mellitus | 6 | 1286 | Std. Mean Difference (IV, Fixed, 95% CI) | ‐0.08 [‐0.19, 0.03] |
| 4 Less than 30 days versus 90 days of follow‐up Show forest plot | 8 | 1432 | Std. Mean Difference (IV, Fixed, 95% CI) | ‐0.09 [‐0.19, 0.01] |
| Analysis 2.4 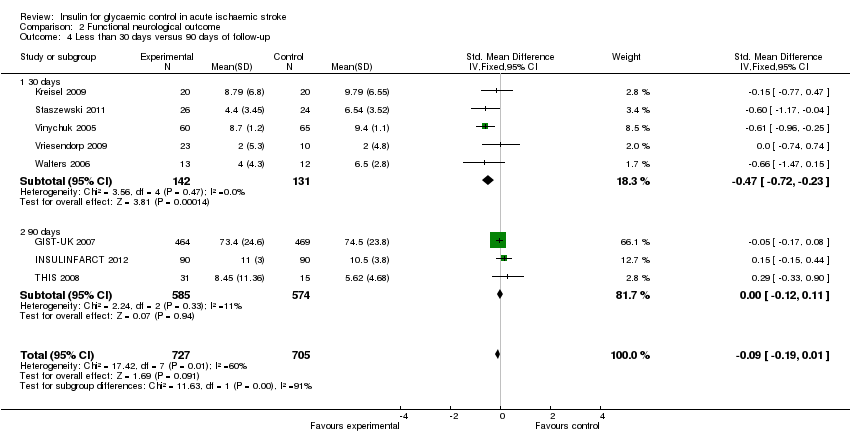 Comparison 2 Functional neurological outcome, Outcome 4 Less than 30 days versus 90 days of follow‐up. | ||||
| 4.1 30 days | 5 | 273 | Std. Mean Difference (IV, Fixed, 95% CI) | ‐0.47 [‐0.72, ‐0.23] |
| 4.2 90 days | 3 | 1159 | Std. Mean Difference (IV, Fixed, 95% CI) | ‐0.00 [‐0.12, 0.11] |
| Outcome or subgroup title | No. of studies | No. of participants | Statistical method | Effect size |
| 1 Symptomatic hypoglycaemia Show forest plot | 10 | 1455 | Odds Ratio (M‐H, Fixed, 95% CI) | 14.60 [6.62, 32.21] |
| Analysis 3.1  Comparison 3 Hypoglycaemia, Outcome 1 Symptomatic hypoglycaemia. | ||||
| 2 Hypoglycaemia (with or without symptoms) Show forest plot | 10 | 1455 | Odds Ratio (M‐H, Fixed, 95% CI) | 18.41 [9.09, 37.27] |
| Analysis 3.2  Comparison 3 Hypoglycaemia, Outcome 2 Hypoglycaemia (with or without symptoms). | ||||
| Outcome or subgroup title | No. of studies | No. of participants | Statistical method | Effect size |
| 1 Mean glucose level Show forest plot | 8 | 1398 | Mean Difference (IV, Fixed, 95% CI) | ‐0.63 [‐0.80, ‐0.46] |
| Analysis 4.1 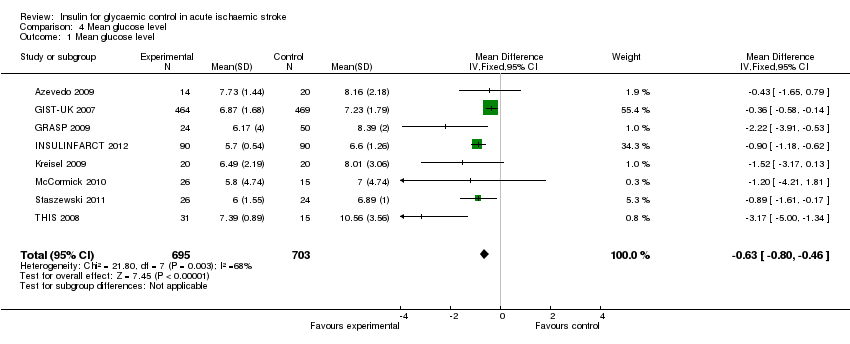 Comparison 4 Mean glucose level, Outcome 1 Mean glucose level. | ||||
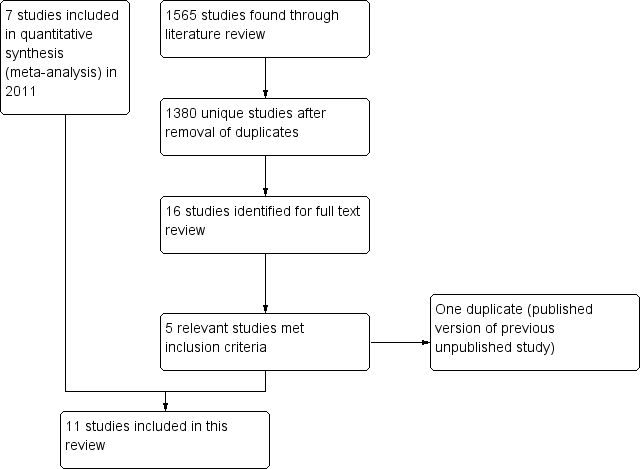
Study flow diagram.

Risk of bias summary: review authors' judgements about each risk of bias item for each included study.

Comparison 1 Dependency or death, Outcome 1 Dependency or death at the end of the follow‐up.

Comparison 1 Dependency or death, Outcome 2 Death.

Comparison 1 Dependency or death, Outcome 3 Diabetes mellitus versus no diabetes mellitus.

Comparison 1 Dependency or death, Outcome 4 Less than 30 days versus 90 days of follow‐up.

Comparison 2 Functional neurological outcome, Outcome 1 NIHSS or ESS at the end of the follow‐up.
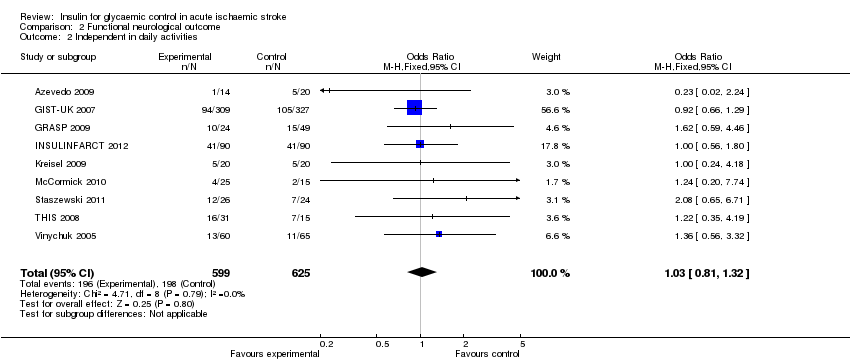
Comparison 2 Functional neurological outcome, Outcome 2 Independent in daily activities.
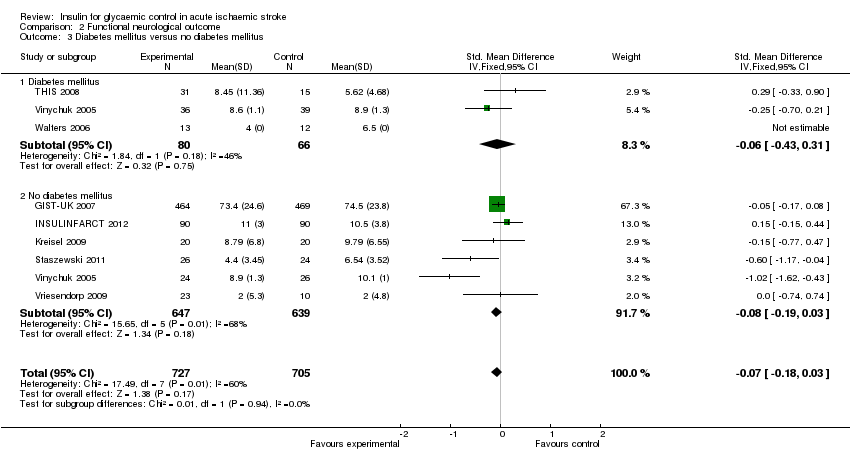
Comparison 2 Functional neurological outcome, Outcome 3 Diabetes mellitus versus no diabetes mellitus.

Comparison 2 Functional neurological outcome, Outcome 4 Less than 30 days versus 90 days of follow‐up.
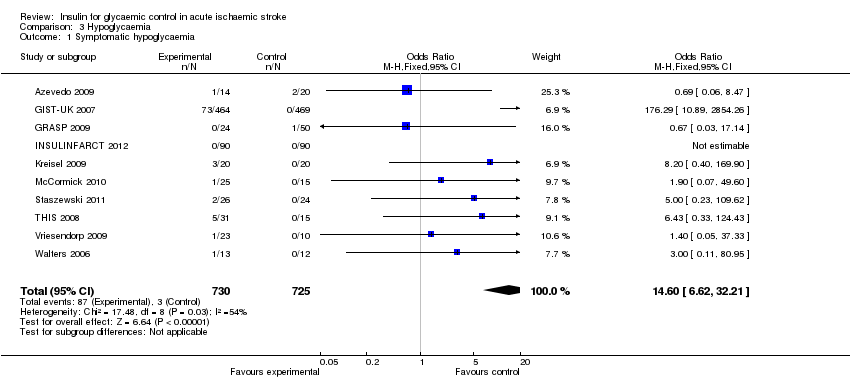
Comparison 3 Hypoglycaemia, Outcome 1 Symptomatic hypoglycaemia.
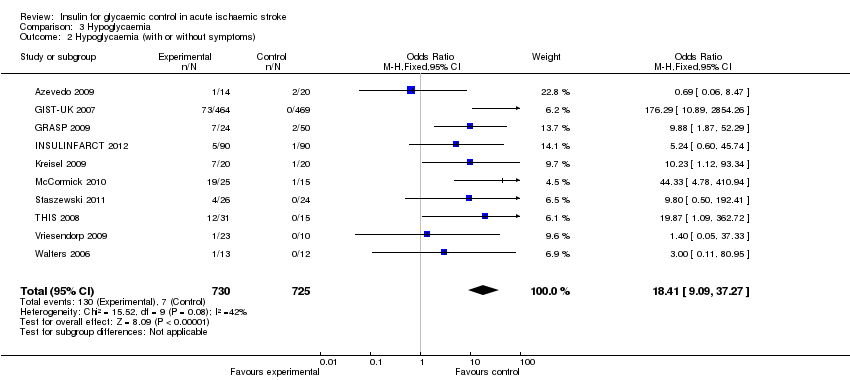
Comparison 3 Hypoglycaemia, Outcome 2 Hypoglycaemia (with or without symptoms).

Comparison 4 Mean glucose level, Outcome 1 Mean glucose level.
| Study | Generation of randomisation | Allocation concealment | Blinding: participants and physicians | Blinding: outcome to allocation group | Lost to follow‐up (%) |
| Low risk | Low risk | High risk | High risk | 0 | |
| Low risk | Low risk | High risk | Low risk | 7.4 | |
| Low risk | High risk | High risk | Low risk | 0 | |
| Low risk | Low risk | High risk | Low risk | 0 | |
| Low risk | Low risk | High risk | High risk | 0 | |
| Low risk | Low risk | High risk | Low risk | 1.4 | |
| Low risk | Unclear risk | High risk | High risk | 10 | |
| Low risk | Unclear risk | Unclear risk | High risk | Not reported | |
| Low risk | Low risk | High risk | High risk | 2.2 | |
| High risk | High risk | High risk | High risk | 15.2 | |
| Low risk | Unclear risk | High risk | High risk | Not reported |
| Outcome or subgroup title | No. of studies | No. of participants | Statistical method | Effect size |
| 1 Dependency or death at the end of the follow‐up Show forest plot | 9 | 1516 | Odds Ratio (M‐H, Fixed, 95% CI) | 0.99 [0.79, 1.23] |
| 2 Death Show forest plot | 9 | 1422 | Odds Ratio (M‐H, Fixed, 95% CI) | 1.09 [0.85, 1.41] |
| 3 Diabetes mellitus versus no diabetes mellitus Show forest plot | 8 | 1482 | Odds Ratio (M‐H, Fixed, 95% CI) | 0.97 [0.77, 1.21] |
| 3.1 Diabetes mellitus | 3 | 194 | Odds Ratio (M‐H, Fixed, 95% CI) | 0.66 [0.35, 1.24] |
| 3.2 No diabetes mellitus | 6 | 1288 | Odds Ratio (M‐H, Fixed, 95% CI) | 1.02 [0.81, 1.30] |
| 4 Less than 30 days versus 90 days of follow‐up Show forest plot | 9 | 1516 | Odds Ratio (M‐H, Fixed, 95% CI) | 0.99 [0.79, 1.23] |
| 4.1 30 days | 5 | 289 | Odds Ratio (M‐H, Fixed, 95% CI) | 0.74 [0.43, 1.25] |
| 4.2 90 days | 4 | 1227 | Odds Ratio (M‐H, Fixed, 95% CI) | 1.05 [0.82, 1.34] |
| Outcome or subgroup title | No. of studies | No. of participants | Statistical method | Effect size |
| 1 NIHSS or ESS at the end of the follow‐up Show forest plot | 8 | 1432 | Std. Mean Difference (IV, Fixed, 95% CI) | ‐0.09 [‐0.19, 0.01] |
| 2 Independent in daily activities Show forest plot | 9 | 1224 | Odds Ratio (M‐H, Fixed, 95% CI) | 1.03 [0.81, 1.32] |
| 3 Diabetes mellitus versus no diabetes mellitus Show forest plot | 8 | 1432 | Std. Mean Difference (IV, Fixed, 95% CI) | ‐0.07 [‐0.18, 0.03] |
| 3.1 Diabetes mellitus | 3 | 146 | Std. Mean Difference (IV, Fixed, 95% CI) | ‐0.06 [‐0.43, 0.31] |
| 3.2 No diabetes mellitus | 6 | 1286 | Std. Mean Difference (IV, Fixed, 95% CI) | ‐0.08 [‐0.19, 0.03] |
| 4 Less than 30 days versus 90 days of follow‐up Show forest plot | 8 | 1432 | Std. Mean Difference (IV, Fixed, 95% CI) | ‐0.09 [‐0.19, 0.01] |
| 4.1 30 days | 5 | 273 | Std. Mean Difference (IV, Fixed, 95% CI) | ‐0.47 [‐0.72, ‐0.23] |
| 4.2 90 days | 3 | 1159 | Std. Mean Difference (IV, Fixed, 95% CI) | ‐0.00 [‐0.12, 0.11] |
| Outcome or subgroup title | No. of studies | No. of participants | Statistical method | Effect size |
| 1 Symptomatic hypoglycaemia Show forest plot | 10 | 1455 | Odds Ratio (M‐H, Fixed, 95% CI) | 14.60 [6.62, 32.21] |
| 2 Hypoglycaemia (with or without symptoms) Show forest plot | 10 | 1455 | Odds Ratio (M‐H, Fixed, 95% CI) | 18.41 [9.09, 37.27] |
| Outcome or subgroup title | No. of studies | No. of participants | Statistical method | Effect size |
| 1 Mean glucose level Show forest plot | 8 | 1398 | Mean Difference (IV, Fixed, 95% CI) | ‐0.63 [‐0.80, ‐0.46] |