| Study and group | Measure | Baseline | Follow‐up [% with data] | Significance* |
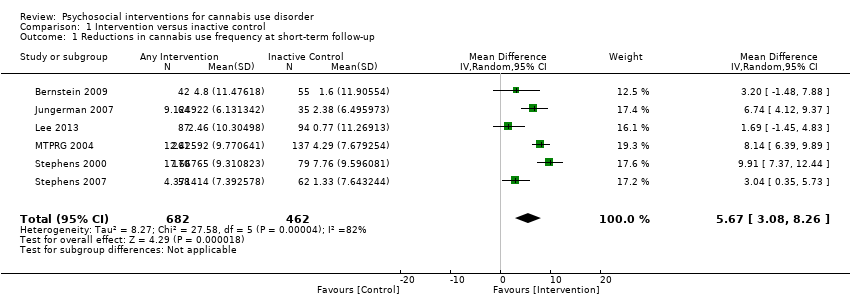
| Bernstein 2009, (1) Brief MET + CBT, (2) Assessed control | Days used in prior 30 days (mean ± SD) | (1) 19.0 ± 10.9, N = 68, (2) 15.3 ± 10.1, N = 71 | (1) 11.0 ± 10.7, N = 42 [69.1%], (2) 13.2 ± 11.7, N = 55 [77.5%] | (1) vs (2) P value = 0.024 |
| Bonsack 2011, (1) MET, (2) TAU | Days abstinent in prior ‘month’ (median ± range) | (1) 5.0 ± 24, N = 30, (2) 3.0 ± 27, N = 32 | (1) 5.5 ± 28, N = 25 [83.3%], (2) 8.5 ± 28, N = 29 [90.6%] | (1) vs (2) P value > 0.05 |
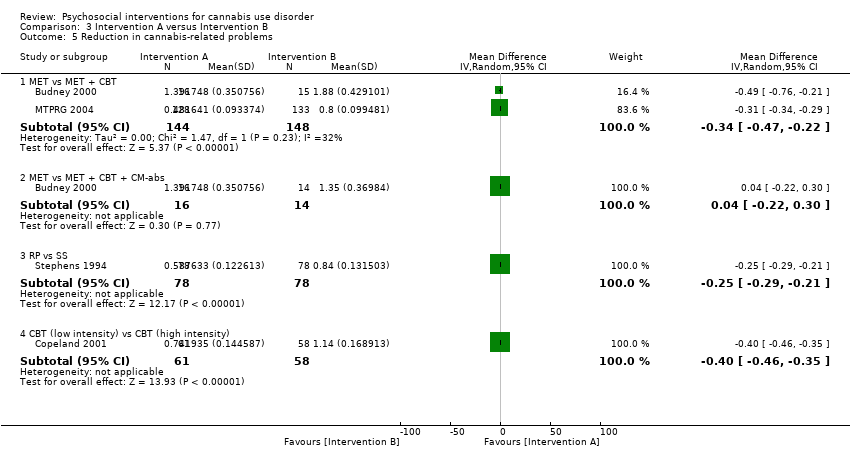
| Budney 2000, (1) MET + CBT + CM‐abs, (2) MET + CBT, (3) MI | Days used in prior 30 days (least squares mean ± SE) | (1) 24.1 ± 1.8, N = 20, (2) 20.4 ± 1.8, N = 20, (3) 23.2 ± 1.8, N = 20 | (1) 6.6 ± 2.6, N = 14 [70.0%], (2) 7.4 ± 2.3, N = 15 [75.0%], (3) 13.0 ± 2.1, N = 16 [80.0%] | (1) vs (2) P value > 0.05; (1) vs (3) P value > 0.05; (2) vs (3) P value > 0.05 |
| Budney 2006, (1) CBT + CM‐abs, (2) CBT + CM‐adh, (3) CM‐abs | Days used in prior 30 days (mean ± SD) | (1) 25.3 ± 8.0, N = 30, (2) 25.5 ± 7.4, N = 30, (3) 26.0 ± 6.2, N = 30 | (1) 12.5 ± 13.9, N = 21 [70.0%], (2) 18.3 ± 15.7, N = 24 [80.0%], (3) 18.1 ± 13.6, N = 22 [73.3%] | (1) vs (2) P value > 0.05; (1) vs (3) P value > 0.05; (2) vs (3) P value > 0.05 |
| Carroll 2006, (1) MET + CBT + CM‐abs + CM‐adh, (2) DC + CM‐abs + CM‐adh. (3) MET + CBT, (4) DC | Proportion of days used post treatment (mean ± SE) | (1) n/a, N = 33, (2) n/a, N = 34, (3) n/a, N = 36, (4) n/a, N = 33 | (1) 0.64 ± 0.06, N = 27 [81.8%], (2) 0.75 ± 0.1, N = 24 [70.6%], (3) 0.73 ± 0.05, N = 27 [75.0%], (4) 0.71 ± 0.06, N = 30 [90.9%] | (1) vs (2) P value > 0.05; (1) vs (3) P value > 0.05; (1) vs (4) P value = 0.02; (2) vs (3) P value > 0.05; (3) vs (4) P value = 0.02; (2) vs (4) P value > 0.05 |
| Carroll 2012, (1) CBT, (2) CBT + CM‐adh, (3) CBT + CM‐abs, (4) CM‐abs | Days used in prior 28 days (mean ± SD) | (1) 15.6 ± 9.8, N = 36, (2) 17.6 ± 8.6, N = 32, (3) 17.9 ± 9.6, N = 32, (4) 14.1 ± 10.6, N = 27 | (1) Unclear, N = 33 [91.7%], (2) Unclear, N = 25 [78.1%], (3) Unclear, N = 26 [81.3%], (4) Unclear, N = 23 [85.2%] | (1) vs (2) P value = 0.00; (1) vs (3) P value = 0.00; (1) vs (4) P value > 0.05; (2) vs (3) P value > 0.05; (3) vs (4)* P value = 0.00; (2) vs (4) P value = 0.00 |
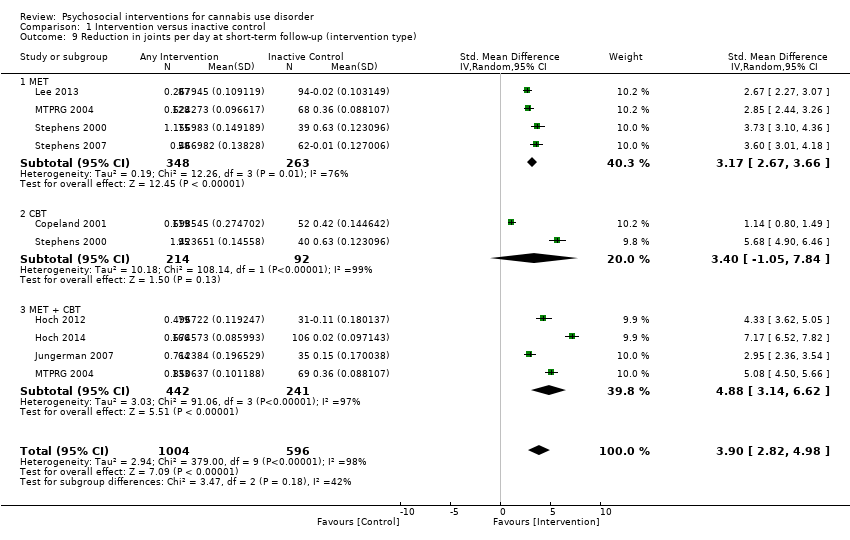
| Copeland 2001, (1) CBT [6‐session], (2) CBT [1‐session], (3) DTC | Percent of days abstinent post treatment (mean ± SD) | (1) n/a, N = 78, (2) n/a, N = 82, (3) n/a, N = 69 | (1) 35.9 ± 34.8, N = 58 [74.4%], (2) 44.8 ± 37.7, N = 61 [74.4%], (3) 29.7 ± 32.6, N = 52 [75.4%] | (1) vs (2) P value > 0.05; (1) vs (3) P value > 0.05; (2) vs (3) P value > 0.05 |
| de Dios 2012, (1) MM, (2) Assessed control | Days used in prior 30 days (mean ± SD) | (1) 17.0 ± 9.96, N = 22, (2) 18.8 ± 8.1, N = 12 | (1) Unclear, N = 16 [72.7%], (2) Unclear, N = 9 [75.0%] | (1) vs (2) P value = 0.031 across FU |
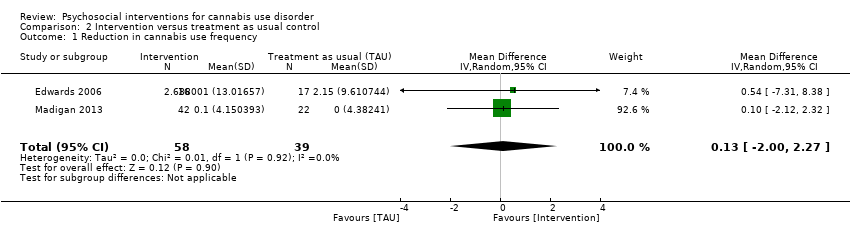
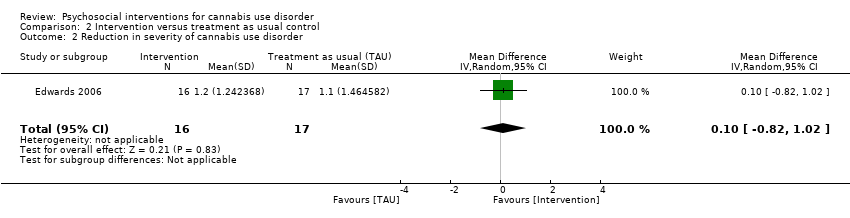
| Edwards 2006, (1) DC, (2) TAU | % of days used in prior 4 weeks (mean ± SD) | (1) 39.4 ± 38.4, N = 23, (2) 26.0 ± 28.3, N = 24 | (1) 32.4 ± 44.9, N = 16 [69.6%], (2) 19.3 ± 30.4, N = 17 [70.8%] | (1) vs (2) P value > 0.05 |
| Fischer 2012, (1) DC‐oral, (2) DC‐workbook, (3) Health promotion‐oral, (4) Health promotion‐workbook | Days used in prior 30 days (mean, range) | (1) 21.96, 4.75, N = 24, (2) 24.82, 3.0, N = 47, (3) 21.36, 5.5, N = 25, (4) 25.36, 3.41, N = 37 | (1) Unclear, N = Unclear, (2) Unclear, N = Unclear, (3) Unclear, N = Unclear, (4) Unclear, N = Unclear | (1) vs (2) P value > 0.05; (1) vs (3) P value > 0.05; (1) vs (4) P value > 0.05; (2) vs (3) P value > 0.05; (3) vs (4) P value > 0.05; (2) vs (4) P value > 0.05 |
| Hoch 2012, (1) MET + CBT, (2) DTC | Percent reporting abstinence post treatment (%) | (1) n/a, N = 90, (2) n/a, N = 32 | (1) 49, N = 79 [87.8%], (2) 12.5, N = 31 [96.9%] | (1) vs (2) P value < 0.05 |
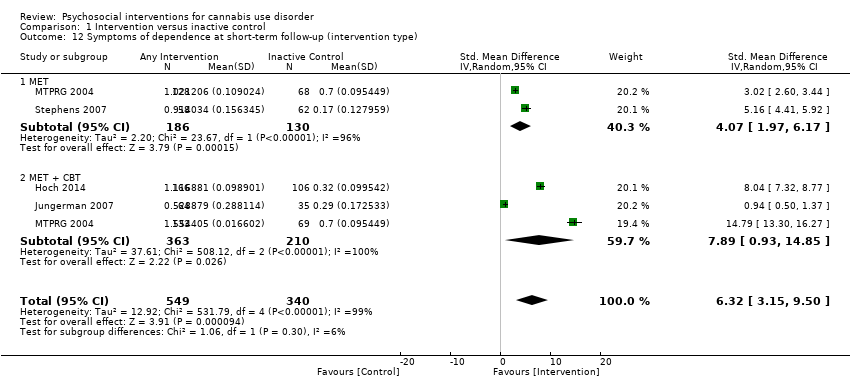
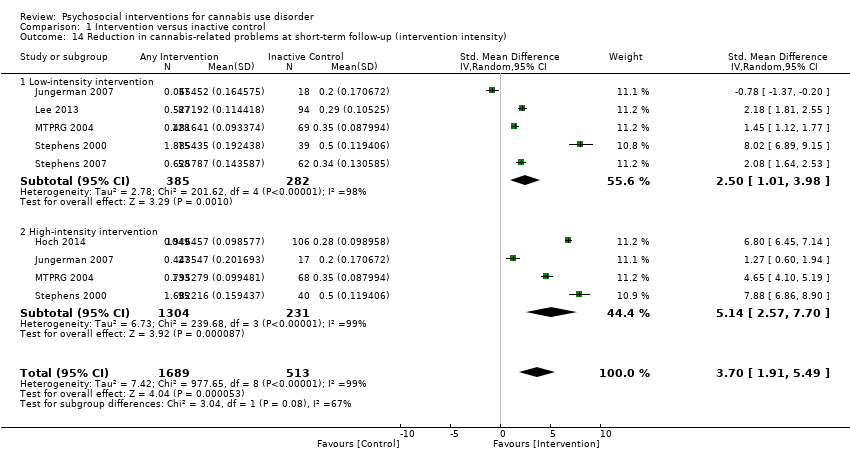
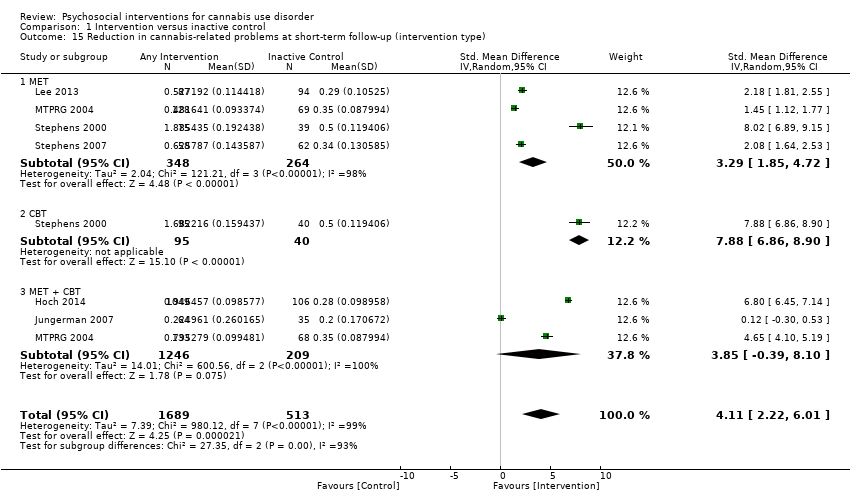
| Hoch 2014, (1) MET + CBT, (2) DTC | Percent reporting abstinence post treatment (%) | (1) n/a, N = 166, (2) n/a, N = 130 | (1) 53.3, N = 166 [100%], (2) 22, N = 106 [81.5%] | (1) vs (2) P value < 0.05 |
| Jungerman 2007, (1) MET + CBT [3 months], (2) MET + CBT [1 month], (3) DTC | Percent of days used in prior 90 days (mean ± SE) | (1) 88.17 ± 1.95, N = 52, (2) 94.19 ± 1.87, N = 56, (3) 94.06 ± 1.95, N = 52 | (1) 56.21 ± 4.38, N = 27 [51.9%], (2) 64.90 ± 4.27, N = 37 [66.1%], (3) 86.12 ± 4.38, N = 35 [67.3%] | (1) vs (2) P value > 0.05; (1) vs (3) P value = 0.0008; (2) vs (3) P value = 0.0002 |
| Kadden 2007 (1) MET + CBT + CM‐abs, (2) MET + CBT, (3) CM‐abs, (4) Health education | Proportion of days used in prior 90 days (mean ± SD) | (1) 0.11 ± 0.17, N = 63, (2) 0.08 ± 0.13, N = 61, (3) 0.15 ± 0.19, N = 54, (4) 0.08 ± 0.12, N = 62 | (1) 27, N = 51 [81.0%], (2) 19, N = 49 [80.3%], (3) Unclear, N = 48 [88.9%], (4) Unclear, N = 52 [83.9%] | (1) vs (2) P value > 0.05; (1) vs (3) P value > 0.05; (1) vs (4) P value < 0.05; (2) vs (3) P value > 0.05; (3) vs (4) P value > 0.05 [P value < 0.05 at 3 month FU only]; (2) vs (4) P value < 0.05 |
| Lee 2013, (1) MET, (2) Assessed control | Days used in prior 30 days (mean ± SD) | (1) 16.5 ± 8.2, N = 106, (2) 15.6 ± 8.8, N = 106 | (1) 13.2 ± 10.6, N = 89 [84.0%], (2) 11.7 ± 11.1, N = 86 [81.1%] | (1) vs (2) P value > 0.05 |
| Litt 2013, (1) MET + CBT + CM‐abs, (2) MET + CBT + CM‐adh, (3) Assessed control | Days used in prior 90 days (mean ± SD) | (1) 72.5 ± 28.0, N = 73, (2) 71.8 ± 27.8, N = 71, (3) 68.4 ± 31.5, N = 71 | (1) Unclear, N = 60 [82.2%], (2) Unclear, N = 61 [85.9%], (3) Unclear, N = 61 [85.9%] | (1) vs (2) P value < 0.05 [significant at FU months 5‐8 only]; (1) vs (3) P value > 0.05; (2) vs (3) P value > 0.05 |
| Madigan 2013, (1) MET + CBT, (2) TAU | Days used in prior 30 days (mean ± SD) | (1) 10.0 ± 3.6, N = 59, (2) 10.1 ± 3.7, N = 29 | (1) 9.8 ± 3.9, N = 32 [54.2%], (2) 10.1 ± 4.0, N = 19 [65.5%] | (1) vs (2) P value > 0.05 |
| MTPRG 2004, (1) MET + CBT, (2) MET, (3) Assessed control | Percent of days used in prior 90 days (mean ± SD) | (1) 87.56 ± 17.24, N = 156, (2) 86.92 ± 17.15, N = 146, (3) 89.88 ± 14.11, N = 148 | (1) 44.86 ± 40.52, N = 129 [82.7%], (2) 53.65 ± 38.57, N = 120 [82.2%], (3) 75.59 ± 30.69, N = 137 [92.6%] | (1) vs (2) P value < 0.05 [Cohen d = 0.22]; (1) vs (3) P value < 0.05 [Cohen d = 1.14]; (2) vs (3) P value < 0.05 [Cohen d = 0.59] |
| Roffman 1988, (1) RP, (2) SS | Days used in prior ‘month’ (mean ± SD) | (1) 27.13 ± 4.6, N = 54, (2) 26.36 ± 5.79, N = 56 | (1) 8.18 ± 10.48, N = 45 [83.3%], (2) 12.96 ± 11.56, N = 52 [92.9%] | (1) vs (2) P value < 0.05 |
| Stein 2011, (1) MET, (2) Assessed control | Proportion of days used in prior 90 days (mean ± SD) | (1) 0.59 ± 0.34, N = 163, (2) 0.55 ± 0.34, N = 169 | (1) Unclear, N = 126 [77.3%], (2) Unclear, N = 136 [80.5%] | (1) vs (2) P value = 0.01 [significant at 3 month FU only] |
| Stephens 1994, (1) RP, (2) SS | Days used in prior 30 days (mean ± SD) | (1) 27.04 ± 4.66, N = 106, (2) 26.36 ± 5.81, N = 106 | (1) 15.31 ± 12.49, N = 80 [75.5%], (2) 13.79 ± 11.9, N = 87 [82.1%] | (1) vs (2) P value > 0.05 |
| Stephens 2000, (1) MET, (2) CBT, (3) Assessed control | Days used in prior 90 days divided by 3 (mean ± SD) | (1) 24.24 ± 6.29, N = 88, (2) 25.38 ± 6.15, N = 117. (3) 24.85 ± 6.13, N = 86 | (1) 12.99 ± 11.61, N = 80 [90.9%], (2) 12.29 ± 12.34, N = 103 [88.0%], (3) 17.09 ± 10.73, N = 79 [91.9%] | (1) vs (2) P value < 0.02 [significant at EoT only, assessed during treatment for (2)]; (1) vs (3) P value < 0.001; (2) vs (3) P value < 0.001 [significant at EoT only] |
| Stephens 2007, (1) MET, (2) Drug‐related health education, (3) DTC | Days used in prior 90 days converted to average days per week (mean ± SE) | (1) 5.76 ± 0.15, N = 62. (2) 5.79 ± 0.15, N = 62, (3) 6.06 ± 0.15, N = 64 | (1) 4.65 ± 0.28, N = 49 [79.0%], (2) 5.58 ± 0.28, N = 52 [83.9%], (3) 5.75 ± 0.24, N = 62 [96.9%] | (1) vs (2) P value <0.05 [Cohen d = 0.45]; (1) vs (3) P value < 0.05 [significant at 1.75 month FU, Cohen d = 0.47]; (2) vs (3) P value > 0.05 |