大麻滥用的社会心理干预
Referencias
References to studies included in this review
References to studies excluded from this review
Additional references
References to other published versions of this review
Characteristics of studies
Characteristics of included studies [ordered by study ID]
Ir a:
| Methods | Randomised controlled trial | |
| Participants | 210 hospital patients who were screened for "behaviour temporally associated with [cannabis] use" were randomised Approximately 25% to 32% of the sample was reported to meet the diagnosis for post‐traumatic stress disorder, and 8% to 15% reported depression Most participants were female (63.2% and 67.6% in Groups 1 and 2, unclear proportion in Group 3) and African American (93.8% and 77.5% in Groups 1 and 2, unclear proportion in Group 3) and were in their late teens or early twenties (70.6% in Group 1 were 18 to 21 years old, 70.4% in Group 2, unclear proportion in Group 3). Education and employment were not reported Cannabis use was reported to occur approximately every second day (19.0 and 15.3 days per month on average for Groups 1 and 2, not reported for Group 3) at baseline, although additional details on use were not provided Previous cannabis treatments and motivation to quit were not assessed. Other illicit substance use was not reported and was not among the exclusion criteria. Tobacco and alcohol use was not reported, although risky alcohol use was an exclusion criterion | |
| Interventions | Group 1: 2‐session MET with 1 telephone call booster session over 56 weeks (actual treatment completion rates were not reported; n = 68) Group 2: 2‐session assessment‐only control over 56 weeks (actual treatment completion rates were not reported; n = 71) Group 3: DTC (n = 71) Sessions lasted 20 to 30 minutes. The cannabis‐related goal of treatment was not clear. Participants were reimbursed up to $80 for their participation. Therapists received extensive training, although intervention fidelity checking was not reported | |
| Outcomes | Frequency of cannabis use during the preceding 30 days; point‐prevalence abstinence rates; proportion reporting attempts to reduce use; index of cannabis‐related problems such as driving while under the influence of cannabis | |
| Notes | Follow‐up was provided at 3 and 12 months after interventions, and comparisons included Group 3 only up to 12 months Follow‐up rates at final assessment:
Study was funded by the National Institute on Drug Abuse. Study authors reported no declarations of interest | |
| Risk of bias | ||
| Bias | Authors' judgement | Support for judgement |
| Random sequence generation (selection bias) | Low risk | Computer‐generated random assignment in blocks of 100 stratified by age group (14 to 17 years and 18 to 21 years) |
| Allocation concealment (selection bias) | Low risk | A double opaque envelope system was utilised, with the first envelope opened after enrolment |
| Blinding of participants and personnel (performance bias) | High risk | Participant and personnel blinding was not possible because of the type of intervention provided |
| Blinding of outcome assessment (detection bias) | Low risk | Outcome assessors were blinded to participant grouping |
| Blinding of outcome assessment (detection bias) | Unclear risk | No collateral/biological verification of self report was collected |
| Incomplete outcome data (attrition bias) | Unclear risk | Follow‐up rates were low but comparable between groups |
| Selective reporting (reporting bias) | Low risk | Pre‐specified outcomes were reported, and trial protocol is shown |
| Other bias | High risk | Substance use other than cannabis use was not assessed and was not included in the exclusion criteria. Relatively little demographic information was collected, and no history of substance use was collected. Confounding variables may have been introduced during the trial period, as intervention groups received 2 sessions over 56 weeks, each only 30 minutes in duration. Measures of outcome variables were not validated. No other bias was found |
| Methods | Randomised controlled trial. Single site: patients at a university‐based psychiatric facility | |
| Participants | 62 psychiatric patients in treatment for psychosis were screened by review of medical records to identify those using more than 2 joints per week in the past month; these individuals were then randomised Most participants were male (86.7% and 87.5% in Groups 1 and 2, respectively) and were in their late twenties (average, 25.0 and 25.5 years). Most obtained no post secondary school qualifications and were receiving state aid benefits. Ethnicity was not reported. All participants were fluent in French Cannabis use was reported to occur near daily (82.1% and 89.3% of days), and smoking on approximately 20 occasions during the week before baseline (22.5 and 19.0 occasions). All participants reported use to be at least mildly "problematic", and most met criteria for cannabis use disorder (86.7%, 78.1%) Participants first began to use cannabis at an average age of 15 years and used regularly since the age of 17 years. Previous experience with cannabis treatment was not assessed, although half the sample reported a motivation to reduce use. Participants reported no other illicit substance use in the previous month, although 86.7% and 71.9% reported that they drank alcohol. Tobacco use was not reported | |
| Interventions | Group 1: 4 to 6 MET sessions over 24 weeks with the option of 3 group sessions (on average 6.4 sessions were completed; n = 30) in addition to psychosis treatment as usual. Sessions lasted 45 to 60 minutes Group 2: usual treatment for psychosis as needed over 24 weeks (n = 32) Intervention goal was to reduce cannabis use. Participant reimbursement was not described. Details of therapist training and supervision were not provided | |
| Outcomes | Days of cannabis use "binges"; frequency of abstinence;, number of joints per week; readiness‐to‐change questionnaire; Positive and Negative Syndrome Scale mental health assessment, Global Assessment of Functioning scale | |
| Notes | Follow‐up was provided at 3, 6 and 12 months Follow‐up rates at final assessment:
Study was funded by the Swiss Research National Fund. Study authors reported no declarations of interest | |
| Risk of bias | ||
| Bias | Authors' judgement | Support for judgement |
| Random sequence generation (selection bias) | Low risk | "Randomization was performed by blocks of eight based on a computer‐generated allocation placed in closed envelopes" |
| Allocation concealment (selection bias) | Low risk | "Envelopes were generated and kept by a member of the admin staff of the project" |
| Blinding of participants and personnel (performance bias) | High risk | Participant and personnel blinding was not possible because of the type of intervention provided |
| Blinding of outcome assessment (detection bias) | Unclear risk | "The assessments were conducted by an independent member of the research team who was not the participant’s therapist"; however it was unclear whether these assessors were blinded |
| Blinding of outcome assessment (detection bias) | Unclear risk | No collateral/biological verification of self report was collected |
| Incomplete outcome data (attrition bias) | Low risk | Differences in missing data were not described, but final follow‐up rates were high (Group 1: n = 25, 83.3%; Group 2: n = 29, 90.6%) |
| Selective reporting (reporting bias) | Low risk | Chosen measures of cannabis use were not validated, but all pre‐specified outcomes were reported and the protocol is shown |
| Other bias | Low risk | Chosen subjective measure of cannabis use was not validated. No other bias was found |
| Methods | Randomised controlled trial | |
| Participants | 60 cannabis users responding to advertisement for treatment for marijuana dependence were randomised Most participants were male (80%, 90% and 80% in Groups 1, 2 and 3, respectively) and were in their early thirties (average 32.6, 33.1 and 32.0 years). All participants were white Caucasian, and most were employed (70%, 60%, 65%), with on average 13 years of education (13.2, 13.3, 13.4) Cannabis use was reported to occur near daily (average 24.1, 20.4 and 23.2 days in the past 30 days), and smoking on approximately 4 occasions during the day (3.8, 3.7, 3.8). Participants reported on average 7 problems related to cannabis use (7.7, 7.1, 6.7) and 6 symptoms of cannabis use disorder (6.8, 6.1, 6.4). Participants reported on average 15 years of regular cannabis use (14.3, 15.9, 15.5), and a minority had experienced previous cannabis treatment (35%, 20%, 25%) Many participants were current tobacco smokers (65%, 40%, 45%) and consumed alcohol approximately weekly (on 4.0, 7.0 and 2.7 days in the previous month). Other illicit substance use frequency was not reported, although dependence was an exclusion criterion | |
| Interventions | Group 1: 14‐session MET + CBT over 14 weeks with up to $570 CM for continuous abstinence (55% completed ≥ 1 session and provided 1 urine sample during the past 2 weeks of treatment; n = 20) Group 2: 14‐session MET + CBT over 14 weeks (65% completed ≥ 1 session and provided 1 urine sample during the past 2 weeks of treatment; n = 20) Group 3: 4‐session MET over 14 weeks (45% completed ≥ 1 session and provided 1 urine sample during the past 2 weeks of treatment; n = 20) Sessions lasted 60 to 90 minutes. Intervention goal was to abstain from cannabis use. Participant reimbursement was not described. Therapist training included manual review and practice role‐plays. Intervention fidelity was checked through weekly case reviews and supervision | |
| Outcomes | Frequency of cannabis using days; proportion of continuous abstinence; urinalysis; index of cannabis problems; proportion reporting motivation to quit; psychosocial functioning using ASI composite scores, URICA, SCQ, BSI, BDI. Other substance use reported only on ASI | |
| Notes | Follow‐up was provided at 14 weeks (end of treatment) through an intent‐to‐treat approach (ITT) Follow‐up rates at final assessment:
Analysis of co‐variance (treatment group = co‐variate, weeks of cannabis abstinence = dependent variable) was used to test therapist effects (none were found) Study was funded by the National Institute on Drug Abuse. Study authors reported no declarations of interest | |
| Risk of bias | ||
| Bias | Authors' judgement | Support for judgement |
| Random sequence generation (selection bias) | Low risk | "Minimum likelihood allocation was used to randomly assign the 60 participants sequentially to one of the three groups while balancing across groups on baseline characteristics" (such as gender and legal status) |
| Allocation concealment (selection bias) | Low risk | Participants were centrally allocated, although some time had passed between assessment and allocation |
| Blinding of participants and personnel (performance bias) | High risk | Participant and personnel blinding was not possible because of the type of intervention provided |
| Blinding of outcome assessment (detection bias) | Unclear risk | Blinding of outcome assessors was not described |
| Blinding of outcome assessment (detection bias) | Low risk | Urine was collected to establish continuous abstinence during the trial |
| Incomplete outcome data (attrition bias) | Low risk | Follow‐up rates were low to moderate, and no group differences were reported |
| Selective reporting (reporting bias) | Low risk | Pre‐specified outcomes were reported, and protocol is shown |
| Other bias | Low risk | Treatment completion rates were low. Use of additional treatments during the trial was not assessed, but this seems unlikely given the intensity of treatment. Pre‐treatment differences were found with regards to aspects of dependence and whether participants were married. It was unclear whether these differences would impact outcomes, and the statistical plan did not appear to address differences. No other bias was found |
| Methods | Randomised controlled trial. Treatment delivered at an out‐patient clinic for cannabis dependence | |
| Participants | 90 cannabis users responding to an advertisement for marijuana dependence treatment were randomised Most participants were male (80%, 70% and 80% in Groups 1, 2 and 3, respectively) and were in their early thirties (average 30.9, 33.9 and 34.6 years). Most were white Caucasian (90%, 97%, 100%) and employed (67%, 53%, 53%), with on average 13 years of education (13.1, 13.1, 12.3). Cannabis use was reported to occur near daily (average 25.3, 25.5 and 26.0 days in the past 30 days), smoking on approximately 4 occasions during the day (4.2, 3.7, 3.8). Participants reported on average 8 problems related to cannabis use (7.8, 7.9, 7.8) and 6 symptoms of cannabis use disorder (4.9, 4.7, 5.0). Participants reported on average more than 10 years of regular cannabis use (11.3, 14.7, 15.3), and a minority had experienced previous cannabis treatment (37%, 37%, 57%). Approximately half of participants were current tobacco smokers (65%, 40%, 45%). Other substance use was measured by ASI component scores (all < 0.5), and dependence was an exclusion criterion | |
| Interventions | Group 1: 14‐session CBT over 14 weeks + up to $664.44 CM for continuous abstinence (participants completed on average 9.6 sessions; n = 20) Group 2: 14‐session CBT over 14 weeks + up to $140 CM for treatment adherence (participants completed on average 8.8 sessions; n = 20) Group 3: $664.44 CM for continuous abstinence over 14 weeks (participants stayed in treatment on average 9.5 weeks; n = 20) Sessions lasted 50 minutes. Intervention goal was to abstain from cannabis use. Participants were reimbursed up to $200. Therapist training included manual review and practice role‐plays. Intervention fidelity was not reported | |
| Outcomes | Frequency of cannabis using days (urinalysis + self reports); proportion reporting continuous abstinence; proportion with no symptoms of dependence for ≥ 1 month; number of cannabis related problems; psychosocial functioning: ASI composite scores, MPS, BDI, BSI; other substance use reported using ASI | |
| Notes | Follow‐up was provided at end of treatment, then at 3, 6, 9 and 12 months through an intent‐to‐treat approach (ITT) Therapist effects were investigated and were found to be non‐significant Follow‐up rates at final assessment:
Study was funded by the National Institute on Drug Abuse. Study authors reported no declarations of interest | |
| Risk of bias | ||
| Bias | Authors' judgement | Support for judgement |
| Random sequence generation (selection bias) | Low risk | "Minimum likelihood allocation (Aickin, 1982) was used", balancing on legal involvement and gender |
| Allocation concealment (selection bias) | Low risk | Participants were centrally allocated, although some time had passed between assessment and allocation |
| Blinding of participants and personnel (performance bias) | High risk | Participant and personnel blinding was not possible because of the type of intervention provided |
| Blinding of outcome assessment (detection bias) | High risk | "Research assistants who were not blinded to group conducted" data collection |
| Blinding of outcome assessment (detection bias) | Low risk | Urine collected to establish point‐prevalence abstinence |
| Incomplete outcome data (attrition bias) | Low risk | Follow‐up rates were a little low and group differences were not reported, but an ITT approach was used |
| Selective reporting (reporting bias) | Low risk | With the minor exception of data from cannabis problems and joints per day and ASI scores not reported in follow‐up, pre‐specified outcomes were reported and protocol is shown |
| Other bias | Low risk | Treatments accessed during the trial period were not assessed, but this seems unlikely given the intensity of treatment No other bias was found |
| Methods | Randomised controlled trial. Treatment referrals to a substance abuse treatment unit | |
| Participants | 136 individuals were referred from the office of adult probation to a substance abuse treatment unit and were randomised Most participants were male (88%, 94%, 94% and 82% in Groups 1, 2, 3 and 4, respectively) and were in their early twenties (average 21.0, 21.5, 21.1 and 21.2 years), and most were African American (52%, 77%, 53%, 58%). Participants were typically employed (54%, 53%, 33%, 54%) and had completed at least high school (51%, 53%, 56%, 48%). Diagnosis of anxiety, depressive or personality disorder was common (81%, 86%, 75%, 69%) Participants began to use cannabis at an average age of 14 years (14.4, 14.4, 14.9, 14.7) and used cannabis every second day (average 13.8, 13.7, 12.4 and 12.5 days per 28 days) Participants consumed alcohol only a few days per month (average 1.9, 1.7, 4.1, 3.3 days). Use of tobacco and other illicit substances was not reported, although participants were excluded if they reported a "physical dependence on alcohol or opioids" | |
| Interventions | Group 1: 8‐session MET/CBT over 8 weeks + up to $340 CM for treatment adherence + up to $540 for continuous abstinence (69.7% of participants completed treatment as intended; n = 33) Group 2: 8‐session DC and option for self help groups over 8 weeks + up to $340 CM for treatment adherence + up to $540 for continuous abstinence (63.7% of participants completed treatment as intended; n = 34) Group 3: 8‐session MET/CBT over 8 weeks (66.7% completed treatment as intended; n = 36) Group 4: 8‐session DC and option for self help groups over 8 weeks (39.4% completed treatment as intended; n = 33) Groups 1 and 4 shared the goal of cannabis abstinence, and Groups 2 and 3 shared the goal of cannabis reduction. Participant reimbursement for follow‐up assessments was not reported. Staff went through intensive training including demonstration of competence. Intervention fidelity was ensured through supervision and videotaping sessions and use of the Yale Adherence and Competence Scale | |
| Outcomes | Proportion of smoking days; duration of longest abstinence in days (self report and urinalysis); proportion with clinical improvement (defined as completing treatment and submitting ≥ 1 negative urine); other substance use reported on ASI | |
| Notes | Follow‐up was provided at end of treatment, then at 3 and 6 months Follow‐up rates at final assessment:
Intention‐to‐treat analysis approach was used Study was funded by the National Institute on Drug Abuse. Study authors reported no declarations of interest | |
| Risk of bias | ||
| Bias | Authors' judgement | Support for judgement |
| Random sequence generation (selection bias) | Unclear risk | Randomisation process not explained |
| Allocation concealment (selection bias) | Low risk | Centrally located; otherwise does not refer to concealment procedures |
| Blinding of participants and personnel (performance bias) | High risk | Participant and personnel blinding was not possible because of the type of intervention provided |
| Blinding of outcome assessment (detection bias) | Unclear risk | Blinding of assessors was not described, although staff were highly trained |
| Blinding of outcome assessment (detection bias) | Low risk | Urine collected during the trial to establish length of abstinence |
| Incomplete outcome data (attrition bias) | Low risk | Follow‐up rates were moderate, and no group differences were reported. ITT was used |
| Selective reporting (reporting bias) | Low risk | With the minor exception that ASI scores were not reported, all pre‐specified outcomes were reported |
| Other bias | Low risk | Compliance with CM was a little low. Outside treatments accessed during the trial period were not assessed, but this seems unlikely given the intensity of treatment. No other bias was found |
| Methods | Randomised controlled trial. Treatment referrals to a substance abuse treatment unit | |
| Participants | 127 individuals were referred from the office of adult probation to a substance abuse treatment unit and were randomised Most participants were male (83.3%, 84.4%, 90.6% and 77.8% in Groups 1, 2, 3 and 4, respectively) and were in their mid‐twenties (average 24.3, 25.4, 26.2 and 27.6 years), and most were African American (66.7%, 62.5%, 59.4%, 66.7%). Participants were typically employed (58.3%, 65.6%, 68.7%, 40.7%) and had completed at least high school (63.9%, 65.6%, 59.4%, 59.3%). Diagnosis of anxiety, depressive or personality disorder was common (44.5%, 33.1%, 62.6%, 37.0%) Participants had been using cannabis regularly for approximately 10 years on average (9.5, 9.9, 10.6, 12.6) and were using cannabis every second day (average 15.6, 17.6, 17.9 and 14.1 per 28 days). Previous experience with cannabis treatment was not reported Participants consumed alcohol only a few days per month (average 1.9, 1.7, 4.1, 3.3 days), smoked tobacco approximately every second day (average 18.7, 16.9, 16.9, 19.3 in the past 28 days) and consumed alcohol once per month (average 2.3, 1.5, 2.7 and 1.8 days). Other illicit substance use was assessed with the ASI, and minimal use was reported | |
| Interventions | Group 1: 12‐session CBT over 12 weeks (n = 36) Group 2: 12‐session CBT + up to $250 CM for treatment adherence (n = 32) Group 3: 12‐session CBT over 12 weeks + up to $250 CM for continuous abstinence (n = 32) Group 4: CM of up to $250 for continuous abstinence over 12 weeks (n = 27) Sessions lasted 50 minutes with the exception of Group 4, which lasted 5 minutes. All interventions shared the goal of cannabis abstinence. On average 5.9 (3.8) sessions were completed across groups. No reimbursement for participation was reported. Staff went through intensive training including demonstration of competence. Intervention fidelity was ensured through supervision, videotaped sessions and use of the Yale Adherence and Competence Scale | |
| Outcomes | Proportion of smoking days; number of consecutive days of abstinence (self report and urinalysis) | |
| Notes | Follow‐up was provided at end of treatment and monthly for 12 months Follow‐up rates at final assessment:
Study was funded by the National Institute on Drug Abuse. Study authors reported no declarations of interest | |
| Risk of bias | ||
| Bias | Authors' judgement | Support for judgement |
| Random sequence generation (selection bias) | Low risk | "Urn randomization program" was specified, although variables used to balance groups were not specified |
| Allocation concealment (selection bias) | Low risk | Participants were centrally allocated, but allocation processes did involve other agencies through referral; this was not thought to contribute to risk |
| Blinding of participants and personnel (performance bias) | High risk | Participant and personnel blinding was not possible because of the type of intervention provided |
| Blinding of outcome assessment (detection bias) | Unclear risk | Assessor blinding was not reported |
| Blinding of outcome assessment (detection bias) | Low risk | Urine was collected during the trial to establish length of abstinence |
| Incomplete outcome data (attrition bias) | Low risk | Follow‐up rates were high, and no between‐group differences were found |
| Selective reporting (reporting bias) | Low risk | Pre‐specified outcomes were reported and protocol is shown |
| Other bias | Low risk | Non‐cannabis substance use was not assessed beyond baseline, but baseline use was low. Outside treatments accessed during the trial period were not assessed, although this seems unlikely given the intensity of treatment. Baseline differences in antisocial personality disorder were found between groups, and it was unclear whether this was addressed in the data analysis plan. No other bias was found |
| Methods | Randomised controlled trial | |
| Participants | 229 responders to an advertisement for cannabis treatment were randomised Most members of the sample were male (69.4% of total sample) and were in their early thirties (average 32.3 years) Most members of the total sample were daily cannabis users who used 2 joints per day on average (2.1, 2.0 and 2.2 in Groups 1, 2 and 3, respectively) Cannabis‐related problems were high (scores of 42.4, 42.2 and 45.4 on the CPQ), and participants reported an average score ≥ 9 on the SDS (9.2, 9.8, 9.3). A minority of the total sample had experienced previous cannabis treatment (28.8%) Other substance use was not reported, although participants were excluded if they reported more than weekly use of any drug other than nicotine and alcohol, a score > 14 on the AUDIT or any previous alcohol‐related social problems | |
| Interventions | Group 1: 6‐session CBT over 6 weeks (50% of participants completed treatment as intended, 4.2 sessions were completed on average; n = 78). Sessions lasted 60 minutes. Group 2: single‐session CBT (87.8% of participants received the session; n = 82). This session lasted 90 minutes Group 3: DTC (n = 69) Interventions shared a cannabis‐abstinence goal. Participants were reimbursed with lottery entry to win a $1000 voucher for participation. Therapist training was not well described, but therapists did receive "regular clinical supervision". Treatment fidelity was ensured by audiotaping all sessions and assigning an independent rating of a random schedule of 1 in 10 sessions | |
| Outcomes | Proportion of smoking days; proportion abstinent in the past month; proportion reporting continuous abstinence; number of joints used per day; score on SDS, score on CPQ; mental health on Global Severity Index from SCL‐90‐R | |
| Notes | Follow‐up was provided at an average of 242 days for Group 1, 223 days for Group 2 and 242 days for Group 3. Follow‐up rates at final assessment were not reported by group, but 74.2% of the total sample was assessed Analysis tested for differences by therapist and found no significant effect. An ITT analysis approach was used Study was funded by the Australian Commonwealth Department of Health and Family Services Research into Drug Abuse Grants Program. Study authors reported no declarations of interest | |
| Risk of bias | ||
| Bias | Authors' judgement | Support for judgement |
| Random sequence generation (selection bias) | Unclear risk | Randomisation process not explained |
| Allocation concealment (selection bias) | Low risk | Participants were centrally allocated; otherwise, concealment procedures were not reported |
| Blinding of participants and personnel (performance bias) | High risk | Participant and personnel blinding was not possible because of the type of intervention provided |
| Blinding of outcome assessment (detection bias) | Low risk | An "independent researcher 'blind' to the subject’s treatment" completed assessments |
| Blinding of outcome assessment (detection bias) | Low risk | Urine collected to establish the validity of self report |
| Incomplete outcome data (attrition bias) | Low risk | "For each outcome, additional analyses controlling for the effect of potential confounders on the relationship between treatment condition and outcome were conducted where appropriate." ITT was used |
| Selective reporting (reporting bias) | Low risk | Pre‐specified outcomes were reported and protocol is shown |
| Other bias | Low risk | Although participants were excluded if they reported more than weekly drug use, substance use otherwise was not assessed during the trial. No recent treatment or additional treatment was permitted during the trial period; otherwise, it was not assessed. Very few demographics were collected at baseline, although they were reported in a secondary analysis (Copeland 2001b). No other bias was found |
| Methods | Randomised controlled trial. Treatment was delivered at the Warren Alpert Medical School of Brown University | |
| Participants | 34 responders to an advertisement offering a way to reduce cannabis use and learn ways to relax were randomised All participants were female and were in their early twenties (average age 22.7 and 23.5 years in Groups 1 and 2, respectively). Just over half of participants were white Caucasian (58.3%, 50%) and employed (54.6%, 50.0%) Participants reported using cannabis approximately every second day (average 17.0 and 18.8 days in the past 30 days). Other substance use was not reported, although participants were excluded if they reported any use of cocaine, heroin, methamphetamine or other drugs in the past month, or more than seven drinks per week in the past month | |
| Interventions | Group 1: 2‐session mindfulness‐based meditation over 2 weeks (73% of participants attended both sessions) Group 2: DTC Sessions lasted 45 minutes. Treatment goal was not specifically stated, although the focus was on replacing cannabis use with relaxation techniques. Participants were reimbursed for participation, although the monetary figure was not reported. Therapist training was intensive and treatment fidelity was ensured by supervision, session recording and review | |
| Outcomes | Baseline change in cannabis use frequency; proportion reporting point‐prevalence and/or continuous abstinence | |
| Notes | Follow‐up was provided at 1, 2 and 3 months Follow‐up rates at final assessment:
Study was funded by the National Institute on Drug Abuse. Study authors reported no declarations of interest | |
| Risk of bias | ||
| Bias | Authors' judgement | Support for judgement |
| Random sequence generation (selection bias) | Unclear risk | Randomisation process was unclear. Participants were randomised by a "2:1 ratio" ..."to optimize the interventionist's experience in delivering the intervention and to ensure adequate numbers of MI‐MM participants after accounting for the potential for dropout" |
| Allocation concealment (selection bias) | Low risk | Participants were centrally allocated; otherwise, concealment procedures were not reported |
| Blinding of participants and personnel (performance bias) | High risk | Participant and personnel blinding was not possible because of the type of intervention provided |
| Blinding of outcome assessment (detection bias) | Low risk | "Research assistants performing the assessments were blinded to the assigned condition" |
| Blinding of outcome assessment (detection bias) | Unclear risk | No urinalysis was used to verify self report |
| Incomplete outcome data (attrition bias) | Low risk | Follow‐up rates were low, but no differences between groups were noted |
| Selective reporting (reporting bias) | Low risk | Aside from mental health measures used only at baseline, all pre‐specified cannabis use measures were reported in results |
| Other bias | High risk | Cannabis‐related measures collected were minimal and were not validated. The trial included a small sample, although the analysis plan addressed this. Other substance use was not measured during the trial, nor was previous or current drug treatment experience |
| Methods | Randomised controlled trial. Intervention delivered at the Early Psychosis Prevention and Intervention Centre (EPPIC) | |
| Participants | 47 patients of a mental health service who continued to use cannabis at 10 weeks of treatment were randomised Most participants were male (65.2% and 79.2% in Groups 1 and 2, respectively). Participants were 20.9 years of age on average. A minority of participants reported education beyond secondary (14.9%), and most were diagnosed with schizophrenia (63.6%, 79.2%) Participants reported using cannabis more than weekly (average 39.4% and 26.0% of days), and approximately half were diagnosed with cannabis use disorder (54.5%, 43.5%). Experience with cannabis treatment was not reported A minority of the sample reported alcohol use disorder (2.2%). Other substance use was not assessed | |
| Interventions | Group 1: 10‐session DC over 3 months with 1 booster CBT session at 3 months (average 7.6 sessions attended; n = 23) Group 2: 10‐session usual psychosis treatment over 3 months (average 8.4 sessions attended; n = 24) Sessions lasted 20 to 60 minutes. Intervention goals were not specifically mentioned, although a goal of cannabis reduction was likely. Participant reimbursement for participation was not reported. Therapists were described to have been trained previously and were experienced in drug treatments. Intervention fidelity was ensured through weekly supervision | |
| Outcomes | Proportion of smoking days; baseline change in frequency of use; point‐prevalence abstinence rates; index on severity of cannabis use (all measured from the Cannabis and Substance Use Assessment Schedule); proportion in the "action" stage of change; mental health assessed with BPRS, SANS, BDI‐SF, SOFAS, KAPQ; attendance at out‐patient treatments | |
| Notes | Follow‐up at end of treatment, then at 6 months Follow‐up rates at final assessment:
Study was funded by the Victorian Government Department of Human Services. Study authors reported no declarations of interest | |
| Risk of bias | ||
| Bias | Authors' judgement | Support for judgement |
| Random sequence generation (selection bias) | Low risk | "Randomization codes were computer generated and placed in sealed envelopes, managed by a non‐clinical member of the research team" |
| Allocation concealment (selection bias) | Low risk | Allocation used "sealed envelopes… requesting participants and clinicians not to disclose treatment conditions to raters" |
| Blinding of participants and personnel (performance bias) | High risk | Participant and personnel blinding was not possible because of the type of intervention provided |
| Blinding of outcome assessment (detection bias) | Low risk | "Attempts to maintain rater blindness included use of separate rooms and administrative procedures for project staff, limiting information recorded in clinical notes, and requesting participants and clinicians not to disclose treatment conditions to raters" |
| Blinding of outcome assessment (detection bias) | Unclear risk | No urinalysis or collateral report was used to verify self report |
| Incomplete outcome data (attrition bias) | Low risk | No difference in follow‐up attrition rates on key variables were found. Follow‐up rates were high |
| Selective reporting (reporting bias) | Low risk | Pre‐specified outcomes were reported and protocol is shown |
| Other bias | Low risk | Other drug use and treatment were not assessed (with the exception of alcohol use at baseline). No other bias was found |
| Methods | Randomised controlled trial. Intervention delivered at a university‐based research facility | |
| Participants | 134 university students responding to an advertisement for cannabis use research Most participants were male (67.5% from Groups 1 and 2 combined, 68.8% from Groups 3 and 4 combined) and were in their early twenties (average 20.1 years in Groups 1 and 2, average 20.6 years in Groups 3 and 4). Most participants were white Caucasian (74% of total sample at 3‐month follow‐up) Participants reported using cannabis for approximately 5 years (average 5.5 years in Groups 1 and 2, 5.6 years in Groups 3 and 4) and were current daily users (using on 22.0, 24.8, 21.4 and 25.4 of the past 30 days in Groups 1, 2, 3 and 4, respectively), smoking approximately 2 joints per day (2.3 in Groups 1 and 2, 2.0 in Groups 3 and 4). Experience with cannabis treatment was not reported Other non‐cannabis substance use was not reported | |
| Interventions | Group 1: single DC session (n = 25) Group 2: 8‐page work booklet on cannabis facts (n = 47) Group 3: single non‐drug health promotion session (n = 25) Group 4: 8‐page work booklet on non‐drug health promotion (n = 37) Sessions lasted 15 to 20 minutes. Treatment goal was unclear. Participants were reimbursed up to $85 for participation. Therapist training was unclear. Intervention fidelity was checked only by asking for participant feedback (which was positive) | |
| Outcomes | Frequency of cannabis using days, joints per using day, proportion of users with "deep inhalation" | |
| Notes | Follow‐up was provided at 3 and 12 months Follow‐up rates at final assessment were unclear, but for Groups 1 and 2 combined, n = 40, 55.6%; and for Groups 3 and 4 combined, n = 32, 51.6% Study was funded by the Canadian Institutes of Health Research. Study authors reported no declarations of interest | |
| Risk of bias | ||
| Bias | Authors' judgement | Support for judgement |
| Random sequence generation (selection bias) | Unclear risk | Randomisation process was not described |
| Allocation concealment (selection bias) | Unclear risk | Allocation concealment was not described |
| Blinding of participants and personnel (performance bias) | High risk | Participant and personnel blinding was not possible because of the type of intervention provided |
| Blinding of outcome assessment (detection bias) | Unclear risk | Blinding procedures were not described |
| Blinding of outcome assessment (detection bias) | Unclear risk | No urinalysis was used to verify self report |
| Incomplete outcome data (attrition bias) | Unclear risk | No difference in follow‐up rates were noted between groups, but the quantity of missing data was reported only in aggregate |
| Selective reporting (reporting bias) | Low risk | Pre‐specified outcomes were reported and protocol is shown |
| Other bias | High risk | External use of treatments (past or present) nor non‐cannabis substance use was not assessed. Further information on participant mental and physical health was warranted given the intervention focus but was not provided |
| Methods | Randomised controlled trial. Intervention was delivered at an out‐patient addiction centre | |
| Participants | 122 patients from an out‐patient addiction centre who were diagnosed with cannabis use disorder and were motivated to reduce their use were randomised Most participants were male (77.8% and 81.3% in Groups 1 and 2, respectively) and were in their early twenties (average 24.4 and 22.1 years of age). Most had completed high school (92.2%, 81.2%). Co‐morbid mental health disorders were common (78.9%, 90.6%). Lifetime use of alcohol and other substance use disorders were common (37.7%, 38.5%) | |
| Interventions | Group 1: 10‐session CBT/MET over 5 weeks (n = 90). Sessions lasted 90 minutes Group 2: DTC (n = 32) The intervention aimed to encourage abstinence through twice‐weekly 90‐minute sessions. Participant reimbursement for participation was not reported. Study therapists were clinical psychologists who had received training in behaviour therapy. All study therapists attended a 1‐week training session. Intervention fidelity was ensured through fortnightly supervision and review of videotaped sessions | |
| Outcomes | Proportion reporting continuous abstinence (self‐report and urinalysis); number of joints per week; cannabis problems on the CUPIT, CPQ and ASI; dependence on the SDS; proportion reporting daily tobacco smoking; proportion reporting any illicit substance use; proportion of participants meeting diagnosis for mental health disorders | |
| Notes | Follow‐up was provided at treatment end and at 3 and 6 months Follow‐up rates at final assessment:
Study was funded by the German Federal Ministry of Education and Research. Study authors reported no connection with the alcohol or tobacco industry, but study author Dr. Wittchen is or was a member of advisory boards of Essex Pharma, Sanofi, Pfizer, Organon, Servier and Novartis and received research grant support and travel reimbursements from these companies | |
| Risk of bias | ||
| Bias | Authors' judgement | Support for judgement |
| Random sequence generation (selection bias) | Low risk | "Randomization of patients was implemented using Randlist program" |
| Allocation concealment (selection bias) | Low risk | "The lists with the consecutive number of included patient and corresponding treatment condition were administered by an independent, external clinical research associate (CRA)" |
| Blinding of participants and personnel (performance bias) | High risk | Participant and personnel blinding was not possible because of the type of intervention |
| Blinding of outcome assessment (detection bias) | Unclear risk | "Baseline, post‐ and follow‐up assessments and urine tests were conducted by interviewers (trained research staff), whereas assessments before and after each therapy session were conducted by study therapists" No further information was provided regarding blinding of these interviewers, but they were well trained |
| Blinding of outcome assessment (detection bias) | Low risk | Urine was collected to verify self report, but individual results were not reported clearly, that is, the article reported that all self report was "confirmed by negative urine test" |
| Incomplete outcome data (attrition bias) | Unclear risk | Final follow‐up rates were discrepant:
Use of ITT was not well reported and was unclear |
| Selective reporting (reporting bias) | Low risk | Pre‐specified outcomes were reported and protocol is shown |
| Other bias | Low risk | At baseline, members of Group 2 were younger and had significantly fewer years since first use and years since first disorder as compared with Group 1. Unclear whether analysis plan addressed this. No other bias was found |
| Methods | Randomised controlled trial. Intervention was delivered at 11 out‐patient addiction centres | |
| Participants | 385 patients from 11 out‐patient addiction centres who reported using cannabis more than weekly and were motivated to reduce use were approached and randomised Most participants were male (87.9% and 85.4% in Groups 1 and 2, respectively) and were in their late twenties (average 26.5 and 26.1 years of age). Most had completed high school (83.6%, 95%) Participants began to use cannabis regularly in their late teens (average 19.1 and 18.4 years of age), and most had made previous quit attempts (85.9%, 83.9%). The total sample reported using cannabis on average 18.8 days in the past 28 days, and used approximately 20 joints over 1 week (20.8, 21.3). Participants reported more than 6 problems on the CPQ (average 6.7 and 6.8) and an average SDS score of approximately 9 (9.0, 9.1) Most reported daily tobacco use (78.2%, 82%), although a minority reported any illicit substance use (10.6%, 7.1%). Alcohol use was not assessed | |
| Interventions | Group 1: 10‐session MET/CBT over 8 to 12 weeks (52.2% of participants completed treatment as intended; n = 149). Sessions lasted 90 minutes Group 2: DTC (n = 130) Intervention aimed to encourage abstinence through twice‐weekly 90‐minute sessions. Participant reimbursement for participation was not reported. Therapist training was intensive, and intervention fidelity was ensured through supervision and videotaped sessions | |
| Outcomes | Proportion reporting continuous abstinence (self report and urinalysis); number of joints per week; cannabis problems on CUPIT and CPQ; dependence on SDS; proportion reporting daily tobacco smoking; proportion reporting any illicit substance use | |
| Notes | Follow‐up was provided at end of treatment, then at 3 and 6 months Rates of follow‐up at final assessment:
Study was funded by the German Federal Ministry of Education and Research. Study authors reported no connection with the alcohol or tobacco industry, but author Dr. Wittchen is or was a member of advisory boards of Essex Pharma, Sanofi, Pfizer, Organon, Servier and Novartis and received research grant support and travel reimbursements from these companies | |
| Risk of bias | ||
| Bias | Authors' judgement | Support for judgement |
| Random sequence generation (selection bias) | Low risk | Randomisation was performed through "a stratified random block design controlling for clinical centers". Study authors described using "the program Randlist to generate the randomization list" |
| Allocation concealment (selection bias) | Low risk | "Randomization was conducted by the research staff in Dresden. Allocation codes were protected against identification using sealed randomization envelopes...At the moment therapists included a patient to the study they were blind to his or her study condition" |
| Blinding of participants and personnel (performance bias) | High risk | Participant and personnel blinding was not possible because of the type of intervention provided |
| Blinding of outcome assessment (detection bias) | Low risk | "[Therapists] were not blind to the treatment they delivered because that would have been impossible" Assessment staff blinding was described: "The statistician knew the block size but was blind to the patients’ randomization codes and names" |
| Blinding of outcome assessment (detection bias) | Low risk | Urine was collected during the trial to show point‐prevalent abstinence |
| Incomplete outcome data (attrition bias) | Low risk | Follow‐up rates were extremely low and differences in attrition rates were noted between groups, but study authors used an ITT approach to address this |
| Selective reporting (reporting bias) | Low risk | Pre‐specified outcomes were reported and protocol is shown |
| Other bias | Unclear risk | Access to external substance use treatments during the trial period was not assessed at follow‐up, but this would be unlikely given the treatment intensity. Treatment completion rates were low, and it was not clear how this was addressed by the analysis plan. DTC had significantly more self reported symptoms of dependence in the previous 4 weeks at baseline; it remains unclear how this was handled in the analysis |
| Methods | Randomised controlled trial. Intervention delivered at a university‐based substance use treatment clinic | |
| Participants | 160 responders to an unspecified advertisement who reported using cannabis ≥ 3 days per week were randomised Most participants were male (82.1%, 75.0%, and 82.7% in Groups 1, 2 and 3, respectively) and were in their early thirties (average 31.7, 32.2, 33.1 years of age). Most participants were white Caucasian (91.1%, 84.6%, 92.3%) and were employed (92.9%, 82.7%, 84.3%). Participants reported on average approximately 15 years of education (15.4, 15.0, 16.6) Participants reported on average 15 years of regular cannabis use (15.3, 15.9, 16.9), and most were daily users (using on 94.2%, 88.2% and 94.1% of the past 90 days) who used approximately 2 joints on average per day (2.1, 2.1, 1.8). Participants reported approximately 10 problems on the MPS (9.8, 10.2, 9.7) and on average ≥ 5 symptoms of dependence (5.6, 5.8, 5.7) Participants reported low levels of alcohol consumption (average 11.1%, 10.0% and 10.1% of days). Non‐cannabis illicit substance use was rare (all < 5% of days). Tobacco use was not reported | |
| Interventions | Group 1: 4‐session MET/CBT over 1 month (85.7% completed the intervention as intended; n = 56) Group 2: 4‐session MET/CBT over 3 months (67.3% completed the intervention as intended; n = 52) Group 3: DTC (n = 52) Sessions lasted 90 minutes. Intervention goals primarily involved cannabis abstinence but were flexible to focus on reduction. Participants were reimbursed for participation with a "travel and meal allowance". Staff intervention training followed manual protocol and weekly supervision, and a purpose‐built empathy scale ensured treatment fidelity | |
| Outcomes | Proportion of smoking days; change in number of smoking days from baseline; proportion reporting point‐prevalent abstinence (self report and urinalysis); joints per day; number of dependence symptoms; cannabis‐related problems on the MPS; functioning (ASI composite scores); other substance use (ASI); proportion of days with alcohol consumption and other substance use | |
| Notes | Intention‐to‐treat analysis was used Therapists effects were assessed and were found to be non‐significant Follow‐up was provided at 4 months post randomisation Follow‐up rates at this final assessment:
Study was funded by the São Paulo Research Foundation. Study authors reported no declarations of interest | |
| Risk of bias | ||
| Bias | Authors' judgement | Support for judgement |
| Random sequence generation (selection bias) | Low risk | Participants were randomly assigned to 1 of 3 groups by a random permuted block technique |
| Allocation concealment (selection bias) | Low risk | "The randomization was done by a neutral person, not involved in any phase of the clinical work...All patients were informed about the result of the randomization over the phone, by the coordinator of the study" |
| Blinding of participants and personnel (performance bias) | High risk | Participant and personnel blinding was not possible because of the type of intervention provided |
| Blinding of outcome assessment (detection bias) | Unclear risk | "The baseline and follow‐up measures were conducted by trained interviewers." Other information regarding blinding of these interviewers was not reported |
| Blinding of outcome assessment (detection bias) | Low risk | Urine was collected during the trial to validate self reports and to show abstinence rates |
| Incomplete outcome data (attrition bias) | Low risk | Follow‐up rates were very low, and Group 3 reported lower attrition rates than Groups 1 and 2. Drop‐outs were significantly more likely to be younger. ITT was used to address these concerns |
| Selective reporting (reporting bias) | Low risk | Pre‐specified outcomes were reported and protocol is shown |
| Other bias | Low risk | The possibility of using additional treatment was not assessed during the trial (although it was shown at baseline). Intervention completion rates were low, and this was not clearly addressed in the analysis plan. At baseline, the proportion of cannabis smoking days was lower in Group 2 as compared with Groups 1 and 3, although the analysis plan did address this concern. No other bias was found |
| Methods | Randomised controlled trial. Intervention delivered at a university‐based treatment centre | |
| Participants | 240 responders to an advertisement for cannabis treatment who met criteria for cannabis use disorder were randomised Most participants were male (69%, 72%, 80% and 64% in Groups 1 to 4, respectively) and were in their early thirties (average 31.9, 34.1, 33.4 and 31.8 years of age). Most participants were white Caucasian (57%, 56%, 72%, 59%), were employed (68%, 82%, 70%, 73%) and had received approximately 13 years of education (average 12.9, 12.9, 13.1, and 12.9 years) Participants used cannabis approximately daily (on 92%, 92%, 85% and 89% of days), used 3 to 5 joints per day (average 5.2, 4.7, 3.2, and 4.8) and reported on average 14 problems on the MPS (15.2, 14.0, 12.6, 13.4). Participant history of cannabis use or cannabis treatments was not assessed Use of alcohol and other illicit drugs was minimal, as measured on the ASI. Half the total sample consisted of current tobacco smokers | |
| Interventions | Group 1: 9‐session non‐drug health promotion over 9 weeks (n = 62) Group 2: 9‐session MET/CBT over 9 weeks (n = 61) Group 3: 9‐session CM of up to $385 for continuous abstinence over 9 weeks (n = 54) Group 4: 9‐session MET/CBT + CM of up to $385 for continuous abstinence over 9 weeks (n = 63) Sessions lasted 60 minutes, with the exception of Group 3, which lasted 15 minutes. On average 5.2 sessions were completed across groups. Each cannabis intervention focused on achieving abstinence. Participants were reimbursed up to $105 for participation. Therapist training was intensive, and intervention fidelity was ensured by bi‐weekly supervision and session videotape review | |
| Outcomes | Proportion of days abstinent; joints smoked per day; proportion reporting continuous abstinence (self report and urinalysis); cannabis‐related problems (MPS); dependence severity (ASI composite scores); proportion of tobacco smokers | |
| Notes | Follow‐up was provided every month for 12 months Rates of follow‐up at final assessment:
Study was funded by the National Institute on Drug Abuse. Study authors reported no declarations of interest | |
| Risk of bias | ||
| Bias | Authors' judgement | Support for judgement |
| Random sequence generation (selection bias) | Low risk | "a computerized urn randomization process… that balanced the four treatment groups on gender, age, education level, ethnicity, employment status, and number of marijuana problems" |
| Allocation concealment (selection bias) | Low risk | Allocation was centrally located; otherwise, study authors did not refer to concealment procedures |
| Blinding of participants and personnel (performance bias) | High risk | Participant and personnel blinding was not possible because of the type of intervention provided |
| Blinding of outcome assessment (detection bias) | Unclear risk | "Research assistants conducted the intake and follow‐up assessments"; other information regarding blinding of these assistants was not reported |
| Blinding of outcome assessment (detection bias) | Low risk | Urine was collected during CM treatment to verify abstinence |
| Incomplete outcome data (attrition bias) | Low risk | No differences in final follow‐up rates were reported between groups; these rates were high (Group 1: n = 52, 83.9%; Group 2: n = 49, 80.3%; Group 3: n = 48, 88.9%; Group 4: n = 51, 81.0%) |
| Selective reporting (reporting bias) | Unclear risk | Very unclear reporting of pre‐specified outcomes. In addition, ASI was used only at baseline |
| Other bias | Unclear risk | Other drug use was reported at baseline only (ASI score only), but participants were excluded on the basis of diagnosis of substance use disorder. Cannabis use history and use of additional treatments were not reported, given length of follow‐up compared with length of treatment; this may have introduced risk. No other bias was found |
| Methods | Randomised controlled trial. Intervention delivery format was unclear; it appeared that intervention was delivered on 2 college campuses, although differences by campus were not reported | |
| Participants | 212 college students responding to a survey were screened for more than weekly cannabis use and were randomised Just over half of participants were male (54.7% of total sample), and on average, participants were 20.0 years old. Most of the total sample was white Caucasian (74.8%). No other demographic information was provided Participants reported that they used cannabis every second day on average (on 16.5 and 15.6 days in the previous 30 days for Group 1 and 2, respectively) and smoked approximately 8 to 9 joints (average 9.4, 8.3). History of cannabis use and previous experience with cannabis treatment were not reported. Participants reported approximately 10 cannabis‐related problems on average (10.5, 10.4) Non‐cannabis substance use was not assessed | |
| Interventions | Group 1: single 60‐minute session MET (n = 106) Group 2: DTC (n = 106) Intervention goal was for reduction in or abstinence from cannabis use. Participants were reimbursed up to $105. Therapist training was intensive, and intervention fidelity was ensured through supervision and use of the MITI | |
| Outcomes | Frequency of cannabis using days; joints per day; number of cannabis‐related problems (using the RMPI) | |
| Notes | Participants who were assigned to Group 1 and completed the session had more cannabis‐related problems at baseline compared with those who did not complete the session Follow‐up was provided at end of treatment, then at 3 and 6 months Rates of follow‐up at final assessment:
Study was funded by the National Institute on Drug Abuse. Study authors reported no declarations of interest | |
| Risk of bias | ||
| Bias | Authors' judgement | Support for judgement |
| Random sequence generation (selection bias) | Low risk | "An algorithm was programmed to utilize a blocked randomized design of two groups based on baseline responses" |
| Allocation concealment (selection bias) | Low risk | Participants were separately allocated "via US mail and email to participate in a brief online screening questionnaire" |
| Blinding of participants and personnel (performance bias) | High risk | Participant and personnel blinding was not possible because of the type of intervention provided |
| Blinding of outcome assessment (detection bias) | Unclear risk | Blinding of outcome assessors was not reported |
| Blinding of outcome assessment (detection bias) | Unclear risk | No urinalysis was used to verify self report |
| Incomplete outcome data (attrition bias) | Low risk | Final follow‐up rates were moderate to high, no differences in attrition were noted between groups (Group 1: n = 89, 84.0%; Group 2: n = 86, 81.1%) |
| Selective reporting (reporting bias) | Low risk | Pre‐specified outcomes were reported and protocol is shown |
| Other bias | High risk | Non‐cannabis substance use and use of external drug treatments during the trial period were not assessed. No information was provided on history of previous cannabis use nor experience of treatment. No other bias was found |
| Methods | Randomised controlled trial. Intervention delivery format was unclear | |
| Participants | 215 responders to an advertisement for cannabis treatment who met criteria for cannabis use disorder were randomised Most participants were male (73.0%, 70.0% and 62% in Groups 1 to 3, respectively) and were in their early thirties (average 32.3, 32.1 and 33.6 years of age). Most participants were white Caucasian (72.9%, 68.5%, 62.9%), were employed (76.1%, 74.0%, 74.6%) and had received on average 13 years of education (13.1, 12.9, 13.4). Participants were near daily users (average 72.5, 71.8 and 68.4 days in the past 90 days), smoking approximately 2 joints per day (2.0, 1.8, 1.6). Participants had little previous experience of cannabis treatment (the total sample had shared a total average of 0.3 treatments). History of cannabis use was not reported Use of tobacco, alcohol and other illicit substances was not reported | |
| Interventions | Group 1: 9‐session MET/CBT + CM for treatment adherence over 9 weeks (lottery system was used to reward homework completion for total possible winning on a single draw of $100) (average 5.7 sessions completed; n = 71) Group 2: 9‐session MET/CBT + CM for continuous abstinence over 9 weeks (lottery system was used to reward negative urine for total possible winning on a single draw of $100) (average 5.5 sessions completed; n = 73) Group 3: 9‐session "case management" over 9 weeks (average 6.0 sessions completed; n = 71) Sessions lasted 60 minutes. Intervention goals focused on cannabis abstinence. Participants were reimbursed up to $190 for participation. Therapist training was manual based, and intervention fidelity was ensured through supervision and use of a purpose‐built fidelity scale | |
| Outcomes | Proportion of smoking days; proportion reporting continuous abstinence (self report and urinalysis); number of cannabis‐related problems (MPS); readiness‐to‐change | |
| Notes | Follow‐up was provided every 90 days for 12 months from end of treatment Rates of follow‐up at final assessment:
Study was funded by the National Institute on Drug Abuse. Study authors reported no declarations of interest | |
| Risk of bias | ||
| Bias | Authors' judgement | Support for judgement |
| Random sequence generation (selection bias) | Low risk | Randomisation was performed "by a research assistant using an urn randomization procedure...that balanced the three treatment conditions for gender, age, ethnicity, employment status, and number of marijuana problems" |
| Allocation concealment (selection bias) | Low risk | Allocation was centrally located; study authors did not otherwise refer to concealment procedures |
| Blinding of participants and personnel (performance bias) | High risk | Participant and personnel blinding was not possible because of the type of intervention provided |
| Blinding of outcome assessment (detection bias) | High risk | As the study authors state: "Given the procedures used in each treatment, neither participants, therapists, nor research assistants could be blinded as to experimental condition" |
| Blinding of outcome assessment (detection bias) | Unclear risk | Urinalysis was conducted during treatment, but results were not reported |
| Incomplete outcome data (attrition bias) | Low risk | Follow‐up rates were moderate, and no between‐group differences were noted |
| Selective reporting (reporting bias) | Low risk | Pre‐specified outcomes were reported and protocol is shown |
| Other bias | High risk | Most results were reported in unclear figures. Non‐cannabis substance use was not reported, although participants who met criteria for substance use disorder were excluded. Use of additional treatment was not assessed at any point. CM components of the interventions were not well adhered to. Previous cannabis use was not measured, although most participants were dependent and daily users. No other bias was found |
| Methods | Randomised controlled trial. Intervention delivered at 3 psychosis treatment clinics | |
| Participants | 88 responders to an advertisement for cannabis and psychosis treatment who met criteria for cannabis use disorder were randomised Most participants were male (78% and 79% in Groups 1 and 2, respectively) and were in their late twenties (average 27.6 and 28.2 years in Groups 1 and 2, respectively). Only approximately one‐third of participants were employed, although more than half had tertiary education Participants in Groups 1 and 2 had used cannabis for 9.6 and 7.5 years on average, and were using on 10 days per month. Approximately one‐fifth of the sample had experienced substance use treatment more than a year before the trial All participants met criteria for psychosis. Non‐cannabis use was not reported | |
| Interventions | Group 1: 13‐session MET/CBT treatment over 18 weeks provided in groups of unclear size (n = 59; 27 received the intervention) Group 2: treatment as usual for psychosis (n = 29) An experienced psychiatrist provided treatment, although information on intervention training and treatment fidelity was not provided | |
| Outcomes | Cannabis use frequency (ASI); mental health with regards to psychosis symptoms (CDSS, BIS, SAPS, SANS) and quality of life (GAF, WHOQOL); acceptance of the intervention (DAI) | |
| Notes | Follow‐up was provided at 3 and 12 months Rates of follow‐up at final assessment:
Study was funded by the Health Research Board of Ireland. Study authors reported no declarations of interest | |
| Risk of bias | ||
| Bias | Authors' judgement | Support for judgement |
| Random sequence generation (selection bias) | Low risk | Quote: "block randomized, computerized method, patients were allocated to one of two treatment arms: GPI with a probability of 2/3 |
| Allocation concealment (selection bias) | Unclear risk | Participants were able to contact those who had already completed treatment to try to gather information on allocation procedures; allocation was done by an independent researcher, but participants were allocated in group format |
| Blinding of participants and personnel (performance bias) | High risk | Participant and personnel blinding was not possible because of the type of intervention provided |
| Blinding of outcome assessment (detection bias) | Low risk | Allocation was "withheld from the rater, who remained blind to allocation until the final assessments were completed" |
| Blinding of outcome assessment (detection bias) | Unclear risk | No urinalysis was used to verify self report |
| Incomplete outcome data (attrition bias) | Unclear risk | Many intervention participants were allocated and did not receive the intervention but were included in the analysis. A moderate difference in follow‐up rates was noted between groups, which was not specifically addressed, although an unclear ITT analysis plan was used |
| Selective reporting (reporting bias) | Low risk | Pre‐specified outcomes were reported and protocol is shown |
| Other bias | High risk | Non‐cannabis substance use and use of external drug treatments during the trial period were not assessed; no information was provided on previous cannabis use history, treatment fidelity, treatment completion rates; various aspects of demographics were not collected. No other bias was found |
| Methods | Randomised controlled trial. Intervention delivered at 3 community out‐patient drug treatment sites | |
| Participants | 450 responders to an advertisement for cannabis treatment or treatment referral who met criteria for cannabis use disorder were randomised Most participants were male (63.7%, 70.5% and 70.9% in Groups 1 to 3, respectively) and were in their mid‐thirties (average 35.4, 36.3 and 36.1 years of age). Most participants were white Caucasian (65.1%, 66.7%, 76.4%) and employed (82.2%, 83.4%, 83.8%), with approximately 14 years of education on average (14.0, 14.2, 14.4 years) Participants were near daily users (using on 86.9%, 87.6% and 89.9% of days in the past 90 days) and smoked approximately 3 joints per day on average (3.0, 2.8, 2.8). Participants reported an average of approximately 9 problems related to cannabis use on the MPS (10.2, 9.5, 9.1) and reported approximately 6 symptoms of cannabis dependence (5.7, 5.6, 5.6). History of cannabis use and experience with cannabis use treatments were not reported Participants were regular but unproblematic drinkers (consuming alcohol on an average of 59.4, 48.8 and 46.6 days in the past 90 days). Other substance use was not reported, although participants who met criteria for a substance use disorder were excluded | |
| Interventions | Group 1: 2‐session CBT/MET + minimal case management over 6 weeks (71.9% of participants completed treatment as intended; average 1.6 sessions attended; participants had the option of including a significant other in treatment, and 15% did so; average 6.5 sessions attended; n = 146) Group 2: 9‐session MET/CBT + case management of up to $ over 12 weeks (47% of participants completed treatment as intended; participants had the option of including a significant other in treatment and 29% did so; n = 156) Group 3: DTC (n = 148) Intervention goal focused on abstinence. Participants were reimbursed up to $125. Therapist training was intensive, and intervention fidelity was ensured by supervision and review of videotaped sessions | |
| Outcomes | Proportion of smoking days; proportion reporting point‐prevalence abstinence; joints per day; number of symptoms of dependence and abuse (SCID); dependence severity using ASI component scores; cannabis‐related problems (MPS); proportion reporting clinical improvement; mental health index (BDI, STAI‐S); alcohol using days | |
| Notes | Follow‐up was provided at 4, 9 and 15 months Rates of follow‐up at final assessment:
Differences between treatment sites were assessed and were found to be non‐significant. Study was funded by the Substance Abuse and Mental Health Services Administration. Study authors reported no declarations of interest | |
| Risk of bias | ||
| Bias | Authors' judgement | Support for judgement |
| Random sequence generation (selection bias) | Low risk | "Urn randomization program to balance key variables (i.e., age, gender, ethnicity, employment status, education, and marijuana problem severity, as measured by the MPS" |
| Allocation concealment (selection bias) | Low risk | Allocation was conducted centrally at each separate site; further information on how allocation was concealed was not provided |
| Blinding of participants and personnel (performance bias) | High risk | Participant and personnel blinding was not possible because of the type of intervention provided |
| Blinding of outcome assessment (detection bias) | High risk | "Research assistants were not blinded to the participant’s experimental condition" |
| Blinding of outcome assessment (detection bias) | Low risk | Collateral verification was collected to verify self report |
| Incomplete outcome data (attrition bias) | Low risk | No differences in follow‐up rates were found; these rates were moderate to high (Group 1: n = 120, 82.2%; Group 2: n = 129, 82.7%; Group 3: n = 137, 92.6%) |
| Selective reporting (reporting bias) | Low risk | Pre‐specified outcomes were reported and protocol is shown |
| Other bias | Unclear risk | Study authors did not assess other drug use, although it was unclear whether this would introduce bias, as dependence was used as an exclusion criterion (tobacco dependence was not part of this). Study authors did not assess previous history of cannabis use or treatment. Only half the sample from Group 2 completed treatment as intended. No other bias was found |
| Methods | Randomised controlled trial. Intervention delivered in a university‐based research unit | |
| Participants | 110 responders to an advertisement for cannabis treatment who reported using cannabis on ≥ 50 of the past 90 days were randomised Participant gender grouping was not reported. Participants were 32.5 years old on average, and most individuals in the total sample were white Caucasian (93%) and employed (85%); a minority had a college degree (42%) Participants were daily cannabis smokers (average 27.1 and 26.4 days over the past 28 days in Groups 1 and 2, respectively) who used on average approximately 3 joints per day (2.6, 2.9). Participants reported first using cannabis regularly at an average age of 20.0 years. Most had made a previous attempt to quit (92%), and 75% indicated that they had a current desire to quit at baseline. On average 11.1 cannabis‐related problems were reported on the DAST Less than half the total sample reported that they smoked tobacco over the previous 90 days (43%) or used another substance (22%); most reported that they had consumed alcohol (63%) | |
| Interventions | Group 1: 10‐session CBT (in groups of 12 to 15) over 12 weeks (n = 54) Group 2: 10‐session SS (in groups of 12 to 15) over 12 weeks (n = 56) Participants attended on average 7.5 sessions across groups Sessions lasted 120 minutes. Interventions focused on cannabis abstinence. Participants were reimbursed a deposit of $50 for participation. Therapist training was not reported, and intervention fidelity was assessed by a satisfaction questionnaire completed by participants and therapists | |
| Outcomes | Frequency of cannabis using days; proportion reporting point‐prevalence abstinence (self report and collateral estimates); joints per day; cannabis‐related problems (DAST); days of alcohol and tobacco consumption; proportion using other substances; proportion accessing other substance use treatment | |
| Notes | Follow‐up was provided at 1, 3, 6 and 12 months, although results are presented only for 1‐month follow‐up Rates of follow‐up at 1 month:
Study funding was not reported. Study authors reported no declarations of interest | |
| Risk of bias | ||
| Bias | Authors' judgement | Support for judgement |
| Random sequence generation (selection bias) | Unclear risk | Randomisation procedure was not explained, but study authors claim that it was effective, as they noted no differences between groups in key variables at baseline |
| Allocation concealment (selection bias) | Unclear risk | Allocation was done in a group orientation; assessment meetings and treatment were also provided in groups |
| Blinding of participants and personnel (performance bias) | High risk | Participant and personnel blinding was not possible because of the type of intervention provided |
| Blinding of outcome assessment (detection bias) | Unclear risk | Blinding of assessors was not described |
| Blinding of outcome assessment (detection bias) | Low risk | Urine was collected to verify self report |
| Incomplete outcome data (attrition bias) | Unclear risk | Follow‐up rates were high, and possible differences between groups were not specified (Group 1: n = 120, 83.3%; Group 2: n = 129, 92.6%). Data were often reported in the aggregate, presumably because of lack of differences between groups, although this was not clearly specified throughout |
| Selective reporting (reporting bias) | Low risk | Pre‐specified outcomes were reported and protocol is shown |
| Other bias | Low risk | Very high quality with no problems in the other sources of bias investigated |
| Methods | Randomised controlled trial. Intervention delivered at a hospital‐based research facility | |
| Participants | 332 female responders to a health survey who reported using cannabis more than 2 days in the past 3 months were randomised All participants were female and were typically in their early twenties (average 20.5 and 21.0 years of age in Groups 1 and 2, respectively). Most participants were white Caucasian (72.4%, 63.3%) with at least some post secondary education (68.1%, 71.6%) Participants reported that they used cannabis regularly approximately 4 years on average (3.8, 4.1) and had used cannabis every second day over the past 90 days (59% and 55% of days). Participants reported on average approximately 5 cannabis‐related problems on the MPS (4.8, 5.0). Just over one‐third were cannabis dependent (39.5%, 39.6%), and more than half had a desire to quit use (56.8%, 63.5%). Previous experience with cannabis treatment was not reported Non‐cannabis substance use was not reported, although participants were excluded if they met criteria for a substance use disorder | |
| Interventions | Group 1: 2‐session MET over 4 weeks (80.4% completed treatment as intended; average 1.7 sessions completed; n = 163). Sessions lasted 45 minutes Group 2: DTC (n = 169) The intervention goal was unclear, although 49% expressed a desire to "change" their cannabis use. Participants were reimbursed up to $140 for participation. Therapist training was based on the MITI, and intervention fidelity was checked by the MITI and bi‐weekly supervision | |
| Outcomes | Change in cannabis use frequency from baseline; cannabis‐related problems (MPS); proportion reporting a motivation to quit use | |
| Notes | Follow‐up was provided at 1, 3 and 6 months Rates of follow‐up at final assessment:
Study was funded by the National Institute on Drug Abuse. Study authors reported no declarations of interest | |
| Risk of bias | ||
| Bias | Authors' judgement | Support for judgement |
| Random sequence generation (selection bias) | Unclear risk | Randomisation process was not described |
| Allocation concealment (selection bias) | Low risk | Participants were centrally allocated, and allocation was done by phone |
| Blinding of participants and personnel (performance bias) | High risk | Participant and personnel blinding was not possible because of the type of intervention provided |
| Blinding of outcome assessment (detection bias) | Low risk | "Research staff performing the assessments [were] blinded" |
| Blinding of outcome assessment (detection bias) | Unclear risk | No urinalysis was used to verify self report |
| Incomplete outcome data (attrition bias) | Low risk | Follow‐up rates were moderate, but no differences in attrition were noted between groups (Group 1: n = 126, 77.3%; Group 2: n = 136, 80.5%) |
| Selective reporting (reporting bias) | Unclear risk | Results were reported only as odds ratios and were a little unclear. In addition, cannabis frequency and quantity information was not reported. Protocol is shown |
| Other bias | Low risk | Other substance use was not measured, although it was unclear whether this would introduce bias, as dependence was used as an exclusion criterion. Previous treatment experience and the possibility of accessing treatment during the trial were not assessed and may have introduced risk given the intervention was not intensive. No other bias was found |
| Methods | Randomised controlled trial. Intervention delivered in a university‐based research unit | |
| Participants | 212 responders to an advertisement for cannabis treatment who reported using cannabis on ≥ 50 of the past 90 days were randomised Most participants were male (75.9% of the total sample) with an average age of 31.9 years. Most were white Caucasian (95%) and employed (85%). A minority had completed some college education (40%) Participants reported first using cannabis regularly at an average age of 19.9 years and had used cannabis for an average of 15.4 years. At baseline, participants reported that they used cannabis almost daily (average 80.7 of the past 90 days) and smoked on average 2.7 joints. Participants reported previously accessing treatment on an average total of 7.0 occasions Participants reported consuming alcohol on average 2.3 days per week, and illicit drugs on 0.3 days. Participants reported an average score of 8.9 on the DAST | |
| Interventions | Group 1: 10‐session CBT over 12 weeks with 2 booster sessions at 3 and 6 months (delivered in groups of 12 to 15; n = 106) Group 2: 10‐session SS over 12 weeks with 2 booster sessions at 3 and 6 months (delivered in groups of 12 to 15; n = 106) Sessions lasted 120 minutes. Interventions focused on achieving abstinence. 69% of the total sample completed ≥ 7 sessions, and on average 7.6 sessions were completed. Participants were reimbursed a $50 deposit for participation. Details of therapist training were unclear, although each had previous professional experience. Intervention fidelity was assessed by a participant satisfaction survey, and each session was audiotaped and rated | |
| Outcomes | Cannabis using days (self report + urinalysis); point‐prevalence abstinence; alcohol using days; | |
| Notes | Follow‐up was provided at 1, 3, 6, 9 and 12 months Rates of follow‐up at final assessment:
Study was funded by the National Institute on Drug Abuse. Study authors reported no declarations of interest | |
| Risk of bias | ||
| Bias | Authors' judgement | Support for judgement |
| Random sequence generation (selection bias) | Unclear risk | Participants were blocked on sex and were randomly assigned to 1 of 2 treatment conditions, but the randomisation process was not reported |
| Allocation concealment (selection bias) | Unclear risk | Allocation concealment was not described |
| Blinding of participants and personnel (performance bias) | High risk | Participant and personnel blinding was not possible because o the type of intervention provided |
| Blinding of outcome assessment (detection bias) | Unclear risk | "Therapists were unaware of the specific content of the alternative treatment and hypotheses of the study", but it was unclear whether therapists were also outcome assessors |
| Blinding of outcome assessment (detection bias) | Low risk | Participant family/friends gave collateral reports to verify participant self report |
| Incomplete outcome data (attrition bias) | Unclear risk | "A significant interaction of follow‐up completion and treatment condition indicated that RP subjects who completed all follow‐ups used marijuana fewer times per day than did SSP subjects who completed all follow‐ups. This pattern was reversed for subjects who did not complete all follow‐ups and suggested differential attrition from the follow‐up sample as a function of treatment condition. Therefore, differential effects of treatment were tested using multivariate analyses of covariance (MANCOVAs) with pretreatment level of typical daily use as the covariate. Sex of subject was included as a between‐subjects variable to test for differential response to treatments" |
| Selective reporting (reporting bias) | Unclear risk | Pre‐specified outcomes were reported and protocol is shown |
| Other bias | Low risk | Therapist training was not mentioned but therapists were rated highly by participants and attendance was good. "Subjects included in the outcome analyses were significantly more likely to be female (27%) and married (48%) and to have completed a college degree (43%). They also reported fewer years of marijuana use and a lower DAST score". No such differences at baseline were noted. No other bias was found |
| Methods | Randomised controlled trial. Intervention delivered in a university‐based research unit | |
| Participants | 291 responders to an advertisement for cannabis treatment who reported using cannabis on ≥ 50 of the past 90 days were randomised Most participants were male (77% of the total sample) with an average age of 34.0 years. Most were white Caucasian (95%) and employed (76%). Participants reported on average 14.0 years of education Participants reported first using cannabis regularly at an average age of 19.6 years and had used cannabis for an average of 17.4 years. At baseline, participants reported using cannabis almost daily (average 74.6 of the past 90 days) and smoked on average 2.5 joints per day. Participants reported on average 9.9 problems on the Stephens Problem Scale and on average 6.7 symptoms of cannabis dependence. Participants reported accessing treatment on an average total of 3.9 previous occasions Participants reported consuming alcohol on an average of 18.1 days in the past 90 days, and using illicit drugs on 1.7 days | |
| Interventions | Group 1: 14‐session CBT group treatment over 18 weeks (delivered in groups of 8 to 12; 50% of participants attended ≥ 10 sessions; 39% had a loved one who attended sessions; an average of 8.4 sessions were attended; n = 117). Sessions lasted 120 minutes Group 2: 2‐session MET over 4 weeks (delivered with the option of attending with a loved one, and 86% did so; on average 1.9 sessions were attended; n = 88). Sessions lasted 90 minutes Group 3: DTC (n = 86) Interventions focused on achieving abstinence. Participants were reimbursed a $60 deposit for participation. Therapist training was manual based with role‐plays. Intervention fidelity was assessed by a participant satisfaction survey | |
| Outcomes | Cannabis using days; point‐prevalence abstinence rates; continuous abstinence rates (self report and urinalysis); joints per day; proportion attending external drug treatments; number of dependence symptoms; number of cannabis‐related problems; alcohol using days; illicit drug using days | |
| Notes | Follow‐up was provided at 1, 4, 7, 13 and 16 months Rates of follow‐up at final assessment:
Study was funded by the National Institute on Drug Abuse. Study authors reported no declarations of interest | |
| Risk of bias | ||
| Bias | Authors' judgement | Support for judgement |
| Random sequence generation (selection bias) | Unclear risk | "Sequential eligible participants were accumulated into pools of between 20 and 30 participants and then randomly assigned to the three conditions after blocking on gender" ‐ this randomisation process was not reported |
| Allocation concealment (selection bias) | Low risk | Participants were allocated during a centrally located orientation session |
| Blinding of participants and personnel (performance bias) | High risk | Participant and personnel blinding was not possible because of the type of intervention provided |
| Blinding of outcome assessment (detection bias) | Unclear risk | Blindness of researchers was not described. Study authors used self report questionnaires to assess primary outcomes; these were mailed to an unknown number of participants and collaterals |
| Blinding of outcome assessment (detection bias) | Low risk | Urine was collected during the trial to verify self report |
| Incomplete outcome data (attrition bias) | Low risk | Follow‐up rates were moderate, but no differences were noted between groups in rates of attrition or in key variables at baseline (Group 1: n = 103, 88.0%; Group 2: n = 80, 90.9%; Group 3: n = 79, 91.9%) |
| Selective reporting (reporting bias) | Low risk | Pre‐specified outcomes were reported and protocol is shown |
| Other bias | Low risk | Use of alcohol and other substances was measured only at baseline, although heavy use was among the exclusion criteria. No other sources of bias were found |
| Methods | Randomised controlled trial. Intervention was delivered in a university‐based research unit | |
| Participants | 188 responders to an advertisement for a "cannabis check‐up" who reported using cannabis on ≥ 15 of the past 30 days Most participants were male (77.4%, 69.4% and 76.6% in Groups 1 to 3, respectively) and were in their early thirties (average 31.5, 32.5, and 31.5 years of age) Most participants were white Caucasian (87.1%, 87.1%, 87.5%) and employed (80.3%, 62.3%, 31.0%) Participants reported first using cannabis regularly at an average age of 18 years (18.9, 17.7, 18.6). At baseline, participants reported using cannabis almost daily (average 74.8, 74.8 and 76.8 of the past 90 days) and smoked on average 3 joints (3.3, 3.1, 3.3). Participants reported on average 6 problems (6.4, 5.3, 6.3) on the Stephens Problem Scale and on average 3 symptoms of cannabis dependence (3.9, 3.3, 3.2). Most participants reported that they were in pre‐contemplation or contemplation stages of quitting use (68%, 87%, 70%) Participants consumed approximately 2 alcoholic drinks per day (2.2, 2.0, 2.5) and used less than 1 illicit drug day per week (0.2, 0.1, 0.1) | |
| Interventions | Group 1: 1 session of MET (88.7% of participants attended the session; n = 62) Group 2: 1 session of drug‐related health education (93.5% of participants attended the session; n = 62) Group 3: DTC (n = 64) Sessions lasted 120 minutes. No specific cannabis‐related goal was reported, and reduction or abstinence was encouraged. Participants were reimbursed up to $150 for participation. Therapist training was intensive, and intervention fidelity was ensured through supervision and review of recorded sessions by independent assessors | |
| Outcomes | Days of cannabis use (self reported and urinalysis); joints per day; periods during which cannabis was smoked in the day; number of symptoms of dependence; number of cannabis‐related problems (Stephens Problem Scale); number of alcohol‐related problems; other substance using days; proportion using external drug treatments | |
| Notes | Follow‐up at 7 weeks, then at 6 and 12 months Rates of follow‐up at final assessment:
Analysis included motivation to quit as a mediator of outcomes, although this was not found to impact on treatment effects Study was funded by the National Institute on Drug Abuse. Study authors reported no declarations of interest | |
| Risk of bias | ||
| Bias | Authors' judgement | Support for judgement |
| Random sequence generation (selection bias) | Low risk | "Assigned using an urn randomization program… to balance key variables (i.e. sex; ethnicity; white versus non‐white; stage of change: precontemplation/contemplation versus preparation)" |
| Allocation concealment (selection bias) | Low risk | Participants were centrally allocated, although the process was unclear |
| Blinding of participants and personnel (performance bias) | High risk | Participant and personnel blinding was not possible because of the type of intervention provided |
| Blinding of outcome assessment (detection bias) | Low risk | "The research staff was trained carefully and monitored routinely in the standardized administration of all measures but was aware of assigned condition" |
| Blinding of outcome assessment (detection bias) | Low risk | Urine was collected during the trial period to verify self report |
| Incomplete outcome data (attrition bias) | Low risk | "Rates of attrition from follow‐ups were low and did not differ significantly by condition" Rates at final assessment:
|
| Selective reporting (reporting bias) | Low risk | Pre‐specified outcomes were reported and protocol is shown |
| Other bias | Low risk | Previous cannabis treatments were not assessed (although treatments during the trial period were assessed and concurrent treatment was excluded). The proportion reporting a motivation to change was significantly different between groups at baseline but was included as a co‐variate in analysis. At follow‐up, participants in Group 2 who did not attend follow‐up at 6 and 12 months reported fewer marijuana‐related problems at baseline than those who did attend. Participants in Group 3 who did not attend 7‐week follow‐up reported more baseline marijuana dependence symptoms compared with those who did attend, and participants in Group 1 who did not attend the 12‐month follow‐up reported fewer baseline marijuana dependence symptoms than those who did attend. "Therefore, the baseline measures of marijuana ‐ problems and dependence symptoms ‐ were also included as covariates in all analyses, and multiple approaches to handling missing data were used to assess the robustness of findings". No other bias was found |
ASI: Addiction Severity Index
AUDIT: Alcohol Use Disorders Identification Test
BDI: Beck Depression Inventory
BDI‐SF: Beck Depression Inventory, Short Form
BIS: Birchwood Insight Scale
BPRS: Brief Psychiatric Rating Scale
BSI: Brief Symptom Inventory
CBT: Cognitive‐behavioural therapy
CDSS: Calgary Depression Scale for Schizophrenia
CM: Contingency management
CPQ: Cannabis Problems Questionnaire
CUPIT: Cannabis Use Problems Identification Test
DAI: Drug Attitude Inventory
DAST: Drug Abuse Screening Test
DC: Drug counselling
DSM‐III‐R: Diagnostical and Statistical Manual of Mental Disorders (3rd edition Revised)
DSM‐IV: Diagnostical and Statistical Manual of Mental Disorders (4th edition)
DTC: Delayed treatment control
GAF: Global Assessment of Functioning Scale
ITT: Intention to Treat
KAPQ: Knowledge About Psychosis Questionnaire
MET: Motivational enhancement therapy
MPS: Marijuana Problem Scale
RMPI: Rutger’s Marijuana Problem Index
SANS: Scale for the Assessment of Negative Symptoms
SAPS: Scale for the Assessment of Positive Symptoms
SCID: Structured Clinical Interview for Diagnostic and Statistical Manual of Mental Disorders
SCL‐90‐R: Symptom Check List 90 Revised
SCQ: Social Communication Questionnaire
SDS: Severity of Dependence Scale
SOFAS: Social and Occupational Functioning Assessment Scale
SPS: Stephens Problem Scale
URICA: University of Rhode Island Change Assessment Scale
WHOQOL: World Health Organization Quality of Life assessment
Characteristics of excluded studies [ordered by study ID]
Ir a:
| Study | Reason for exclusion |
| Most of the sample reported using other illicit substances or alcohol near daily or reported another substance use disorder | |
| Most of the sample did not report experiencing cannabis use disorder or at least near daily use | |
| Most included participants were 17 years of age or younger. Also, the study was narrative only or did not meet any inclusion criteria and was largely irrelevant | |
| Most of the sample did not report experiencing cannabis use disorder or at least near daily use | |
| Published as an abstract only with no full text available and thus was mostly narrative and largely irrelevant | |
| Most included participants were 17 years of age or younger. Also, the study was narrative only or did not meet any inclusion criteria and was largely irrelevant | |
| Most of the sample did not report experiencing cannabis use disorder or at least near daily use | |
| Study did not include a comparison between treatment and control groups | |
| Most of the sample did not report experiencing cannabis use disorder or at least near daily use | |
| Most of the sample did not report experiencing cannabis use disorder or at least near daily use | |
| Most included participants were 17 years of age or younger, and the study did not include a comparison between treatment and control groups | |
| Study did not include a comparison between treatment and control groups | |
| Most included participants were 17 years of age or younger | |
| Most of the sample reported using other illicit substances or alcohol near daily or reported another substance use disorder | |
| Most of the sample reported using other illicit substances or alcohol near daily or reported another substance use disorder | |
| Intervention could not be delivered in an out‐patient setting | |
| Published as an abstract only with no full text available and thus was mostly narrative and largely irrelevant | |
| Study was narrative only and explored treatment outcomes of individuals in legal settings who were co‐erced or voluntarily accessed various treatments | |
| Published as an abstract only with no full text available and thus was mostly narrative and largely irrelevant | |
| Published as an abstract only with no full text available and thus was mostly narrative and largely irrelevant | |
| Most of the sample did not report experiencing cannabis use disorder or at least near daily use | |
| Most included participants were 17 years of age or younger | |
| Intervention could not be delivered in an out‐patient setting. | |
| Secondary analysis of audio recordings from a separate motivational interviewing study | |
| Published as an abstract only with no full text available and thus was mostly narrative and largely irrelevant | |
| Published as an abstract only with no full text available and thus was mostly narrative and largely irrelevant | |
| Preliminary results of an intervention with most included participants 17 years of age or younger | |
| Chiefly descriptive of participant experiences related to an intervention designed for cannabis using adolescents (17 years of age or younger) | |
| Most of the sample did not report experiencing cannabis use disorder or at least near daily use | |
| Most included participants were 17 years of age or younger | |
| Most included participants were 17 years of age or younger | |
| Most of the sample reported using other illicit substances or alcohol near daily or reported another substance use disorder | |
| Most included participants were 17 years of age or younger, and the study did not include a comparison between treatment and control groups | |
| Most of the sample reported using other illicit substances or alcohol near daily or reported another substance use disorder | |
| Most of the sample did not report experiencing cannabis use disorder or at least near daily use | |
| Study did not include a comparison between treatment and control groups | |
| Most participants were 17 years of age or younger | |
| Most included participants were 17 years of age or younger | |
| Most of the sample reported using other illicit substances or alcohol near daily or reported another substance use disorder | |
| Most of the sample reported using other illicit substances or alcohol near daily or reported another substance use disorder | |
| Study did not include a comparison between treatment and control groups | |
| Study was narrative only and detailed the protocol of the CapOpus cannabis treatment trial (Fohlmann 2008) | |
| Study presented preliminary results only | |
| Published as an abstract only with no full text available and thus was mostly narrative and largely irrelevant | |
| Most of the sample reported using other illicit substances or alcohol near daily or reported another substance use disorder | |
| Published as an abstract only with no full text available and thus was mostly narrative and largely irrelevant | |
| Most included participants were 17 years of age or younger | |
| Study was narrative only and detailed the protocol of an intervention designed for adolescent participants (17 years of age or younger) | |
| Study did not include a comparison between treatment and control groups | |
| Published as an abstract only with no full text available and thus was mostly narrative and largely irrelevant | |
| Most of the sample did not report experiencing cannabis use disorder or at least near daily use | |
| Most of the sample reported using other illicit substances or alcohol near daily or reported another substance use disorder | |
| Study described the protocol for the CANABIC treatment trial | |
| Intervention could not be delivered in an out‐patient setting | |
| Intervention could not be delivered in an out‐patient setting | |
| Published as an abstract only with no full text available and thus was mostly narrative and largely irrelevant | |
| Study was narrative only and evaluated a measure of coping in treatment for cannabis dependence | |
| Study did not include a comparison between treatment and control groups | |
| Most included participants were 17 years of age or younger | |
| Most included participants were 17 years of age or younger | |
| Most participants were not 18 years of age or older, and most of the sample did not report experiencing cannabis use disorder or at least near daily use | |
| Most included participants were 17 years of age or younger | |
| Most of the sample reported using other illicit substances or alcohol near daily or reported another substance use disorder | |
| Published as an abstract only with no full text available and thus was mostly narrative and largely irrelevant | |
| Study did not include a comparison between treatment and control groups | |
| Study was narrative and described separate substance use treatment for patients with schizophrenia | |
| Most of the sample did not report experiencing cannabis use disorder or at least near daily use | |
| Most of the sample did not report experiencing cannabis use disorder or at least near daily use | |
| Published as an abstract only with no full text available and thus was mostly narrative and largely irrelevant | |
| Most of the sample did not report experiencing cannabis use disorder or at least near daily use | |
| Intervention could not be delivered in an out‐patient setting | |
| Article was descriptive only and focused on how motivational interviewing can assist in treating adolescents with addictive behaviour | |
| Protocol and description of the INCANT intervention for substance using adolescents (17 years of age or younger) | |
| Study was narrative only and detailed the protocol of the INCANT intervention designed for adolescent participants (17 years of age or younger) | |
| Most of the sample reported using other illicit substances or alcohol near daily or reported another substance use disorder | |
| Study was narrative only or did not meet any inclusion criteria and was largely irrelevant | |
| Most included participants were 17 years of age or younger | |
| Most included participants were 17 years of age or younger | |
| Study was a review article on cannabis treatments | |
| Intervention could not be delivered in an out‐patient setting | |
| Article is chiefly narrative and describes the processes of motivational interviewing | |
| Intervention could not be delivered in an out‐patient setting | |
| Most of the sample reported using other illicit substances or alcohol near daily or reported another substance use disorder | |
| Participants had serious mental illness, and most of the sample reported using other illicit substances or alcohol near daily or reported another substance use disorder | |
| Published as an abstract only with no full text available and thus was mostly narrative and largely irrelevant | |
| Most of the sample reported using other illicit substances or alcohol near daily or reported another substance use disorder | |
| Published as an abstract only with no full text available and thus was mostly narrative and largely irrelevant | |
| Study did not include a comparison between treatment and control groups | |
| Most included participants were 17 years of age or younger | |
| Most included participants were 17 years of age or younger | |
| Study w(as primarily narrative and included a discussion of the included trial (MTPRG 2004) | |
| Study investigated the predictive effect of practitioner ratings and other intervention characteristics on cessation of cannabis smoking. Excluded on the grounds that it was largely irrelevant, as no suitable outcome data were provided | |
| Published as an abstract only with no full text available and thus was mostly narrative and largely irrelevant | |
| Most included participants were 17 years of age or younger | |
| Most included participants were 17 years of age or younger | |
| Published as an abstract only with no full text available and thus was mostly narrative and largely irrelevant | |
| Most of the sample reported using other illicit substances or alcohol near daily or reported another substance use disorder | |
| Study investigated the impact of therapist variables on treatment outcomes related to an intervention, with most included participants 17 years of age or younger | |
| Most of the sample did not report experiencing cannabis use disorder or at least near daily use | |
| Most included participants were 17 years of age or younger | |
| Published as an abstract only with no full text available and thus was mostly narrative and largely irrelevant | |
| Most of the sample did not report experiencing cannabis use disorder or at least near daily use |
Data and analyses
| Outcome or subgroup title | No. of studies | No. of participants | Statistical method | Effect size |
| 1 Reductions in cannabis use frequency at short‐term follow‐up Show forest plot | 6 | 1144 | Mean Difference (IV, Random, 95% CI) | 5.67 [3.08, 8.26] |
| Analysis 1.1  Comparison 1 Intervention versus inactive control, Outcome 1 Reductions in cannabis use frequency at short‐term follow‐up. | ||||
| 2 Reduction in cannabis use frequency at short‐term follow‐up (intervention intensity) Show forest plot | 6 | 1144 | Mean Difference (IV, Random, 95% CI) | 6.39 [4.01, 8.78] |
| Analysis 1.2  Comparison 1 Intervention versus inactive control, Outcome 2 Reduction in cannabis use frequency at short‐term follow‐up (intervention intensity). | ||||
| 2.1 Low‐intensity intervention | 6 | 763 | Mean Difference (IV, Random, 95% CI) | 4.58 [2.65, 6.50] |
| 2.2 High‐intensity intervention | 3 | 381 | Mean Difference (IV, Random, 95% CI) | 10.02 [7.69, 12.34] |
| 3 Reduction in cannabis use frequency at short‐term follow‐up (intervention type) Show forest plot | 6 | 1144 | Mean Difference (IV, Random, 95% CI) | 6.34 [3.80, 8.88] |
| Analysis 1.3  Comparison 1 Intervention versus inactive control, Outcome 3 Reduction in cannabis use frequency at short‐term follow‐up (intervention type). | ||||
| 3.1 MET | 4 | 612 | Mean Difference (IV, Random, 95% CI) | 4.45 [1.90, 7.00] |
| 3.2 CBT | 1 | 134 | Mean Difference (IV, Random, 95% CI) | 10.94 [7.44, 14.44] |
| 3.3 MET + CBT | 3 | 398 | Mean Difference (IV, Random, 95% CI) | 7.38 [3.18, 11.57] |
| 4 Point‐prevalence abstinence at short‐term follow‐up Show forest plot | 6 | 1166 | Risk Ratio (M‐H, Random, 95% CI) | 2.55 [1.34, 4.83] |
| Analysis 1.4  Comparison 1 Intervention versus inactive control, Outcome 4 Point‐prevalence abstinence at short‐term follow‐up. | ||||
| 5 Point‐prevalence abstinence at short‐term follow‐up (intervention intensity) Show forest plot | 6 | 1166 | Risk Ratio (M‐H, Random, 95% CI) | 1.96 [1.20, 3.21] |
| Analysis 1.5  Comparison 1 Intervention versus inactive control, Outcome 5 Point‐prevalence abstinence at short‐term follow‐up (intervention intensity). | ||||
| 5.1 Low‐intensity intervention | 4 | 435 | Risk Ratio (M‐H, Random, 95% CI) | 0.92 [0.51, 1.66] |
| 5.2 High‐intensity intervention | 5 | 731 | Risk Ratio (M‐H, Random, 95% CI) | 3.09 [2.23, 4.29] |
| 6 Point‐prevalence abstinence at short‐term follow‐up (intervention type) Show forest plot | 6 | 1166 | Risk Ratio (M‐H, Random, 95% CI) | 2.17 [1.24, 3.80] |
| Analysis 1.6  Comparison 1 Intervention versus inactive control, Outcome 6 Point‐prevalence abstinence at short‐term follow‐up (intervention type). | ||||
| 6.1 MET | 1 | 197 | Risk Ratio (M‐H, Random, 95% CI) | 1.19 [0.43, 3.28] |
| 6.2 CBT | 1 | 171 | Risk Ratio (M‐H, Random, 95% CI) | 4.81 [1.17, 19.70] |
| 6.3 MET + CBT | 5 | 798 | Risk Ratio (M‐H, Random, 95% CI) | 2.17 [1.10, 4.32] |
| 7 Reduction in joints per day at short‐term follow‐up Show forest plot | 8 | 1600 | Std. Mean Difference (IV, Random, 95% CI) | 3.55 [2.51, 4.59] |
| Analysis 1.7  Comparison 1 Intervention versus inactive control, Outcome 7 Reduction in joints per day at short‐term follow‐up. | ||||
| 8 Reduction in joints per day at short‐term follow‐up (intervention intensity) Show forest plot | 8 | 1600 | Std. Mean Difference (IV, Random, 95% CI) | 3.71 [2.71, 4.71] |
| Analysis 1.8  Comparison 1 Intervention versus inactive control, Outcome 8 Reduction in joints per day at short‐term follow‐up (intervention intensity). | ||||
| 8.1 Low‐intensity intervention | 6 | 752 | Std. Mean Difference (IV, Random, 95% CI) | 2.70 [1.69, 3.70] |
| 8.2 High‐intensity intervention | 6 | 848 | Std. Mean Difference (IV, Random, 95% CI) | 4.74 [3.49, 6.00] |
| 9 Reduction in joints per day at short‐term follow‐up (intervention type) Show forest plot | 8 | 1600 | Std. Mean Difference (IV, Random, 95% CI) | 3.90 [2.82, 4.98] |
| Analysis 1.9  Comparison 1 Intervention versus inactive control, Outcome 9 Reduction in joints per day at short‐term follow‐up (intervention type). | ||||
| 9.1 MET | 4 | 611 | Std. Mean Difference (IV, Random, 95% CI) | 3.17 [2.67, 3.66] |
| 9.2 CBT | 2 | 306 | Std. Mean Difference (IV, Random, 95% CI) | 3.40 [‐1.05, 7.84] |
| 9.3 MET + CBT | 4 | 683 | Std. Mean Difference (IV, Random, 95% CI) | 4.88 [3.14, 6.62] |
| 10 Reduction in symptoms of dependence at short‐term follow‐up Show forest plot | 4 | 889 | Std. Mean Difference (IV, Random, 95% CI) | 4.15 [1.67, 6.63] |
| Analysis 1.10  Comparison 1 Intervention versus inactive control, Outcome 10 Reduction in symptoms of dependence at short‐term follow‐up. | ||||
| 11 Reduction in symptoms of dependence at short‐term follow‐up (intervention intensity) Show forest plot | 4 | 889 | Std. Mean Difference (IV, Random, 95% CI) | 5.56 [2.73, 8.39] |
| Analysis 1.11  Comparison 1 Intervention versus inactive control, Outcome 11 Reduction in symptoms of dependence at short‐term follow‐up (intervention intensity). | ||||
| 11.1 Low‐intensity intervention | 3 | 370 | Std. Mean Difference (IV, Random, 95% CI) | 2.83 [0.41, 5.24] |
| 11.2 High‐intensity intervention | 3 | 519 | Std. Mean Difference (IV, Random, 95% CI) | 8.37 [2.51, 14.23] |
| 12 Symptoms of dependence at short‐term follow‐up (intervention type) Show forest plot | 4 | 889 | Std. Mean Difference (IV, Random, 95% CI) | 6.32 [3.15, 9.50] |
| Analysis 1.12  Comparison 1 Intervention versus inactive control, Outcome 12 Symptoms of dependence at short‐term follow‐up (intervention type). | ||||
| 12.1 MET | 2 | 316 | Std. Mean Difference (IV, Random, 95% CI) | 4.07 [1.97, 6.17] |
| 12.2 MET + CBT | 3 | 573 | Std. Mean Difference (IV, Random, 95% CI) | 7.89 [0.93, 14.85] |
| 13 Reduction in cannabis‐related problems at short‐term follow‐up Show forest plot | 6 | 2202 | Std. Mean Difference (IV, Random, 95% CI) | 3.34 [1.26, 5.42] |
| Analysis 1.13  Comparison 1 Intervention versus inactive control, Outcome 13 Reduction in cannabis‐related problems at short‐term follow‐up. | ||||
| 14 Reduction in cannabis‐related problems at short‐term follow‐up (intervention intensity) Show forest plot | 6 | 2202 | Std. Mean Difference (IV, Random, 95% CI) | 3.70 [1.91, 5.49] |
| Analysis 1.14  Comparison 1 Intervention versus inactive control, Outcome 14 Reduction in cannabis‐related problems at short‐term follow‐up (intervention intensity). | ||||
| 14.1 Low‐intensity intervention | 5 | 667 | Std. Mean Difference (IV, Random, 95% CI) | 2.50 [1.01, 3.98] |
| 14.2 High‐intensity intervention | 4 | 1535 | Std. Mean Difference (IV, Random, 95% CI) | 5.14 [2.57, 7.70] |
| 15 Reduction in cannabis‐related problems at short‐term follow‐up (intervention type) Show forest plot | 6 | 2202 | Std. Mean Difference (IV, Random, 95% CI) | 4.11 [2.22, 6.01] |
| Analysis 1.15  Comparison 1 Intervention versus inactive control, Outcome 15 Reduction in cannabis‐related problems at short‐term follow‐up (intervention type). | ||||
| 15.1 MET | 4 | 612 | Std. Mean Difference (IV, Random, 95% CI) | 3.29 [1.85, 4.72] |
| 15.2 CBT | 1 | 135 | Std. Mean Difference (IV, Random, 95% CI) | 7.88 [6.86, 8.90] |
| 15.3 MET + CBT | 3 | 1455 | Std. Mean Difference (IV, Random, 95% CI) | 3.85 [‐0.39, 8.10] |
| Outcome or subgroup title | No. of studies | No. of participants | Statistical method | Effect size |
| 1 Reduction in cannabis use frequency Show forest plot | 2 | 97 | Mean Difference (IV, Random, 95% CI) | 0.13 [‐2.00, 2.27] |
| Analysis 2.1  Comparison 2 Intervention versus treatment as usual control, Outcome 1 Reduction in cannabis use frequency. | ||||
| 2 Reduction in severity of cannabis use disorder Show forest plot | 1 | 33 | Mean Difference (IV, Random, 95% CI) | 0.10 [‐0.82, 1.02] |
| Analysis 2.2  Comparison 2 Intervention versus treatment as usual control, Outcome 2 Reduction in severity of cannabis use disorder. | ||||
| Outcome or subgroup title | No. of studies | No. of participants | Statistical method | Effect size |
| 1 Reduction in cannabis use frequency Show forest plot | 6 | Mean Difference (IV, Random, 95% CI) | Subtotals only | |
| Analysis 3.1  Comparison 3 Intervention A versus Intervention B, Outcome 1 Reduction in cannabis use frequency. | ||||
| 1.1 RP vs SS | 1 | 97 | Mean Difference (IV, Random, 95% CI) | 5.55 [1.89, 9.21] |
| 1.2 MET vs DC | 1 | 112 | Mean Difference (IV, Random, 95% CI) | 3.99 [0.89, 7.08] |
| 1.3 MET vs CBT | 1 | 179 | Mean Difference (IV, Random, 95% CI) | ‐0.86 [‐3.86, 2.14] |
| 1.4 MET vs MET + CBT | 1 | 31 | Mean Difference (IV, Random, 95% CI) | ‐2.80 [‐9.94, 4.34] |
| 1.5 MET vs MET + CBT + CM‐abs (EoT) | 1 | 30 | Mean Difference (IV, Random, 95% CI) | ‐7.30 [‐13.68, ‐0.92] |
| 1.6 MET vs MET + CBT + CM‐abs | 1 | 266 | Mean Difference (IV, Random, 95% CI) | ‐4.96 [‐7.18, ‐2.74] |
| 1.7 CBT + CM‐abs vs CM‐abs | 1 | 43 | Mean Difference (IV, Random, 95% CI) | 4.9 [‐1.95, 11.75] |
| 1.8 CBT + CM‐adh vs CM‐abs | 1 | 46 | Mean Difference (IV, Random, 95% CI) | ‐0.70 [‐7.61, 6.21] |
| 1.9 CBT + CM‐abs vs CBT + CM‐adh | 1 | 45 | Mean Difference (IV, Random, 95% CI) | 5.60 [‐1.65, 12.85] |
| 2 Point‐prevalence abstinence Show forest plot | 8 | Odds Ratio (M‐H, Fixed, 95% CI) | Subtotals only | |
| Analysis 3.2  Comparison 3 Intervention A versus Intervention B, Outcome 2 Point‐prevalence abstinence. | ||||
| 2.1 MET vs MET + CBT | 2 | 301 | Odds Ratio (M‐H, Fixed, 95% CI) | 3.59 [1.80, 7.20] |
| 2.2 MET + CBT vs MET + CBT + CM‐abs + CM‐adh | 1 | 43 | Odds Ratio (M‐H, Fixed, 95% CI) | 0.72 [0.21, 2.50] |
| 2.3 MET + CBT vs DC | 1 | 156 | Odds Ratio (M‐H, Fixed, 95% CI) | 1.38 [0.44, 4.38] |
| 2.4 DC vs DC + CM‐abs + CM‐adh | 1 | 41 | Odds Ratio (M‐H, Fixed, 95% CI) | 0.42 [0.10, 1.81] |
| 2.5 MET + CBT + CM‐abs + CM‐adh vs DC + CM‐abs + CM‐adh | 1 | 40 | Odds Ratio (M‐H, Fixed, 95% CI) | 1.38 [0.38, 5.07] |
| 2.6 MET + CBT vs DC + CM‐abs + CM‐adh | 1 | 39 | Odds Ratio (M‐H, Fixed, 95% CI) | 1.0 [0.26, 3.80] |
| 2.7 MET vs CBT | 1 | 170 | Odds Ratio (M‐H, Fixed, 95% CI) | 0.80 [0.43, 1.47] |
| 2.8 RP vs SS | 1 | 167 | Odds Ratio (M‐H, Fixed, 95% CI) | 1.06 [0.54, 2.08] |
| 2.9 MET + CBT (low intensity) vs MET + CBT (high intensity) | 1 | 64 | Odds Ratio (M‐H, Fixed, 95% CI) | 0.35 [0.03, 4.04] |
| 2.10 CBT + CM‐abs vs CBT + CM‐adh | 1 | 45 | Odds Ratio (M‐H, Fixed, 95% CI) | 1.85 [0.52, 6.62] |
| 2.11 CBT + CM‐abs vs CM‐abs | 1 | 43 | Odds Ratio (M‐H, Fixed, 95% CI) | 2.77 [0.69, 11.19] |
| 2.12 CBT + CM‐adh vs CM‐abs | 1 | 46 | Odds Ratio (M‐H, Fixed, 95% CI) | 1.5 [0.36, 6.23] |
| 2.13 CBT (low intensity) vs CBT (high intensity) | 1 | 119 | Odds Ratio (M‐H, Fixed, 95% CI) | 0.75 [0.30, 1.90] |
| 3 Reduction in joints used per day Show forest plot | 7 | Std. Mean Difference (IV, Random, 95% CI) | Subtotals only | |
| Analysis 3.3  Comparison 3 Intervention A versus Intervention B, Outcome 3 Reduction in joints used per day. | ||||
| 3.1 MET vs CBT | 1 | 183 | Std. Mean Difference (IV, Random, 95% CI) | ‐1.63 [‐1.97, ‐1.29] |
| 3.2 MET vs MET + CBT + CM‐abs | 1 | 266 | Std. Mean Difference (IV, Random, 95% CI) | 0.22 [‐0.02, 0.46] |
| 3.3 MET vs DC | 1 | 101 | Std. Mean Difference (IV, Random, 95% CI) | 1.81 [1.35, 2.28] |
| 3.4 CBT (low intensity) vs CBT (high intensity) | 1 | 119 | Std. Mean Difference (IV, Random, 95% CI) | ‐3.15 [‐3.69, ‐2.61] |
| 3.5 RP vs SS | 1 | 97 | Std. Mean Difference (IV, Random, 95% CI) | ‐1.22 [‐1.66, ‐0.79] |
| 3.6 MET + CBT (low intensity) vs MET + CBT (high intensity) | 1 | 64 | Std. Mean Difference (IV, Random, 95% CI) | ‐0.08 [‐0.58, 0.41] |
| 3.7 CBT + CM‐adh vs CBT + CM‐abs | 1 | 52 | Std. Mean Difference (IV, Random, 95% CI) | 2.45 [1.72, 3.18] |
| 3.8 CBT + CM‐abs vs CM‐abs | 1 | 50 | Std. Mean Difference (IV, Random, 95% CI) | ‐0.03 [‐0.59, 0.52] |
| 3.9 CBT + CM‐adh vs CM‐abs | 1 | 50 | Std. Mean Difference (IV, Random, 95% CI) | 2.37 [1.63, 3.10] |
| 4 Reduction in symptoms of dependence Show forest plot | 5 | Std. Mean Difference (IV, Random, 95% CI) | Subtotals only | |
| Analysis 3.4  Comparison 3 Intervention A versus Intervention B, Outcome 4 Reduction in symptoms of dependence. | ||||
| 4.1 MET vs Drug education control | 1 | 101 | Std. Mean Difference (IV, Random, 95% CI) | 4.32 [3.60, 5.04] |
| 4.2 MET vs MET + CBT | 1 | 266 | Std. Mean Difference (IV, Random, 95% CI) | ‐1.78 [‐2.07, ‐1.50] |
| 4.3 MET vs CBT | 1 | 183 | Std. Mean Difference (IV, Random, 95% CI) | 0.06 [‐0.23, 0.36] |
| 4.4 MET + CBT (high intensity) vs MET + CBT (low intensity) | 1 | 64 | Std. Mean Difference (IV, Random, 95% CI) | 4.96 [3.95, 5.98] |
| 4.5 CBT (low intensity) vs CBT (high intensity) | 1 | 119 | Std. Mean Difference (IV, Random, 95% CI) | ‐2.66 [‐3.16, ‐2.16] |
| 5 Reduction in cannabis‐related problems Show forest plot | 4 | Mean Difference (IV, Random, 95% CI) | Subtotals only | |
| Analysis 3.5  Comparison 3 Intervention A versus Intervention B, Outcome 5 Reduction in cannabis‐related problems. | ||||
| 5.1 MET vs MET + CBT | 2 | 292 | Mean Difference (IV, Random, 95% CI) | ‐0.34 [‐0.47, ‐0.22] |
| 5.2 MET vs MET + CBT + CM‐abs | 1 | 30 | Mean Difference (IV, Random, 95% CI) | 0.04 [‐0.22, 0.30] |
| 5.3 RP vs SS | 1 | 156 | Mean Difference (IV, Random, 95% CI) | ‐0.25 [‐0.29, ‐0.21] |
| 5.4 CBT (low intensity) vs CBT (high intensity) | 1 | 119 | Mean Difference (IV, Random, 95% CI) | ‐0.40 [‐0.46, ‐0.35] |
| 6 Treatment completion Show forest plot | 5 | Risk Ratio (M‐H, Random, 95% CI) | Subtotals only | |
| Analysis 3.6  Comparison 3 Intervention A versus Intervention B, Outcome 6 Treatment completion. | ||||
| 6.1 MET vs MET + CBT (high intensity) | 1 | 302 | Risk Ratio (M‐H, Random, 95% CI) | 1.54 [1.26, 1.87] |
| 6.2 MET + CBT (low intensity) vs MET + CBT (high intensity) | 1 | 108 | Risk Ratio (M‐H, Random, 95% CI) | 1.27 [1.02, 1.58] |
| 6.3 CBT (low intensity) vs CBT (high intensity) | 1 | 160 | Risk Ratio (M‐H, Random, 95% CI) | 1.76 [1.39, 2.22] |
| 6.4 MET + CBT vs MET + CBT + CM‐abs + CM‐adh | 1 | 69 | Risk Ratio (M‐H, Random, 95% CI) | 0.96 [0.69, 1.32] |
| 6.5 DC vs DC + CM‐adh + CM‐abs | 1 | 67 | Risk Ratio (M‐H, Random, 95% CI) | 0.61 [0.37, 0.99] |
| 6.6 MET + CBT vs DC | 1 | 69 | Risk Ratio (M‐H, Random, 95% CI) | 1.69 [1.04, 2.74] |
| 6.7 MET + CBT vs DC + CM‐adh + CM‐abs | 1 | 70 | Risk Ratio (M‐H, Random, 95% CI) | 1.03 [0.73, 1.45] |
| 6.8 MET + CBT + CM‐abs + CM‐adh vs DC | 1 | 66 | Risk Ratio (M‐H, Random, 95% CI) | 1.77 [1.10, 2.86] |
| 6.9 MET + CBT + CM‐adh + CM‐abs vs DC + CM‐adh + CM‐abs | 1 | 67 | Risk Ratio (M‐H, Random, 95% CI) | 1.08 [0.77, 1.51] |
| 6.10 CBT vs CBT + CM‐abs | 1 | 68 | Risk Ratio (M‐H, Random, 95% CI) | 1.13 [0.70, 1.82] |
| 6.11 CBT vs CBT + CM‐adh | 1 | 68 | Risk Ratio (M‐H, Random, 95% CI) | 0.89 [0.58, 1.35] |
| 6.12 CBT + CM‐abs vs CBT + CM‐adh | 1 | 64 | Risk Ratio (M‐H, Random, 95% CI) | 0.79 [0.49, 1.26] |
| 6.13 CBT vs CM‐abs | 1 | 63 | Risk Ratio (M‐H, Random, 95% CI) | 0.89 [0.57, 1.38] |
| 6.14 CBT + CM‐abs vs CM‐abs | 1 | 59 | Risk Ratio (M‐H, Random, 95% CI) | 0.79 [0.49, 1.28] |
| 6.15 CBT + CM‐adh vs CM‐abs | 1 | 59 | Risk Ratio (M‐H, Random, 95% CI) | 1.00 [0.66, 1.53] |
| 7 Improvement in motivation to quit Show forest plot | 1 | Mean Difference (IV, Random, 95% CI) | Subtotals only | |
| Analysis 3.7  Comparison 3 Intervention A versus Intervention B, Outcome 7 Improvement in motivation to quit. | ||||
| 7.1 MET + CBT vs MET | 1 | 31 | Mean Difference (IV, Random, 95% CI) | 25.1 [9.79, 40.41] |
| 7.2 MET vs MET + CBT + CM‐abs | 1 | 30 | Mean Difference (IV, Random, 95% CI) | ‐9.8 [‐25.83, 6.23] |
| 7.3 MET + CBT vs MET + CBT + CM‐abs | 1 | 29 | Mean Difference (IV, Random, 95% CI) | 15.3 [‐0.56, 31.16] |
| 8 Reduction in alcohol use severity (ASI score) Show forest plot | 2 | Mean Difference (IV, Random, 95% CI) | Subtotals only | |
| Analysis 3.8  Comparison 3 Intervention A versus Intervention B, Outcome 8 Reduction in alcohol use severity (ASI score). | ||||
| 8.1 MET vs MET + CBT | 2 | 280 | Mean Difference (IV, Random, 95% CI) | ‐0.02 [‐0.07, 0.03] |
| 8.2 MET + CBT + CM‐abs vs MET | 1 | 30 | Mean Difference (IV, Random, 95% CI) | 0.8 [0.75, 0.85] |
| 8.3 MET + CBT + CM‐abs vs MET + CBT | 1 | 29 | Mean Difference (IV, Random, 95% CI) | 0.78 [0.73, 0.83] |
| 9 Reduction in drug use severity (ASI score) Show forest plot | 2 | Mean Difference (IV, Random, 95% CI) | Subtotals only | |
| Analysis 3.9  Comparison 3 Intervention A versus Intervention B, Outcome 9 Reduction in drug use severity (ASI score). | ||||
| 9.1 MET vs MET + CBT | 1 | 31 | Mean Difference (IV, Random, 95% CI) | ‐0.03 [‐0.08, 0.02] |
| 9.2 MET + CBT + CM‐abs vs MET | 1 | 30 | Mean Difference (IV, Random, 95% CI) | 0.11 [0.06, 0.16] |
| 9.3 MET + CBT + CM‐abs vs MET + CBT | 1 | 29 | Mean Difference (IV, Random, 95% CI) | 0.08 [0.03, 0.13] |
| 9.4 MET + CBT (high intensity) vs MET + CBT (low intensity) | 1 | 64 | Mean Difference (IV, Random, 95% CI) | 0.82 [0.12, 1.52] |
| 10 Reduction in frequency of alcohol use Show forest plot | 2 | Mean Difference (IV, Random, 95% CI) | Subtotals only | |
| Analysis 3.10  Comparison 3 Intervention A versus Intervention B, Outcome 10 Reduction in frequency of alcohol use. | ||||
| 10.1 MET vs MET + CBT | 1 | 249 | Mean Difference (IV, Random, 95% CI) | 11.18 [‐13.43, 35.79] |
| 10.2 MET + CBT (high intensity) vs MET + CBT (low intensity) | 1 | 64 | Mean Difference (IV, Random, 95% CI) | 0.82 [‐5.58, 7.21] |

Study flow diagram.

Risk of bias summary: review authors' judgements about each risk of bias item for each included study.

Pooled analysis of retention in treatment.
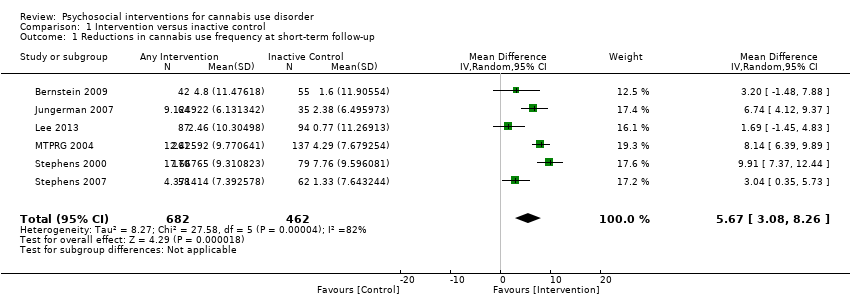
Comparison 1 Intervention versus inactive control, Outcome 1 Reductions in cannabis use frequency at short‐term follow‐up.

Comparison 1 Intervention versus inactive control, Outcome 2 Reduction in cannabis use frequency at short‐term follow‐up (intervention intensity).

Comparison 1 Intervention versus inactive control, Outcome 3 Reduction in cannabis use frequency at short‐term follow‐up (intervention type).

Comparison 1 Intervention versus inactive control, Outcome 4 Point‐prevalence abstinence at short‐term follow‐up.

Comparison 1 Intervention versus inactive control, Outcome 5 Point‐prevalence abstinence at short‐term follow‐up (intervention intensity).

Comparison 1 Intervention versus inactive control, Outcome 6 Point‐prevalence abstinence at short‐term follow‐up (intervention type).

Comparison 1 Intervention versus inactive control, Outcome 7 Reduction in joints per day at short‐term follow‐up.

Comparison 1 Intervention versus inactive control, Outcome 8 Reduction in joints per day at short‐term follow‐up (intervention intensity).
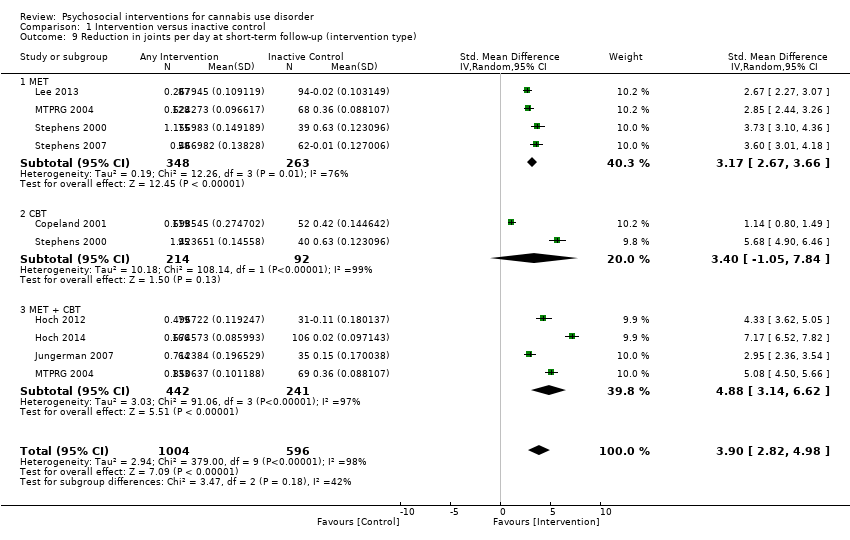
Comparison 1 Intervention versus inactive control, Outcome 9 Reduction in joints per day at short‐term follow‐up (intervention type).

Comparison 1 Intervention versus inactive control, Outcome 10 Reduction in symptoms of dependence at short‐term follow‐up.

Comparison 1 Intervention versus inactive control, Outcome 11 Reduction in symptoms of dependence at short‐term follow‐up (intervention intensity).
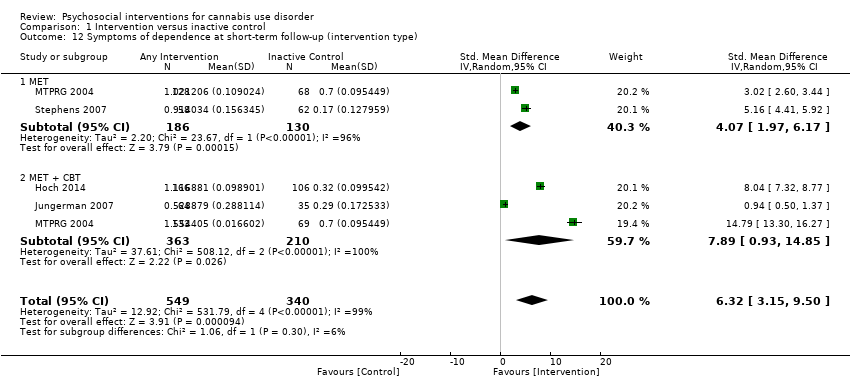
Comparison 1 Intervention versus inactive control, Outcome 12 Symptoms of dependence at short‐term follow‐up (intervention type).

Comparison 1 Intervention versus inactive control, Outcome 13 Reduction in cannabis‐related problems at short‐term follow‐up.
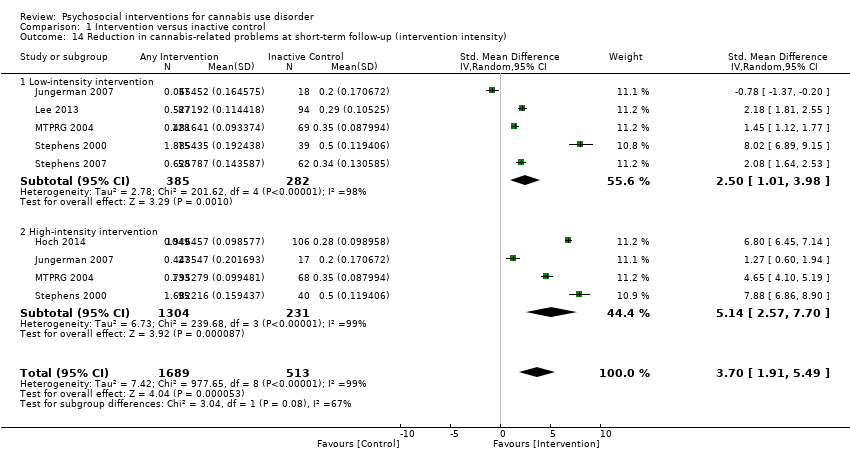
Comparison 1 Intervention versus inactive control, Outcome 14 Reduction in cannabis‐related problems at short‐term follow‐up (intervention intensity).
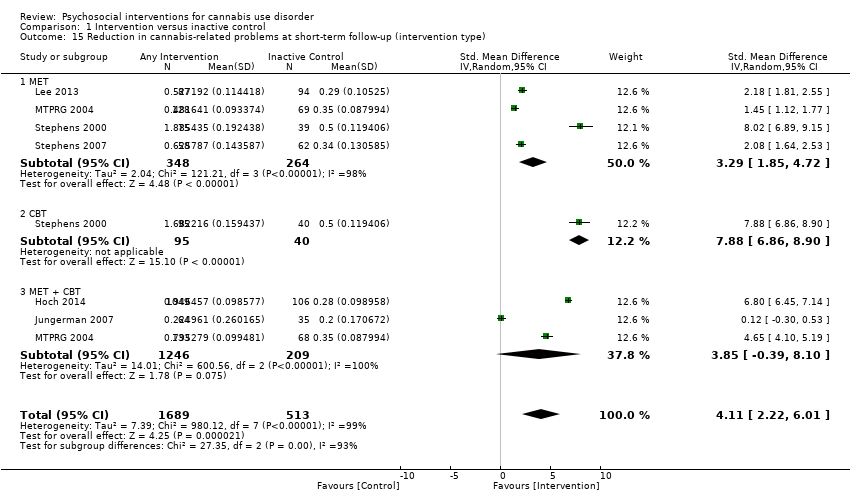
Comparison 1 Intervention versus inactive control, Outcome 15 Reduction in cannabis‐related problems at short‐term follow‐up (intervention type).
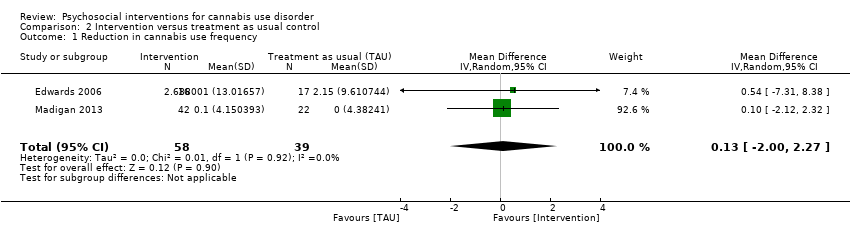
Comparison 2 Intervention versus treatment as usual control, Outcome 1 Reduction in cannabis use frequency.
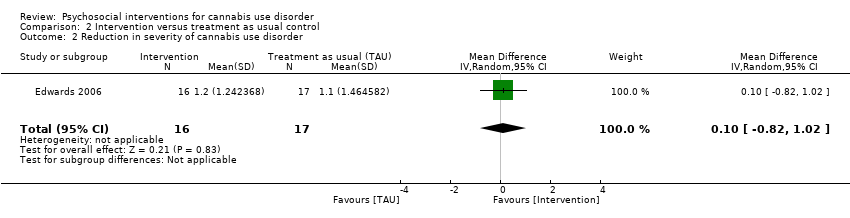
Comparison 2 Intervention versus treatment as usual control, Outcome 2 Reduction in severity of cannabis use disorder.

Comparison 3 Intervention A versus Intervention B, Outcome 1 Reduction in cannabis use frequency.

Comparison 3 Intervention A versus Intervention B, Outcome 2 Point‐prevalence abstinence.

Comparison 3 Intervention A versus Intervention B, Outcome 3 Reduction in joints used per day.

Comparison 3 Intervention A versus Intervention B, Outcome 4 Reduction in symptoms of dependence.
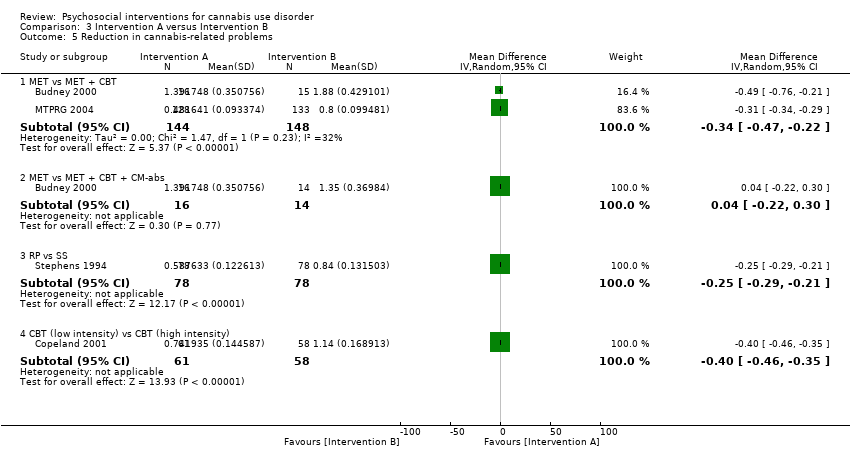
Comparison 3 Intervention A versus Intervention B, Outcome 5 Reduction in cannabis‐related problems.

Comparison 3 Intervention A versus Intervention B, Outcome 6 Treatment completion.

Comparison 3 Intervention A versus Intervention B, Outcome 7 Improvement in motivation to quit.
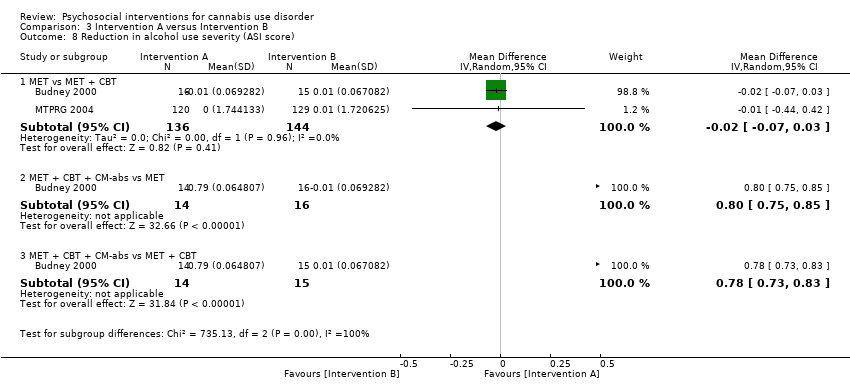
Comparison 3 Intervention A versus Intervention B, Outcome 8 Reduction in alcohol use severity (ASI score).

Comparison 3 Intervention A versus Intervention B, Outcome 9 Reduction in drug use severity (ASI score).

Comparison 3 Intervention A versus Intervention B, Outcome 10 Reduction in frequency of alcohol use.
| Psychosocial intervention compared with inactive control for cannabis use disorder | ||||||
| Patient or population: adults with cannabis use disorder or frequent cannabis use Settings: out‐patient treatment Intervention: psychosocial intervention Comparison: inactive control | ||||||
| Outcomes | Illustrative comparative risks* (95% CI) | Relative effect | Number of participants | Quality of the evidence | Comments | |
| Assumed risk | Corresponding risk | |||||
| Inactive control | Psychosocial intervention | |||||
| Cannabis use frequency at short‐term follow‐up | Mean number of cannabis using days in the past 30 days ranged across control groups from | Mean number of cannabis using days among intervention groups was | MD 5.67 (3.08 to 8.26) | 1144 (6) | ⊕⊕⊕⊝ | |
| Point‐prevalence abstinence rates at short‐term follow‐up | Proportion of participants achieving abstinence ranged from 2.70% to 44.21%, with an average of 23.02% across treatments | Average relative risk for achieving abstinence following intervention compared with control was 2.55 | RR 2.55 (1.34 to 4.83) | 1166 (6) | ⊕⊕⊕⊝ Lowa,d,e | |
| Cannabis use quantity per day at short‐term follow‐up | Mean number of joints smoked per day ranged across control groups from | Mean number of joints smoked per day among intervention groups was | SMD 3.55 (2.51 to 4.59) | 1600 (8) | ⊕⊝⊝⊝ | |
| Symptoms of dependence at short‐term follow‐up | Mean number of symptoms of dependence ranged across control groups from 2.4 to 5.1 | Mean number of symptoms of dependence among intervention groups was | SMD 4.15 (1.67 to 6.63) | 889 (4) | ⊕⊕⊕⊝ | |
| Cannabis‐related problems at short‐term follow‐up | Mean number of cannabis‐related problems ranged across control groups from | Mean number of cannabis‐related problems among intervention groups was | SMD 3.34 (1.26 to 5.42) | 2202 (6) | ⊕⊕⊝⊝ | |
| Retention in treatment | Proportion of participants completing treatment ranged from 50.0% to 88.7%, with an average of 71.8% across treatments | On average, 7 out of 10 participants completed treatment as it was intended | ES 0.71 (0.63 to 0.78) | 1424 (11) | ⊕⊕⊕⊕ Moderatea,e | |
| *The basis for the assumed risk (e.g. median control group risk across studies) is provided in footnotes. The corresponding risk (and its 95% confidence interval) is based on the assumed risk in the comparison group and the relative effect of the intervention (and its 95% CI) | ||||||
| GRADE Working Group grades of evidence | ||||||
| aAt least 1 study at high risk of other bias bData conversions were required because of heterogeneity in assessments cFollow‐up assessment periods varied (range, 7 weeks to 4 months) dFollow‐up assessment periods varied substantially (range, 3 months to 237 days) eHeterogeneity in outcome measures fFollow‐up assessment periods varied substantially (range, 7 weeks to 237 days) gSmall number of studies (4 studies) | ||||||
| Study and group | Follow‐up period |
| Bernstein 2009, (1) Brief MET + CBT, (2) assessed control | (1) and (2) at 3 and 12 months from baseline |
| Bonsack 2011, (1) MET, (2) TAU | (1) and (2) at 3, 6 and 12 months from baseline |
| Budney 2000, (1) MET + CBT + CM‐abs, (2) MET + CBT, (3) MET | (1), (2) and (3) at end of treatment [14 weeks from baseline] |
| Budney 2006, (1) CBT + CM‐abs, (2) CBT + CM‐adh, (3) CM‐abs | (1), (2) and (3) at end of treatment [14 weeks from baseline], then monthly for 12 months post treatment [data provided for 3, 6, 9 and 12 month assessments] |
| Carroll 2006, (1) MET + CBT + CM‐abs + CM‐adh, (2) DC + CM‐abs + CM‐adh, (3) MET + CBT, (4) DC | (1), (2), (3) and (4) at end of treatment [8 weeks from baseline], then at 3 and 6 months post treatment |
| Carroll 2012, (1) CBT, (2) CBT + CM‐adh, (3) CBT + CM‐abs, (4) CM‐abs | (1), (2), (3) and (4) at end of treatment [12 weeks from baseline], then at 3, 6, 9 and 12 months post treatment |
| Copeland 2001, (1) CBT (6‐session), (2) CBT (1‐session), (3) DTC | (1) at an average of 242 days from baseline; (2) at an average of 223.5 days from baseline; (3) at an average of 242.5 days from baseline |
| de Dios 2012, (1) MM, (2) Assessed control | (1) and (2) at end of treatment [2 weeks from baseline], then at 1 and 2 months from baseline |
| Edwards 2006, (1) CBT, (2) TAU | (1) and (2) at end of treatment [3 months from baseline], then at 6 months post treatment |
| Fischer 2012, (1) DC‐oral, (2) DC‐workbook, (3) Health promotion‐oral, (4) Health promotion‐workbook | (1), (2), (3) and (4) at 3 and 12 months post treatment |
| Hoch 2012, (1) MET + CBT, (2) DTC | (1) at end of treatment [8‐12 weeks from baseline], then at 3 and 6 months from baseline; (2) at 8‐12 weeks |
| Hoch 2014, (1) MET + CBT, (2) DTC | (1) at end of treatment [8 weeks], then at 3 and 6 months from baseline; (2) at 8 weeks |
| Jungerman 2007, (1) MET + CBT (3 months), (2) MET + CBT (1 month), (3) DTC | (1) at 1 month post treatment; (2) at 3 months post treatment; (3) at 4 months post baseline |
| Kadden 2007 (1) MET + CBT + CM‐abs, (2) MET + CBT, (3) CM‐abs, (4) TAU | (1), (2), (3) and (4) at end of treatment [2 month follow‐up] and at 5, 8, 11 and 14 months from baseline |
| Lee 2013, (1) MET, (2) Assessed control | (1) and (2) at 3 and 6 months from baseline |
| Litt 2013, (1) MET + CBT + CM‐abs, (2) MET + CBT + CM‐adh, (3) TAU | (1), (2) and (3) at end of treatment [2 months from baseline], then at 3, 6, 9 and 12 months post treatment |
| Madigan 2013, (1) MET + CBT, (2) TAU | (1) and (2) at 3 and 12 months from baseline |
| MTPRG 2004, (1) MET + CBT, (2) MET, (3) Assessed control | (1) and (2) at 4, 9 and 15 months from baseline; (3) at 4 months from baseline |
| Roffman 1988, (1) RP, (2) SS | (1) and (2) at end of treatment [12 weeks], then at 1, 3, 6, 9 and 12 months post treatment [only data from 1 month follow‐up are provided] |
| Stein 2011, (1) MET, (2) Assessed control | (1) and (2) at 1, 3 and 6 months from baseline |
| Stephens 1994, (1) RP, (2) SS | (1) and (2) at 1, 3, 6, 9 and 12 months post treatment |
| Stephens 2000, (1) CBT, (2) MET, (3) Assessed control | (1) at 1 month from baseline [during treatment], at end of treatment [4 months from baseline] then at 3, 9 and 12 months post treatment; (2) at end of treatment [1 month from baseline] then at 3, 6, 12 and 15 months post treatment; (3) at 4 months from baseline |
| Stephens 2007, (1) MET, (2) DC, (3) DTC | (1) and (2) end of treatment [7 weeks from baseline], then at 6 and 12 months from baseline; (3) at 7 weeks from baseline |
| CBT: Cognitive‐behavioural therapy CM‐abs: Contingency management with vouchers presented for negative urine CM‐adh: Contingency management with vouchers presented for treatment attendance/adherence DC: Drug counselling DTC: Delayed treatment control MET: Motivational enhancement therapy MM: Mindfulness‐based meditation RP: Relapse prevention SS: Social support TAU: Treatment as usual | |
| Study and group | Measure | Baseline | Follow‐up [% with data] | Significance* |
| Bernstein 2009, (1) Brief MET + CBT, (2) Assessed control | Days used in prior 30 days (mean ± SD) | (1) 19.0 ± 10.9, N = 68, (2) 15.3 ± 10.1, N = 71 | (1) 11.0 ± 10.7, N = 42 [69.1%], (2) 13.2 ± 11.7, N = 55 [77.5%] | (1) vs (2) P value = 0.024 |
| Bonsack 2011, (1) MET, (2) TAU | Days abstinent in prior ‘month’ (median ± range) | (1) 5.0 ± 24, N = 30, (2) 3.0 ± 27, N = 32 | (1) 5.5 ± 28, N = 25 [83.3%], (2) 8.5 ± 28, N = 29 [90.6%] | (1) vs (2) P value > 0.05 |
| Budney 2000, (1) MET + CBT + CM‐abs, (2) MET + CBT, (3) MI | Days used in prior 30 days (least squares mean ± SE) | (1) 24.1 ± 1.8, N = 20, (2) 20.4 ± 1.8, N = 20, (3) 23.2 ± 1.8, N = 20 | (1) 6.6 ± 2.6, N = 14 [70.0%], (2) 7.4 ± 2.3, N = 15 [75.0%], (3) 13.0 ± 2.1, N = 16 [80.0%] | (1) vs (2) P value > 0.05; (1) vs (3) P value > 0.05; (2) vs (3) P value > 0.05 |
| Budney 2006, (1) CBT + CM‐abs, (2) CBT + CM‐adh, (3) CM‐abs | Days used in prior 30 days (mean ± SD) | (1) 25.3 ± 8.0, N = 30, (2) 25.5 ± 7.4, N = 30, (3) 26.0 ± 6.2, N = 30 | (1) 12.5 ± 13.9, N = 21 [70.0%], (2) 18.3 ± 15.7, N = 24 [80.0%], (3) 18.1 ± 13.6, N = 22 [73.3%] | (1) vs (2) P value > 0.05; (1) vs (3) P value > 0.05; (2) vs (3) P value > 0.05 |
| Carroll 2006, (1) MET + CBT + CM‐abs + CM‐adh, (2) DC + CM‐abs + CM‐adh. (3) MET + CBT, (4) DC | Proportion of days used post treatment (mean ± SE) | (1) n/a, N = 33, (2) n/a, N = 34, (3) n/a, N = 36, (4) n/a, N = 33 | (1) 0.64 ± 0.06, N = 27 [81.8%], (2) 0.75 ± 0.1, N = 24 [70.6%], (3) 0.73 ± 0.05, N = 27 [75.0%], (4) 0.71 ± 0.06, N = 30 [90.9%] | (1) vs (2) P value > 0.05; (1) vs (3) P value > 0.05; (1) vs (4) P value = 0.02; (2) vs (3) P value > 0.05; (3) vs (4) P value = 0.02; (2) vs (4) P value > 0.05 |
| Carroll 2012, (1) CBT, (2) CBT + CM‐adh, (3) CBT + CM‐abs, (4) CM‐abs | Days used in prior 28 days (mean ± SD) | (1) 15.6 ± 9.8, N = 36, (2) 17.6 ± 8.6, N = 32, (3) 17.9 ± 9.6, N = 32, (4) 14.1 ± 10.6, N = 27 | (1) Unclear, N = 33 [91.7%], (2) Unclear, N = 25 [78.1%], (3) Unclear, N = 26 [81.3%], (4) Unclear, N = 23 [85.2%] | (1) vs (2) P value = 0.00; (1) vs (3) P value = 0.00; (1) vs (4) P value > 0.05; (2) vs (3) P value > 0.05; (3) vs (4)* P value = 0.00; (2) vs (4) P value = 0.00 |
| Copeland 2001, (1) CBT [6‐session], (2) CBT [1‐session], (3) DTC | Percent of days abstinent post treatment (mean ± SD) | (1) n/a, N = 78, (2) n/a, N = 82, (3) n/a, N = 69 | (1) 35.9 ± 34.8, N = 58 [74.4%], (2) 44.8 ± 37.7, N = 61 [74.4%], (3) 29.7 ± 32.6, N = 52 [75.4%] | (1) vs (2) P value > 0.05; (1) vs (3) P value > 0.05; (2) vs (3) P value > 0.05 |
| de Dios 2012, (1) MM, (2) Assessed control | Days used in prior 30 days (mean ± SD) | (1) 17.0 ± 9.96, N = 22, (2) 18.8 ± 8.1, N = 12 | (1) Unclear, N = 16 [72.7%], (2) Unclear, N = 9 [75.0%] | (1) vs (2) P value = 0.031 across FU |
| Edwards 2006, (1) DC, (2) TAU | % of days used in prior 4 weeks (mean ± SD) | (1) 39.4 ± 38.4, N = 23, (2) 26.0 ± 28.3, N = 24 | (1) 32.4 ± 44.9, N = 16 [69.6%], (2) 19.3 ± 30.4, N = 17 [70.8%] | (1) vs (2) P value > 0.05 |
| Fischer 2012, (1) DC‐oral, (2) DC‐workbook, (3) Health promotion‐oral, (4) Health promotion‐workbook | Days used in prior 30 days (mean, range) | (1) 21.96, 4.75, N = 24, (2) 24.82, 3.0, N = 47, (3) 21.36, 5.5, N = 25, (4) 25.36, 3.41, N = 37 | (1) Unclear, N = Unclear, (2) Unclear, N = Unclear, (3) Unclear, N = Unclear, (4) Unclear, N = Unclear | (1) vs (2) P value > 0.05; (1) vs (3) P value > 0.05; (1) vs (4) P value > 0.05; (2) vs (3) P value > 0.05; (3) vs (4) P value > 0.05; (2) vs (4) P value > 0.05 |
| Hoch 2012, (1) MET + CBT, (2) DTC | Percent reporting abstinence post treatment (%) | (1) n/a, N = 90, (2) n/a, N = 32 | (1) 49, N = 79 [87.8%], (2) 12.5, N = 31 [96.9%] | (1) vs (2) P value < 0.05 |
| Hoch 2014, (1) MET + CBT, (2) DTC | Percent reporting abstinence post treatment (%) | (1) n/a, N = 166, (2) n/a, N = 130 | (1) 53.3, N = 166 [100%], (2) 22, N = 106 [81.5%] | (1) vs (2) P value < 0.05 |
| Jungerman 2007, (1) MET + CBT [3 months], (2) MET + CBT [1 month], (3) DTC | Percent of days used in prior 90 days (mean ± SE) | (1) 88.17 ± 1.95, N = 52, (2) 94.19 ± 1.87, N = 56, (3) 94.06 ± 1.95, N = 52 | (1) 56.21 ± 4.38, N = 27 [51.9%], (2) 64.90 ± 4.27, N = 37 [66.1%], (3) 86.12 ± 4.38, N = 35 [67.3%] | (1) vs (2) P value > 0.05; (1) vs (3) P value = 0.0008; (2) vs (3) P value = 0.0002 |
| Kadden 2007 (1) MET + CBT + CM‐abs, (2) MET + CBT, (3) CM‐abs, (4) Health education | Proportion of days used in prior 90 days (mean ± SD) | (1) 0.11 ± 0.17, N = 63, (2) 0.08 ± 0.13, N = 61, (3) 0.15 ± 0.19, N = 54, (4) 0.08 ± 0.12, N = 62 | (1) 27, N = 51 [81.0%], (2) 19, N = 49 [80.3%], (3) Unclear, N = 48 [88.9%], (4) Unclear, N = 52 [83.9%] | (1) vs (2) P value > 0.05; (1) vs (3) P value > 0.05; (1) vs (4) P value < 0.05; (2) vs (3) P value > 0.05; (3) vs (4) P value > 0.05 [P value < 0.05 at 3 month FU only]; (2) vs (4) P value < 0.05 |
| Lee 2013, (1) MET, (2) Assessed control | Days used in prior 30 days (mean ± SD) | (1) 16.5 ± 8.2, N = 106, (2) 15.6 ± 8.8, N = 106 | (1) 13.2 ± 10.6, N = 89 [84.0%], (2) 11.7 ± 11.1, N = 86 [81.1%] | (1) vs (2) P value > 0.05 |
| Litt 2013, (1) MET + CBT + CM‐abs, (2) MET + CBT + CM‐adh, (3) Assessed control | Days used in prior 90 days (mean ± SD) | (1) 72.5 ± 28.0, N = 73, (2) 71.8 ± 27.8, N = 71, (3) 68.4 ± 31.5, N = 71 | (1) Unclear, N = 60 [82.2%], (2) Unclear, N = 61 [85.9%], (3) Unclear, N = 61 [85.9%] | (1) vs (2) P value < 0.05 [significant at FU months 5‐8 only]; (1) vs (3) P value > 0.05; (2) vs (3) P value > 0.05 |
| Madigan 2013, (1) MET + CBT, (2) TAU | Days used in prior 30 days (mean ± SD) | (1) 10.0 ± 3.6, N = 59, (2) 10.1 ± 3.7, N = 29 | (1) 9.8 ± 3.9, N = 32 [54.2%], (2) 10.1 ± 4.0, N = 19 [65.5%] | (1) vs (2) P value > 0.05 |
| MTPRG 2004, (1) MET + CBT, (2) MET, (3) Assessed control | Percent of days used in prior 90 days (mean ± SD) | (1) 87.56 ± 17.24, N = 156, (2) 86.92 ± 17.15, N = 146, (3) 89.88 ± 14.11, N = 148 | (1) 44.86 ± 40.52, N = 129 [82.7%], (2) 53.65 ± 38.57, N = 120 [82.2%], (3) 75.59 ± 30.69, N = 137 [92.6%] | (1) vs (2) P value < 0.05 [Cohen d = 0.22]; (1) vs (3) P value < 0.05 [Cohen d = 1.14]; (2) vs (3) P value < 0.05 [Cohen d = 0.59] |
| Roffman 1988, (1) RP, (2) SS | Days used in prior ‘month’ (mean ± SD) | (1) 27.13 ± 4.6, N = 54, (2) 26.36 ± 5.79, N = 56 | (1) 8.18 ± 10.48, N = 45 [83.3%], (2) 12.96 ± 11.56, N = 52 [92.9%] | (1) vs (2) P value < 0.05 |
| Stein 2011, (1) MET, (2) Assessed control | Proportion of days used in prior 90 days (mean ± SD) | (1) 0.59 ± 0.34, N = 163, (2) 0.55 ± 0.34, N = 169 | (1) Unclear, N = 126 [77.3%], (2) Unclear, N = 136 [80.5%] | (1) vs (2) P value = 0.01 [significant at 3 month FU only] |
| Stephens 1994, (1) RP, (2) SS | Days used in prior 30 days (mean ± SD) | (1) 27.04 ± 4.66, N = 106, (2) 26.36 ± 5.81, N = 106 | (1) 15.31 ± 12.49, N = 80 [75.5%], (2) 13.79 ± 11.9, N = 87 [82.1%] | (1) vs (2) P value > 0.05 |
| Stephens 2000, (1) MET, (2) CBT, (3) Assessed control | Days used in prior 90 days divided by 3 (mean ± SD) | (1) 24.24 ± 6.29, N = 88, (2) 25.38 ± 6.15, N = 117. (3) 24.85 ± 6.13, N = 86 | (1) 12.99 ± 11.61, N = 80 [90.9%], (2) 12.29 ± 12.34, N = 103 [88.0%], (3) 17.09 ± 10.73, N = 79 [91.9%] | (1) vs (2) P value < 0.02 [significant at EoT only, assessed during treatment for (2)]; (1) vs (3) P value < 0.001; (2) vs (3) P value < 0.001 [significant at EoT only] |
| Stephens 2007, (1) MET, (2) Drug‐related health education, (3) DTC | Days used in prior 90 days converted to average days per week (mean ± SE) | (1) 5.76 ± 0.15, N = 62. (2) 5.79 ± 0.15, N = 62, (3) 6.06 ± 0.15, N = 64 | (1) 4.65 ± 0.28, N = 49 [79.0%], (2) 5.58 ± 0.28, N = 52 [83.9%], (3) 5.75 ± 0.24, N = 62 [96.9%] | (1) vs (2) P value <0.05 [Cohen d = 0.45]; (1) vs (3) P value < 0.05 [significant at 1.75 month FU, Cohen d = 0.47]; (2) vs (3) P value > 0.05 |
| * Unless otherwise indicated by *, significant treatment outcomes favour the group with the lower number; exact P values are reported when provided CBT: Cognitive‐behavioural therapy CM‐abs: Contingency management with vouchers presented for negative urine CM‐adh: Contingency management with vouchers presented for treatment attendance/adherence DC: Drug counselling DTC: Delayed treatment control EoT: End of treatment FU: Follow‐up MET: Motivational enhancement therapy MM: Mindfulness‐based meditation RP: Relapse prevention SD: Standard deviation SE: Standard error TAU: Treatment as usual | ||||
| Study and group | Measure | Baseline | Follow‐up [% with data] | Significance* |
| Bonsack 2011, (1) MET, (2) TAU | Joints per week (median ± range at baseline, median reduction at follow‐up) | (1) 22.5 ± 89, N = 30, (2) 19.0 ± 95, N = 32 | (1) 10.0, N = 25 [83.3%], (2) 3.5, N = 29 [90.6%] | (1) vs (2) P value > 0.05 [significant at 3 and 6 months only, d = 0.65] |
| Budney 2006, (1) CBT + CM‐abs, (2) CBT + CM‐adh, (3) CM‐abs | Joints per day (mean ± SD) | (1) 4.2 ± 3.0, N = 30, (2) 3.7 ± 2.2, N = 30, (3) 3.8 ± 2.2, N = 30 | (1) Unclear, N = 21 [70.0%], (2) Unclear, N = 24 [80.0%], (3) Unclear, N = 22 [73.3%] | (1) vs (2) P value > 0.05; (1) vs (3) P value > 0.05; (2) vs (3) P value > 0.05 |
| Copeland 2001, (1) CBT [6‐session], (2) CBT [1‐session], (3) DTC | “daily amount used in the last month” (mean ± SD) | (1) 2.1 ± 0.8, N = 78, (2) 2.0 ± 0.8, N = 82, (3) 2.2 ± 0.9, N = 69 | (1) 1.3 ± 0.9, N = 58 [74.4%], (2) 1.5 ± 1.2, N = 61 [74.4%], (3) 1.8 ± 1.0, N = 52 [75.4%] | (1) vs (2) P value > 0.05; (1) vs (3) P value = 0.02; (2) vs (3) P value > 0.05 |
| Fischer 2012, (1) DC [oral], (2) DC [workbook], (3) Health promotion [oral], (4) Health promotion [workbook] | Number of cannabis use episodes per day (mean ± range; reported only as combined group scores) | (1) + (2) 2.3 ± 1.2, N = 71, (3) + (4) 2.0 ± 0.6, N = 62 | (1) + (2) 2.6 ± 2.1, N = unclear, (3) + (4) 2.2 ± 0.9 | (1) vs (2) P value > 0.05; (1) vs (3) P value > 0.05; (1) vs (4) P value > 0.05; (2) vs (3) P value > 0.05; (3) vs (4) P value > 0.05; (2) vs (4) P value > 0.05 |
| Hoch 2012, (1) MET + CBT, (2) DTC | Units in previous 7 days (mean ± SD) | (1) 25.2 ± 39.7, N = 90, (2) 21.3 ± 32.7, N = 32 | (1) 8.1 ± 18.1, N = 79 [87.8%], (2) 24.9 ± 33.4, N = 31 [96.9%] | (1) vs (2) P value < 0.05 |
| Hoch 2014, (1) MET + CBT, (2) DTC | Units in previous 7 days (mean ± SD) | (1) 20.8 ± 26.7, N = 90, (2) 21.3 ± 28.3, N = 32 | (1) 5.2 ± 13.0, N = 79 [87.8%], (2) 20.6 ± 30.0, N = 31 [96.9%] | (1) vs (2) P value < 0.001 [d = ‐0.9] |
| Jungerman 2007, (1) MET + CBT [3 months], (2) MET + CBT [1 month], (3) DTC | Joints per day (mean ± SE) | (1) 2.08 ± 0.29, N = 52, (2) 2.06 ± 0.28, N = 56, (3) 1.84 ± 0.29, N = 52 | (1) 0.77 ± 0.18, N = 27 [51.9%], (2) 0.78 ± 0.17, N = 37 [66.1%], (3) 1.56 ± 0.18, N = 35 [67.3%] | (1) vs (2) P value > 0.05; (1) vs (3) P value = 0.006; (2) vs (3) P value = 0.006 |
| Kadden 2007, (1) MET + CBT + CM‐abs, (2) MET + CBT, (3) CM‐abs, (4) Health education | Joints per day (mean ± SE) | (1) 4.76 ± 3.98, N = 63, (2) 4.67 ± 6.27, N = 61, (3) 3.24 ± 2.65, N = 54, (4) 5.20 ± 5.70, N = 62 | (1) Unclear, N = 51 [81.0%], (2) Unclear, N = 49 [80.3%], (3) Unclear, N = 48 [88.9%], (4) Unclear, N = 52 [83.9%] | (1) vs (2) P value > 0.05; (1) vs (3) P value > 0.05; (1) vs (4) P value > 0.05; (2) vs (3) P value > 0.05; (3) vs (4) P value > 0.05; (2) vs (4) P value > 0.05 |
| Lee 2013, (1) MET, (2) Assessed control | Joints per week (mean ± SD) | (1) 9.35 ± 9.8, N = 106, (2) 8.29 ± 9.5, N = 106 | (1) 7.26 ± 8.4, N = 89 [84.0%], (2) 7.47 ± 10.7, N = 86 [81.1%] | (1) vs (2) P value > 0.05 [P value < 0.05 at 3 month FU only] |
| MTPRG 2004, (1) MET + CBT, (2) MET, (3) Assessed control | Joints per day (mean ± SD) | (1) 2.79 ± 2.35, N = 156, (2) 3.02 ± 2.80, N = 146, (3) 2.77 ± 2.19, N = 148 | (1) Unclear, N = 129 [82.7%], (2) Unclear, N = 120 [82.2%], (3) 2.03 ± 1.94, N = 137 [92.6%] | (1) vs (2) P value > 0.05; (1) vs (3) P value < 0.05 [d = 0.43]; (2) vs (3) P value < 0.05 [d = 0.29] |
| Roffman 1988, (1) RP, (2) SS | Joints per day (mean ± SD) | (1) 2.58 ± 0.94, N = 54, (2) 2.85 ± 0.83, N = 56 | (1) 1.11 ± 1.11, N = 45 [83.3%], (2) 1.29 ± 1.00, N = 52 [92.9%] | (1) vs (2) P value > 0.05 |
| Stephens 2000, (1) MET, (2) CBT, (3) Assessed control | Scale of quantity where 1 = once, 2 = 2‐3 times, 3 = 4‐5 times and 4 = 6+ times per day (mean ± SD) | (1) 2.41 ± 0.85, N = 88, (2) 2.59 ± 0.89, N = 117, (3) 2.61 ± 0.93, N = 86 | (1) 1.41 ± 1.20, N = 80 [90.9%], (2) 1.39 ± 1.15, N = 103 [88.0%], (3) 1.97 ± 1.09, N = 79 [91.9%] | (1) vs (2) P value > 0.05; (1) vs (3) P value < 0.001; (2) vs (3) P value < 0.001 [significant at EoT only] |
| Stephens 2007, (1) MET, (2) Drug‐related health education, (3) DTC | Number of 6‐hour periods per day that were smoked (mean ± SE) | (1) 2.07 ± 0.10, N = 62, (2) 2.00 ± 0.10, N = 62, (3) 2.19 ± 0.09, N = 64 | (1) 4.65 ± 0.28, N = 49 [79.0%], (2) 5.58 ± 0.28, N = 52 [83.9%], (3) 5.75 ± 0.24, N = 62 [96.9%] | (1) vs (2) P value < 0.05 [significant at 1.75 month FU only, d = 0.42]; (1) vs (3) P value < 0.05 [significant at 1.75 month FU only, d = 0.69]; (2) vs (3) P value > 0.05 |
| * Unless otherwise indicated by *, significant treatment outcomes favour the group with the lower number; exact P values are reported when provided CBT: Cognitive‐behavioural therapy CM‐abs: Contingency management with vouchers presented for negative urine CM‐adh: Contingency management with vouchers presented for treatment attendance/adherence DC: Drug counselling EoT: End of treatment FU: Follow‐up MET: Motivational enhancement therapy RP: Relapse prevention SD: Standard deviation SE: Standard error SS: Social support TAU: Treatment as usual | ||||
| Study and group | Measure | Baseline | Follow‐up [% with data] | Significance* |
| Budney 2000, (1) MET + CBT + CM‐abs, (2) MET + CBT, (3) MI | Addiction Severity Index composite scores (lowest score mean ± SD – highest score mean ± SD) | (1) 0.09 ± 0.01 ‐ 0.33 ± .03, N = 20, (2) 0.08 ± 0.05 ‐ 0.39 ± .02, N = 20, (3) 0.07 ± 0.01 & 0.42 ± .02, N = 20 | (1) 0.01 ± 0.02 ‐ 0.32 ± .04, N = 14 [70.0%], (2) 0.05 ± 0.04 ‐ 0.32 ± .03, N = 15 [75.0%], (3) 0.01 ± 0.05 ‐ 0.32 ± .04, N = 16 [80.0%] | (1) vs (2) and (1) vs (3) data provided in aggregate: P value < 0.05 for the ‘medical’ [f = 0.16] and for the ‘drug’ [f = 0.23] composite scores; (2) vs (3) P value > 0.05 |
| Budney 2006, (1) CBT + CM‐abs, (2) CBT + CM‐adh, (3) CM‐abs | Proportion with no symptoms of dependence in prior ‘month’ (%), Addiction Severity Index composite scores (data not shown) | (1) Unclear, Unclear, N = 30, (2) Unclear, Unclear, N = 30, (3) Unclear, Unclear, N = 30 | (1) 37, Unclear, N = 21 [70.0%], (2) 30, Unclear, N = 24 [80.0%], (3) 27, Unclear, N = 22 [73.3%] | (1) vs (2) P value > 0.05, P value > 0.05; (1) vs (3) P value = 0.05 at 3 month FU only, P value > 0.05; (2) vs (3) P value > 0.05, P value > 0.05 |
| Carroll 2006, (1) MET + CBT + CM‐abs + CM‐adh, (2) DC + CM‐abs, + CM‐adh, (3) MET + CBT, (4) DC | Addiction Severity Index composite scores (data not shown) | (1) Unclear, N = 33, (2) Unclear, N = 34, (3) Unclear, N = 36, (4) Unclear, N = 33 | (1) Unclear, N = 27 [81.8%], (2) Unclear, N = 24 [70.6%], (3) Unclear, N = 27 [75.0%], (4) Unclear, N = 30 [90.9%] | (1) vs (2) P value > 0.05; (1) vs (3) P value > 0.05; (1) vs (4) P value > 0.05; (2) vs (3) P value > 0.05; (3) vs (4) P value = 0.05 for the ‘legal’ composite score across FU; (2) vs (4) P value > 0.05 |
| Copeland 2001, (1) CBT [6‐session], (2) CBT [1‐session], (3) DTC | Severity of Dependence Scale score (mean ± SD) | (1) 9.2 ± 3.2, N = 78, (2) 9.8 ± 2.9, N = 82, (3) 9.3 ± 2.6, N = 69 | (1) 5.8 ± 4.3, N = 58 [74.4%], (2) 7.6 ± 4.4, N = 61 [74.4%], (3) 9.2 ± 3.2, N = 52 [75.4%] | (1) vs (2) P value = 0.04 [t = ‐2.1]; (1) vs (3) P value < 0.0001 [t = ‐4.7]; (2) vs (3) P value = 0.008 [t = ‐2.7] |
| Edwards 2006, (1) DC, (2) TAU | Cannabis and Substance Use Assessment Schedule (mean ± SD) | (1) 2.6 ± 0.9, N = 23, (2) 2.4 ± 1.2, N = 24 | (1) 1.4 ± 1.4, N = 16 [69.6%], (2) 1.3 ± 1.5, N = 17 [70.8%] | (1) vs (2) P value > 0.05 |
| Hoch 2012, (1) MET + CBT, (2) DTC | Addiction Severity Index composite scores (lowest score mean ± SD – highest score mean ± SD) | (1) 9.9 ± 1.4 – 10.1 ± 1.7, N = 90, (2) 9.7 ± 1.8 – 10.1 ± 2.1, N = 32 | (1) 3.0 ± 4.0 – 11.0 ± 9.7, N = 79 [87.8%], (2) 4.1 ± 10.7 – 13.7 ± 13.3, N = 31 [96.9%] | (1) vs (2) P value < 0.05 [for drug, legal, medical, employment and family composite scores] |
| Hoch 2014, (1) MET + CBT, (2) DTC | Severity of Dependence Scale score, number of symptoms of dependence (mean ± SD) | (1) 9.0 ± 3.4, 3.3 ± 1.6, N = 166, (2) 9.1 ± 3.5, 3.1 ± 1.6, N = 130 | (1) 4.7 ± 4.2, 0.9 ± 1.6, N = 166 [100%], (2) 7.0 ± 4.1, 2.4 ± 2.1, N = 106 [81.5%] | (1) vs (2) P value < 0.001 [d = ‐0.6], P value < 0.001 [d = ‐0.9] |
| Jungerman 2007, (1) MET + CBT [3 months], (2) MET + CBT [1 month], (3) DTC | Number of symptoms of dependence, overall Addiction Severity Index score (mean ± SE) | (1) 5.78 ± 0.31, 3.02 ± 0.21, N = 52, (2) 5.59 ± 0.30, 2.87 ± 0.20, N = 56, (3) 5.71 ± 0.31, 3.38 ± 0.21, N = 52 | (1) 4.20 ± 0.33, 2.10 ± 0.21, N = 27 [51.9%], (2) 4.86 ± 0.32, 2.77 ± 0.20, N = 37 [66.1%], (3) 5.10 ± 0.33, 2.81 ± 0.21, N = 35 [67.3%] | (1) vs (2) P value = 0.0349, P value = 0.0121; (1) vs (3) P value = 0.0349, P value > 0.05; (2) vs (3) P value > 0.05, P value > 0.05 |
| Kadden 2007, (1) MET + CBT + CM‐abs, (2) MET + CBT, (3) CM‐abs, (4) Health education | Addiction Severity Index composite scores (lowest score mean ± SD – highest score mean ± SD) | (1) 0.09 ± 0.09 – 0.25 ± 0.19, N = 63. (2) 0.12 ± 0.12 – 0.25 ± 0.07, N = 61, (3) 0.09 ± 0.10 – 0.26 ± 0.05, N = 54, (4) 0.11 ± 0.14 – 0.25 ± 0.21, N = 62 | (1) Unclear, N = 51 [81.0%], (2) Unclear, N = 49 [80.3%], (3) Unclear, N = 48 [88.9%], (4) Unclear, N = 52 [83.9%] | (1) vs (2) P value > 0.05; (1) vs (3) P value > 0.05; (1) vs (4) P value > 0.05; (2) vs (3) P value > 0.05; (3) vs (4) P value > 0.05; (2) vs (4) P value > 0.05 |
| MTPRG 2004, (1) MET + CBT, (2) MET, (3) Assessed control | Number of symptoms of dependence (mean ± SD), Addiction Severity Index composite scores (lowest score mean ± SD – highest score mean ± SD) | (1) 5.62 ± 1.17, 0.11 ± 0.13 – 0.26 ± 0.30, N = 156, (2) 5.70 ± 1.20, 0.12 ± 0.13 – 0.28 ± 0.31, N = 146, (3) 5.56 ± 1.33, 0.11 ± 0.12 – 0.16 ± 0.25, N = 148 | (1) 2.81 ± 2.40, 0.10 ± 0.11 – 0.25 ± 0.32, N = 129 [82.7%], (2) 3.63 ± 2.08, 0.13 ± 0.10 – 0.26 ± 0.32, N = 120 [82.2%], (3) 4.36 ± 1.92, 0.11 ± 0.12 – 0.20 ± 0.17, N = 137 [92.6%] | (1) vs (2) P value < 0.05 [at 9 month FU only, d = 0.31], P value > 0.05; (1) vs (3) P value > 0.05, P value < 0.05 [for ‘employment’ composite only]; (2) vs (3) P value > 0.05, P value < 0.05 [for ‘employment’ composite only] |
| Stephens 2000, (1) MET, (2) CBT, (3) Assessed control | Number of symptoms of dependence (mean ± SD) | (1) Unclear, N = 88, (2) Unclear, N = 117, (3) Unclear, N = 86 [6.74 ± 1.97 for total sample with no significant group differences] | (1) 2.75 ± 3.18, N = 80 [90.9%], (2) 2.83 ± 3.27, N = 103 [88.0%], (3) 4.63 ± 2.59, N = 79 [91.9%] | (1) vs (2) P value > 0.05; (1) vs (3) P value < 0.001; (2) vs (3) P value < 0.001 [significant at EoT only] |
| Stephens 2007, (1) MET, (2) Drug‐related health education, (3) DTC | Number of symptoms of dependence (mean ± SD) | (1) 3.92 ± 1.78, N = 62, (2) 3.26 ± 1.93, N = 62, (3) 3.17 ± 1.93, N = 64 | (1) 2.43 ± .018, N = 49 [79.0%], (2) 2.88 ± 0.18, N = 52 [83.9%], (3) 2.85 ± 0.20, N = 62 [96.9%] | (1) vs (2) P value < 0.05 [d = 0.48, 0.45 and 0.37 across FU]; (1) vs (3) P value < 0.05 [significant at 1.75 month FU, d = 0.58]; (2) vs (3) P value > 0.05 |
| * Unless otherwise indicated by *, significant treatment outcomes favour the group with the lower number; exact P values are reported when provided. CBT: Cognitive‐behavioural therapy CM‐abs: Contingency management with vouchers presented for negative urine CM‐adh: Contingency management with vouchers presented for treatment attendance/adherence DC: Drug counselling DTC: Delayed treatment control EoT: End of treatment FU: Follow‐up MET: Motivational enhancement therapy SD: Standard deviation SE: Standard error TAU: Treatment as usual | ||||
| Study and group | Measure | Baseline | Follow‐up [% with data] | Significance* |
| Bernstein 2009, (1) Brief MET + CBT, (2) Assessed control | Percent reporting risky behaviours following use: fighting, driving, being careful (%) | (1) 50.0, 14.6, 78.1, N = 55, (2) 51.6, 14.8, 69.1, N = 64 | (1) 12.8, 17.0, 73.9, N = 47 [69.1%], (2) 34.6, 24.5, 70.4, N = 55 [77.5%] | (1) vs (2) all P value > 0.05 |
| Budney 2000, (1) MET + CBT + CM‐abs, (2) MET + CBT, (3) MET | Modified Drug Abuse Screening Test “Marijuana Consequences Questionnaire” (mean ± SE) | (1) 7.7 ± 0.62, N = 20, (2) 7.1 ± 0.60, N = 20, (3) 6.7 ± 0.60, N = 20 | (1) 3.7 ± 0.86, N = 14 [70.0%], (2) 1.9 ± 0.78, N = 15 [75.0%], (3) 1.5 ± 1.0, N = 16 [80.0%] | (1) vs (2) P value > 0.05; (1) vs (3) P value > 0.05; (2) vs (3) P value > 0.05 |
| Budney 2006, (1) CBT + CM‐abs, (2) CBT + CM‐adh, (3) CM‐abs | Marijuana Problem Scale (mean ± SD) | (1) 7.8 ± 4.8, N = 30, (2) 7.9 ± 4.0, N = 30, (3) 7.8 ± 4.4, N = 30 | (1) Unclear, N = 21 [70.0%], (2) Unclear, N = 24 [80.0%], (3) Unclear, N = 22 [73.3%] | (1) vs (2) P value > 0.05; (1) vs (3) P value > 0.05; (2) vs (3) P value > 0.05 |
| Copeland 2001, (1) CBT [6‐session], (2) CBT [1‐session], (3) DTC | Cannabis Problems Questionnaire (mean ± SD) | (1) 42.4 ± 17.1, N = 78, (2) 42.2 ± 18.6, N = 82, (3) 45.4 ± 16.3, N = 69 | (1) 23.0 ± 16.8, N = 58 [74.4%], (2) 28.4 ± 18.6, N = 61 [74.4%], (3) 39.1 ± 16.6, N = 52 [75.4%] | (1) vs (2) P value > 0.05; (1) vs (3) P value = 0.004; (2) vs (3) P value < 0.0001 |
| Hoch 2014, (1) MET + CBT, (2) DTC | Cannabis Problems Questionnaire, Cannabis Use Problems Identification Test (mean ± SD) | (1) 6.7 ± 4.2, 41.8 ± 11.7, N = 166, (2) 6.8 ± 4.3, 43.3 ± 11.3, N = 130 | (1) 27.1 ± 14.1, 2.9 ± 3.8, N = 166 [100%], (2) 37.1 ± 14.7, 5.6 ± 4.4, N = 106 [81.5%] | (1) vs (2) P value < 0.001 [d = ‐0.7], P value < 0.001 [d = ‐0.7] |
| Fischer 2012, (1) DC [oral], (2) DC [workbook], (3) Health promotion [oral], (4) Health promotion [workbook] | Proportion reporting driving a car while under the influence of cannabis, and deep inhalation smoking (%) | (1) 80.0, 40.0, N = 24, (2) 76.60, 46.81, N = 47, (3) 76.0, 29.17, N = 25, (4) 83.78, 27.59, N = 37 | (1) Unclear, N = Unclear, (2) Unclear, N = Unclear, (3) Unclear, N = Unclear, (4) Unclear, N = Unclear [data reported by combining groups (1) + (2) and (3) + (4)] | (1) vs (2) P value > 0.05; (1) vs (3) P value > 0.05; (1) vs (4) P value > 0.05; (2) vs (3) P value > 0.05; (3) vs (4) P value > 0.05; (2) vs (4) P value > 0.05 [combining (1) + (2) vs (3) + (4) was P value < 0.05, Q = 13.1, P value < 0.05, Q = 9.3] |
| Jungerman 2007, (1) MET + CBT [3 months], (2) MET + CBT [1 month], (3) DTC | Marijuana Problem Scale (mean ± SE) | (1) 10.21 ± 0.58, N = 52, (2) 9.80 ± 0.56, N = 56, (3) 9.71 ± 0.58, N = 52 | (1) 8.52 ± 0.63, N = 27 [51.9%], (2) 9.54 ± 0.61, N = 37 [66.1%], (3) 8.92 ± 0.64, N = 35 [67.3%] | (1) vs (2) P value > 0.05; (1) vs (3) P value > 0.05; (2) vs (3) P value > 0.05 |
| Kadden 2007 (1) MET + CBT + CM‐abs, (2) MET + CBT, (3) CM‐abs, (4) Health education | Marijuana Problem Scale (mean ± SD) | (1) 13.42 ± 6.84, N = 63, (2) 13.97 ± 7.52, N = 61, (3) 12.62 ± 6.09, N = 54, (4) 15.19 ± 6.74, N = 62 | (1) Unclear, N = 51 [81.0%], (2) Unclear, N = 49 [80.3%], (3) Unclear, N = 48 [88.9%], (4) Unclear, N = 52 [83.9%] | (1) vs (2) P value > 0.05; (1) vs (3) P value > 0.05; (1) vs (4) P value > 0.05; (2) vs (3) P value > 0.05; (3) vs (4) P value > 0.05; (2) vs (4) P value > 0.05 |
| Lee 2013, (1) MET, (2) Assessed control | Adapted Marijuana Problems Index (mean ± SD) | (1) 10.45 ± 4.9, N = 106, (2) 10.38 ± 5.9, N = 106 | (1) 6.54 ± 5.3, N = 89 [84.0%], (2) 6.75 ± 6.5, N = 86 [81.1%] | (1) vs (2) P value < 0.05, [significant at 3 month FU only] |
| Litt 2013, (1) MET + CBT + CM‐abs, (2) MET + CBT + CM‐adh, (3) Assessed control | Marijuana Problem Scale (data presented in an unclear figure) | (1) Unclear, N = 73, (2) Unclear, N = 71, (3) Unclear, N = 71 | (1) Unclear, N = 60 [82.2%], (2) Unclear, N = 61 [85.9%], (3) Unclear, N = 61 [85.9%] | (1) vs (2) P value > 0.05; (1) vs (3) P value > 0.05; (2) vs (3) P value > 0.05 |
| MTPRG 2004, (1) MET + CBT, (2) MET, (3) Assessed control | Marijuana Problem Scale (mean ± SD) | (1) 9.47 ± 3.51, N = 156, (2) 10.18 ± 3.47, N = 146, (3) 9.07 ± 3.53, N = 148 | (1) Unclear, N = 129 [82.7%], (2) Unclear, N = 120 [82.2%], (3) Unclear, N = 137 [92.6%] | (1) vs (2) P value > 0.05, [significant at 4 month FU only, d = 0.41]; (1) vs (3) P value < 0.05 [d = 0.53]; (2) vs (3) P value > 0.05 |
| Roffman 1988, (1) RP, (2) SS | Modified Drug Abuse Screening Test – Marijuana Problem Scale (data provided as total sample only) | (1) Unclear, N = 54, (2) Unclear, N = 56 | (1) Unclear, N = 45 [83.3%], (2) Unclear, N = 52 [92.9%] | (1) vs (2) P value < 0.05 |
| Stein 2011, (1) MET, (2) Assessed control | Marijuana Problem Scale (mean ± SD) | (1) 4.82 ± 4.66, N = 163, (2) 4.99 ± 4.71, N = 169 | (1) Unclear, N = 126 [77.3%], (2) Unclear, N = 136 [80.5%] | (1) vs (2) P value > 0.05 |
| Stephens 1994, (1) RP, (2) SS | Drug Abuse Screening Test (mean ± SD) | (1) 8.88 ± 2.86, N = 106, (2) 6.31 ± 4.28, N = 106 | (1) 3.27 ± 3.41, N = 80 [75.5%], (2) 2.91 ± 3.64, N = 87 [82.1%] | (1) vs (2) P value > 0.05 |
| Stephens 2000, (1) MET, (2) CBT, (3) Assessed control | Marijuana Problem Scale (mean ± SD) | (1) 9.99 ± 2.89, N = 88, (2) 9.86 ± 3.05, N = 117, (3) 9.78 ± 2.96, N = 86 | (1) 12.99 ± 11.61, N = 80 [90.9%], (2) 12.29 ± 12.34, N = 103 [88.0%], (3) 7.89 ± 4.23, N = 79 [91.9%] | (1) vs (2) P value > 0.05; (1) vs (3) P value < 0.001; (2) vs (3) P value < 0.001 [significant at EoT only] |
| Stephens 2007, (1) MET, (2) Drug‐related health education, (3) DTC | Marijuana Problem Scale (mean ± SE) | (1) 6.37 ± 3.71, N = 62, (2) 5.31 ± 3.53, N = 62, (3) 6.31 ± 4.28, N = 64 | (1) 3.95 ± 0.40, N = 49 [79.0%], (2) 5.21 ± 0.40, N = 52 [83.9%], (3) 5.01 ± 0.40, N = 62 [96.9%] | (1) vs (2) P value > 0.05; (1) vs (3) P value > 0.05; (2) vs (3) P value > 0.05 |
| * Unless otherwise indicated by *, significant treatment outcomes favour the group with the lower number; exact P values are reported when provided CBT: Cognitive‐behavioural therapy CM‐abs: Contingency management with vouchers presented for negative urine CM‐adh: Contingency Management with vouchers presented for treatment attendance/adherence DC: Drug counselling EoT: End of treatment FU: Follow‐up MET: Motivational enhancement therapy RP: Relapse prevention SD: Standard deviation SE: Standard error SS: Social support TAU: Treatment as usual | ||||
| Study | Intended number of sessions | Intended treatment duration, weeks | Treatment adherence, % | Completed sessions, mean ± SD |
| CBT | ||||
| 1 | n/a | 87.8% attended | n/a | |
| 6 | 6 | 91% attended ≥ 1; 50% completed | 4.2 ± 2.2 | |
| 12 | 12 | 53.1% completed treatment | 5.9 ± 3.8* | |
| 14 | 14 | 50% attended 10 or more sessions including sessions 9 and 10 | 8.42 ± 3.51 | |
| CBT + CM‐abs | ||||
| 14 | 14 | 87% provided 3 or more urine specimens | 9.6 ± 4.9 | |
| 12 | 12 | 47.2% completed treatment | 5.9 ± 3.8* | |
| CBT + CM‐adh | ||||
| 14 | 14 | 87% provided 3 or more urine specimens | 8.8 ± 5.0 | |
| 12 | 12 | 59.4% completed treatment | 5.9 ± 3.8* | |
| MET | ||||
| 4 | 14 | 45% completed ≥ 1 session and provided ≥ 1 urine specimen during the final 2 weeks of treatment | ‐ | |
| 2 | 4 | 80.4% completed treatment | 1.7 ± 0.6 | |
| 2 | 6 | 71.9% completed treatment | 1.6 | |
| 1 | 7 | 88.7% completed treatment | ‐ | |
| MET + CBT | ||||
| 9 | 12 | 47% completed treatment | 6.5 | |
| 2 | 56 | 100% completed ≥ 1 session | ‐ | |
| 4 | 4 | 85.7% completed treatment | ‐ | |
| 4 | 12 | 67.3% completed treatment | ‐ | |
| 9 | 9 | ‐ | 4.9 ± 3.3 | |
| 8 | 8 | 66.7% completed treatment | ‐ | |
| 10 | 5‐8 | 87.8% completed treatment | 7 | |
| 10 | 8‐12 | 65.1% completed treatment | ||
| 13 | 18 | 54.2% “declined the intervention” | ‐ | |
| 14 | 14 | 65% completed ≥ 1 session | ||
| MET + CBT + CM‐abs | ||||
| 14 | 14 | 55% completed ≥ 1 session | ‐ | |
| 9 | 9 | ‐ | 5.5 ± 3.8 | |
| 9 | 9 | ‐ | 5.6 ± 3.6 | |
| MET + CBT + CM‐adh | ||||
| 9 | 9 | ‐ | 5.7 ± 3.5 | |
| MET + CBT + CM‐abs + CM‐adh | ||||
| 8 | 8 | 69.7% completed treatment | 5.1 ± 2.5 | |
| DC | ||||
| 8 | 8 | 39.4% completed treatment | ‐ | |
| 10 | 12 | ‐ | 7.6 ± 2.8 | |
| Drug‐related health education | ||||
| 1 | 7 | 93.5% completed treatment | ‐ | |
| DC + CM‐abs + CM‐adh | ||||
| 8 | 8 | 63.7% completed treatment | ‐ | |
| MM | ||||
| 2 | 2 | 72.7% completed treatment | ||
| RP | ||||
| 10 | 12 | 87.8% received ≥ 4 sessions | 7.54* | |
| 14 | 18 | 69% attended 7 or more sessions* | 7.6 ± 2.5* | |
| SS | ||||
| 10 | 12 | 73.2% received ≥ 4 sessions | 7.54* | |
| 14 | 18 | 69% attended 7 or more sessions* | 7.6 ± 2.5* | |
| CM‐abs | ||||
| 12 | 12 | 83% provided 3 or more urine specimens | ‐ | |
| 12 | 12 | 59.3% completed treatment | ‐ | |
| 9 | 9 | ‐ | 5.5 ± 3.8 | |
| * These data were reported as a total sample only, although no between‐group differences were noted across interventions CBT: Cognitive‐behavioural therapy CM‐abs: Contingency management with vouchers presented for negative urine CM‐adh: Contingency management with vouchers presented for treatment attendance/adherence DC: Drug counselling DTC: Delayed treatment control MET: Motivational enhancement therapy MM: Mindfulness meditation RP: Relapse prevention SS: Social support | ||||
| Study and group | Measure | Baseline | Follow‐up [% with data] | Significance* |
| Bonsack 2011, (1) MET, (2) TAU | The Contemplation Ladder; a scale score from 0‐100 of readiness, importance and confidence to change (median) | (1) 50.0, 50.0, 50.0, N = 30, (2) 50.0, 25.0, 50.0, N = 32 | (1) 56.25, 50.0, 75.0, N = 25 [83.3%], (2) 50.0, 50.0, 60.0, N = 29 [90.6%] | (1) vs (2) P value > 0.05, P value > 0.05, P value = 0.02 on the ‘confidence’ score at 3 month FU only, d = 0.64 |
| Budney 2000, (1) MET + CBT + CM‐abs, (2) MET + CBT, (3) MET | Adapted University of Rhode Island Change Assessment score, Situational Confidence Questionnaire (overall score least squares mean ± SE) | (1) 9.1 ± 0.36, 55.4 ± 3.9, N = 20, (2) 9.6 ± 3.5, 50.7 ± 3.9, N = 20, (3) 9.4 ± 0.34, 55.1 ± 4.3, N = 20 | (1) 8.5 ± 0.56, 68.4 ± 6.4, N = 14 [70.0%], (2) 8.6 ± 0.45, 79.0 ± 5.4, N = 15 [75.0%], (3) 6.6 ± 0.64, 58.3 ± 7.4, N = 16 [80.0%] | (1) vs (2)* P value > 0.05, P value < 0.05 [favours group 2]; (1) vs (3) P value > 0.05, P value > 0.05 (2) vs (3)* P value > 0.05, P value < 0.05 [favours group 2] |
| Edwards 2006, (1) DC, (2) TAU | Readiness to Change Questionnaire‐Cannabis (% in ‘action’ stage) | (1) 25.0, N = 23, (2) 29.5, N = 24 | (1) 27.3, N = 16 [69.6%], (2) 38.6, N = 17 [70.8%] | (1) vs (2) P value > 0.05 |
| Litt 2013, (1) MET + CBT + CM‐abs, (2) MET + CBT + CM‐adh, (3) Assessed control | Marijuana Self‐Efficacy Questionnaire, Coping Strategies Scale, Readiness to Change Questionnaire (data provided in unclear figure) | (1) Unclear, N = 73, (2) Unclear, N = 71, (3) Unclear, N = 71 | (1) Unclear, N = 60 [82.2%], (2) Unclear, N = 61 [85.9%], (3) Unclear, N = 61 [85.9%] | (1) vs (2) all P value > 0.05; (1) vs (3) all P value > 0.05; (2) vs (3) all P value > 0.05 |
| Stein 2011, (1) MET, (2) Assessed control | Percent with a desire to abstain (%) | (1) 56.8, N = 163, (2) 63.5, N = 169 | (1) 77.3, N = 126 [77.3%], (2) 80.5, N = 136 [80.5%] | (1) vs (2) P value > 0.05 |
| Stephens 2007, (1) MET, (2) Drug‐related health education, (3) DTC | Readiness to Change Questionnaire (% in pre‐contemplation or contemplation stage) | (1) 68, N = 62, (2) 87, N = 62, (3) 70, N = 64 | (1) Unclear, N = 49 [79.0%], (2) Unclear, N = 52 [83.9%], (3) Unclear, N = 62 [96.9%] | (1) vs (2) P value > 0.05; (1) vs (3) P value > 0.05; (2) vs (3) P value > 0.05 |
| * Unless otherwise indicated, significant treatment outcomes favour the group with the lower number; exact P values are reported when provided CBT: Cognitive‐behavioural therapy CM‐abs: Contingency management with vouchers presented for negative urine CM‐adh: Contingency management with vouchers presented for treatment attendance/adherence DC: Drug counselling DTC: Delayed treatment control EoT: End of treatment FU: Follow‐up MET: Motivational enhancement therapy RP: Relapse prevention SE: Standard error TAU: Treatment as usual | ||||
| Study and group | Measure | Baseline | Follow‐up [% with data] | Significance* |
| Budney 2000, (1) MET + CBT + CM‐abs, (2) MET + CBT, (3) MET | Addiction Severity Index ‘alcohol’ and ‘drug use’ composite scores (least squares mean ± SE) | (1) 0.9 ± 0.01, 0.22 ± 0.01, N = 20, (2) 0.12 ± 0.01, 0.20 ± 0.01, N = 20, (3) 0.07 ± 0.01, 0.21 ± 0.01, N = 20 | (1) 0.11 ± 0.02, 0.01 ± 0.02, N = 14 [70.0%], (2) 0.11 ± 0.02, 0.07 ± 0.02, N = 15 [75.0%], (3) 0.08 ± 0.02, 0.11 ± 0.02, N = 16 [80.0%] | (1) vs (2) P value > 0.05, P value < 0.05 [f = 0.23]; (1) vs (3) P value > 0.05, P value < 0.05 [f = 0.23]; (2) vs (3) P value > 0.05, P value > 0.05 |
| Budney 2006, (1) CBT + CM‐abs, (2) CBT + CM‐adh, (3) CM‐abs | Addiction Severity Index ‘alcohol’ and ‘drug use’ composite scores (mean ± SD) | (1) 0.09 ± 0.10, 0.23 ± 0.09, N = 30, (2) 0.10 ± 0.13, 0.25 ± 0.09, N = 30, (3) 0.11 ± 0.11, 0.24 ± 0.08, N = 30 | (1) Unclear, N = 21 [70.0%], (2) Unclear, N = 24 [80.0%], (3) Unclear, N = 22 [73.3%] | (1) vs (2) P value > 0.05; (1) vs (3) P value > 0.05; (2) vs (3) P value > 0.05 |
| Carroll 2006, (1) MET + CBT + CM‐abs + CM‐adh, (2) DC + CM‐abs + CM‐adh, (3) MET + CBT, (4) DC | Addiction Severity Index for alcohol and drug use (data not provided) | (1) Unclear, N = 33, (2) Unclear, N = 34, (3) Unclear, N = 36, (4) Unclear, N = 33 | (1) Unclear, N = 27 [81.8%], (2) Unclear, N = 24 [70.6%], (3) Unclear, N = 27 [75.0%], (4) Unclear, N = 30 [90.9%] | (1) vs (2) P value > 0.05; (1) vs (3) P value > 0.05; (1) vs (4) P value > 0.05; (2) vs (3) P value > 0.05; (3) vs (4) P value > 0.05; (2) vs (4) P value > 0.05 |
| Hoch 2012, (1) MET + CBT, (2) DTC | Addiction Severity Index ‘alcohol’ and ‘drug use’ composite scores (mean ± SD) | (1) 10.0 ± 1.0, 10.0 ± 0.7, N = 90, (2) 9.9 ± 0.8, 10.0 ± 0.7, N = 32 | (1) 11.0 ± 9.7, 3.0 ± 4.0, N = 79 [87.8%], (2) 13.7 ± 13.3, 8.3 ± 3.5, N = 31 [96.9%] | (1) vs (2) P value > 0.05, P value > 0.05 |
| Hoch 2014, (1) MET + CBT, (2) DTC | Litres per consumption day of alcohol (mean ± SD), proportion of daily smokers (%), proportion using any illicit drug (%) | (1) 0.2 ± 0.3, 78.2, 10.6, N = 166, (2) 0.2 ± 0.3, 82.0, 7.1, N = 130 | (1) 0.2 ± 0.4, 78.5, 13.0, N = 166 [100%], (2) 0.2 ± 0.02, 82.1, 8.6, N = 106 [81.5%] | (1) vs (2) P value > 0.05, P value > 0.05, P value > 0.05 |
| Jungerman 2007, (1) MET + CBT [3 months], (2) MET + CBT [1 month], (3) DTC | Percent of days post baseline used alcohol (mean ± SE), Addiction Severity Index drug use composite score (mean ± SE) | (1) 10.03 ± 2.20, 3.02 ± 0.21, N = 52, (2) 11.16 ± 2.12, 2.87 ± 0.20, N = 56, (3) 10.06 ± 2.20, 3.38 ± 0.21, N = 52 | (1) 7.09 ± 2.07, 2.10 ± 0.21 N = 27 [51.9%], (2) 9.13 ± 1.99, 2.77 ± 0.20, N = 37 [66.1%], (3) 9.01 ± 2.07, 2.81 ± 0.21, N = 35 [67.3%] | (1) vs (2) P value > 0.05, P value = 0.0121; (1) vs (3) P value > 0.05, P value > 0.05; (2) vs (3) P value > 0.05, P value > 0.05 |
| Kadden 2007 (1) MET + CBT + CM‐abs, (2) MET + CBT, (3) CM‐abs, (4) Health education | Addiction Severity Index ‘alcohol’ and ‘drug use’ composite scores (mean ± SD) | (1) 0.09 ± 0.10, 0.26 ± 0.05, N = 63, (2) 0.12 ± 0.12, 0.25 ± 0.07, N = 61, (3) 0.11 ± 0.14, 0.23 ± 0.07, N = 54, (4) 0.09 ± 0.09, 0.23 ± 0.07, N = 62 | (1) Unclear, N = 51 [81.0%], (2) Unclear, N = 49 [80.3%], (3) Unclear, N = 48 [88.9%], (4) Unclear, N = 52 [83.9%] | (1) vs (2) P value > 0.05, P value > 0.05; (1) vs (3) P value > 0.05, P value > 0.05; (1) vs (4) P value > 0.05, P value > 0.05; (2) vs (3) P value > 0.05, P value > 0.05; (3) vs (4) P value > 0.05, P value > 0.05; (2) vs (4) P value > 0.05, P value > 0.05 |
| MTPRG 2004, (1) MET + CBT, (2) MET, (3) Assessed control | Days alcohol used in prior 90 days (mean ± SD), Addiction Severity Index for alcohol (mean ± SD) | (1) 48.79 ± 79.10, 0.11 ± 0.13, N = 156, (2) 59.41 ± 84.56, 0.12 ± 0.13, N = 146, (3) 46.57 ± 85.48, 0.11 ± 0.12, N = 148 | (1) 46.12 ± 106.70, 0.10 ± 0.11, N = 129 [82.7%], (2) 45.56 ± 76.62, 0.12 ± 0.13, N = 120 [82.2%], (3) 42.92 ± 62.48, 0.11 ± 0.12, N = 137 [92.6%] | (1) vs (2) P value > 0.05, P value > 0.05; (1) vs (3) P value > 0.05, P value > 0.05; (2) vs (3) P value > 0.05, P value > 0.05 |
| Roffman 1988, (1) RP, (2) SS | Occasions of use in prior week for alcohol and tobacco, proportion reporting any illicit drug use (data provided for total sample only) | (1) Unclear, N = 54, (2) Unclear, N = 56 | (1) Unclear, N = 45 [83.3%], (2) Unclear, N = 52 [92.9%] | (1) vs (2) P value > 0.05 |
| Stephens 1994, (1) RP, (2) SS | Average occasions of use in a typical week for alcohol and illicit drugs in the prior 90 days, number of alcohol‐related and drug‐related problem scores from the Drug Abuse Screening Test (data provided for total sample only) | (1) Unclear, N = 106, (2) Unclear, N = 106 | (1) Unclear, N = 80 [75.5%], (2) Unclear, N = 87 [82.1%] | (1) vs (2) all P value > 0.05 |
| Stephens 2000, (1) MET, (2) CBT, (3) Assessed control | Frequency of alcohol and other drug use in the prior 90 days, number of alcohol and drug‐related problems from unclear 19‐item assessment (mean) | (1) Unclear, N = 88, (2) Unclear, N = 117, (3) Unclear, N = 86 [data reported as total sample only] | (1) 0.48, N = 80 [90.9%], (2) 0.76, N = 103 [88.0%], (3) 5.01, N = 79 [91.9%] [data reported as total sample only, with the exception of other drug use frequency] | (1) vs (2) all P value > 0.05; (1) vs (3) all P value > 0.05, except other drug use frequency P value < 0.05; (2) vs (3) all P value > 0.05, except other drug use frequency P value < 0.05 [significant at EoT only] |
| Stephens 2007, (1) MET, (2) Drug‐related health education, (3) DTC | Days used in prior week for alcohol and illicit drugs and number of alcohol and drug‐related problems from unclear assessment (mean ± SD when provided) | (1) 2.00 ± 2.08, 0.16 ± 0.43, Unclear, N = 62, (2) 1.38 ± 1.63, 0.13 ± 0.23, Unclear, N = 62, (3) 1.90 ± 2.12, 0.11 ± 0.19, Unclear, N = 64 | (1) Unclear, N = 49 [79.0%], (2) Unclear, N = 52 [83.9%], (3) Unclear, N = 62 [96.9%] | (1) vs (2) all P value > 0.05; (1) vs (3) all P value > 0.05; (2) vs (3) all P value > 0.05 |
| * Unless otherwise indicated by *, significant treatment outcomes favour the group with the lower number; exact P values are reported when provided CBT: Cognitive‐behavioural therapy CM‐abs: Contingency management with vouchers presented for negative urine CM‐adh: Contingency management with vouchers presented for treatment attendance/adherence DC: Drug counselling DTC: Delayed treatment control EoT: End of treatment FU: Follow‐up MET: Motivational enhancement therapy RP: Relapse prevention SD: Standard deviation SE: Standard error SS: Social support TAU: Treatment as usual | ||||
| Study and group | Measure | Baseline | Follow‐up [% with data] | Significance* |
| Bonsack 2011, (1) MET, (2) TAU | PANSS‐P, PANSS‐N, GAF, SOFAS, Proportion admitted to hospital during trial period (median ± range) | (1) 17.0 ± 19.0, 18.0 ± 18, 40.0 ± 20.0, 40.0 ± 19.0, n/a, N = 30, (2) 17.0 ± 21.0, 17.5 ± 13, 40.0 ± 40.0, 40.0 ± 40.0, n/a, N = 32 | (1) 16.0 ± 22, 17.0 ± 16.0, 40 ± 24, 40.5 ± 24, 30.0, N = 25 [83.3%], (2) 16.0 ± 20.0, 17.5 ± 17.0, 40.0 ± 40.0, 41.0 ± 30.0, 34.4, N = 29 [90.6%] | (1) vs (2) P value > 0.05, P value > 0.05, P value > 0.05, P value > 0.05, P value > 0.05 |
| Budney 2000, (1) MET + CBT + CM‐abs, (2) MET + CBT, (3) MET | Global Symptom Index of the Brief Symptom Inventory (least squares, mean ± SE) | (1) 68.1 ± 1.8, N = 20, (2) 65.6 ± 1.8, N = 20, (3) 67.9 ± 1.9, N = 20 | (1) 58.9 ± 2.9, N = 14 [70.0%], (2) 55.4 ± 2.3, N = 15 [75.0%], (3) 58.7 ± 3.4, N = 16 [80.0%] | (1) vs (2) P value > 0.05; (1) vs (3) P value > 0.05; (2) vs (3) P value > 0.05 |
| Budney 2006, (1) CBT + CM‐abs, (2) CBT + CM‐adh, (3) CM‐abs | Global Symptom Index of the Brief Symptom Inventory, Beck Depression Inventory (least squares, mean ± SD) | (1) 1.0 ± 0.79, 14.2 ± 11.7, N = 30, (2) 1.1 ± 0.93, 15.6 ± 12.0, N = 30, (3) 1.1 ± 0.79, 15.0 ± 12.1, N = 30 | (1) Unclear, Unclear, N = 21 [70.0%], (2) Unclear, Unclear, N = 24 [80.0%], (3) Unclear, Unclear, N = 22 [73.3%] | (1) vs (2) P value > 0.05; (1) vs (3) P value > 0.05; (2) vs (3) P value > 0.05 |
| Carroll 2006, (1) MET + CBT + CM‐abs, + CM‐adh, (2) DC + CM‐abs + CM‐adh, (3) MET + CBT, (4) DC | Addiction Severity Index composite scores (data not shown) | (1) Unclear, N = 33, (2) Unclear, N = 34, (3) Unclear, N = 36, (4) Unclear, N = 33 | (1) Unclear, N = 27 [81.8%], (2) Unclear, N = 24 [70.6%], (3) Unclear, N = 27 [75.0%], (4) Unclear, N = 30 [90.9%] | (1) vs (2) P value > 0.05; (1) vs (3) P value > 0.05; (1) vs (4) P value > 0.05; (2) vs (3) P value > 0.05; (3) vs (4) P value = 0.05 [for the ‘legal’ score across FU]; (2) vs (4) P value > 0.05 |
| Copeland 2001, (1) CBT [6‐session], (2) CBT [1‐session], (3) DTC | Symptom Checklist‐90 Global Severity Index (mean ± SD) | (1) 0.7 ± 0.3, N = 78, (2) 0.7 ± 0.4, N = 82, (3) 0.7 ± 0.3, N = 69 | (1) 0.6 ± 0.3, N = 58 [74.4%], (2) 0.5 ± 0.4, N = 61 [74.4%], (3) 0.6 ± 0.4, N = 52 [75.4%] | (1) vs (2) P value > 0.05; (1) vs (3) P value > 0.05; (2) vs (3) P value > 0.05 |
| Edwards 2006, (1) DC, (2) TAU | BPRS‐E, BPRS‐PS, SANS, BDI‐SF, SOFAS, KAPQ (mean ± SD) | (1) 49.9 ± 16.3, 10.3 ± 5.4, 28 ± 16, 10.4 ± 6.6, 48.7 ± 17.2, 21.2 ± 3.9, N = 23, (2) 48.8 ±1 7, 10.8 ± 5.2, 24.7 ± 13.6, 8.8 ± 8.1, 49.8 ± 14.8, 20.3 ± 5.4, N = 24 | (1) 45.6 ± 13.5, 9.4 ± 4.6, 23.7 ± 17.2, 7.5 ± 6.3, 51.7 ± 18.3, 22.4 ± 4.0, N = 16 [69.6%], (2) 44.8 ± 15.4, 8.8 ± 4.8, 19.4 ± 13.5, 6.3 ± 7.2, 56.4 ± 15.9, 21.5 ± 4.1, N = 17 [70.8%] | (1) vs (2) all P value > 0.05 |
| Hoch 2012, (1) MET + CBT, (2) DTC | Brief Symptom Inventory, disability days in the prior month using the M‐CIDI (mean ± SD) | (1) 0.9 ± 0.6, 9.4 ± 10.2, N = 90, (2) 0.9 ± 0.5, 6.6 ± 8.7, N = 32 | (1) 0.4 ± 0.4, 3.2 ± 5.9, N = 79 [87.8%], (2) 0.7 ± 0.5, 6.5 ± 9.6, N = 31 [96.9%] | (1) vs (2) P value > 0.05, P value < 0.05 |
| Kadden 2007, (1) MET + CBT + CM‐abs, (2) MET + CBT, (3) CM‐abs, (4) Health education | Psychiatric composite score from the Addiction Severity Index (mean ± SD) | (1) 0.25 ± 0.19, N = 63, (2) 0.24 ± 0.20, N = 61, (3) 0.25 ± 0.21, N = 54, (4) 0.22 ± 0.23, N = 62 | (1) Unclear, N = 51 [81.0%], (2) Unclear, N = 49 [80.3%], (3) Unclear, N = 48 [88.9%], (4) Unclear, N = 52 [83.9%] | (1) vs (2) P value > 0.05; (1) vs (3) P value > 0.05; (1) vs (4) P value > 0.05; (2) vs (3) P value > 0.05; (3) vs (4) P value > 0.05; (2) vs (4) P value > 0.05 |
| Madigan 2013, (1) MET + CBT, (2) TAU | Insight composite of the BIS, SAPS, SANS, CDSS, GAF, WHOQOL (mean ± SD) | (1) 6.8 ± 2.8, 5.4 ± 4.0, 7.7 ± 3.1, 5.1 ± 5.7, 38.3 ± 13.1, 12.5 ± 4.0, N = 59, (2) 6.3 ± 2.7, 5.7 ± 4.8, 7.4 ± 3.0, 5.0 ± 6.4, 38.0 ± 9.0, 13.3 ± 2.8, N = 29 | (1) 7.0 ± 2.9, 4.9 ± 4.0, 4.6 ± 3.0, 4.3 ± 4.4, 37.6 ± 8.34, 12.6 ± 3.4, N = 32 [54.2%], (2) 6.6 ± 1.5, 5.1 ± 4.2, 4.8 ± 3.2, 4.3 ± 4.2, 37.2 ± 11.5, 11.1 ± 2.9, N = 19 [65.5%] | (1) vs (2) all P value > 0.05, except for the WHOQOL at P value = 0.05 |
| MTPRG 2004, (1) MET + CBT, (2) MET, (3) Assessed control | Beck Depression Inventory, STAI‐S (mean ± SD) | (1) 11.39 ± 7.00, 39.87 ± 11.62, N = 156, (2) 13.21 ± 8.60, 41.61 ± 12.19, N = 146, (3) 10.09 ± 7.35, 37.29 ± 11.53, N = 148 | (1) 7.34 ± 8.29, 33.61 ± 11.32, N = 129 [82.7%], (2) 10.16 ± 9.36, 38.85 ± 12.66, N = 120 [82.2%], (3) 7.87 ± 6.78, 35.50 ± 11.21, N = 137 [92.6%] | (1) vs (2) P value > 0.05, P value < 0.05 at 4 month FU only; (1) vs (3) P value > 0.05, P value < 0.05; (2) vs (3) P value > 0.05, P value > 0.05 |
| * Unless otherwise indicated, significant treatment outcomes favour the group with the lower number; exact P values are reported when provided BDI‐SF: Beck Depression Inventory‐Short Form BIS: Birchwood Insight Scale BPRS‐E: Brief Psychiatric Rating Scale‐Expanded BPRS‐PS: Brief Psychiatric Rating Scale‐Positive Symptom subscale CBT: Cognitive‐behavioural therapy CDSS: Calgary Depression Scale for Schizophrenia CM‐abs: Contingency management with vouchers presented for negative urine CM‐adh: Contingency management with vouchers presented for treatment attendance/adherence DC: Drug counselling DTC: Delayed treatment control EoT: End of treatment FU: Follow‐up GAF: Global Assessment of Functioning scale KAPQ: Knowledge About Psychosis Questionnaire M‐CIDI: Munich‐Composite International Diagnostic Interview MET: Motivational enhancement therapy PANSS: Positive and Negative Syndrome Scale SANS: Scale for the Assessment of Negative Symptoms SAPS: Scale for the Assessment of Positive Symptoms SD: Standard deviation SE: Standard error SOFAS: Social and Occupational Functioning Scale TAU: Treatment as usual WHOQOL: World Health Organization, Quality of Life assessment | ||||
| Outcome or subgroup title | No. of studies | No. of participants | Statistical method | Effect size |
| 1 Reductions in cannabis use frequency at short‐term follow‐up Show forest plot | 6 | 1144 | Mean Difference (IV, Random, 95% CI) | 5.67 [3.08, 8.26] |
| 2 Reduction in cannabis use frequency at short‐term follow‐up (intervention intensity) Show forest plot | 6 | 1144 | Mean Difference (IV, Random, 95% CI) | 6.39 [4.01, 8.78] |
| 2.1 Low‐intensity intervention | 6 | 763 | Mean Difference (IV, Random, 95% CI) | 4.58 [2.65, 6.50] |
| 2.2 High‐intensity intervention | 3 | 381 | Mean Difference (IV, Random, 95% CI) | 10.02 [7.69, 12.34] |
| 3 Reduction in cannabis use frequency at short‐term follow‐up (intervention type) Show forest plot | 6 | 1144 | Mean Difference (IV, Random, 95% CI) | 6.34 [3.80, 8.88] |
| 3.1 MET | 4 | 612 | Mean Difference (IV, Random, 95% CI) | 4.45 [1.90, 7.00] |
| 3.2 CBT | 1 | 134 | Mean Difference (IV, Random, 95% CI) | 10.94 [7.44, 14.44] |
| 3.3 MET + CBT | 3 | 398 | Mean Difference (IV, Random, 95% CI) | 7.38 [3.18, 11.57] |
| 4 Point‐prevalence abstinence at short‐term follow‐up Show forest plot | 6 | 1166 | Risk Ratio (M‐H, Random, 95% CI) | 2.55 [1.34, 4.83] |
| 5 Point‐prevalence abstinence at short‐term follow‐up (intervention intensity) Show forest plot | 6 | 1166 | Risk Ratio (M‐H, Random, 95% CI) | 1.96 [1.20, 3.21] |
| 5.1 Low‐intensity intervention | 4 | 435 | Risk Ratio (M‐H, Random, 95% CI) | 0.92 [0.51, 1.66] |
| 5.2 High‐intensity intervention | 5 | 731 | Risk Ratio (M‐H, Random, 95% CI) | 3.09 [2.23, 4.29] |
| 6 Point‐prevalence abstinence at short‐term follow‐up (intervention type) Show forest plot | 6 | 1166 | Risk Ratio (M‐H, Random, 95% CI) | 2.17 [1.24, 3.80] |
| 6.1 MET | 1 | 197 | Risk Ratio (M‐H, Random, 95% CI) | 1.19 [0.43, 3.28] |
| 6.2 CBT | 1 | 171 | Risk Ratio (M‐H, Random, 95% CI) | 4.81 [1.17, 19.70] |
| 6.3 MET + CBT | 5 | 798 | Risk Ratio (M‐H, Random, 95% CI) | 2.17 [1.10, 4.32] |
| 7 Reduction in joints per day at short‐term follow‐up Show forest plot | 8 | 1600 | Std. Mean Difference (IV, Random, 95% CI) | 3.55 [2.51, 4.59] |
| 8 Reduction in joints per day at short‐term follow‐up (intervention intensity) Show forest plot | 8 | 1600 | Std. Mean Difference (IV, Random, 95% CI) | 3.71 [2.71, 4.71] |
| 8.1 Low‐intensity intervention | 6 | 752 | Std. Mean Difference (IV, Random, 95% CI) | 2.70 [1.69, 3.70] |
| 8.2 High‐intensity intervention | 6 | 848 | Std. Mean Difference (IV, Random, 95% CI) | 4.74 [3.49, 6.00] |
| 9 Reduction in joints per day at short‐term follow‐up (intervention type) Show forest plot | 8 | 1600 | Std. Mean Difference (IV, Random, 95% CI) | 3.90 [2.82, 4.98] |
| 9.1 MET | 4 | 611 | Std. Mean Difference (IV, Random, 95% CI) | 3.17 [2.67, 3.66] |
| 9.2 CBT | 2 | 306 | Std. Mean Difference (IV, Random, 95% CI) | 3.40 [‐1.05, 7.84] |
| 9.3 MET + CBT | 4 | 683 | Std. Mean Difference (IV, Random, 95% CI) | 4.88 [3.14, 6.62] |
| 10 Reduction in symptoms of dependence at short‐term follow‐up Show forest plot | 4 | 889 | Std. Mean Difference (IV, Random, 95% CI) | 4.15 [1.67, 6.63] |
| 11 Reduction in symptoms of dependence at short‐term follow‐up (intervention intensity) Show forest plot | 4 | 889 | Std. Mean Difference (IV, Random, 95% CI) | 5.56 [2.73, 8.39] |
| 11.1 Low‐intensity intervention | 3 | 370 | Std. Mean Difference (IV, Random, 95% CI) | 2.83 [0.41, 5.24] |
| 11.2 High‐intensity intervention | 3 | 519 | Std. Mean Difference (IV, Random, 95% CI) | 8.37 [2.51, 14.23] |
| 12 Symptoms of dependence at short‐term follow‐up (intervention type) Show forest plot | 4 | 889 | Std. Mean Difference (IV, Random, 95% CI) | 6.32 [3.15, 9.50] |
| 12.1 MET | 2 | 316 | Std. Mean Difference (IV, Random, 95% CI) | 4.07 [1.97, 6.17] |
| 12.2 MET + CBT | 3 | 573 | Std. Mean Difference (IV, Random, 95% CI) | 7.89 [0.93, 14.85] |
| 13 Reduction in cannabis‐related problems at short‐term follow‐up Show forest plot | 6 | 2202 | Std. Mean Difference (IV, Random, 95% CI) | 3.34 [1.26, 5.42] |
| 14 Reduction in cannabis‐related problems at short‐term follow‐up (intervention intensity) Show forest plot | 6 | 2202 | Std. Mean Difference (IV, Random, 95% CI) | 3.70 [1.91, 5.49] |
| 14.1 Low‐intensity intervention | 5 | 667 | Std. Mean Difference (IV, Random, 95% CI) | 2.50 [1.01, 3.98] |
| 14.2 High‐intensity intervention | 4 | 1535 | Std. Mean Difference (IV, Random, 95% CI) | 5.14 [2.57, 7.70] |
| 15 Reduction in cannabis‐related problems at short‐term follow‐up (intervention type) Show forest plot | 6 | 2202 | Std. Mean Difference (IV, Random, 95% CI) | 4.11 [2.22, 6.01] |
| 15.1 MET | 4 | 612 | Std. Mean Difference (IV, Random, 95% CI) | 3.29 [1.85, 4.72] |
| 15.2 CBT | 1 | 135 | Std. Mean Difference (IV, Random, 95% CI) | 7.88 [6.86, 8.90] |
| 15.3 MET + CBT | 3 | 1455 | Std. Mean Difference (IV, Random, 95% CI) | 3.85 [‐0.39, 8.10] |
| Outcome or subgroup title | No. of studies | No. of participants | Statistical method | Effect size |
| 1 Reduction in cannabis use frequency Show forest plot | 2 | 97 | Mean Difference (IV, Random, 95% CI) | 0.13 [‐2.00, 2.27] |
| 2 Reduction in severity of cannabis use disorder Show forest plot | 1 | 33 | Mean Difference (IV, Random, 95% CI) | 0.10 [‐0.82, 1.02] |
| Outcome or subgroup title | No. of studies | No. of participants | Statistical method | Effect size |
| 1 Reduction in cannabis use frequency Show forest plot | 6 | Mean Difference (IV, Random, 95% CI) | Subtotals only | |
| 1.1 RP vs SS | 1 | 97 | Mean Difference (IV, Random, 95% CI) | 5.55 [1.89, 9.21] |
| 1.2 MET vs DC | 1 | 112 | Mean Difference (IV, Random, 95% CI) | 3.99 [0.89, 7.08] |
| 1.3 MET vs CBT | 1 | 179 | Mean Difference (IV, Random, 95% CI) | ‐0.86 [‐3.86, 2.14] |
| 1.4 MET vs MET + CBT | 1 | 31 | Mean Difference (IV, Random, 95% CI) | ‐2.80 [‐9.94, 4.34] |
| 1.5 MET vs MET + CBT + CM‐abs (EoT) | 1 | 30 | Mean Difference (IV, Random, 95% CI) | ‐7.30 [‐13.68, ‐0.92] |
| 1.6 MET vs MET + CBT + CM‐abs | 1 | 266 | Mean Difference (IV, Random, 95% CI) | ‐4.96 [‐7.18, ‐2.74] |
| 1.7 CBT + CM‐abs vs CM‐abs | 1 | 43 | Mean Difference (IV, Random, 95% CI) | 4.9 [‐1.95, 11.75] |
| 1.8 CBT + CM‐adh vs CM‐abs | 1 | 46 | Mean Difference (IV, Random, 95% CI) | ‐0.70 [‐7.61, 6.21] |
| 1.9 CBT + CM‐abs vs CBT + CM‐adh | 1 | 45 | Mean Difference (IV, Random, 95% CI) | 5.60 [‐1.65, 12.85] |
| 2 Point‐prevalence abstinence Show forest plot | 8 | Odds Ratio (M‐H, Fixed, 95% CI) | Subtotals only | |
| 2.1 MET vs MET + CBT | 2 | 301 | Odds Ratio (M‐H, Fixed, 95% CI) | 3.59 [1.80, 7.20] |
| 2.2 MET + CBT vs MET + CBT + CM‐abs + CM‐adh | 1 | 43 | Odds Ratio (M‐H, Fixed, 95% CI) | 0.72 [0.21, 2.50] |
| 2.3 MET + CBT vs DC | 1 | 156 | Odds Ratio (M‐H, Fixed, 95% CI) | 1.38 [0.44, 4.38] |
| 2.4 DC vs DC + CM‐abs + CM‐adh | 1 | 41 | Odds Ratio (M‐H, Fixed, 95% CI) | 0.42 [0.10, 1.81] |
| 2.5 MET + CBT + CM‐abs + CM‐adh vs DC + CM‐abs + CM‐adh | 1 | 40 | Odds Ratio (M‐H, Fixed, 95% CI) | 1.38 [0.38, 5.07] |
| 2.6 MET + CBT vs DC + CM‐abs + CM‐adh | 1 | 39 | Odds Ratio (M‐H, Fixed, 95% CI) | 1.0 [0.26, 3.80] |
| 2.7 MET vs CBT | 1 | 170 | Odds Ratio (M‐H, Fixed, 95% CI) | 0.80 [0.43, 1.47] |
| 2.8 RP vs SS | 1 | 167 | Odds Ratio (M‐H, Fixed, 95% CI) | 1.06 [0.54, 2.08] |
| 2.9 MET + CBT (low intensity) vs MET + CBT (high intensity) | 1 | 64 | Odds Ratio (M‐H, Fixed, 95% CI) | 0.35 [0.03, 4.04] |
| 2.10 CBT + CM‐abs vs CBT + CM‐adh | 1 | 45 | Odds Ratio (M‐H, Fixed, 95% CI) | 1.85 [0.52, 6.62] |
| 2.11 CBT + CM‐abs vs CM‐abs | 1 | 43 | Odds Ratio (M‐H, Fixed, 95% CI) | 2.77 [0.69, 11.19] |
| 2.12 CBT + CM‐adh vs CM‐abs | 1 | 46 | Odds Ratio (M‐H, Fixed, 95% CI) | 1.5 [0.36, 6.23] |
| 2.13 CBT (low intensity) vs CBT (high intensity) | 1 | 119 | Odds Ratio (M‐H, Fixed, 95% CI) | 0.75 [0.30, 1.90] |
| 3 Reduction in joints used per day Show forest plot | 7 | Std. Mean Difference (IV, Random, 95% CI) | Subtotals only | |
| 3.1 MET vs CBT | 1 | 183 | Std. Mean Difference (IV, Random, 95% CI) | ‐1.63 [‐1.97, ‐1.29] |
| 3.2 MET vs MET + CBT + CM‐abs | 1 | 266 | Std. Mean Difference (IV, Random, 95% CI) | 0.22 [‐0.02, 0.46] |
| 3.3 MET vs DC | 1 | 101 | Std. Mean Difference (IV, Random, 95% CI) | 1.81 [1.35, 2.28] |
| 3.4 CBT (low intensity) vs CBT (high intensity) | 1 | 119 | Std. Mean Difference (IV, Random, 95% CI) | ‐3.15 [‐3.69, ‐2.61] |
| 3.5 RP vs SS | 1 | 97 | Std. Mean Difference (IV, Random, 95% CI) | ‐1.22 [‐1.66, ‐0.79] |
| 3.6 MET + CBT (low intensity) vs MET + CBT (high intensity) | 1 | 64 | Std. Mean Difference (IV, Random, 95% CI) | ‐0.08 [‐0.58, 0.41] |
| 3.7 CBT + CM‐adh vs CBT + CM‐abs | 1 | 52 | Std. Mean Difference (IV, Random, 95% CI) | 2.45 [1.72, 3.18] |
| 3.8 CBT + CM‐abs vs CM‐abs | 1 | 50 | Std. Mean Difference (IV, Random, 95% CI) | ‐0.03 [‐0.59, 0.52] |
| 3.9 CBT + CM‐adh vs CM‐abs | 1 | 50 | Std. Mean Difference (IV, Random, 95% CI) | 2.37 [1.63, 3.10] |
| 4 Reduction in symptoms of dependence Show forest plot | 5 | Std. Mean Difference (IV, Random, 95% CI) | Subtotals only | |
| 4.1 MET vs Drug education control | 1 | 101 | Std. Mean Difference (IV, Random, 95% CI) | 4.32 [3.60, 5.04] |
| 4.2 MET vs MET + CBT | 1 | 266 | Std. Mean Difference (IV, Random, 95% CI) | ‐1.78 [‐2.07, ‐1.50] |
| 4.3 MET vs CBT | 1 | 183 | Std. Mean Difference (IV, Random, 95% CI) | 0.06 [‐0.23, 0.36] |
| 4.4 MET + CBT (high intensity) vs MET + CBT (low intensity) | 1 | 64 | Std. Mean Difference (IV, Random, 95% CI) | 4.96 [3.95, 5.98] |
| 4.5 CBT (low intensity) vs CBT (high intensity) | 1 | 119 | Std. Mean Difference (IV, Random, 95% CI) | ‐2.66 [‐3.16, ‐2.16] |
| 5 Reduction in cannabis‐related problems Show forest plot | 4 | Mean Difference (IV, Random, 95% CI) | Subtotals only | |
| 5.1 MET vs MET + CBT | 2 | 292 | Mean Difference (IV, Random, 95% CI) | ‐0.34 [‐0.47, ‐0.22] |
| 5.2 MET vs MET + CBT + CM‐abs | 1 | 30 | Mean Difference (IV, Random, 95% CI) | 0.04 [‐0.22, 0.30] |
| 5.3 RP vs SS | 1 | 156 | Mean Difference (IV, Random, 95% CI) | ‐0.25 [‐0.29, ‐0.21] |
| 5.4 CBT (low intensity) vs CBT (high intensity) | 1 | 119 | Mean Difference (IV, Random, 95% CI) | ‐0.40 [‐0.46, ‐0.35] |
| 6 Treatment completion Show forest plot | 5 | Risk Ratio (M‐H, Random, 95% CI) | Subtotals only | |
| 6.1 MET vs MET + CBT (high intensity) | 1 | 302 | Risk Ratio (M‐H, Random, 95% CI) | 1.54 [1.26, 1.87] |
| 6.2 MET + CBT (low intensity) vs MET + CBT (high intensity) | 1 | 108 | Risk Ratio (M‐H, Random, 95% CI) | 1.27 [1.02, 1.58] |
| 6.3 CBT (low intensity) vs CBT (high intensity) | 1 | 160 | Risk Ratio (M‐H, Random, 95% CI) | 1.76 [1.39, 2.22] |
| 6.4 MET + CBT vs MET + CBT + CM‐abs + CM‐adh | 1 | 69 | Risk Ratio (M‐H, Random, 95% CI) | 0.96 [0.69, 1.32] |
| 6.5 DC vs DC + CM‐adh + CM‐abs | 1 | 67 | Risk Ratio (M‐H, Random, 95% CI) | 0.61 [0.37, 0.99] |
| 6.6 MET + CBT vs DC | 1 | 69 | Risk Ratio (M‐H, Random, 95% CI) | 1.69 [1.04, 2.74] |
| 6.7 MET + CBT vs DC + CM‐adh + CM‐abs | 1 | 70 | Risk Ratio (M‐H, Random, 95% CI) | 1.03 [0.73, 1.45] |
| 6.8 MET + CBT + CM‐abs + CM‐adh vs DC | 1 | 66 | Risk Ratio (M‐H, Random, 95% CI) | 1.77 [1.10, 2.86] |
| 6.9 MET + CBT + CM‐adh + CM‐abs vs DC + CM‐adh + CM‐abs | 1 | 67 | Risk Ratio (M‐H, Random, 95% CI) | 1.08 [0.77, 1.51] |
| 6.10 CBT vs CBT + CM‐abs | 1 | 68 | Risk Ratio (M‐H, Random, 95% CI) | 1.13 [0.70, 1.82] |
| 6.11 CBT vs CBT + CM‐adh | 1 | 68 | Risk Ratio (M‐H, Random, 95% CI) | 0.89 [0.58, 1.35] |
| 6.12 CBT + CM‐abs vs CBT + CM‐adh | 1 | 64 | Risk Ratio (M‐H, Random, 95% CI) | 0.79 [0.49, 1.26] |
| 6.13 CBT vs CM‐abs | 1 | 63 | Risk Ratio (M‐H, Random, 95% CI) | 0.89 [0.57, 1.38] |
| 6.14 CBT + CM‐abs vs CM‐abs | 1 | 59 | Risk Ratio (M‐H, Random, 95% CI) | 0.79 [0.49, 1.28] |
| 6.15 CBT + CM‐adh vs CM‐abs | 1 | 59 | Risk Ratio (M‐H, Random, 95% CI) | 1.00 [0.66, 1.53] |
| 7 Improvement in motivation to quit Show forest plot | 1 | Mean Difference (IV, Random, 95% CI) | Subtotals only | |
| 7.1 MET + CBT vs MET | 1 | 31 | Mean Difference (IV, Random, 95% CI) | 25.1 [9.79, 40.41] |
| 7.2 MET vs MET + CBT + CM‐abs | 1 | 30 | Mean Difference (IV, Random, 95% CI) | ‐9.8 [‐25.83, 6.23] |
| 7.3 MET + CBT vs MET + CBT + CM‐abs | 1 | 29 | Mean Difference (IV, Random, 95% CI) | 15.3 [‐0.56, 31.16] |
| 8 Reduction in alcohol use severity (ASI score) Show forest plot | 2 | Mean Difference (IV, Random, 95% CI) | Subtotals only | |
| 8.1 MET vs MET + CBT | 2 | 280 | Mean Difference (IV, Random, 95% CI) | ‐0.02 [‐0.07, 0.03] |
| 8.2 MET + CBT + CM‐abs vs MET | 1 | 30 | Mean Difference (IV, Random, 95% CI) | 0.8 [0.75, 0.85] |
| 8.3 MET + CBT + CM‐abs vs MET + CBT | 1 | 29 | Mean Difference (IV, Random, 95% CI) | 0.78 [0.73, 0.83] |
| 9 Reduction in drug use severity (ASI score) Show forest plot | 2 | Mean Difference (IV, Random, 95% CI) | Subtotals only | |
| 9.1 MET vs MET + CBT | 1 | 31 | Mean Difference (IV, Random, 95% CI) | ‐0.03 [‐0.08, 0.02] |
| 9.2 MET + CBT + CM‐abs vs MET | 1 | 30 | Mean Difference (IV, Random, 95% CI) | 0.11 [0.06, 0.16] |
| 9.3 MET + CBT + CM‐abs vs MET + CBT | 1 | 29 | Mean Difference (IV, Random, 95% CI) | 0.08 [0.03, 0.13] |
| 9.4 MET + CBT (high intensity) vs MET + CBT (low intensity) | 1 | 64 | Mean Difference (IV, Random, 95% CI) | 0.82 [0.12, 1.52] |
| 10 Reduction in frequency of alcohol use Show forest plot | 2 | Mean Difference (IV, Random, 95% CI) | Subtotals only | |
| 10.1 MET vs MET + CBT | 1 | 249 | Mean Difference (IV, Random, 95% CI) | 11.18 [‐13.43, 35.79] |
| 10.2 MET + CBT (high intensity) vs MET + CBT (low intensity) | 1 | 64 | Mean Difference (IV, Random, 95% CI) | 0.82 [‐5.58, 7.21] |