مداخلات روانیاجتماعی برای اختلال مصرف کانابیس
چکیده
پیشینه
اختلال مصرف کانابیس، شایعترین اختلال مصرف مواد غیرقانونی در جمعیت عمومی است که گزارش میشود؛ اگر چه تقاضا برای کمک از مراکز خدمات سلامت در سطح بینالمللی در حال افزایش است، فقط تعداد کمی از افراد مبتلا به این اختلال به دنبال کمکهای حرفهای هستند. مطالعات مربوط به درمان منتشر شدهاند، اما فشار برای اعمال سیاست عمومی نیاز به انجام یک مرور سیستماتیک بهروزشده درباره درمانهای مختص کانابیس برای بزرگسالان دارد.
اهداف
بررسی اثربخشی مداخلات روانیاجتماعی برای اختلال مصرف کانابیس (در مقایسه با کنترل غیرفعال و/یا درمان جایگزین) ارائه شده به بزرگسالان در شرایط سرپایی یا در سطح جامعه.
روشهای جستوجو
ما پایگاه ثبت مرکزی کارآزماییهای کنترل شده کاکرین (CENTRAL؛ شماره 6؛ 2015)؛ MEDLINE؛ EMBASE؛ PsycINFO؛ Cumulaive Index to Nursing and Allied Health Literature (CINAHL) و فهرست منابع مقالات را جستوجو کردیم. منابع علمی جستوجو شده شامل همه مقالات منتشرشده قبل از جولای 2015 بودند.
معیارهای انتخاب
تمام مطالعات تصادفیسازی و کنترل شده که مداخله روانیاجتماعی را برای اختلال مصرف کانابیس (بدون مداخله دارویی) در مقایسه با کنترل درمان جزئی یا غیرفعال یا ترکیبات جایگزین برای مداخلات روانیاجتماعی، بررسی کردند.
گردآوری و تجزیهوتحلیل دادهها
ما از روشهای استاندارد روششناسی مورد انتظار بنیاد همکاری کاکرین (Cochrane Collaboration) استفاده کردیم.
نتایج اصلی
ما 23 کارآزمایی تصادفیسازی و کنترل شده را شامل 4045 شرکتکننده وارد کردیم. در مجموع، 15 مطالعه در ایالات متحده صورت گرفت، دو مطالعه در استرالیا، دو مطالعه در آلمان و یک مطالعه در هر یک از کشورهای سوئیس، کانادا، برزیل و ایرلند انجام شدند. محققان درمانها را به مدت تقریبا بیش از هفت جلسه (بین 1 تا 14 جلسه) برای تقریبا 12 هفته (بین یک تا 56 هفته) ارائه کردند.
بهطور کلی، خطر سوگیری (bias) در سراسر مطالعات متوسط بود، بدین معنا که، هیچ کارآزمایی دارای خطر بالای سوگیری انتخاب، سوگیری ریزش یا سوگیری گزارشدهی نبود. به علاوه، کارآزماییها شامل تعداد زیادی از شرکتکنندگان بودند، و هر کارآزمایی پایبندی شرکتکنندگان را به درمانهای ارائه شده تضمین کرد. در مقابل، به دلیل ماهیت مداخلات ارائه شده، کورسازی شرکتکنندگان امکانپذیر نبود و گزارشهای مربوط به کورسازی پژوهشگر اغلب نامشخص بوده یا ارائه نشده بود. نیمی از مطالعات مرور شده شامل تایید کولترال (collateral) یا آنالیز ادراری (urinalysis) برای تایید دادههای خود‐گزارشی بودند که منجر به نگرانی در مورد سوگیری عملکرد و سوگیری تشخیص میشد. در نهایت، نگرانیها از سوگیریهای دیگر مبتنی بر عدم ارزیابی نسبتا مداوم مصرف موادی غیر از کانابیس یا استفاده از درمانهای اضافی قبل یا در طول دوره کارآزمایی بودند.
زیرمجموعهای از مطالعات، جزئیات کافی را درباره مقایسه اثرات هرگونه مداخلهای در برابر کنترل غیرفعال بر پیامدهای اولیه مورد نظر در پیگیری اولیه (میانه عددی دوره پیگیری، چهار ماه) ارائه ندادند. نتایج، شواهدی را با کیفیت متوسط نشان دادند که حدود هفت نفر از 10 شرکتکننده دریافتکننده مداخله، درمان را به صورتی که در نظر گرفته شده بود، کامل کردند (اندازه اثر (ES): 0.71؛ 95% فاصله اطمینان (CI): 0.63 تا 0.78؛ 11 مطالعه، 1424 شرکتکننده)، و کسانی که مداخله روانیاجتماعی را دریافت کردند، در مقایسه با افراد دریافتکننده کنترل غیرفعال تعداد روزهای کمتری کانابیس مصرف کردند (تفاوت میانگین (MD): 5.67؛ 95% CI؛ 3.08 تا 8.26؛ 6 مطالعه، 1144 شرکتکننده). علاوه بر این، شواهدی با کیفیت پائین نشان داد که افراد دریافتکننده مداخله بیشتر احتمال دارد که شیوع نقطهای پرهیز (point‐prevalence abstinence) را گزارش کنند (خطر نسبی (RR): 2.55؛ 95% CI؛ 1.34 تا 4.83؛ شش مطالعه، 1166 شرکتکننده) و علائم وابستگی (تفاوت میانگین استانداردشده (SMD): 4.15؛ 95% CI؛ 1.67 تا 6.63؛ 4 مطالعه، 889 شرکتکننده) و مشکلات مرتبط با کانابیس کمتری را در مقایسه با افراد دریافتکننده کنترل غیرفعال (SMD: 3.34؛ 95% CI؛ 1.26 تا 5.42؛ 6 مطالعه، 2202 شرکتکننده) گزارش کردند. در نهایت، شواهدی با کیفیت بسیار پائین نشان دادند که افراد دریافتکننده مداخله در مقایسه با افراد دریافتکننده کنترل غیرفعال، استفاده از شرکای کمتری را در روز گزارش کردند (SMD: 3.55؛ 95% CI؛ 2.51 تا 4.59؛ 8 مطالعه، 1600 شرکتکننده). نکته قابل توجه اینکه، تجزیهوتحلیل زیرگروهها نشان داد مداخلات بیش از 4 جلسه که در دورهای بیش از یکماه بهطول انجامند (با شدت بالا)، پیامدهای بهبود یافته باثباتتری (به ویژه از نظر فراوانی مصرف کانابیس و شدت وابستگی) را در کوتاهمدت، در مقایسه با مداخلاتی با شدت پائین، ایجاد کردند.
ثابتترین شواهد از استفاده از درمان شناختیرفتاری (CBT)، درمان افزایش انگیزه (MET) و به ویژه ترکیب آنها برای کمک به کاهش فراوانی مصرف کانابیس (MET: MD: 4.45؛ 95% CI؛ 1.90 تا 7.00؛ چهار مطالعه، 612 شرکتکننده؛ CBT: MD: 10.94؛ 95% CI؛ 7.44 تا 14.44؛ یک مطالعه، 134 شرکتکننده؛ MET + CBT: MD: 7.38؛ 95% CI؛ 3.18 تا 11.57؛ سه مطالعه، 398 شرکتکننده) و شدت وابستگی (MET: SMD: 4.07؛ 95% CI؛ 1.97 تا 6.17؛ دو مطالعه، 316 شرکتکننده؛ MET + CBT: SMD: 7.89؛ 95% CI؛ 0.93 تا 14.85؛ سه مطالعه، 573 شرکتکننده) در پیگیریهای اولیه حمایت میکنند، اگرچه هیچ مداخله خاصی در نه ماه پیگیری یا بیشتر بهطور مداوم موثر نبود. علاوه بر این، دادههای به دست آمده از پنج مورد از شش مطالعه، از افزودن مشوقهای مبتنی بر کوپن برای نتیجه تست ادرار منفی مصرف کانابیس به منظور تقویت اثر درمان بر فراوانی مصرف کانابیس حمایت کرد. یک مطالعه تکی به نتایج متضادی طی یک دوره پیگیری 12 ماهه دست یافت، زیرا پیامدهای پس از درمان مربوط به کاهش کلی در فراوانی مصرف کانابیس به نفع CBT بهتنهایی و بدون افزودن مدیریت اقتضایی مبتنی بر پرهیز یا مبتنی بر پایبندی به درمان بود. در مقابل، شواهد مربوط به ارائه مشاوره در رابطه با مواد مخدر، حمایت اجتماعی، پیشگیری از عود و مدیتیشن (مراقبه) مبتنی بر آگاهی ذهن ضعیف بود زیرا تعداد مطالعات شناسایی شده کم بوده، اطلاعات مربوط به پیامدهای درمان ناکافی و میزان پایبندی به درمان پائین بودند. در راستای ارائه درمان برای مصرف مواد دیگر، در کل میزان پرهیز نسبتا کم بود، تقریبا یک‐چهارم از شرکتکنندگان در پیگیری نهایی از مصرف مواد خودداری کردند. سرانجام، سه مطالعه دریافت كه مداخله ميان شركتكنندگان در كلينيکهای روانپزشكی قابل مقايسه با درمان معمول بود و هيچ تفاوت بين‐گروهی را در هيچ یک از پیامدهای وارد شده گزارش ندادند.
نتیجهگیریهای نویسندگان
مطالعات وارد شده از جنبههای زیادی ناهمگون بودند، و سؤالات مهمی را در رابطه با موثرترین دوره درمان، شدت و نوع مداخله مطرح و تا حدی آنها را حل کردند. به دلیل محدود بودن تعداد محلهای انجام مطالعه و نمونههای همگون از متقاضیان درمان، تعمیمپذیری یافتهها نامشخص بود. میزان پرهیز از مصرف، کم و ناپایدار بود، اگر چه قابل مقایسه با درمان مصرف مواد دیگر نبود. نشان داده شده که مداخله رواناجتماعی، در مقایسه با حداقل کنترلهای درمانی، باعث کاهش فراوانی مصرف و شدت وابستگی به شکلی نسبتا با دوام، حداقل در کوتاهمدت خواهد شد. در میان انواع مداخله وارد شده، از یک مداخله سختگیرانه که به مدت بیش از چهار جلسه ارائه شد و مبتنی بر ترکیب MET و CBT با انگیزههای مبتنی بر پرهیز بود، برای درمان اختلال مصرف کانابیس بهطور مداومی بیشتر حمایت شد.
PICO
خلاصه به زبان ساده
مداخلات روانیاجتماعی برای اختلال مصرف کانابیس
پیشینه
اختلال مصرف کانابیس (cannabis) شایعترین اختلال ناشی از مصرف مواد غیرقانونی در جمعیت عمومی است. علیرغم اینکه تعداد زیادی از مصرفکنندگان کانابیس به دنبال درمان هستند، کارآزماییهای بالینی انجام شده برای کشف اثربخشی مداخلات روانیاجتماعی برای اختلال مصرف کانابیس بهطور محدود انجام شدهاند.
ویژگیهای مطالعه
نویسندگان مرور در کل 23 مطالعه را شامل 4045 شرکتکننده بزرگسال وارد کردند که اغلب کانابیس مصرف میکردند. این مرور شامل گروههای شرکتکنندهای بود که حداقل از 70% مصرفکنندگان روزانه یا تقریبا روزانه تشکیل شده، یا داشتن اختلال مصرف کانابیس را گزارش کرده یا به دلیل مصرف کانابیس به دنبال درمان بودند. متوسط سن شرکتکنندگان 28.2 سال بود. اکثر شرکتکنندگان مرد بودند (بهطور متوسط 72.5%، به جز دو کارآزمایی که فقط زنان را به کار گرفتند). اغلب (15) مطالعات در ایالات متحده آمریکا انجام شدند، دو مطالعه در آلمان، دو مطالعه در استرالیا و یک مطالعه در هر یک از کشورهای برزیل، کانادا، سوئیس و ایرلند انجام شدند.
مطالعات هفت نوع مداخله مختلف را مقایسه کردند: درمان شناختی رفتاری (CBT)، درمان افزایش انگیزه (MET)، ترکیبی از MET و CBT؛ (MET + CBT)، مدیریت اقتضایی (CM)، حمایت اجتماعی (SS)، مدیتیشن (مراقبه) مبتنی بر آگاهی ذهن (MM) و آموزش و مشاوره درباره مواد مخدر (DC).
یافتههای کلیدی
اختلال مصرف کانابیس مانند سایر اختلالات مصرف داروهای غیرقانونی، با مداخلات روانیاجتماعی ارائه شده در شرایط سرپایی و در سطح جامعه به آسانی درمان نمیشوند. CBT در جلسات فردی و گروهی و MET در جلسات فردی سازگارترین درمانهای مورد بررسی بودند؛ آنها اثربخشی بیشتری را نسبت به شرایط کنترل نشان دادند. به ویژه، درمان روانیاجتماعی در کاهش فراوانی مصرف کانابیس (نه مطالعه پیامدهای برتر و چهار مطالعه پیامدهای قابل مقایسه را نشان دادند)، مقدار مصرف در هر بار (هفت مطالعه پیامدهای برتر و دو مطالعه پیامدهای قابل مقایسه را نشان دادند) و شدت وابستگی (هفت مطالعه پیامدهای برتر و دو مطالعه پیامدهای قابل مقایسه را نشان دادند)، بهطور مداوم موثرتر از عدم درمان بود. در مقابل، این درمان به احتمال زیاد در بهبود مشکلات مرتبط با کانابیس (چهار مطالعه پیامدهای برتر و هفت مطالعه پیامدهای قابل مقایسه را نشان دادند)، انگیزه ترک مصرف (هیچ مطالعهای پیامدهای برتر را نشان نداد و سه مطالعه پیامدهای قابل مقایسه را نشان دادند)، مصرف مواد مخدر دیگر (هیچ مطالعهای پیامدهای برتر را نشان نداد و هفت مطالعه پیامدهای قابل مقایسه را نشان دادند) یا سلامت روان (هیچ مطالعهای پیامدهای برتر را نشان نداد و پنج مطالعه پیامدهای قابل مقایسه را نشان دادند)، موثرتر از عدم درمان نبود. مقایسه مطالعات گزارش دهنده منافع درمان، برای زیرمجموعهای از مطالعات با پیگیری کوتاهمدت تقریبا چهار ماه، امکانپذیر بود. این تجزیهوتحلیل نشان داد که افراد دریافت کننده هر گونه مداخلهای، تعداد روزهای کمتری را از مصرف کانابیس گزارش کردند، از شرکای کمتری در هر روز استفاده کردند و علائم کمتری را از وابستگی و مشکلات مرتبط با کانابیس گزارش کردند. مداخلات با شدت بالا به مدت بیش از چهار جلسه و مداخلاتی که در دورهای بیش از یک ماه ارائه شدند، به ویژه مداخلات MET + CBT، بیشترین اثربخشی را داشتند. علاوه بر این، مداخلات توسط اکثر شرکتکنندگان به پایان رسید. به ویژه، سه مطالعه اثربخشی مداخله روانیاجتماعی را در مقایسه با درمان معمول که در مراکز روانپزشکی سرپایی ارائه شد، بررسی کرده و شواهد کمی را از تفاوتهای معنیدار گروهی در پیامدهای درمان گزارش کردند. در نهایت، نتایج حاصل از شش مطالعه، که شامل درمانهای کمکی مدیریت اقتضایی بودند، ترکیب شدند اما نشان دادند که در ترکیب با CBT یا با MET + CBT، فراوانی مصرف کانابیس و شدت وابستگی به آن، به احتمال زیاد بهبود مییابد. محققان هیچ گزارشی را از عوارض جانبی ارائه نکردند.
کیفیت شواهد
شواهد تا جولای 2015 بهروز است. دو نویسنده مرور (Le Foll و Copeland) از کمپانی GW داروی نابیکسیمولس (nabiximols) (با نام تجاری Sativex) را به صورت اهدایی دریافت کردند، اگرچه هیچ یک از نویسندگان مرور بهطور مستقیم بودجهای را برای تکمیل این مرور دریافت نکردند. از آنجایی که هیچ یک از کارآزماییها تمامی پیامدهای مورد نظر درمان را ارزیابی نکردند، و تنوع در معیارهای وارد شده زیاد بود، کیفیت شواهد میان پیامدهای اولیه بسیار پایین تا متوسط بود و محدودیتهای جدی داشت. علاوه بر این، ارزیابی مصرف مواد دیگر، از جمله مصرف تنباکو، یا استفاده از درمانهای اضافی در طول دوره کارآزمایی نادر بود. خروج شرکتکننده از مطالعه نیز یک نگرانی محسوب میشد، به طور متوسط، بیش از 20% از شرکتکنندگان در سراسر مطالعات در پیگیری نهایی از دست رفتند، اما بسیاری از مطالعات سوگیری (bias) ریزش نمونه را از طریق طرحهای تجزیهوتحلیل مناسب، بررسی کردند. در مقابل، ما شواهد کمی را از سوگیری گزارشدهی انتخابی یا سوگیری انتخاب پیدا کردیم.
Authors' conclusions
Summary of findings
| Psychosocial intervention compared with inactive control for cannabis use disorder | ||||||
| Patient or population: adults with cannabis use disorder or frequent cannabis use Settings: out‐patient treatment Intervention: psychosocial intervention Comparison: inactive control | ||||||
| Outcomes | Illustrative comparative risks* (95% CI) | Relative effect | Number of participants | Quality of the evidence | Comments | |
| Assumed risk | Corresponding risk | |||||
| Inactive control | Psychosocial intervention | |||||
| Cannabis use frequency at short‐term follow‐up | Mean number of cannabis using days in the past 30 days ranged across control groups from | Mean number of cannabis using days among intervention groups was | MD 5.67 (3.08 to 8.26) | 1144 (6) | ⊕⊕⊕⊝ | |
| Point‐prevalence abstinence rates at short‐term follow‐up | Proportion of participants achieving abstinence ranged from 2.70% to 44.21%, with an average of 23.02% across treatments | Average relative risk for achieving abstinence following intervention compared with control was 2.55 | RR 2.55 (1.34 to 4.83) | 1166 (6) | ⊕⊕⊕⊝ Lowa,d,e | |
| Cannabis use quantity per day at short‐term follow‐up | Mean number of joints smoked per day ranged across control groups from | Mean number of joints smoked per day among intervention groups was | SMD 3.55 (2.51 to 4.59) | 1600 (8) | ⊕⊝⊝⊝ | |
| Symptoms of dependence at short‐term follow‐up | Mean number of symptoms of dependence ranged across control groups from 2.4 to 5.1 | Mean number of symptoms of dependence among intervention groups was | SMD 4.15 (1.67 to 6.63) | 889 (4) | ⊕⊕⊕⊝ | |
| Cannabis‐related problems at short‐term follow‐up | Mean number of cannabis‐related problems ranged across control groups from | Mean number of cannabis‐related problems among intervention groups was | SMD 3.34 (1.26 to 5.42) | 2202 (6) | ⊕⊕⊝⊝ | |
| Retention in treatment | Proportion of participants completing treatment ranged from 50.0% to 88.7%, with an average of 71.8% across treatments | On average, 7 out of 10 participants completed treatment as it was intended | ES 0.71 (0.63 to 0.78) | 1424 (11) | ⊕⊕⊕⊕ Moderatea,e | |
| *The basis for the assumed risk (e.g. median control group risk across studies) is provided in footnotes. The corresponding risk (and its 95% confidence interval) is based on the assumed risk in the comparison group and the relative effect of the intervention (and its 95% CI) | ||||||
| GRADE Working Group grades of evidence | ||||||
| aAt least 1 study at high risk of other bias bData conversions were required because of heterogeneity in assessments cFollow‐up assessment periods varied (range, 7 weeks to 4 months) dFollow‐up assessment periods varied substantially (range, 3 months to 237 days) eHeterogeneity in outcome measures fFollow‐up assessment periods varied substantially (range, 7 weeks to 237 days) gSmall number of studies (4 studies) | ||||||
Background
Cannabis use disorder is the most commonly reported illegal substance use disorder in the general population; demand for assistance from a health professional is increasing internationally (EMCDDA 2014b). Despite this, only a minority of those with a disorder seek professional assistance, and no particular treatment method or design is widely accepted and practiced. This review aimed to identify those psychosocial interventions for cannabis use that demonstrate improved outcomes in comparison with inactive control and/or alternative treatment conditions.
Description of the condition
Population‐based studies have consistently revealed that cannabis is the most widely used illegal substance in Western countries including Europe (5.7% reporting past year use; EMCDDA 2014a), North America (7.5% reporting past month use; SAMHSA 2014) and Australia (10.2% reporting past year use; AIHW 2014a). In many countries, among those accessing treatment for drug use disorders, cannabis is more commonly the principal drug of concern than heroin (EMCDDA 2014b).
Diagnostic criteria for cannabis use disorder are described in the Diagnostical and Statistical Manual of Mental Disorders, 5th Edition (DSM‐V) (DSM‐V 2013), and the 10th Revision of the International Statistical Classification of Diseases and Related Health Problems (ICD‐10) (WHO 1992). The distinction between cannabis abuse and dependence has been replaced by a unidimensional symptom count indicating severity of cannabis use disorder and a requirement of two or more symptoms for diagnosis.
Cannabis use disorder is characterised by a pattern of cannabis use that can cause clinically significant psychiatric distress (somatisation, depression, anxiety, irritability, phobic anxiety, paranoid ideation, psychoticism) and social impairment (family member complaining, lost friends, financial difficulty, impaired work or school performance, legal problems), as well as multiple adverse consequences associated with cannabis use (inability to stop using, feeling bad about using, procrastinating, loss of self confidence, memory loss and withdrawal symptoms) and repeated unsuccessful attempts to stop using (Budney 1999; Budney 2000; Stephens 1993a). Cannabis use persists despite these negative consequences, and most individuals with cannabis use disorder perceive themselves as unable to quit (Budney 2000; Copeland 2001b). It is very common for cannabis users to present with other substance use problems, most notably those related to use of tobacco. In fact, most cannabis users also smoke tobacco (Badiani 2015), and smoking tobacco may potentiate cannabis dependence (Hindocha 2015).
Lifetime rates of cannabis use disorder ‐ according to the recent DSM‐V classification ‐ have been estimated at 5.4% in the Australian general population (Mewton 2013) and 6.3% in the US population (Goldstein 2015), with national estimates from other countries yet to be published under this new classification. Epidemiological studies have estimated that around one in six of those who use cannabis during adolescence and one in two of daily cannabis users will meet the criteria for cannabis dependence (Anthony, 2006; van der Pol, 2013). Certain factors have been identified to be significantly associated with increased risk of cannabis use disorder diagnosis, including being male (Haberstick 2014) or meeting criteria for diagnosis of alcohol use disorder or affective disorders (Teesson 2012). Indeed, on the basis of a database representative of the US population, it has been estimated that 7% of males and 5.3% of females with lifetime exposure to cannabis will develop cannabis dependence at some point in life (Lev‐Ran 2013).
Description of the intervention
Despite these high levels of problematic use, only a minority of people who use cannabis seek assistance from a health professional (Teesson 2012). The demand for treatment for cannabis use disorder, nonetheless, is increasing internationally. In 1999, the US Treatment Episode Data Set recorded more than 220,000 admissions to publicly funded substance abuse treatment (SAMHSA 2002), primarily for cannabis use. This represented 14% of admissions to these facilities and a doubling of the rate since 1993. In 2000, that data set reported that cannabis accounted for 61% of all adolescent admissions (SAMHSA 2003), and in 2010, this prevalence was 49.5% among those 18 to 30 years of age (SAMHSA 2013). Australia has also seen a doubling in rates of cannabis treatment from 2000 to 2013, with the current rate fluctuating between 22% and 24% since 2008 (AIHW 2015). Indeed, the number of cannabis patients entering treatment has increased in the 25 countries across the globe for which data are available (from 73,000 in 2005 to 106,000 in 2010) (EMCDDA 2014b).
Primary treatment options for cannabis use disorder include cognitive‐behavioural and motivational approaches, which identify the importance of the individual or the social environment. These types of treatment approaches are collectively referred to as psychosocial treatments. More specifically, cognitive‐behavioural and relapse prevention approaches primarily emphasise identification and management of incremental patterns and thoughts, as well as external triggers, that lead to use. In addition, these approaches teach coping and problem‐solving skills and promote substitution of cannabis‐related behaviours with healthier alternatives (Beck 1993). In contrast, motivational interviewing approaches tend to emphasise the importance of self efficacy and positive change and attempt to build motivation in an empathic and non‐judgemental environment (Miller 2002). This approach is often enhanced by personalised feedback and education regarding the treatment seeker's patterns of cannabis use, becoming motivational enhancement therapy (Miller 1992). Both approaches can be delivered in an individual or group format and include family and friends for social support. Aside from these primary treatments, secondary options include mindfulness‐based meditation and drug counselling. Mindfulness‐based meditation is a new approach that promotes inner reflection and acceptance of experiences and negative affect, thus decreasing the impact of triggers of use by enhancing present‐moment awareness (Praissman 2008). Drug counselling refers to simple fact‐based education regarding drug use and health risks, along with suggestions for minimising harm and brief components from cognitive‐behavioural and motivational approaches. In addition, all of these treatments can be augmented with pharmacotherapy (medications to assist with cannabis withdrawal and reduce cravings) and/or contingency management techniques (financial incentives for abstinence or successful engagement in treatment). Finally, given the high frequency of tobacco use among those presenting for cannabis treatment, their shared triggers of use and the negative impact of tobacco use on cannabis treatment outcomes, it is suggested that use of both substances should be treated simultaneously (Agrawal 2012).
How the intervention might work
Until recently, relatively little research has focused on approaches to treatment for cannabis use disorder. A major factor contributing to lack of clinical research focus on this disorder is that many users believe that cannabis use does not produce a dependence syndrome, and that treatment to assist with quitting is not desired or needed (Gates 2012). However, since the time an initial survey was carried out in the USA (Roffman 1987), research has confirmed that individuals with cannabis‐related problems readily respond to advertisements for treatment, and most do not use other substances (Budney 1999; Copeland 2001b; Stephens 1993a). Original cannabis‐specific programmes in the USA and Australia may have legitimised the need for treatment related to cannabis abuse or dependence, reduced the stigma associated with drug abuse treatment and attracted patients who otherwise would be reluctant to approach counselling (Copeland 2001b; Stephens 1993a).
Although the bulk of substance use treatment literature has focused on alcohol consumption and other illicit drug use, a widening evidence base regarding psychosocial treatment for cannabis use disorder has emerged. Several narrative reviews of cannabis treatment trials from separate author groups have highlighted support for psychosocial intervention in managing cannabis use disorder (Budney 2007; Copeland 2014; McRae 2003; Nordstrom 2010; Winstock 2010). These reviews discuss the importance of addressing co‐morbid mental health concerns involving social support, establishing healthy distractions from cravings and teaching harm reduction techniques when these distractions fail. Approaches that combine cognitive‐behavioural and motivational enhancement techniques share the greatest support in these reviews, but it is noted that the supporting evidence lacks methodological rigour and standardised outcome measures across studies.
Why it is important to do this review
Treatment development and efficacy studies targeting cannabis use disorder began to appear in the scientific literature during the 1990s; almost two decades later, testing of pharmacological preparations was begun to determine their effectiveness in managing cannabis use disorder. Following a recent Cochrane review on pharmacotherapies, no medications have emerged with proven effectiveness for the treatment of cannabis use disorders (Marshall 2014), leaving psychosocial treatments as the mainstay. Although several narrative reviews of existing literature have focused on psychosocial treatment of cannabis use disorder, to our knowledge only five systematic reviews have been published, and each included limited samples. The first described prevention programmes specifically developed for adolescent cannabis use within schools (Tobler 1999). The second recounted all substance use by dependent adults; although cannabis treatments were reviewed separately, this review included only five treatment trials and provided results that are now somewhat outdated (Dutra 2008). The third review focused on adolescent cannabis users and community‐delivered treatments (Bender 2011). The fourth included only individuals who were actively seeking treatment and excluded users who were offered treatment following identification of problematic use (Davis 2014). Finally, the fifth review (Denis 2006) served as the foundation for the current review.. Notably, each of these reviews highlighted only modest support for the the community‐delivered treatments described.
This systematic review was conducted to evaluate the effectiveness of psychosocial interventions that can be delivered in an out‐patient or community setting for adults with cannabis use disorder.
Objectives
To evaluate the efficacy of psychosocial interventions for cannabis use disorder (compared with inactive control and/or alternative treatment) delivered to adults in an out‐patient or community setting.
Methods
Criteria for considering studies for this review
Types of studies
We included all relevant randomised controlled studies examining psychosocial interventions for cannabis dependence or abuse (cannabis use disorder) in comparison with delayed treatment or minimal treatment control, as well as an alternative psychosocial treatment.
Types of participants
We included all participants who received treatment in out‐patient or community settings if they (1) were 18 years of age or older, (2) met diagnostic criteria for cannabis abuse or dependence by clinical assessment (per criteria of the Diagnostic and Statistical Manual of Mental Disorders, 5th Edition, or the 10th Revision of the International Statistical Classification of Diseases and Related Health Problems) or (3) were at least near daily cannabis users or (4) were seeking treatment for their cannabis use. We included all adult participants regardless of gender or nationality. We considered the history of previous treatments, but this was not an eligibility criterion. Exclusion criteria were (1) current dependence on alcohol or any other drug (except nicotine) and (2) near daily use of other substances (excluding nicotine). This review did not differentiate between patients seeking treatment and those screened in healthcare settings and invited to participate; however when possible, we assessed the impact of participant motivation at baseline on treatment outcomes.
Types of interventions
Experimental intervention
One or more psychosocial interventions for the management of cannabis use disorder delivered in a group or individual model in an out‐patient or community setting (excluding mail, phone and computer‐based treatments).
We considered the following psychosocial interventions.
-
Cognitive‐behavioural therapy (CBT).
-
Motivational interviewing/motivational enhancement therapy (MET).
-
Components of cognitive and motivational approaches delivered with focus on the importance of obtaining social support (SS).
-
Drug counselling and/or education (DC).
-
Contingency management (CM).
-
Mindfulness‐based meditation (MM).
-
Relapse prevention (RP).
-
Combination of the above.
Control intervention
Control interventions consisted of inactive (including untreated/minimally treated control or delayed treatment control (DTC)) or a second active psychosocial intervention.
Types of outcome measures
Primary outcomes
-
Self reported use of cannabis (number of days, rate of abstinence, times per day) with or without confirmation by objective means (urinalysis or hair/saliva analyses, as well as collateral reports).
-
Severity of cannabis use disorder observed as an index measured by a standardised questionnaire (such as the Addiction Severity Index (ASI) (McLellan 1980) or the Severity of Dependence Scale (SDS) (Swift 1998)) or as a count of symptoms of dependence following clinical assessment.
-
Level of cannabis‐related problems such as medical problems, legal problems, social and family relations, employment and support (typically assessed by questionnaires such as the Marijuana Problem Scale (Stephens 2000) or the Cannabis Problems Questionnaire (Copeland 2005)).
-
Retention in treatment, including average number of sessions received and/or proportion of participants completing the full number of planned sessions.
Secondary outcomes
-
Motivation to change cannabis use measured by a standardised questionnaire (such as the Readiness to Change Questionnaire (Heather 1999)).
-
Frequency of self reported other substance intake (number of days, times per day or other assessment of severity such as the ASI).
-
Mental health and symptoms of affective disorder measured by a standardised questionnaire (such as the Beck Depression Inventory (Beck 1961)).
With the exception of treatment retention, researchers reported all outcomes quantitatively using scales such as those referenced here.
Search methods for identification of studies
Electronic searches
We developed detailed search strategies to identify studies for inclusion in the review. These were based on the search strategy developed for MEDLINE but were revised appropriately for each database. The search strategy was based on the Cochrane Sensitive Search Strategy for Randomised Controlled Trials (RCTs), as published in Chapter 6.4 of the Cochrane Handbook for Systematic Reviews of Interventions version 5.1.0 (Higgins 2011). We assessed articles of all languages for eligibility.
We searched the following.
-
Cochrane Central Register of Controlled Trials (CENTRAL; 2015, Issue 6), which includes the Cochrane Drugs and Alcohol Group Register of Trials.
-
MEDLINE (inclusive from 1966 to June 2015).
-
EMBASE (inclusive from 1988 to June 2015).
-
Cumulative Index to Nursing and Allied Health Literature (CINAHL) (inclusive from 1981 to June 2015).
-
PsycINFO (inclusive from 1967 to June 2015).
For details, see Appendix 1; Appendix 2; Appendix 3; Appendix 4; and Appendix 5.
In addition, we searched for ongoing clinical trials and unpublished studies via Internet searches on the following websites.
-
ClinicalTrials.gov (www.clinicaltrials.gov).
-
World Health Organization (WHO) International Clinical Trials Registry Platform (ICTRP) (www.who.int/ictrp/en/).
Searching other resources
We checked the reference lists of all potentially eligible studies obtained as full reports to identify additional studies not retrieved by the electronic search. We obtained full reports of review articles retrieved by the search and checked these for other relevant citations.
Data collection and analysis
Selection of studies
Two review authors (PG and PS) independently screened the titles and abstracts of all publications identified by the search strategy. We obtained all potentially eligible studies as full‐text articles and independently assessed articles for inclusion. In doubtful or controversial cases, review authors discussed all identified discrepancies and reached consensus for all such cases without the need for arbitration.
Data extraction and management
Two review authors (PG and PS) independently extracted data, including participant demographics (gender, age, ethnicity, socioeconomic status, level of education), participant physical and mental health, use of substances, history of cannabis use and experience with cannabis treatment, as well as information pertaining to the intervention (duration, number of sessions, length of sessions, intervention type, use of boosters or contingency management, intervention format, treatment goal, staff training, fidelity checks) and finally information pertaining to included treatment outcomes. When key information relevant to the systematic review was missing, we adhered to the protocol in place and contacted investigators to ask them to provide additional data and clarification. If reports pertained to overlapping participants or periods of assessment, to avoid duplication of information we retained only the largest study or the most final follow‐up assessment.
Assessment of risk of bias in included studies
To limit bias, gain insight into potential comparisons and guide interpretation of findings, two review authors (PG and PS), using the criteria described in the Cochrane Handbook for Systematic Reviews of Interventions version 5.1.0 (Higgins 2011), independently assessed the risk of bias of eligible studies. In the context of a systematic review, the validity of a study refers to the extent to which its design and conduct were likely to prevent systematic errors or bias (Moher 1995). We changed the criteria to include assessment of risk of bias of included studies to conform with recommended methods outlined in the most recent version of the Cochrane Handbook for Systematic Reviews of Interventions and the requirements of RevMan5.3. We assessed new studies and re‐assessed studies already included in the old review by using the criteria and methods indicated in the Cochrane Handbook for Systematic Reviews of Interventions (Higgins 2011).
The recommended approach for assessing risk of bias of studies included in Cochrane reviews is based on evaluation of six specific methodological domains (namely, sequence generation, allocation concealment, blinding, incomplete outcome data, selective outcome reporting and other issues). For each study, we analysed the six domains, described them as reported in the study and offered a final judgement on the likelihood of bias. The first portion of the assessment tool involves describing what was reported to have happened in the study. The second portion involves assigning a judgement related to risk of bias for that entry, in terms of low, high or unclear risk.
To make these judgements, we used the criteria indicated in the Cochrane Handbook for Systematic Reviews of Interventions and as applied to the field of addiction. See Appendix 6 for details. For a detailed description of the criteria used, see the Cochrane Handbook for Systematic Reviews of Interventions version 5.1.0 (Higgins 2011).
We provided details of assessments of risk of bias in the Characteristics of included studies tables.
Measures of treatment effect
For dichotomous data from follow‐up and other studies, we calculated risk ratios (RRs) with 95% confidence intervals (CIs), with the exception of treatment retention, for which we calculated effect sizes (ESs, interpreted as pooled proportions of participants completing treatment) because comparable interventions were lacking; for continuous data from independent samples, we calculated mean differences (MDs) and standardised mean differences (SMDs) when measures of outcome differed across studies, all with 95% confidence intervals and derived by using a random‐effects model.
Unit of analysis issues
If multi‐arm studies were included in the meta‐analyses, and if one arm was considered more than once in the same comparisons (e.g. two different types of experimental treatment compared with the same control group), we combined all relevant experimental groups into a single group and compared it with the control group to avoid double counting of participants included in control groups.
Assessment of heterogeneity
We assessed intervention and methodological heterogeneity by reviewing variation between studies in terms of characteristics of included participants, interventions provided and reported outcomes. We grouped studies for analyses by the nature of the experimental intervention. We assessed statistical heterogeneity by using the Chi2 test and its P value, by visually inspecting forest plots and by considering the I2 statistic. A P value of the Chi2 test lower than 0.10 or an I2 statistic of 50% or greater indicated significant statistical heterogeneity.
Data synthesis
We used ReviewManager 5.3 for all statistical analyses, with the exception of analysis of treatment retention, for which we used STATA v14, as this enabled calculation of a weighted combined effect size for low‐intensity and high‐intensity interventions. For all analyses, we used a random‐effects model.
Subgroup analysis and investigation of heterogeneity
This review aimed to consider the following potential sources of heterogeneity by performing subgroup analyses.
-
Patterns of cannabis use and history of previous cannabis use (as indicated by duration and level of use, number of days of use, number of uses per day (quantity), modality of use or route of administration, age at initiation of use).
-
Concurrent non‐cannabis substance use.
-
Concurrent psychiatric illness and current treatment for that illness.
-
Nature of treatment delivery (regarding treatment duration, number of sessions and intervention type).
-
Nature of adjunct treatment or use of booster sessions.
Limitations in data collection and/or reporting across studies that met the inclusion criteria meant that only an investigation of the nature of treatment delivery was possible. Differentiation of low‐intensity and high‐intensity interventions was based on (1) results of studies that included comparisons of less intensive groups (with a maximum of four sessions) and more intensive interventions (with a minimum of six sessions) (Budney 2000; Copeland 2001; MTPRG 2004; Stephens 2000), (2) a single study that included a comparison of treatment duration (Jungerman 2007) showing group differences between a four‐session intervention delivered over four weeks and the same intervention delivered over 12 weeks and (3) a convention established across studies whereby study authors referred to interventions of four or fewer sessions (most commonly one or two sessions) as "brief".
Sensitivity analysis
We did not use methodological quality as a criterion for inclusion of studies in this review. We intended to assess the impact of methodological quality by performing sensitivity analysis. This would have involved considering the overall estimate of effect while including or excluding studies with high risk of bias. Limitations of data reported by studies that met the inclusion criteria meant that sensitivity analysis was not possible. However, we discussed risk of bias when presenting study results.
Results
Description of studies
Results of the search
As shown in the flow diagram (Figure 1), the search strategies yielded 8636 records, which were screened by reading of both titles and abstracts. This screening was followed by reading of the full article text of 151 studies for eligibility assessment.

Study flow diagram.
Included studies
A total of 23 eligible randomised controlled trials (48 reports) met the inclusion criteria. These 23 trials involved 4045 participants (see Characteristics of included studies).
Treatment regimen and setting
Fifteen of 23 included studies took place in the United States, two in Germany (Hoch 2012; Hoch 2014), two in Australia (Copeland 2001; Edwards 2006) and one each in Brazil (Jungerman 2007), Canada (Fischer 2012), Switzerland (Bonsack 2011) and Ireland (Madigan 2013).
All included studies applied an out‐patient design.
In all, 18 of the 23 included studies detailed therapists’ experience and training. Without exception, therapists reported previous professional counselling experience and were provided varying degrees of specific intervention training.
Across studies, investigators compared seven different therapeutic modalities: cognitive‐behavioural therapy (CBT), motivational intervention (MET), a combination of MET and CBT (MET + CBT), contingency management (CM), social support (SS), mindfulness‐based meditation (MM) and drug education and counselling (DC).
A total of 15 included studies compared CBT versus another therapy (Budney 2000; Budney 2006; Carroll 2006; Carroll 2012; Copeland 2001; Hoch 2012; Hoch 2014; Jungerman 2007; Kadden 2007; Litt 2013; Madigan 2013; Roffman 1988; Stephens 1994; Stephens 2000; and the Marijuana Treatment Project Research Group 2004 or MTPRG 2004). CBT was similar for all included studies but was delivered individually for 11 of them (Budney 2000; Budney 2006; Carroll 2006; Carroll 2012; Copeland 2001; Hoch 2012; Hoch 2014; Jungerman 2007; Kadden 2007; Litt 2013; MTPRG 2004) and in group sessions for the other four (Madigan 2013; Roffman 1988; Stephens 1994; Stephens 2000).
The MET format was similar for the 15 included studies assessing such therapy (Bernstein 2009; Bonsack 2011; Budney 2000; Carroll 2006; Hoch 2012; Hoch 2014; Jungerman 2007; Kadden 2007; Lee 2013; Litt 2013; Madigan 2013; MTPRG 2004; Stein 2011; Stephens 2000; Stephens 2007).
A total of six studies assessed CM, with six studies providing incentives for provision of biological samples that tested negative for cannabis use (referred to as abstinence‐based CM or CM‐abs) (Budney 2000; Budney 2006; Carroll 2006; Carroll 2012; Kadden 2007; Litt 2013) and four studies for adherence to treatment appointments (referred to as adherence‐based CM or CM‐adh) (Budney 2006; Carroll 2006; Carroll 2012; Litt 2013). In addition, such incentives were withheld when samples tested positive, or when appointments were missed. The size of the incentives differed among the six studies that assessed CM, ranging from a lottery system with average winnings between $106 and $140 (Litt 2013) to systems allowing possible earning of up to $250 (Carroll 2012), $385 (Kadden 2007), $570 (Budney 2000) $645 (Budney 2006) and $880 (Carroll 2006).
A single study delivered mindfulness‐based meditation (MM) (de Dios 2012).
Four of the included studies utilised individual drug counselling and education (DC) as a comparison treatment (Carroll 2006; Edwards 2006; Fischer 2012; Stephens 2007).
Two included studies used the social support treatment as a comparison treatment (Roffman 1988; Stephens 1994).
A total of 11 studies assessedonly delayed treatment control (DTC) as a control group (Bernstein 2009; Copeland 2001; de Dios 2012; Hoch 2012; Hoch 2014; Jungerman 2007; Lee 2013; MTPRG 2004; Stein 2011; Stephens 2000; Stephens 2007). Two studies used an active control condition that focused on life issues (such as occupational, social, psychiatric and educational goals), which served as a control for non‐specific factors related to time spent in treatment (referred to as assessed control; Kadden 2007; Litt 2013).
Finally, three studies included a "treatment‐as‐usual" (TAU) control condition, which consisted of psychiatric case management, psychoeducation regarding substance use and medication delivered as needed in psychiatric clinics (intervention participants received TAU in addition to active treatment) (Bonsack 2011; Edwards 2006; Madigan 2013). In each of these three studies, given that participants were in treatment for psychosis, intervention groups received the cannabis treatment under study along with this usual treatment.
Duration of trials
Duration of studies from baseline was one month (Roffman 1988), three months (de Dios 2012), 14 weeks (Budney 2000), four months (Jungerman 2007), six months (Carroll 2006; Edwards 2006; Hoch 2012; Hoch 2014; Lee 2013; Stein 2011), eight months (Copeland 2001), 12 months (Bernstein 2009; Bonsack 2011; Budney 2006; Carroll 2012; Fischer 2012; Kadden 2007; Litt 2013; Madigan 2013; Stephens 1994; Stephens 2007), 15 months (MTPRG 2004)or 16 months (Stephens 2000). We have provided additional details of follow‐up periods in Table 1.
| Study and group | Follow‐up period |
| Bernstein 2009, (1) Brief MET + CBT, (2) assessed control | (1) and (2) at 3 and 12 months from baseline |
| Bonsack 2011, (1) MET, (2) TAU | (1) and (2) at 3, 6 and 12 months from baseline |
| Budney 2000, (1) MET + CBT + CM‐abs, (2) MET + CBT, (3) MET | (1), (2) and (3) at end of treatment [14 weeks from baseline] |
| Budney 2006, (1) CBT + CM‐abs, (2) CBT + CM‐adh, (3) CM‐abs | (1), (2) and (3) at end of treatment [14 weeks from baseline], then monthly for 12 months post treatment [data provided for 3, 6, 9 and 12 month assessments] |
| Carroll 2006, (1) MET + CBT + CM‐abs + CM‐adh, (2) DC + CM‐abs + CM‐adh, (3) MET + CBT, (4) DC | (1), (2), (3) and (4) at end of treatment [8 weeks from baseline], then at 3 and 6 months post treatment |
| Carroll 2012, (1) CBT, (2) CBT + CM‐adh, (3) CBT + CM‐abs, (4) CM‐abs | (1), (2), (3) and (4) at end of treatment [12 weeks from baseline], then at 3, 6, 9 and 12 months post treatment |
| Copeland 2001, (1) CBT (6‐session), (2) CBT (1‐session), (3) DTC | (1) at an average of 242 days from baseline; (2) at an average of 223.5 days from baseline; (3) at an average of 242.5 days from baseline |
| de Dios 2012, (1) MM, (2) Assessed control | (1) and (2) at end of treatment [2 weeks from baseline], then at 1 and 2 months from baseline |
| Edwards 2006, (1) CBT, (2) TAU | (1) and (2) at end of treatment [3 months from baseline], then at 6 months post treatment |
| Fischer 2012, (1) DC‐oral, (2) DC‐workbook, (3) Health promotion‐oral, (4) Health promotion‐workbook | (1), (2), (3) and (4) at 3 and 12 months post treatment |
| Hoch 2012, (1) MET + CBT, (2) DTC | (1) at end of treatment [8‐12 weeks from baseline], then at 3 and 6 months from baseline; (2) at 8‐12 weeks |
| Hoch 2014, (1) MET + CBT, (2) DTC | (1) at end of treatment [8 weeks], then at 3 and 6 months from baseline; (2) at 8 weeks |
| Jungerman 2007, (1) MET + CBT (3 months), (2) MET + CBT (1 month), (3) DTC | (1) at 1 month post treatment; (2) at 3 months post treatment; (3) at 4 months post baseline |
| Kadden 2007 (1) MET + CBT + CM‐abs, (2) MET + CBT, (3) CM‐abs, (4) TAU | (1), (2), (3) and (4) at end of treatment [2 month follow‐up] and at 5, 8, 11 and 14 months from baseline |
| Lee 2013, (1) MET, (2) Assessed control | (1) and (2) at 3 and 6 months from baseline |
| Litt 2013, (1) MET + CBT + CM‐abs, (2) MET + CBT + CM‐adh, (3) TAU | (1), (2) and (3) at end of treatment [2 months from baseline], then at 3, 6, 9 and 12 months post treatment |
| Madigan 2013, (1) MET + CBT, (2) TAU | (1) and (2) at 3 and 12 months from baseline |
| MTPRG 2004, (1) MET + CBT, (2) MET, (3) Assessed control | (1) and (2) at 4, 9 and 15 months from baseline; (3) at 4 months from baseline |
| Roffman 1988, (1) RP, (2) SS | (1) and (2) at end of treatment [12 weeks], then at 1, 3, 6, 9 and 12 months post treatment [only data from 1 month follow‐up are provided] |
| Stein 2011, (1) MET, (2) Assessed control | (1) and (2) at 1, 3 and 6 months from baseline |
| Stephens 1994, (1) RP, (2) SS | (1) and (2) at 1, 3, 6, 9 and 12 months post treatment |
| Stephens 2000, (1) CBT, (2) MET, (3) Assessed control | (1) at 1 month from baseline [during treatment], at end of treatment [4 months from baseline] then at 3, 9 and 12 months post treatment; (2) at end of treatment [1 month from baseline] then at 3, 6, 12 and 15 months post treatment; (3) at 4 months from baseline |
| Stephens 2007, (1) MET, (2) DC, (3) DTC | (1) and (2) end of treatment [7 weeks from baseline], then at 6 and 12 months from baseline; (3) at 7 weeks from baseline |
CBT: Cognitive‐behavioural therapy
CM‐abs: Contingency management with vouchers presented for negative urine
CM‐adh: Contingency management with vouchers presented for treatment attendance/adherence
DC: Drug counselling
DTC: Delayed treatment control
MET: Motivational enhancement therapy
MM: Mindfulness‐based meditation
RP: Relapse prevention
SS: Social support
TAU: Treatment as usual
Funding sources
Most of the included studies were funded by the National Institute on Drug Abuse (Bernstein 2009; Budney 2000; Budney 2006; Carroll 2006; Carroll 2012; de Dios 2012; Kadden 2007; Lee 2013; Litt 2013; Stein 2011; Stephens 1994; Stephens 2000; Stephens 2007). Remaining studies were funded by various research grants supplied by the Swiss Research National Fund (Bonsack 2011), the Australian Commonwealth Department of Health and Family Services Research into Drug Abuse Grants Program (Copeland 2001), the Victorian Government Department of Human Services (Edwards 2006), Canadian Institutes of Health Research (Fischer 2012), the German Federal Ministry of Education and Research (Hoch 2012; Hoch 2014), the São Paulo Research Foundation (Jungerman 2007), the Health Research Board of Ireland (Madigan 2013) and the Substance Abuse and Mental Health Services Administration (MTPRG 2004). A final article did not specify a funding body (Roffman 1988).
Participants
A clear majority of participants from 13 studies met diagnostic criteria for cannabis use disorder according to the Diagnostic and Statistical Manual of Mental Disorders, Third Edition, Revised (DSM‐III‐R) (Budney 2000; Copeland 2001; Stephens 2000); the Diagnostic and Statistical Manual of Mental Disorders, Fourth Edition (DSM‐IV) (Budney 2006; Carroll 2006; Hoch 2012; Jungerman 2007; Kadden 2007; Litt 2013; Madigan 2013; MTPRG 2004); the Drug and Alcohol Screening Test (DAST; Stephens 1994); and the Severity of Dependence Scale (SDS; Hoch 2014). In addition, Carroll 2012 included participants on the basis of unclear assessment of cannabis use disorder, but participants reported using cannabis on average 12 or more of the past 28 days.
Several studies did not include participants on the basis of assessment of cannabis use disorder but instead used a cutoff based on frequency of cannabis use. This cutoff ranged from twice a month (de Dios 2012) to three to five days a month (Bernstein 2009; Bonsack 2011; Lee 2013), 11 days a month (Fischer 2012), 15 days a month (Stephens 2007) and 50 or more of the past 90 days (Roffman 1988, Stephens 1994). Finally, two studies did not require that participants had used cannabis at an established frequency but included samples reported using cannabis on average at least 26% (Edwards 2006) to 55% of days (Stein 2011). Actual cannabis use at baseline (pre‐treatment) was reported across study groups to occur on average 20.8 days (standard deviation (SD) = 5.6) of the past 30 days (ranging from an average of 7.8 to 28.3 days in the past month).
In nine studies, participants were excluded if they met current abuse or dependence DSM criteria for any other drug (except nicotine). Notably, frequent use of drugs (weekly or more often) other than cannabis or nicotine among most participants was an exclusion criterion for this review.
Averaging across study groups, participants' mean age was 28.2 years (SD = 5.4), and the total number of participants included in this review was 4045.
Types of comparison
Included studies performed very heterogeneous comparisons among different types of interventions. We pooled study results on the basis of comparisons between:
-
any intervention versus inactive control (10 studies: Bernstein 2009; Copeland 2001; Hoch 2012; Hoch 2014; Jungerman 2007; Lee 2013; MTPRG 2004; Stephens 1994; Stephens 2000; Stephens 2007);
-
any intervention versus treatment as usual (three studies: Bonsack 2011; Edwards 2006; Madigan 2013); and
-
intervention versus intervention (nine studies: Budney 2000; Budney 2006; Copeland 2001; Jungerman 2007; MTPRG 2004; Roffman 1988; Stephens 1994; Stephens 2000; Stephens 2007).
Excluded studies
We excluded a total of 102 studies (see Characteristics of excluded studies)on the basis of the following criteria.
-
Most of the sample did not report that they experienced cannabis use disorder or at least near daily use (15 studies).
-
Most of the sample reported frequent use of other illicit substances or alcohol, or reported another substance use disorder (15 studies).
-
Most included participants were 17 years of age or younger (20 studies).
-
The study did not include a comparison between treatment and control groups (eight studies).
-
The study provided a review of cannabis treatment trials (one study).
-
The intervention could not be delivered in an out‐patient setting (seven studies).
-
The study was narrative only or met no inclusion criteria and was largely irrelevant (35 studies).
Risk of bias in included studies
We included in the Characteristics of included studies details of assessments of risk of bias; for a summary of the results of judged risk of bias for each domain across the included studies, see Figure 2.

Risk of bias summary: review authors' judgements about each risk of bias item for each included study.
Allocation
Random sequence generation
For this domain, a total of 15 studies had low, eight had unclear and no studies had high risk of selection bias.
Allocation concealment
For this domain, a total of 19 studies had low and four had unclear risk of selection bias. No studies had high risk of selection bias.
Blinding
We assessed blinding for subjective (self report measures) and objective outcomes (collateral reports or urinalysis). Across trials, participants and providers could not possibly be blinded to the allocated intervention and associated outcomes. Therefore, participants from all studies were at high risk of performance bias. This was not the case for the outcome assessor, who could be blinded. With regards to subjective outcomes, a total of eight studies used blinded outcome assessors and therefore were at low risk of performance bias;12 studies did not report whether outcome assessors were blinded and were at unclear risk of performance bias. The remaining three studies reported that outcome assessors were not blinded; these studies were at high risk of performance bias. With regards to objective outcomes, 13 studies included collateral estimates or urinary analysis (which could not be affected by blinding) and therefore were at low risk of performance bias. In contrast, nine studies did not assess objective outcomes, but because correlation between objective and subjective measures of cannabis use is high, it was unclear whether these studies were at risk of performance bias.
Incomplete outcome data
A total of 17 studies had low and six studies had unclear risk of attrition bias. No studies had high risk of attrition bias.
Selective reporting
A total of 20 studies had low and three studies had unclear risk of reporting bias. No studies had high risk of reporting bias.
Other potential sources of bias
Each of the other potential sources of bias was given equal weight with regards to the overall assessment of other potential bias. Indications of other bias included no assessment of non‐cannabis substance use, or use of additional treatments before and during the trial period, or treatment fidelity; rates of intervention completion; participant demographics; pre‐intervention history of cannabis use, or experience with cannabis treatments; significant between‐group differences at baseline in assessed participant demographics or cannabis use‐related variables; and whether selected cannabis‐related measures were reliable and valid.
A total of 14 studies had low and three had unclear risk of other sources of bias; six studies had high risk of other bias.
Effects of interventions
See: Summary of findings for the main comparison
Meta‐analysis was possible only for each of the primary outcomes at short‐term follow‐up; limitations in data collection and reporting and heterogeneity of included studies meant that results for secondary treatment outcomes could not be pooled (see summary of findings Table for the main comparison for these results; see Types of outcome measures for details on measures).
Primary outcomes
Reductions in frequency of cannabis use
Intervention versus inactive control
Any intervention
Those receiving any intervention reported fewer days of cannabis use in the prior 30 days at follow‐up compared with those receiving inactive control (mean difference (MD) 5.67, 95% confidence interval (CI) 3.08 to 8.26, six studies, 1144 participants; Analysis 1.1). The included period of follow‐up with the most consistently available data across studies ranged between seven weeks and four months. The quality of evidence for this outcome was considered to be moderate (summary of findings Table for the main comparison).
Subgroup analysis for intensity of the intervention
Those receiving a high‐intensity intervention (more than four sessions or duration longer than one month) showed the greatest differences compared with those given inactive control (MD 10.02, 95% CI 7.69 to 12.34, three studies, 381 participants; Analysis 1.2), although those receiving an intervention of low intensity (four or fewer sessions or duration less than one month) also used cannabis on fewer days compared with those given control (MD 4.58, 95% CI 2.65 to 6.50, six studies, 763 participants; Analysis 1.2).
Subgroup analysis for type of intervention
Compared with inactive control, those receiving CBT used cannabis on the fewest days (MD 10.94, 95% CI 7.44 to 14.44, one study, 134 participants; Analysis 1.3), followed by those receiving MET + CBT (MD 7.38, 95% CI 3.18 to 11.57, four studies, 612 participants; Analysis 1.3) and MET (MD 4.45, 95% CI 1.90 to 7.00; Analysis 1.3).
Studies not included in meta‐analysis
These studies also reported a significant intervention effect on frequency of cannabis use, particularly before six‐month follow‐up. Interventions resulting in greater reductions in cannabis use compared with control included MET (Stein 2011), MET + CBT (Hoch 2012; Hoch 2014), six‐session CBT (Copeland 2001) and MM (although this study included females only and was at high risk of other bias; de Dios 2012). In contrast, three studies failed to show effectiveness over inactive control. The first was a comparison between a single‐session CBT intervention and delayed treatment control with no significant difference in days of cannabis use at eight months (242 days on average) (Copeland 2001). The second consisted of a nine‐session MET + CBT + CM‐adh and a nine‐session MET + CBT + CM‐abs with no between‐group differences across 14 months compared with treatment designed to control for time and attention (although this study was at high risk of detection and other bias; Litt 2013). Finally, a single study found DC to be somewhat effective when delivered in person or by workbook at 12‐month follow‐up but no more effective than a non‐drug health promotion control (this study was at high risk of other bias; Fischer 2012).
Intervention versus treatment as usual
Any intervention
Two trials provided data for pooling, although the included period of follow‐up was limited to end of treatment as the result of inconsistencies in assessment periods. Analysis included a 10‐session DC (Edwards 2006) and a 13‐session MET + CBT delivered in group format (Madigan 2013). Neither intervention showed a significant treatment effect over control (MD 0.13, 95% CI ‐2.00 to 2.27, two studies, 97 participants; Analysis 2.1). An additional study reported no significant treatment effect for six‐session MET over 12 months as compared with treatment as usual control (Bonsack 2011).
Intervention versus intervention
Several interventions were compared with alternative active treatments, although data pooling was not always possible, as only a handful of intervention types were compared against alternative treatments in more than one study.
RP versus SS
A total of two studies compared RP‐based and SS‐based interventions (each 10 sessions, delivered in groups of 12 to 15). In the initial study, reductions in frequency of cannabis use were greater at one‐month follow‐up for those receiving RP as compared with those treated with SS (MD 5.55, 95% CI 1.89 to 9.21, one study, 97 participants) (Roffman 1988). Notably, no such significant between‐group differences were noted up to 12‐month follow‐up in a separate study of these interventions (although risk of bias assessments for this study were largely unclear; Stephens 1994).
MET versus alternative treatment
A total of four studies compared MET‐based interventions versus alternative treatments. MET was found to be superior only to a drug‐related health education treatment provided for up to 12 months (MD 3.99, 95% CI 0.89 to 7.08, one study, 112 participants; Analysis 3.1) (Stephens 2007). In contrast, no significant between‐group differences were found between MET (two sessions, delivered to individuals) and CBT (14 sessions, delivered to groups of eight to 12) up to twelve‐month follow‐up (MD ‐0.86, 95% CI ‐3.86 to 2.14, one study, 179 participants; Analysis 3.1) (Stephens 2000). Further, no significant differences were noted between four‐session MET and a more intensive 14‐session MET + CBT intervention at end of treatment (MD ‐2.80, 95% CI ‐9.94 to 4.34, one study, 31 participants; Analysis 3.1)), although MET was inferior to a similar MET + CBT + CM‐abs intervention (MD ‐7.30, 95% CI ‐13.68 to ‐0.92, one study, 30 participants; Analysis 3.1)) (Budney 2000). Similarly, a two‐session MET was inferior to a nine‐session MET + CBT + CM‐abs intervention across nine‐month follow‐up (MD ‐4.96, 95% CI ‐7.18 to ‐2.74, one study, 266 participants; Analysis 3.1)), although this study was at high risk of detection bias (MTPRG 2004).
CBT versus alternative treatment
In addition to the mentioned comparison between CBT and MET, CBT‐based interventions were compared with alternative treatments in three studies. Twelve‐session CBT was found to be superior to a similar intervention paired with the addition of CM‐abs or CM‐adh across 12‐month follow‐up post treatment, although no significant differences were noted between CBT and CM‐abs unpaired (Carroll 2012). A separate study found no significant differences at 12 months regarding comparisons between CBT + CM‐abs or CBT + CM‐adh versus CM‐abs delivered unpaired (MD 4.90, 95% CI ‐1.95 to 11.75, one study, 43 participants; MD ‐0.70, 95% CI ‐7.61 to 6.21, one study, 46 participants) or between CBT + CM‐adh and CBT + CM‐abs (MD 5.60, 95% CI ‐1.65 to 12.85, one study, 45 participants) (although this study was at high risk of detection bias; Budney 2006). Finally, no significant difference was reported between a six‐session and a single‐session CBT intervention at eight months (242 days on average) (Copeland 2001).
MET + CBT versus alternative treatment
A total of two additional studies compared MET + CBT‐based interventions versus alternative treatments. No significant group differences were found when eight‐session MET + CBT was compared with DC across six‐month follow‐up, but both were found to be inferior when delivered alone as compared with delivery plus addition of CM‐abs and CM‐adh (study authors reported the effect of adding CM as d = 0.29, 95% CI –0.06 to 0.64) (Carroll 2006). In addition, a study comparing MET + CBT, MET + CBT + CM‐abs, CM‐abs alone and a non‐drug health promotion control found that CM‐abs alone showed effectiveness in rates of continuous abstinence at three‐month follow‐up, and MET + CBT + CM‐abs was superior at 12‐month follow‐up (Kadden 2007). No other between‐group differences were reported for this outcome. A final study compared MET + CBT + CM‐abs and MET + CBT‐adh versus each other and versus an assessment‐only control condition across 12 months (although this study was at high risk of detection and other bias; Litt 2013). Although MET + CBT + CM‐abs was found to be superior to MET + CBT + CM‐adh (each nine sessions) at five‐ to eight‐month follow‐up assessments, neither intervention was superior to the assessment‐only control.
CM versus alternative treatment
Finally, several studies investigated the impact of CM‐abs and CM‐adh as adjunct treatments to MET, CBT and MET + CBT interventions. Most of these studies supported the use of CM‐abs (Budney 2000; Carroll 2006; Kadden 2007) and CM‐adh (Carroll 2006), and one study found contrasting results throughout a 12‐month follow‐up period, as outcomes related to overall reductions in cannabis use frequency favoured CBT alone without the addition of CM‐abs or CM‐adh (Carroll 2012). Two studies compared use of CM‐abs adjunct treatment versus CM‐adh adjunct treatment. Neither study found any significant between‐group differences at 12 months (although both studies were at high risk of detection bias; Budney 2006; Litt 2013).
Summary of reduction in frequency of cannabis use
Most notably, few active intervention comparisons showed significant differences between groups with regards to reductions in frequency of cannabis use from six‐month follow‐up onwards (with longest follow‐up at 16 months from baseline). This included CBT + CM‐abs versus CBT + CM‐adh versus CM‐abs alone (Budney 2006); six‐session CBT versus single‐session CBT (Copeland 2001); DC versus psychosis treatment as usual control (Edwards 2006); MET + CBT versus inactive control (Hoch 2012; Hoch 2014); MET versus inactive control (Lee 2013; Stein 2011); RP versus SS (Stephens 1994); CBT versus MET (Stephens 2000); MET versus drug‐related health education (Stephens 2007) and DC delivered orally or by workbook versus non‐drug health promotion control (although this study was at unclear or high risk across most assessments of bias; Fischer 2012). Studies showed five notable exceptions to this lack of treatment effectiveness in the prior six months. First, a nine‐session MET + CBT + CM‐abs intervention outperformed a MET + CBT + CM‐adh intervention for up to 12 months (all nine sessions; Litt 2013). Second, a nine‐session MET + CBT intervention outperformed a shorter two‐session counterpart for up to 15 months (MTPRG 2004). Third, CBT + CM‐abs showed improved outcomes compared with CM‐abs alone (each 14 sessions) at 12‐month follow‐up (Budney 2006). Fourth, a single‐session MET intervention was superior to a single session of drug‐related health education at 12 months (Stephens 2007). Fifth, a 12‐session CBT intervention showed superior outcomes when delivered unpaired by CM‐abs or CM‐adh over 12 months (Carroll 2012). Finally, MET + CBT + CM‐abs was superior to MET + CBT, DC and CM‐abs interventions at 12 months, although only in terms of continuous abstinence rates, not in terms of past month point‐prevalence estimates (Kadden 2007).
We have provided a further summary of units of measurement and all included study findings regarding the impact of intervention and control on frequency of cannabis use from baseline to follow‐up in Table 2.
| Study and group | Measure | Baseline | Follow‐up [% with data] | Significance* |
| Bernstein 2009, (1) Brief MET + CBT, (2) Assessed control | Days used in prior 30 days (mean ± SD) | (1) 19.0 ± 10.9, N = 68, (2) 15.3 ± 10.1, N = 71 | (1) 11.0 ± 10.7, N = 42 [69.1%], (2) 13.2 ± 11.7, N = 55 [77.5%] | (1) vs (2) P value = 0.024 |
| Bonsack 2011, (1) MET, (2) TAU | Days abstinent in prior ‘month’ (median ± range) | (1) 5.0 ± 24, N = 30, (2) 3.0 ± 27, N = 32 | (1) 5.5 ± 28, N = 25 [83.3%], (2) 8.5 ± 28, N = 29 [90.6%] | (1) vs (2) P value > 0.05 |
| Budney 2000, (1) MET + CBT + CM‐abs, (2) MET + CBT, (3) MI | Days used in prior 30 days (least squares mean ± SE) | (1) 24.1 ± 1.8, N = 20, (2) 20.4 ± 1.8, N = 20, (3) 23.2 ± 1.8, N = 20 | (1) 6.6 ± 2.6, N = 14 [70.0%], (2) 7.4 ± 2.3, N = 15 [75.0%], (3) 13.0 ± 2.1, N = 16 [80.0%] | (1) vs (2) P value > 0.05; (1) vs (3) P value > 0.05; (2) vs (3) P value > 0.05 |
| Budney 2006, (1) CBT + CM‐abs, (2) CBT + CM‐adh, (3) CM‐abs | Days used in prior 30 days (mean ± SD) | (1) 25.3 ± 8.0, N = 30, (2) 25.5 ± 7.4, N = 30, (3) 26.0 ± 6.2, N = 30 | (1) 12.5 ± 13.9, N = 21 [70.0%], (2) 18.3 ± 15.7, N = 24 [80.0%], (3) 18.1 ± 13.6, N = 22 [73.3%] | (1) vs (2) P value > 0.05; (1) vs (3) P value > 0.05; (2) vs (3) P value > 0.05 |
| Carroll 2006, (1) MET + CBT + CM‐abs + CM‐adh, (2) DC + CM‐abs + CM‐adh. (3) MET + CBT, (4) DC | Proportion of days used post treatment (mean ± SE) | (1) n/a, N = 33, (2) n/a, N = 34, (3) n/a, N = 36, (4) n/a, N = 33 | (1) 0.64 ± 0.06, N = 27 [81.8%], (2) 0.75 ± 0.1, N = 24 [70.6%], (3) 0.73 ± 0.05, N = 27 [75.0%], (4) 0.71 ± 0.06, N = 30 [90.9%] | (1) vs (2) P value > 0.05; (1) vs (3) P value > 0.05; (1) vs (4) P value = 0.02; (2) vs (3) P value > 0.05; (3) vs (4) P value = 0.02; (2) vs (4) P value > 0.05 |
| Carroll 2012, (1) CBT, (2) CBT + CM‐adh, (3) CBT + CM‐abs, (4) CM‐abs | Days used in prior 28 days (mean ± SD) | (1) 15.6 ± 9.8, N = 36, (2) 17.6 ± 8.6, N = 32, (3) 17.9 ± 9.6, N = 32, (4) 14.1 ± 10.6, N = 27 | (1) Unclear, N = 33 [91.7%], (2) Unclear, N = 25 [78.1%], (3) Unclear, N = 26 [81.3%], (4) Unclear, N = 23 [85.2%] | (1) vs (2) P value = 0.00; (1) vs (3) P value = 0.00; (1) vs (4) P value > 0.05; (2) vs (3) P value > 0.05; (3) vs (4)* P value = 0.00; (2) vs (4) P value = 0.00 |
| Copeland 2001, (1) CBT [6‐session], (2) CBT [1‐session], (3) DTC | Percent of days abstinent post treatment (mean ± SD) | (1) n/a, N = 78, (2) n/a, N = 82, (3) n/a, N = 69 | (1) 35.9 ± 34.8, N = 58 [74.4%], (2) 44.8 ± 37.7, N = 61 [74.4%], (3) 29.7 ± 32.6, N = 52 [75.4%] | (1) vs (2) P value > 0.05; (1) vs (3) P value > 0.05; (2) vs (3) P value > 0.05 |
| de Dios 2012, (1) MM, (2) Assessed control | Days used in prior 30 days (mean ± SD) | (1) 17.0 ± 9.96, N = 22, (2) 18.8 ± 8.1, N = 12 | (1) Unclear, N = 16 [72.7%], (2) Unclear, N = 9 [75.0%] | (1) vs (2) P value = 0.031 across FU |
| Edwards 2006, (1) DC, (2) TAU | % of days used in prior 4 weeks (mean ± SD) | (1) 39.4 ± 38.4, N = 23, (2) 26.0 ± 28.3, N = 24 | (1) 32.4 ± 44.9, N = 16 [69.6%], (2) 19.3 ± 30.4, N = 17 [70.8%] | (1) vs (2) P value > 0.05 |
| Fischer 2012, (1) DC‐oral, (2) DC‐workbook, (3) Health promotion‐oral, (4) Health promotion‐workbook | Days used in prior 30 days (mean, range) | (1) 21.96, 4.75, N = 24, (2) 24.82, 3.0, N = 47, (3) 21.36, 5.5, N = 25, (4) 25.36, 3.41, N = 37 | (1) Unclear, N = Unclear, (2) Unclear, N = Unclear, (3) Unclear, N = Unclear, (4) Unclear, N = Unclear | (1) vs (2) P value > 0.05; (1) vs (3) P value > 0.05; (1) vs (4) P value > 0.05; (2) vs (3) P value > 0.05; (3) vs (4) P value > 0.05; (2) vs (4) P value > 0.05 |
| Hoch 2012, (1) MET + CBT, (2) DTC | Percent reporting abstinence post treatment (%) | (1) n/a, N = 90, (2) n/a, N = 32 | (1) 49, N = 79 [87.8%], (2) 12.5, N = 31 [96.9%] | (1) vs (2) P value < 0.05 |
| Hoch 2014, (1) MET + CBT, (2) DTC | Percent reporting abstinence post treatment (%) | (1) n/a, N = 166, (2) n/a, N = 130 | (1) 53.3, N = 166 [100%], (2) 22, N = 106 [81.5%] | (1) vs (2) P value < 0.05 |
| Jungerman 2007, (1) MET + CBT [3 months], (2) MET + CBT [1 month], (3) DTC | Percent of days used in prior 90 days (mean ± SE) | (1) 88.17 ± 1.95, N = 52, (2) 94.19 ± 1.87, N = 56, (3) 94.06 ± 1.95, N = 52 | (1) 56.21 ± 4.38, N = 27 [51.9%], (2) 64.90 ± 4.27, N = 37 [66.1%], (3) 86.12 ± 4.38, N = 35 [67.3%] | (1) vs (2) P value > 0.05; (1) vs (3) P value = 0.0008; (2) vs (3) P value = 0.0002 |
| Kadden 2007 (1) MET + CBT + CM‐abs, (2) MET + CBT, (3) CM‐abs, (4) Health education | Proportion of days used in prior 90 days (mean ± SD) | (1) 0.11 ± 0.17, N = 63, (2) 0.08 ± 0.13, N = 61, (3) 0.15 ± 0.19, N = 54, (4) 0.08 ± 0.12, N = 62 | (1) 27, N = 51 [81.0%], (2) 19, N = 49 [80.3%], (3) Unclear, N = 48 [88.9%], (4) Unclear, N = 52 [83.9%] | (1) vs (2) P value > 0.05; (1) vs (3) P value > 0.05; (1) vs (4) P value < 0.05; (2) vs (3) P value > 0.05; (3) vs (4) P value > 0.05 [P value < 0.05 at 3 month FU only]; (2) vs (4) P value < 0.05 |
| Lee 2013, (1) MET, (2) Assessed control | Days used in prior 30 days (mean ± SD) | (1) 16.5 ± 8.2, N = 106, (2) 15.6 ± 8.8, N = 106 | (1) 13.2 ± 10.6, N = 89 [84.0%], (2) 11.7 ± 11.1, N = 86 [81.1%] | (1) vs (2) P value > 0.05 |
| Litt 2013, (1) MET + CBT + CM‐abs, (2) MET + CBT + CM‐adh, (3) Assessed control | Days used in prior 90 days (mean ± SD) | (1) 72.5 ± 28.0, N = 73, (2) 71.8 ± 27.8, N = 71, (3) 68.4 ± 31.5, N = 71 | (1) Unclear, N = 60 [82.2%], (2) Unclear, N = 61 [85.9%], (3) Unclear, N = 61 [85.9%] | (1) vs (2) P value < 0.05 [significant at FU months 5‐8 only]; (1) vs (3) P value > 0.05; (2) vs (3) P value > 0.05 |
| Madigan 2013, (1) MET + CBT, (2) TAU | Days used in prior 30 days (mean ± SD) | (1) 10.0 ± 3.6, N = 59, (2) 10.1 ± 3.7, N = 29 | (1) 9.8 ± 3.9, N = 32 [54.2%], (2) 10.1 ± 4.0, N = 19 [65.5%] | (1) vs (2) P value > 0.05 |
| MTPRG 2004, (1) MET + CBT, (2) MET, (3) Assessed control | Percent of days used in prior 90 days (mean ± SD) | (1) 87.56 ± 17.24, N = 156, (2) 86.92 ± 17.15, N = 146, (3) 89.88 ± 14.11, N = 148 | (1) 44.86 ± 40.52, N = 129 [82.7%], (2) 53.65 ± 38.57, N = 120 [82.2%], (3) 75.59 ± 30.69, N = 137 [92.6%] | (1) vs (2) P value < 0.05 [Cohen d = 0.22]; (1) vs (3) P value < 0.05 [Cohen d = 1.14]; (2) vs (3) P value < 0.05 [Cohen d = 0.59] |
| Roffman 1988, (1) RP, (2) SS | Days used in prior ‘month’ (mean ± SD) | (1) 27.13 ± 4.6, N = 54, (2) 26.36 ± 5.79, N = 56 | (1) 8.18 ± 10.48, N = 45 [83.3%], (2) 12.96 ± 11.56, N = 52 [92.9%] | (1) vs (2) P value < 0.05 |
| Stein 2011, (1) MET, (2) Assessed control | Proportion of days used in prior 90 days (mean ± SD) | (1) 0.59 ± 0.34, N = 163, (2) 0.55 ± 0.34, N = 169 | (1) Unclear, N = 126 [77.3%], (2) Unclear, N = 136 [80.5%] | (1) vs (2) P value = 0.01 [significant at 3 month FU only] |
| Stephens 1994, (1) RP, (2) SS | Days used in prior 30 days (mean ± SD) | (1) 27.04 ± 4.66, N = 106, (2) 26.36 ± 5.81, N = 106 | (1) 15.31 ± 12.49, N = 80 [75.5%], (2) 13.79 ± 11.9, N = 87 [82.1%] | (1) vs (2) P value > 0.05 |
| Stephens 2000, (1) MET, (2) CBT, (3) Assessed control | Days used in prior 90 days divided by 3 (mean ± SD) | (1) 24.24 ± 6.29, N = 88, (2) 25.38 ± 6.15, N = 117. (3) 24.85 ± 6.13, N = 86 | (1) 12.99 ± 11.61, N = 80 [90.9%], (2) 12.29 ± 12.34, N = 103 [88.0%], (3) 17.09 ± 10.73, N = 79 [91.9%] | (1) vs (2) P value < 0.02 [significant at EoT only, assessed during treatment for (2)]; (1) vs (3) P value < 0.001; (2) vs (3) P value < 0.001 [significant at EoT only] |
| Stephens 2007, (1) MET, (2) Drug‐related health education, (3) DTC | Days used in prior 90 days converted to average days per week (mean ± SE) | (1) 5.76 ± 0.15, N = 62. (2) 5.79 ± 0.15, N = 62, (3) 6.06 ± 0.15, N = 64 | (1) 4.65 ± 0.28, N = 49 [79.0%], (2) 5.58 ± 0.28, N = 52 [83.9%], (3) 5.75 ± 0.24, N = 62 [96.9%] | (1) vs (2) P value <0.05 [Cohen d = 0.45]; (1) vs (3) P value < 0.05 [significant at 1.75 month FU, Cohen d = 0.47]; (2) vs (3) P value > 0.05 |
* Unless otherwise indicated by *, significant treatment outcomes favour the group with the lower number; exact P values are reported when provided
CBT: Cognitive‐behavioural therapy
CM‐abs: Contingency management with vouchers presented for negative urine
CM‐adh: Contingency management with vouchers presented for treatment attendance/adherence
DC: Drug counselling
DTC: Delayed treatment control
EoT: End of treatment
FU: Follow‐up
MET: Motivational enhancement therapy
MM: Mindfulness‐based meditation
RP: Relapse prevention
SD: Standard deviation
SE: Standard error
SS: Social support
TAU: Treatment as usual
As such, the intervention with the best evidence for reducing frequency of cannabis use is likely to be a MET + CBT combination enhanced by abstinence‐based CM when available. In the absence of CM, MET + CBT is likely to remain effective, although improvements may not be as immediately noticeable. Although the optimum number of sessions is not clear, evidence suggests that more intensive interventions of longer than four sessions are likely to be superior to less intensive interventions, at least in the short term. Notably, the quality of evidence for reductions in frequency of cannabis use over the short term was considered moderate according to the GRADE (Grades of Recommendation, Assessment, Development and Evaluation Working Group) assessment of quality, that is, three studies were at high risk of bias, data conversions were required to standardise the period of frequency assessed across studies and follow‐up assessment periods varied between studies.
Point‐prevalence and continuous abstinence
Across the included trials, rates of abstinence following cannabis treatment were measured as the proportion of participants reporting abstinence for the month before assessment (referred to as point‐prevalence abstinence, or PPA) and/or the proportion reporting continuous abstinence from treatment to final follow‐up assessment. Across the eight studies reporting rates of PPA, an average of 37% intervention participants achieved PPA at end of treatment, and this decreased to 24% at three to four months from baseline and to 23% at follow‐up of longer than four months. In contrast, an average of 12% of those in control conditions reported PPA at final follow‐up.
Point‐prevalence abstinence rates
Intervention versus inactive control
Any intervention
Those receiving any intervention were 1.96 times more likely to achieve point‐prevalence abstinence at short‐term follow‐up compared with those given inactive control (risk ratio (RR) 2.55, 95% CI 1.34 to 4.83, six studies, 1166 participants; Analysis 1.4). The included period of follow‐up with the most consistently available data across studies ranged between two months and 237 days. The quality of evidence for this outcome was considered to be low (summary of findings Table for the main comparison).
Subgroup analysis for intensity of the intervention
Those receiving a high‐intensity intervention showed the greatest chance of achieving a difference compared with those given inactive control (RR 3.09, 95% CI 2.23 to 4.29, five studies, 731 participants; Analysis 1.5). In contrast, those receiving an intervention of low intensity were not significantly more likely to report achieving point‐prevalence abstinence compared with those given control (RR 0.92, 95% CI 0.51 to 1.66, four studies, 435 participants; Analysis 1.5).
Subgroup analysis for type of intervention
Compared with inactive control, those receiving CBT showed the greatest chance of achieving a difference (RR 4.81, 95% CI 1.17 to 19.70, one study, 171 participants; Analysis 1.6), followed by those receiving MET + CBT (RR 2.17, 95% CI 1.10 to 4.32, five studies, 798 participants; Analysis 1.6) and those given MET (RR 1.19, 95% CI 0.43 to 3.28, one study, 197 participants; Analysis 1.6).
Intervention versus treatment as usual
Only one study provided information on PPA among those receiving intervention or treatment as usual. This study found no significant differences in effects of treatment between a 10‐session DC intervention and control at end of treatment or at six‐month follow‐up (Edwards 2006).
Intervention versus intervention
MET + CBT intervention versus alternative treatment
Two studies found that those receiving MET + CBT were 3.59 times more likely to report PPA compared with those given MET at short‐term follow‐up (RR 3.59, 95% CI 1.80 to 7.20, two studies, 302 participants; Analysis 3.2). In contrast, no between‐group differences were noted among those receiving MET + CBT and those given alternative treatments, including MET + CBT + CM‐abs + CM‐adh, DC or DC + CM‐abs + CM‐adh over six months (Carroll 2006). Further, no significant effect of intervention intensity was reported in a single study comparing low‐intensity versus high‐intensity MET + CBT at four‐month follow‐up (Jungerman 2007).
CBT versus alternative treatment
An initial study found no between‐group differences in PPA among those receiving CBT or MET treatment (Stephens 2000). Further, no significant effect of intervention intensity was reported in a single study comparing low‐intensity versus high‐intensity CBT at eight‐month (242 days on average) follow‐up (Copeland 2001).
RP versus SS
A single study reported no between‐group differences in PPA among those receiving RP or SS at one month (Roffman 1988).
CBT + CM‐abs versus CBT + CM‐abs versus CM‐abs
One study found no significant between‐group differences in PPA among those receiving CBT + CM‐adh, CBT + CM‐abs or CM‐abs alone across 12 months (Budney 2006).
Continuous abstinence rates
Intervention versus inactive control
Two studies compared continuous abstinence rates among participants receiving intervention and inactive control conditions. The first study reported a significant effect of treatment for those receiving a six‐session CBT intervention (15.1% were abstinent across nine months) or a one‐session CBT intervention (4.9% abstinent), with no inactive control participants achieving continuous abstinence across approximately eight months (Copeland 2001). The second study reported a single MM intervention participant achieving continuous abstinence (2.9%) compared with no inactive control participants achieving continuous abstinence across six months (de Dios 2012).
Intervention versus treatment as usual
No included study compared continuous abstinence rates among those receiving intervention or treatment as usual.
Intervention versus intervention
CBT versus alternative intervention
A total of three studies compared CBT interventions versus alternative interventions. The first study compared a 14‐session CBT versus a two‐session MET intervention in which 22% of both groups reported abstinence across 16 months, with no between‐group differences (Stephens 2000). The second compared two CBT interventions of differing intensity and reported no significant between‐group differences in abstinence over eight months (242 days on average) (15.1% of those attending a six‐session CBT intervention vs 4.9% given one‐session CBT) (Copeland 2001).The final study reported no significant between‐group differences in the proportion reporting positive urine screens across 12 months among those receiving 12‐session CBT (73.1%) or 12‐session CBT + CM‐adh (75.6%) or 12‐session CBT + CM‐abs (75.5%) or 12‐session CM‐abs alone (57.1%) (Carroll 2012).
MET + CBT versus alternative intervention
A total of five studies compared the proportions of participants reporting continuous abstinence from MET + CBT interventions versus those reporting continuous abstinence from alternative interventions; two additional studies reported abstinence rates with no comparator groups. First, no between‐group differences were noted among participants in a four‐session MET + CBT intervention when delivered over one month or over three months, with 90% and 81.8% positive urine over four months (Jungerman 2007). Second, 18% of participants attending nine‐session MET + CBT interventions with and without CM‐abs, and CM‐abs alone, reported abstinence over 12 months with no between‐group differences (Kadden 2007). Third, 43% of participants in a 14‐session MET + CBT + CM‐abs, 31% for a 14‐session MET + CBT and 19% for four‐session MET reported continuous abstinence during treatment (confirmed via urinalysis) with no significant between‐group differences (Budney 2000). Fourth, 43% of participants from a similar 14‐session CBT + CM‐abs intervention, 32% for 14‐session CBT + CM‐adh and 55% for CM‐abs alone had no recorded positive urine screens across six or more weeks, again with no significant differences between groups (Budney 2006). Further, no between‐group differences were noted in a comparison of continuous abstinence rates reported by participants receiving eight sessions of MET + CBT + CM‐abs + CM‐adh, DC + CM‐abs + CM‐adh, MET + CBT and DC alone across six months (50%, 70%, 70%, 70%, respectively) (Carroll 2006). An additional two trials of a 10‐session MET + CBT intervention reported that 41.1% and 34.9% were abstinent across six months, although these trials did not include comparison groups throughout this period (Hoch 2012; Hoch 2014).
Point‐prevalence and continuous abstinence: summary
Very few between‐group differences were noted among comparisons of abstinence rates. Although consistent evidence suggested that any intervention was superior to inactive control, we found little evidence supporting a particular intervention over another. That said, the intervention with the best evidence for promoting abstinence from cannabis use is likely to be CBT or a MET + CBT combination intervention. Little consistent evidence indicated that intervention intensity with CM adjuncts would improve treatment outcomes in this regard. Notably, according to three studies reporting information regarding duration of abstinence achieved by participants, an average of one month was attained before initial relapse (Budney 2000; Carroll 2006; Carroll 2012). The quality of evidence for PPA over the short term was considered to be low according to the GRADE assessment of quality, that is, one study was at high risk of bias (Bernstein 2009) and heterogeneity in methods of assessment and period of abstinence assessed was notable across studies.
Quantity of cannabis used (joints per day)
Intervention versus inactive control
Any intervention
Those receiving any intervention reported fewer joints per day of use at follow‐up compared with those receiving inactive control (standardised mean difference (SMD) 3.55, 95% CI 2.51 to 4.59, eight studies, 1600 participants; Analysis 1.7). The included period of follow‐up with the most consistently available data across studies ranged between seven weeks and approximately eight months. Analysis included MET, CBT and MET + CBT interventions. The quality of evidence for this outcome was considered to be very low (summary of findings Table for the main comparison).
Subgroup analysis for intensity of the intervention
Those receiving a high‐intensity intervention (more than four sessions or duration longer than one month) showed the greatest difference compared with those given inactive control (SMD 4.74, 95% CI 3.49 to 6.00, six studies, 848 participants; Analysis 1.8), and those receiving an intervention of low intensity (four or fewer sessions or duration less than one month) also used fewer joints per day of use (SMD 2.70, 95% CI 1.69 to 3.70, six studies, 752 participants; Analysis 1.8).
Subgroup analysis for type of intervention
Compared with those given inactive control, those receiving MET + CBT used the fewest joints per day of use (SMD 4.91, 95% CI 3.29 to 6.54, four studies, 683 participants; Analysis 1.9), followed by those receiving CBT (SMD 4.60, 95% CI 2.21 to 7.00, two studies, 306 participants; Analysis 1.9) and MET (SMD 3.14, 95% CI 2.66 to 3.61, four studies, 611 participants; Analysis 1.9). Across these studies, no between‐group differences were noted by any study beyond nine‐month follow‐up.
Intervention versus treatment as usual
A single study included a comparison of active intervention versus treatment as usual among patients in a psychiatric clinic (Bonsack 2011). This study found that MET (delivered as needed, with an average of six sessions received) was superior to treatment as usual across six months (study authors' reported Cohen’s d = 0.65, no data provided), although no significant difference was found at 12‐month follow‐up.
Intervention versus intervention
Studies not included in meta‐analysis
One study assessing single‐session DC interventions delivered in person or by workbook with non‐drug health education controls also delivered in person or by workbook included an assessment of the quantity of cannabis smoked per day of use (Fischer 2012). An additional study of MET + CBT versus CM‐abs alone versus MET + CBT + CM‐abs (all nine sessions; Kadden 2007) reported no between‐group differences over 12 months (no data provided).
MET versus alternative intervention
A total of three studies compared MET versus alternative interventions. MET was found to be superior only to DC up to 12 months (SMD 1.81, 95% CI 1.35 to 2.28, one study, 101 participants; Analysis 3.3) (Stephens 2007). In contrast, no significant between‐group differences were found between MET (two sessions, delivered to individuals) and CBT (14 sessions, delivered in groups of eight to 12) up to twelve‐month follow‐up (SMD ‐1.63, 95% CI ‐1.97 to ‐1.29, one study, 183 participants; Analysis 3.3) (Stephens 2000). Further, a four‐session MET was comparable with a two‐session MET and was inferior to a nine‐session MET + CBT intervention across nine‐month follow‐up (SMD 0.22, 95% CI ‐0.02 to 0.46, one study, 266 participants; Analysis 3.3); although this study was at high risk of detection bias (MTPRG 2004).
CBT (low intensity) versus CBT (high intensity)
One study assessed the impact of CBT intervention intensity on outcomes of cannabis quantity used. In this study, low‐intensity CBT (single session) was found to be inferior to a high‐intensity six‐session counterpart (SMD ‐3.15, 95% CI ‐3.69 to ‐2.61, one study, 119 participants; Analysis 3.3), although the study authors reported no significant differences with control for baseline consumption (Copeland 2001).
MET + CBT (low intensity) versus MET + CBT (high intensity)
One study assessed the impact of MET + CBT intervention intensity on outcomes of cannabis quantity used. In this study, a low‐intensity four‐session MET + CBT (delivered over one month) was found to be comparable with a high‐intensity four‐session counterpart at four‐month follow‐up (delivered over three months; SMD ‐0.08, 95% CI ‐0.58 to 0.41, one study, 64 participants; Analysis 3.3) (Jungerman 2007).
RP versus SS
A single study compared the quantity of cannabis use as reported by participants receiving a 10‐session RP or SS intervention with no between‐group differences reported over one month (SMD ‐1.22, 95% CI ‐1.66 to ‐0.79, one study, 97 participants; Analysis 3.3).
CBT + CM‐adh versus CBT + CM‐abs versus CM‐abs
A single study compared the quantity of cannabis used as reported by participants receiving a 14‐session CBT + CM‐adh or CBT + CM‐abs intervention or CM‐abs alone (Budney 2006). Although this study was at high risk of detection bias, the CBT + CM‐abs condition was reportedly superior to the CM‐abs condition during treatment only with no between‐group differences across 12‐month follow‐up. In contrast, our analyses of the data related to quantity of cannabis used during treatment found CBT + CM‐adh to be superior to both CM‐abs (SMD 2.37, 95% CI 1.63 to 3.10, one study, 50 participants; Analysis 3.3) and CBT + CM‐abs (SMD 2.45, 95% CI 1.72 to 3.18, one study, 52 participants; Analysis 3.3). Follow‐up data related to post‐treatment outcomes were not provided.
Summary of quantity of cannabis used
Evidence for effect of an intervention on quantity of cannabis used was somewhat limited by few studies investigating this outcome (13 studies) and by lack of consistency in outcome reporting. In summary, although intervention effect over inactive control was common in the short term, no particular intervention was superior post six‐month follow‐up. Notably, little evidence suggests the superiority of a particular intervention type over another. The quality of evidence on reductions in quantity of cannabis used over the short term was considered very low according to the GRADE assessment of quality, that is, one study was at high risk of bias, data conversions were required to obtain a standardised period of assessment, we noted heterogeneity in assessment measures (including 'joints', 'units' and 'hours') and the period of follow‐up varied across studies. We provide in Table 3 a further summary of units of measurement and all included study findings regarding the impact of intervention and control on joints used per day of use from baseline to follow‐up.
| Study and group | Measure | Baseline | Follow‐up [% with data] | Significance* |
| Bonsack 2011, (1) MET, (2) TAU | Joints per week (median ± range at baseline, median reduction at follow‐up) | (1) 22.5 ± 89, N = 30, (2) 19.0 ± 95, N = 32 | (1) 10.0, N = 25 [83.3%], (2) 3.5, N = 29 [90.6%] | (1) vs (2) P value > 0.05 [significant at 3 and 6 months only, d = 0.65] |
| Budney 2006, (1) CBT + CM‐abs, (2) CBT + CM‐adh, (3) CM‐abs | Joints per day (mean ± SD) | (1) 4.2 ± 3.0, N = 30, (2) 3.7 ± 2.2, N = 30, (3) 3.8 ± 2.2, N = 30 | (1) Unclear, N = 21 [70.0%], (2) Unclear, N = 24 [80.0%], (3) Unclear, N = 22 [73.3%] | (1) vs (2) P value > 0.05; (1) vs (3) P value > 0.05; (2) vs (3) P value > 0.05 |
| Copeland 2001, (1) CBT [6‐session], (2) CBT [1‐session], (3) DTC | “daily amount used in the last month” (mean ± SD) | (1) 2.1 ± 0.8, N = 78, (2) 2.0 ± 0.8, N = 82, (3) 2.2 ± 0.9, N = 69 | (1) 1.3 ± 0.9, N = 58 [74.4%], (2) 1.5 ± 1.2, N = 61 [74.4%], (3) 1.8 ± 1.0, N = 52 [75.4%] | (1) vs (2) P value > 0.05; (1) vs (3) P value = 0.02; (2) vs (3) P value > 0.05 |
| Fischer 2012, (1) DC [oral], (2) DC [workbook], (3) Health promotion [oral], (4) Health promotion [workbook] | Number of cannabis use episodes per day (mean ± range; reported only as combined group scores) | (1) + (2) 2.3 ± 1.2, N = 71, (3) + (4) 2.0 ± 0.6, N = 62 | (1) + (2) 2.6 ± 2.1, N = unclear, (3) + (4) 2.2 ± 0.9 | (1) vs (2) P value > 0.05; (1) vs (3) P value > 0.05; (1) vs (4) P value > 0.05; (2) vs (3) P value > 0.05; (3) vs (4) P value > 0.05; (2) vs (4) P value > 0.05 |
| Hoch 2012, (1) MET + CBT, (2) DTC | Units in previous 7 days (mean ± SD) | (1) 25.2 ± 39.7, N = 90, (2) 21.3 ± 32.7, N = 32 | (1) 8.1 ± 18.1, N = 79 [87.8%], (2) 24.9 ± 33.4, N = 31 [96.9%] | (1) vs (2) P value < 0.05 |
| Hoch 2014, (1) MET + CBT, (2) DTC | Units in previous 7 days (mean ± SD) | (1) 20.8 ± 26.7, N = 90, (2) 21.3 ± 28.3, N = 32 | (1) 5.2 ± 13.0, N = 79 [87.8%], (2) 20.6 ± 30.0, N = 31 [96.9%] | (1) vs (2) P value < 0.001 [d = ‐0.9] |
| Jungerman 2007, (1) MET + CBT [3 months], (2) MET + CBT [1 month], (3) DTC | Joints per day (mean ± SE) | (1) 2.08 ± 0.29, N = 52, (2) 2.06 ± 0.28, N = 56, (3) 1.84 ± 0.29, N = 52 | (1) 0.77 ± 0.18, N = 27 [51.9%], (2) 0.78 ± 0.17, N = 37 [66.1%], (3) 1.56 ± 0.18, N = 35 [67.3%] | (1) vs (2) P value > 0.05; (1) vs (3) P value = 0.006; (2) vs (3) P value = 0.006 |
| Kadden 2007, (1) MET + CBT + CM‐abs, (2) MET + CBT, (3) CM‐abs, (4) Health education | Joints per day (mean ± SE) | (1) 4.76 ± 3.98, N = 63, (2) 4.67 ± 6.27, N = 61, (3) 3.24 ± 2.65, N = 54, (4) 5.20 ± 5.70, N = 62 | (1) Unclear, N = 51 [81.0%], (2) Unclear, N = 49 [80.3%], (3) Unclear, N = 48 [88.9%], (4) Unclear, N = 52 [83.9%] | (1) vs (2) P value > 0.05; (1) vs (3) P value > 0.05; (1) vs (4) P value > 0.05; (2) vs (3) P value > 0.05; (3) vs (4) P value > 0.05; (2) vs (4) P value > 0.05 |
| Lee 2013, (1) MET, (2) Assessed control | Joints per week (mean ± SD) | (1) 9.35 ± 9.8, N = 106, (2) 8.29 ± 9.5, N = 106 | (1) 7.26 ± 8.4, N = 89 [84.0%], (2) 7.47 ± 10.7, N = 86 [81.1%] | (1) vs (2) P value > 0.05 [P value < 0.05 at 3 month FU only] |
| MTPRG 2004, (1) MET + CBT, (2) MET, (3) Assessed control | Joints per day (mean ± SD) | (1) 2.79 ± 2.35, N = 156, (2) 3.02 ± 2.80, N = 146, (3) 2.77 ± 2.19, N = 148 | (1) Unclear, N = 129 [82.7%], (2) Unclear, N = 120 [82.2%], (3) 2.03 ± 1.94, N = 137 [92.6%] | (1) vs (2) P value > 0.05; (1) vs (3) P value < 0.05 [d = 0.43]; (2) vs (3) P value < 0.05 [d = 0.29] |
| Roffman 1988, (1) RP, (2) SS | Joints per day (mean ± SD) | (1) 2.58 ± 0.94, N = 54, (2) 2.85 ± 0.83, N = 56 | (1) 1.11 ± 1.11, N = 45 [83.3%], (2) 1.29 ± 1.00, N = 52 [92.9%] | (1) vs (2) P value > 0.05 |
| Stephens 2000, (1) MET, (2) CBT, (3) Assessed control | Scale of quantity where 1 = once, 2 = 2‐3 times, 3 = 4‐5 times and 4 = 6+ times per day (mean ± SD) | (1) 2.41 ± 0.85, N = 88, (2) 2.59 ± 0.89, N = 117, (3) 2.61 ± 0.93, N = 86 | (1) 1.41 ± 1.20, N = 80 [90.9%], (2) 1.39 ± 1.15, N = 103 [88.0%], (3) 1.97 ± 1.09, N = 79 [91.9%] | (1) vs (2) P value > 0.05; (1) vs (3) P value < 0.001; (2) vs (3) P value < 0.001 [significant at EoT only] |
| Stephens 2007, (1) MET, (2) Drug‐related health education, (3) DTC | Number of 6‐hour periods per day that were smoked (mean ± SE) | (1) 2.07 ± 0.10, N = 62, (2) 2.00 ± 0.10, N = 62, (3) 2.19 ± 0.09, N = 64 | (1) 4.65 ± 0.28, N = 49 [79.0%], (2) 5.58 ± 0.28, N = 52 [83.9%], (3) 5.75 ± 0.24, N = 62 [96.9%] | (1) vs (2) P value < 0.05 [significant at 1.75 month FU only, d = 0.42]; (1) vs (3) P value < 0.05 [significant at 1.75 month FU only, d = 0.69]; (2) vs (3) P value > 0.05 |
* Unless otherwise indicated by *, significant treatment outcomes favour the group with the lower number; exact P values are reported when provided
CBT: Cognitive‐behavioural therapy
CM‐abs: Contingency management with vouchers presented for negative urine
CM‐adh: Contingency management with vouchers presented for treatment attendance/adherence
DC: Drug counselling
EoT: End of treatment
FU: Follow‐up
MET: Motivational enhancement therapy
RP: Relapse prevention
SD: Standard deviation
SE: Standard error
SS: Social support
TAU: Treatment as usual
Severity of cannabis use disorder
Intervention versus inactive control
Any intervention
Those receiving any intervention reported fewer symptoms of dependence at follow‐up compared with those receiving inactive control (SMD 4.15, 95% CI 1.67 to 6.63, four studies, 889 participants; Analysis 1.10). The included period of follow‐up with the most consistently available data across studies ranged between eight weeks and four months. This analysis included MET and MET + CBT interventions. The quality of evidence for this outcome was considered to be low (summary of findings Table for the main comparison).
Subgroup analysis for intensity of the intervention
Those receiving a high‐intensity intervention (more than four sessions or duration longer than one month) reported the greatest difference compared with those given inactive control (SMD 8.37, 95% CI 2.51 to 14.23, three studies, 519 participants; Analysis 1.11), and those receiving an intervention of low intensity (four or fewer sessions or duration less than one month) also reported fewer symptoms of dependence compared with those given inactive control (SMD 2.83, 95% CI 0.41 to 5.24, three studies, 370 participants; Analysis 1.11).
Subgroup analysis for type of intervention
Compared with those given inactive control, those receiving MET + CBT reported the fewest symptoms of dependence (SMD 7.89, 95% CI 0.93 to 14.85, three studies, 573 participants; Analysis 1.12), followed by those receiving MET (SMD 4.07, 95% CI 1.97 to 6.17, two studies, 316 participants; Analysis 1.12).
Studies not included in the meta‐analysis
Studies not included in this meta‐analysis also reported a significant intervention effect on symptoms of dependence. These trials included a 10‐session MET + CBT at end of treatment described in two separate studies (Hoch 2012); a single‐session and six‐session CBT at eight‐month (242 days on average) follow‐up (Copeland 2001); and a 14‐session CBT at end of treatment and a two‐session MET at three months from end of treatment (Stephens 2000).
Intervention versus treatment as usual
A single study included a comparison of active intervention (10‐session DC) versus treatment as usual among patients in psychiatric clinics and found no significant differences between groups at six‐month follow‐up, as measured by the Cannabis and Substance Use Assessment Schedule (MD 0.10, 95% CI ‐0.82 to 1.02, one study, 33 participants; Analysis 2.2) (Edwards 2006).
Intervention versus intervention
MET versus alternative treatment
One study compared a single‐session MET intervention versus single‐session DC (Stephens 2007). In this study, MET was superior across 12 months (SMD 4.32, 95% CI 3.60 to 5.04, one study, 101 participants; Analysis 3.4) (Stephens 2007). In addition, a two‐session MET intervention was found to be comparable with a more intensive 14‐session CBT across 16‐month follow‐up (SMD 0.06, 95% CI ‐0.23 to 0.36, one study, 183 participants; Analysis 3.4) (Stephens 2000). Moreover, no between‐group differences were noted among participants receiving a four‐session MET intervention or a 14‐session MET + CBT intervention at 14 weeks (Budney 2000) (data not provided). In contrast, a two‐session MET intervention was inferior to nine‐session MET + CBT at nine months (SMD ‐1.78, 95% CI ‐2.07 to ‐1.50, one study, 266 participants; Analysis 3.4); although this study was at high risk of detection bias (MTPRG 2004).
MET + CBT intervention versus alternative treatment
A single study assessed the impact of MET + CBT intervention intensity in relation to treatment outcomes of severity of cannabis dependence. At four‐month follow‐up, a four‐session MET + CBT delivered over three months was superior to the same intervention delivered over one month (SMD 4.96, 95% CI 3.95 to 5.98, one study, 64 participants; Analysis 3.4) (Jungerman 2007).
CBT (low intensity) versus CBT (high intensity)
Similarly, a single‐session CBT intervention was found to be inferior to a more intensive six‐session CBT counterpart at nine months (SMD ‐2.66, 95% CI ‐3.16 to ‐2.16, one study, 119 participants; Analysis 3.4) (Copeland 2001).
CM adjuncts and CM alone versus alternative treatment
A 14‐session MET + CBT + CM‐abs was superior to a 14‐session MET + CBT and a four‐session MET at 14 weeks with regards to the proportion of participants in remission for cannabis dependence, defined as having no DSM–IV dependence symptoms for one or more months (data not provided, reported effect size f = 0.23) (Budney 2000). Notably, a later study compared the same 14‐session MET + CBT + CM‐abs intervention versus a 14‐session CBT + CM‐adh intervention or CM‐abs alone by using the same measure (Budney 2006). Although this study was at high risk of detection bias, no between‐group differences (P value = 0.09) or time effects (P value = 0.16) were noted across 12 months (data not provided). In addition, a single study compared the impact of using CM‐abs and CM‐adh adjuncts together with nine‐session MET + CBT and DC treatments (Carroll 2006). This study reported no between‐group differences among the four treatments (MET + CBT + CM‐abs + CM‐adh, DC + CM‐abs + CM‐adh, MET + CBT and DC), although study authors reported a significant effect when groups were combined, indicating that treatments were superior when combined with CM‐abs and CM‐adh adjuncts (z = –2.23, P value = 0.03, data not provided). A final study assessed MET + CBT versus MET + CBT + CM‐abs versus CM‐abs alone and a non‐drug health promotion control (all nine sessions) (Kadden 2007). In contrast to the other noted studies, no significant between‐group differences were reported across 12 months.
Summary of cannabis dependence severity
Evidence for an intervention effect on cannabis use disorder severity was limited by few studies investigating this outcome (13 studies). In summary, evidence suggests that an intervention including either or both of MET or CBT would likely show effectiveness in reducing the severity of cannabis dependence compared with minimal treatment controls. Those trials that included comparisons between two active interventions most often included MET + CBT treatments and found that better treatment outcomes were associated with the more intensive format and the somewhat consistent finding that including CM would improve outcomes further. The quality of the evidence for reductions in severity of dependence over the short term was considered low according to the GRADE assessment of quality, that is, the number of included studies was limited, one study had high risk of bias and heterogeneity in assessment measures (including numbers of symptoms and scales of symptom severity) was evident.
We have provided in Table 4 a further summary of units of measurement and all included study findings regarding the impact of intervention and control on symptoms of dependence from baseline to follow‐up.
| Study and group | Measure | Baseline | Follow‐up [% with data] | Significance* |
| Budney 2000, (1) MET + CBT + CM‐abs, (2) MET + CBT, (3) MI | Addiction Severity Index composite scores (lowest score mean ± SD – highest score mean ± SD) | (1) 0.09 ± 0.01 ‐ 0.33 ± .03, N = 20, (2) 0.08 ± 0.05 ‐ 0.39 ± .02, N = 20, (3) 0.07 ± 0.01 & 0.42 ± .02, N = 20 | (1) 0.01 ± 0.02 ‐ 0.32 ± .04, N = 14 [70.0%], (2) 0.05 ± 0.04 ‐ 0.32 ± .03, N = 15 [75.0%], (3) 0.01 ± 0.05 ‐ 0.32 ± .04, N = 16 [80.0%] | (1) vs (2) and (1) vs (3) data provided in aggregate: P value < 0.05 for the ‘medical’ [f = 0.16] and for the ‘drug’ [f = 0.23] composite scores; (2) vs (3) P value > 0.05 |
| Budney 2006, (1) CBT + CM‐abs, (2) CBT + CM‐adh, (3) CM‐abs | Proportion with no symptoms of dependence in prior ‘month’ (%), Addiction Severity Index composite scores (data not shown) | (1) Unclear, Unclear, N = 30, (2) Unclear, Unclear, N = 30, (3) Unclear, Unclear, N = 30 | (1) 37, Unclear, N = 21 [70.0%], (2) 30, Unclear, N = 24 [80.0%], (3) 27, Unclear, N = 22 [73.3%] | (1) vs (2) P value > 0.05, P value > 0.05; (1) vs (3) P value = 0.05 at 3 month FU only, P value > 0.05; (2) vs (3) P value > 0.05, P value > 0.05 |
| Carroll 2006, (1) MET + CBT + CM‐abs + CM‐adh, (2) DC + CM‐abs, + CM‐adh, (3) MET + CBT, (4) DC | Addiction Severity Index composite scores (data not shown) | (1) Unclear, N = 33, (2) Unclear, N = 34, (3) Unclear, N = 36, (4) Unclear, N = 33 | (1) Unclear, N = 27 [81.8%], (2) Unclear, N = 24 [70.6%], (3) Unclear, N = 27 [75.0%], (4) Unclear, N = 30 [90.9%] | (1) vs (2) P value > 0.05; (1) vs (3) P value > 0.05; (1) vs (4) P value > 0.05; (2) vs (3) P value > 0.05; (3) vs (4) P value = 0.05 for the ‘legal’ composite score across FU; (2) vs (4) P value > 0.05 |
| Copeland 2001, (1) CBT [6‐session], (2) CBT [1‐session], (3) DTC | Severity of Dependence Scale score (mean ± SD) | (1) 9.2 ± 3.2, N = 78, (2) 9.8 ± 2.9, N = 82, (3) 9.3 ± 2.6, N = 69 | (1) 5.8 ± 4.3, N = 58 [74.4%], (2) 7.6 ± 4.4, N = 61 [74.4%], (3) 9.2 ± 3.2, N = 52 [75.4%] | (1) vs (2) P value = 0.04 [t = ‐2.1]; (1) vs (3) P value < 0.0001 [t = ‐4.7]; (2) vs (3) P value = 0.008 [t = ‐2.7] |
| Edwards 2006, (1) DC, (2) TAU | Cannabis and Substance Use Assessment Schedule (mean ± SD) | (1) 2.6 ± 0.9, N = 23, (2) 2.4 ± 1.2, N = 24 | (1) 1.4 ± 1.4, N = 16 [69.6%], (2) 1.3 ± 1.5, N = 17 [70.8%] | (1) vs (2) P value > 0.05 |
| Hoch 2012, (1) MET + CBT, (2) DTC | Addiction Severity Index composite scores (lowest score mean ± SD – highest score mean ± SD) | (1) 9.9 ± 1.4 – 10.1 ± 1.7, N = 90, (2) 9.7 ± 1.8 – 10.1 ± 2.1, N = 32 | (1) 3.0 ± 4.0 – 11.0 ± 9.7, N = 79 [87.8%], (2) 4.1 ± 10.7 – 13.7 ± 13.3, N = 31 [96.9%] | (1) vs (2) P value < 0.05 [for drug, legal, medical, employment and family composite scores] |
| Hoch 2014, (1) MET + CBT, (2) DTC | Severity of Dependence Scale score, number of symptoms of dependence (mean ± SD) | (1) 9.0 ± 3.4, 3.3 ± 1.6, N = 166, (2) 9.1 ± 3.5, 3.1 ± 1.6, N = 130 | (1) 4.7 ± 4.2, 0.9 ± 1.6, N = 166 [100%], (2) 7.0 ± 4.1, 2.4 ± 2.1, N = 106 [81.5%] | (1) vs (2) P value < 0.001 [d = ‐0.6], P value < 0.001 [d = ‐0.9] |
| Jungerman 2007, (1) MET + CBT [3 months], (2) MET + CBT [1 month], (3) DTC | Number of symptoms of dependence, overall Addiction Severity Index score (mean ± SE) | (1) 5.78 ± 0.31, 3.02 ± 0.21, N = 52, (2) 5.59 ± 0.30, 2.87 ± 0.20, N = 56, (3) 5.71 ± 0.31, 3.38 ± 0.21, N = 52 | (1) 4.20 ± 0.33, 2.10 ± 0.21, N = 27 [51.9%], (2) 4.86 ± 0.32, 2.77 ± 0.20, N = 37 [66.1%], (3) 5.10 ± 0.33, 2.81 ± 0.21, N = 35 [67.3%] | (1) vs (2) P value = 0.0349, P value = 0.0121; (1) vs (3) P value = 0.0349, P value > 0.05; (2) vs (3) P value > 0.05, P value > 0.05 |
| Kadden 2007, (1) MET + CBT + CM‐abs, (2) MET + CBT, (3) CM‐abs, (4) Health education | Addiction Severity Index composite scores (lowest score mean ± SD – highest score mean ± SD) | (1) 0.09 ± 0.09 – 0.25 ± 0.19, N = 63. (2) 0.12 ± 0.12 – 0.25 ± 0.07, N = 61, (3) 0.09 ± 0.10 – 0.26 ± 0.05, N = 54, (4) 0.11 ± 0.14 – 0.25 ± 0.21, N = 62 | (1) Unclear, N = 51 [81.0%], (2) Unclear, N = 49 [80.3%], (3) Unclear, N = 48 [88.9%], (4) Unclear, N = 52 [83.9%] | (1) vs (2) P value > 0.05; (1) vs (3) P value > 0.05; (1) vs (4) P value > 0.05; (2) vs (3) P value > 0.05; (3) vs (4) P value > 0.05; (2) vs (4) P value > 0.05 |
| MTPRG 2004, (1) MET + CBT, (2) MET, (3) Assessed control | Number of symptoms of dependence (mean ± SD), Addiction Severity Index composite scores (lowest score mean ± SD – highest score mean ± SD) | (1) 5.62 ± 1.17, 0.11 ± 0.13 – 0.26 ± 0.30, N = 156, (2) 5.70 ± 1.20, 0.12 ± 0.13 – 0.28 ± 0.31, N = 146, (3) 5.56 ± 1.33, 0.11 ± 0.12 – 0.16 ± 0.25, N = 148 | (1) 2.81 ± 2.40, 0.10 ± 0.11 – 0.25 ± 0.32, N = 129 [82.7%], (2) 3.63 ± 2.08, 0.13 ± 0.10 – 0.26 ± 0.32, N = 120 [82.2%], (3) 4.36 ± 1.92, 0.11 ± 0.12 – 0.20 ± 0.17, N = 137 [92.6%] | (1) vs (2) P value < 0.05 [at 9 month FU only, d = 0.31], P value > 0.05; (1) vs (3) P value > 0.05, P value < 0.05 [for ‘employment’ composite only]; (2) vs (3) P value > 0.05, P value < 0.05 [for ‘employment’ composite only] |
| Stephens 2000, (1) MET, (2) CBT, (3) Assessed control | Number of symptoms of dependence (mean ± SD) | (1) Unclear, N = 88, (2) Unclear, N = 117, (3) Unclear, N = 86 [6.74 ± 1.97 for total sample with no significant group differences] | (1) 2.75 ± 3.18, N = 80 [90.9%], (2) 2.83 ± 3.27, N = 103 [88.0%], (3) 4.63 ± 2.59, N = 79 [91.9%] | (1) vs (2) P value > 0.05; (1) vs (3) P value < 0.001; (2) vs (3) P value < 0.001 [significant at EoT only] |
| Stephens 2007, (1) MET, (2) Drug‐related health education, (3) DTC | Number of symptoms of dependence (mean ± SD) | (1) 3.92 ± 1.78, N = 62, (2) 3.26 ± 1.93, N = 62, (3) 3.17 ± 1.93, N = 64 | (1) 2.43 ± .018, N = 49 [79.0%], (2) 2.88 ± 0.18, N = 52 [83.9%], (3) 2.85 ± 0.20, N = 62 [96.9%] | (1) vs (2) P value < 0.05 [d = 0.48, 0.45 and 0.37 across FU]; (1) vs (3) P value < 0.05 [significant at 1.75 month FU, d = 0.58]; (2) vs (3) P value > 0.05 |
* Unless otherwise indicated by *, significant treatment outcomes favour the group with the lower number; exact P values are reported when provided.
CBT: Cognitive‐behavioural therapy
CM‐abs: Contingency management with vouchers presented for negative urine
CM‐adh: Contingency management with vouchers presented for treatment attendance/adherence
DC: Drug counselling
DTC: Delayed treatment control
EoT: End of treatment
FU: Follow‐up
MET: Motivational enhancement therapy
SD: Standard deviation
SE: Standard error
TAU: Treatment as usual
Cannabis‐related problems
Intervention versus inactive control
Any intervention
Those receiving any intervention reported fewer cannabis‐related problems at follow‐up compared with those receiving inactive control (SMD 3.34, 95% CI 1.26 to 5.42, six studies, 2202 participants; Analysis 1.13). The period of follow‐up with the greatest consistency between studies ranged between seven weeks and four months. This analysis included MET, CBT and MET + CBT interventions. We considered the quality of evidence for this outcome to be low (summary of findings Table for the main comparison).
Subgroup analysis for intensity of intervention
Those receiving a high‐intensity intervention (more than four sessions or duration longer than one month) reported the greatest difference compared with inactive control (SMD 5.14, 95% CI 2.57 to 7.70, four studies, 1535 participants; Analysis 1.14); those receiving an intervention of low intensity (four or fewer sessions or duration less than one month) reported fewer problems (SMD 2.50, 95% CI 1.01 to 3.98, five studies, 667 participants; Analysis 1.14).
Subgroup analysis for type of intervention
Compared with those given inactive control, those receiving CBT reported the fewest problems (SMD 7.88, 95% CI 6.86 to 8.90, one study, 135 participants; Analysis 1.15), followed by those given MET + CBT (SMD 3.85, 95% CI ‐0.39 to 8.10, three studies, 1455 participants; Analysis 1.15) and MET (SMD 3.29, 95% CI 1.85 to 4.72, four studies, 612 participants; Analysis 1.15).
Studies not included in this meta‐analysis
No intervention effect over inactive control was found for four‐session MET (although this study consisted of females only, and assessments for risk of bias were largely unclear; Stein 2011); one‐session MET (a significant between‐group difference was noted at three months, but this difference was not significant at six‐month follow‐up) (this study was at high risk of other bias; Lee 2013); nine‐session MET + CBT + CM‐abs and nine‐session MET + CBT + CM‐adh (although this study was at high risk of detection and other bias; Litt 2013). A two‐session MET + CBT group was more likely to “make efforts to cut back or quit” and use community resources compared with inactive control but otherwise was similar in terms of problem behaviours such as driving vehicles while stoned over 12 months (this study was at high risk of other bias; Bernstein 2009). Finally, investigators found that both single‐session and six‐session CBT interventions were superior to inactive control at approximately eight months (242 days on average) (Copeland 2001).
Intervention versus treatment as usual
No included study compared changes in cannabis‐related problems following intervention or treatment as usual.
Intervention versus intervention
RP versus SS
A total of two studies compared RP‐based and SS‐based interventions (each 10 sessions, delivered in groups of 12 to 15). No between‐group differences were reported in the first study over 12 months, with the exception that SS participants were reportedly "able to go to sleep at night more easily" (Roffman 1988). In the second trial of these interventions, although assessments of risk of bias were largely unclear, no between‐group differences were reported across three months (MD ‐0.25, 95% CI ‐0.29 to ‐0.21, one study, 156 participants; Analysis 3.5) (Stephens 1994).
MET versus alternative treatments
A total of two studies compared MET interventions versus alternative interventions. MET was found to be inferior to MET + CBT (MD ‐0.34, 95% CI ‐0.47 to ‐0.22, two studies, 292 participants; Analysis 3.5). In contrast, a two‐session MET intervention was comparable with MET + CBT + CM‐abs (MD 0.04, 95% CI ‐0.22 to 0.30, one study, 30 participants; Analysis 3.5).
DC versus non‐drug education
In an initial study, single‐session DC delivered orally and in workbook form was reported to be superior to non‐drug health promotion control conditions (also delivered orally or via workbook) with regards to changing inhalation/breath‐holding techniques and driving after cannabis use at three‐month and 12‐month follow‐up (although in this study, data were presented by combining these intervention and control conditions, and assessments for risk of bias were largely unclear; Fischer 2012).
CBT (low intensity) versus CBT (high intensity)
A single‐session CBT intervention was found to be inferior to a six‐session CBT intervention at eight months (MD ‐0.40, 95% CI ‐0.46 to ‐0.35, one study, 119 participants; Analysis 3.5) (Copeland 2001).
CM adjuncts and CM alone versus alternative treatment
A total of two additional studies assessed the impact of CM treatments; each found no treatment effect. First, no between‐group differences were found between 14‐session CBT + CM‐abs, CBT + CM‐adh and CM‐abs interventions across 12 months (data not provided) (although this study was at high risk of detection bias; Budney 2006). Second, no differences were found between MET + CBT + CM‐abs versus CM‐abs alone versus MET + CBT versus a non‐drug health promotion control across 12 months (data not provided) (all nine sessions; Kadden 2007).
Summary of cannabis‐related problems
Evidence of an intervention effect on cannabis‐related problems was somewhat limited by the reduced number of studies investigating this outcome (17 studies). In summary, given the general lack of pattern between intervention types and significant effectiveness in reducing cannabis‐related problems over time, it is difficult for review authors to recommend any treatment without further research. The quality of evidence for reduction in cannabis‐related problems over the short term was considered low according to the GRADE assessment of quality, that is, one study was at high risk of bias, heterogeneity in assessment measures was evident (specifically regarding what was considered a cannabis‐related problem), data conversions were required to obtain a standardised period of assessment and the period of follow‐up varied across studies.
A further summary of units of measurement and of all included study findings regarding the impact of intervention and control on numbers of cannabis‐related problems from baseline to follow‐up is provided in Table 5.
| Study and group | Measure | Baseline | Follow‐up [% with data] | Significance* |
| Bernstein 2009, (1) Brief MET + CBT, (2) Assessed control | Percent reporting risky behaviours following use: fighting, driving, being careful (%) | (1) 50.0, 14.6, 78.1, N = 55, (2) 51.6, 14.8, 69.1, N = 64 | (1) 12.8, 17.0, 73.9, N = 47 [69.1%], (2) 34.6, 24.5, 70.4, N = 55 [77.5%] | (1) vs (2) all P value > 0.05 |
| Budney 2000, (1) MET + CBT + CM‐abs, (2) MET + CBT, (3) MET | Modified Drug Abuse Screening Test “Marijuana Consequences Questionnaire” (mean ± SE) | (1) 7.7 ± 0.62, N = 20, (2) 7.1 ± 0.60, N = 20, (3) 6.7 ± 0.60, N = 20 | (1) 3.7 ± 0.86, N = 14 [70.0%], (2) 1.9 ± 0.78, N = 15 [75.0%], (3) 1.5 ± 1.0, N = 16 [80.0%] | (1) vs (2) P value > 0.05; (1) vs (3) P value > 0.05; (2) vs (3) P value > 0.05 |
| Budney 2006, (1) CBT + CM‐abs, (2) CBT + CM‐adh, (3) CM‐abs | Marijuana Problem Scale (mean ± SD) | (1) 7.8 ± 4.8, N = 30, (2) 7.9 ± 4.0, N = 30, (3) 7.8 ± 4.4, N = 30 | (1) Unclear, N = 21 [70.0%], (2) Unclear, N = 24 [80.0%], (3) Unclear, N = 22 [73.3%] | (1) vs (2) P value > 0.05; (1) vs (3) P value > 0.05; (2) vs (3) P value > 0.05 |
| Copeland 2001, (1) CBT [6‐session], (2) CBT [1‐session], (3) DTC | Cannabis Problems Questionnaire (mean ± SD) | (1) 42.4 ± 17.1, N = 78, (2) 42.2 ± 18.6, N = 82, (3) 45.4 ± 16.3, N = 69 | (1) 23.0 ± 16.8, N = 58 [74.4%], (2) 28.4 ± 18.6, N = 61 [74.4%], (3) 39.1 ± 16.6, N = 52 [75.4%] | (1) vs (2) P value > 0.05; (1) vs (3) P value = 0.004; (2) vs (3) P value < 0.0001 |
| Hoch 2014, (1) MET + CBT, (2) DTC | Cannabis Problems Questionnaire, Cannabis Use Problems Identification Test (mean ± SD) | (1) 6.7 ± 4.2, 41.8 ± 11.7, N = 166, (2) 6.8 ± 4.3, 43.3 ± 11.3, N = 130 | (1) 27.1 ± 14.1, 2.9 ± 3.8, N = 166 [100%], (2) 37.1 ± 14.7, 5.6 ± 4.4, N = 106 [81.5%] | (1) vs (2) P value < 0.001 [d = ‐0.7], P value < 0.001 [d = ‐0.7] |
| Fischer 2012, (1) DC [oral], (2) DC [workbook], (3) Health promotion [oral], (4) Health promotion [workbook] | Proportion reporting driving a car while under the influence of cannabis, and deep inhalation smoking (%) | (1) 80.0, 40.0, N = 24, (2) 76.60, 46.81, N = 47, (3) 76.0, 29.17, N = 25, (4) 83.78, 27.59, N = 37 | (1) Unclear, N = Unclear, (2) Unclear, N = Unclear, (3) Unclear, N = Unclear, (4) Unclear, N = Unclear [data reported by combining groups (1) + (2) and (3) + (4)] | (1) vs (2) P value > 0.05; (1) vs (3) P value > 0.05; (1) vs (4) P value > 0.05; (2) vs (3) P value > 0.05; (3) vs (4) P value > 0.05; (2) vs (4) P value > 0.05 [combining (1) + (2) vs (3) + (4) was P value < 0.05, Q = 13.1, P value < 0.05, Q = 9.3] |
| Jungerman 2007, (1) MET + CBT [3 months], (2) MET + CBT [1 month], (3) DTC | Marijuana Problem Scale (mean ± SE) | (1) 10.21 ± 0.58, N = 52, (2) 9.80 ± 0.56, N = 56, (3) 9.71 ± 0.58, N = 52 | (1) 8.52 ± 0.63, N = 27 [51.9%], (2) 9.54 ± 0.61, N = 37 [66.1%], (3) 8.92 ± 0.64, N = 35 [67.3%] | (1) vs (2) P value > 0.05; (1) vs (3) P value > 0.05; (2) vs (3) P value > 0.05 |
| Kadden 2007 (1) MET + CBT + CM‐abs, (2) MET + CBT, (3) CM‐abs, (4) Health education | Marijuana Problem Scale (mean ± SD) | (1) 13.42 ± 6.84, N = 63, (2) 13.97 ± 7.52, N = 61, (3) 12.62 ± 6.09, N = 54, (4) 15.19 ± 6.74, N = 62 | (1) Unclear, N = 51 [81.0%], (2) Unclear, N = 49 [80.3%], (3) Unclear, N = 48 [88.9%], (4) Unclear, N = 52 [83.9%] | (1) vs (2) P value > 0.05; (1) vs (3) P value > 0.05; (1) vs (4) P value > 0.05; (2) vs (3) P value > 0.05; (3) vs (4) P value > 0.05; (2) vs (4) P value > 0.05 |
| Lee 2013, (1) MET, (2) Assessed control | Adapted Marijuana Problems Index (mean ± SD) | (1) 10.45 ± 4.9, N = 106, (2) 10.38 ± 5.9, N = 106 | (1) 6.54 ± 5.3, N = 89 [84.0%], (2) 6.75 ± 6.5, N = 86 [81.1%] | (1) vs (2) P value < 0.05, [significant at 3 month FU only] |
| Litt 2013, (1) MET + CBT + CM‐abs, (2) MET + CBT + CM‐adh, (3) Assessed control | Marijuana Problem Scale (data presented in an unclear figure) | (1) Unclear, N = 73, (2) Unclear, N = 71, (3) Unclear, N = 71 | (1) Unclear, N = 60 [82.2%], (2) Unclear, N = 61 [85.9%], (3) Unclear, N = 61 [85.9%] | (1) vs (2) P value > 0.05; (1) vs (3) P value > 0.05; (2) vs (3) P value > 0.05 |
| MTPRG 2004, (1) MET + CBT, (2) MET, (3) Assessed control | Marijuana Problem Scale (mean ± SD) | (1) 9.47 ± 3.51, N = 156, (2) 10.18 ± 3.47, N = 146, (3) 9.07 ± 3.53, N = 148 | (1) Unclear, N = 129 [82.7%], (2) Unclear, N = 120 [82.2%], (3) Unclear, N = 137 [92.6%] | (1) vs (2) P value > 0.05, [significant at 4 month FU only, d = 0.41]; (1) vs (3) P value < 0.05 [d = 0.53]; (2) vs (3) P value > 0.05 |
| Roffman 1988, (1) RP, (2) SS | Modified Drug Abuse Screening Test – Marijuana Problem Scale (data provided as total sample only) | (1) Unclear, N = 54, (2) Unclear, N = 56 | (1) Unclear, N = 45 [83.3%], (2) Unclear, N = 52 [92.9%] | (1) vs (2) P value < 0.05 |
| Stein 2011, (1) MET, (2) Assessed control | Marijuana Problem Scale (mean ± SD) | (1) 4.82 ± 4.66, N = 163, (2) 4.99 ± 4.71, N = 169 | (1) Unclear, N = 126 [77.3%], (2) Unclear, N = 136 [80.5%] | (1) vs (2) P value > 0.05 |
| Stephens 1994, (1) RP, (2) SS | Drug Abuse Screening Test (mean ± SD) | (1) 8.88 ± 2.86, N = 106, (2) 6.31 ± 4.28, N = 106 | (1) 3.27 ± 3.41, N = 80 [75.5%], (2) 2.91 ± 3.64, N = 87 [82.1%] | (1) vs (2) P value > 0.05 |
| Stephens 2000, (1) MET, (2) CBT, (3) Assessed control | Marijuana Problem Scale (mean ± SD) | (1) 9.99 ± 2.89, N = 88, (2) 9.86 ± 3.05, N = 117, (3) 9.78 ± 2.96, N = 86 | (1) 12.99 ± 11.61, N = 80 [90.9%], (2) 12.29 ± 12.34, N = 103 [88.0%], (3) 7.89 ± 4.23, N = 79 [91.9%] | (1) vs (2) P value > 0.05; (1) vs (3) P value < 0.001; (2) vs (3) P value < 0.001 [significant at EoT only] |
| Stephens 2007, (1) MET, (2) Drug‐related health education, (3) DTC | Marijuana Problem Scale (mean ± SE) | (1) 6.37 ± 3.71, N = 62, (2) 5.31 ± 3.53, N = 62, (3) 6.31 ± 4.28, N = 64 | (1) 3.95 ± 0.40, N = 49 [79.0%], (2) 5.21 ± 0.40, N = 52 [83.9%], (3) 5.01 ± 0.40, N = 62 [96.9%] | (1) vs (2) P value > 0.05; (1) vs (3) P value > 0.05; (2) vs (3) P value > 0.05 |
* Unless otherwise indicated by *, significant treatment outcomes favour the group with the lower number; exact P values are reported when provided
CBT: Cognitive‐behavioural therapy
CM‐abs: Contingency management with vouchers presented for negative urine
CM‐adh: Contingency Management with vouchers presented for treatment attendance/adherence
DC: Drug counselling
EoT: End of treatment
FU: Follow‐up
MET: Motivational enhancement therapy
RP: Relapse prevention
SD: Standard deviation
SE: Standard error
SS: Social support
TAU: Treatment as usual
Retention in treatment
Heterogeneity across studies in measurement of treatment retention and lack of studies in which participants were randomly allocated to low‐intensity or high‐intensity interventions prevented meta‐analysis. On average, seven out of ten participants completed treatment (ES 0.71, 95% CI 0.63 to 0.78, 11 studies, 1424 participants; Figure 3). This analysis included MET, CBT, CBT + adh, CBT + CM‐abs, MET + CBT, MET + CBT + CM‐abs + CM‐adh, DC, DC + CM‐abs + CM‐adh, MM and CM‐abs interventions. The quality of evidence for this outcome was considered to be high (summary of findings Table for the main comparison).

Pooled analysis of retention in treatment.
Most of the studies that investigated whether greater treatment retention was associated with improved treatment outcomes found no such significant relationship (Budney 2000; Budney 2006; Carroll 2006; Carroll 2012; de Dios 2012; Kadden 2007; Litt 2013; Stein 2011), including the only study to investigate the importance of completing homework between sessions, which found no significant impact on treatment outcomes following CBT‐based intervention (Carroll 2012). In contrast, Copeland 2001 reported significantly improved outcomes in terms of dependence and related problems among treatment completers compared with non‐completers for both six‐session and single‐session CBT interventions. Future research is needed to provide clarity and particularly to directly compare outcomes for participants who do not completely adhere to an intensive treatment versus outcomes for participants who complete a comparable number of sessions of less intensive treatment.
The quality of evidence for retention in treatment was considered moderate according to the GRADE assessment of quality. The only notable limitation was small heterogeneity in assessment measures, in that some studies reported treatment completion as the proportion of participants completing a subset of final treatment sessions rather than the full set of sessions. A further summary of measurement of treatment retention across all experimental arms of the included studies is provided in Table 6.
| Study | Intended number of sessions | Intended treatment duration, weeks | Treatment adherence, % | Completed sessions, mean ± SD |
| CBT | ||||
| 1 | n/a | 87.8% attended | n/a | |
| 6 | 6 | 91% attended ≥ 1; 50% completed | 4.2 ± 2.2 | |
| 12 | 12 | 53.1% completed treatment | 5.9 ± 3.8* | |
| 14 | 14 | 50% attended 10 or more sessions including sessions 9 and 10 | 8.42 ± 3.51 | |
| CBT + CM‐abs | ||||
| 14 | 14 | 87% provided 3 or more urine specimens | 9.6 ± 4.9 | |
| 12 | 12 | 47.2% completed treatment | 5.9 ± 3.8* | |
| CBT + CM‐adh | ||||
| 14 | 14 | 87% provided 3 or more urine specimens | 8.8 ± 5.0 | |
| 12 | 12 | 59.4% completed treatment | 5.9 ± 3.8* | |
| MET | ||||
| 4 | 14 | 45% completed ≥ 1 session and provided ≥ 1 urine specimen during the final 2 weeks of treatment | ‐ | |
| 2 | 4 | 80.4% completed treatment | 1.7 ± 0.6 | |
| 2 | 6 | 71.9% completed treatment | 1.6 | |
| 1 | 7 | 88.7% completed treatment | ‐ | |
| MET + CBT | ||||
| 9 | 12 | 47% completed treatment | 6.5 | |
| 2 | 56 | 100% completed ≥ 1 session | ‐ | |
| 4 | 4 | 85.7% completed treatment | ‐ | |
| 4 | 12 | 67.3% completed treatment | ‐ | |
| 9 | 9 | ‐ | 4.9 ± 3.3 | |
| 8 | 8 | 66.7% completed treatment | ‐ | |
| 10 | 5‐8 | 87.8% completed treatment | 7 | |
| 10 | 8‐12 | 65.1% completed treatment | ||
| 13 | 18 | 54.2% “declined the intervention” | ‐ | |
| 14 | 14 | 65% completed ≥ 1 session | ||
| MET + CBT + CM‐abs | ||||
| 14 | 14 | 55% completed ≥ 1 session | ‐ | |
| 9 | 9 | ‐ | 5.5 ± 3.8 | |
| 9 | 9 | ‐ | 5.6 ± 3.6 | |
| MET + CBT + CM‐adh | ||||
| 9 | 9 | ‐ | 5.7 ± 3.5 | |
| MET + CBT + CM‐abs + CM‐adh | ||||
| 8 | 8 | 69.7% completed treatment | 5.1 ± 2.5 | |
| DC | ||||
| 8 | 8 | 39.4% completed treatment | ‐ | |
| 10 | 12 | ‐ | 7.6 ± 2.8 | |
| Drug‐related health education | ||||
| 1 | 7 | 93.5% completed treatment | ‐ | |
| DC + CM‐abs + CM‐adh | ||||
| 8 | 8 | 63.7% completed treatment | ‐ | |
| MM | ||||
| 2 | 2 | 72.7% completed treatment | ||
| RP | ||||
| 10 | 12 | 87.8% received ≥ 4 sessions | 7.54* | |
| 14 | 18 | 69% attended 7 or more sessions* | 7.6 ± 2.5* | |
| SS | ||||
| 10 | 12 | 73.2% received ≥ 4 sessions | 7.54* | |
| 14 | 18 | 69% attended 7 or more sessions* | 7.6 ± 2.5* | |
| CM‐abs | ||||
| 12 | 12 | 83% provided 3 or more urine specimens | ‐ | |
| 12 | 12 | 59.3% completed treatment | ‐ | |
| 9 | 9 | ‐ | 5.5 ± 3.8 | |
* These data were reported as a total sample only, although no between‐group differences were noted across interventions
CBT: Cognitive‐behavioural therapy
CM‐abs: Contingency management with vouchers presented for negative urine
CM‐adh: Contingency management with vouchers presented for treatment attendance/adherence
DC: Drug counselling
DTC: Delayed treatment control
MET: Motivational enhancement therapy
MM: Mindfulness meditation
RP: Relapse prevention
SS: Social support
Secondary outcomes
Motivation to quit
Heterogeneity across studies in the measurement of motivation to quit cannabis use prevented meta‐analysis.
Intervention versus inactive control
Three studies included a comparison between active treatment and an inactive control condition, with each reporting no significant intervention effect (Litt 2013; Stein 2011; Stephens 2007).
Intervention versus treatment as usual
Two trials included a comparison between active treatment and treatment as usual among patients in a psychiatric clinic. First, MET when delivered "as needed" over six months (on average six sessions received) was found to be superior at three‐month follow‐up with regards to score on the Contemplation Ladder, but no significant between‐group differences were reported at six‐month or 12‐month follow‐up (Bonsack 2011). Similarly, no significant treatment effect of a 10‐session DC was noted at six‐month follow‐up with regards to the proportion of participants actively attempting to abstain (Edwards 2006).
Intervention versus intervention
Three studies included comparisons between active treatments, each reporting no significant differences between groups, with one exception. Comparisons that revealed no significant between‐group differences included MET + CBT versus MET + CBT + CM‐abs using the Situational Confidence Questionnaire (Budney 2000); MET + CBT + CM‐abs versus MET + CBT + CM‐adh using the Marijuana Self Efficacy Questionnaire (although this study was at high risk of detection and other bias; Litt 2013); and MET versus DC using the proportion of participants contemplating change (Stephens 2007). The sole exception was a 14‐session MET + CBT trial, which was found to be superior in enhancing confidence to quit (as measured by the Situational Confidence Questionnaire) when compared with four‐session MET at end of treatment (MD 25.10, 95% CI 9.79 to 40.41, one study, 31 participants; Analysis 3.7).
Summary of motivation to quit
Evidence for an effect of intervention on motivation to quit cannabis use was greatly limited by the few studies investigating this outcome (six studies). Given the lack of any particular intervention effectiveness over time, it is difficult to make treatment recommendations for improving motivation to quit without conducting further research. Notably, although it was not assessed as a treatment outcome, use of coping skills during treatment and self efficacy to quit post treatment were found to be significant predictors of other cannabis‐related treatment outcomes in the MTPRG 2004 trial. Similarly, it was noteworthy that trials that did not include treatment‐seeking participants (who could be assumed to be motivated to quit from baseline) but recruited from non‐cannabis treatment settings reported particularly poor cannabis‐related treatment outcomes, that is, three trials found no significant improvement over control at any follow‐up point (Bernstein 2009; Edwards 2006; Lee 2013); two trials reported limited improvement, which was non‐significant by final follow‐up (Bonsack 2011; Stein 2011); and only one trial found improved treatment outcomes in groups receiving intensive treatments compared with less intensive control treatments (Carroll 2012). Finally, when motivation to abstain from cannabis was assessed as a potential mediator of treatment effect, some evidence suggested that motivation to quit at baseline may be an important indicator of overall treatment success (Litt 2013; Stein 2011), although other studies found no such association (Bonsack 2011; Budney 2000; Edwards 2006; Stephens 2007).
A summary of units of measurement and all included study findings regarding the impact of intervention and control on motivation to quit cannabis use from baseline to final follow‐up is provided in Table 7.
| Study and group | Measure | Baseline | Follow‐up [% with data] | Significance* |
| Bonsack 2011, (1) MET, (2) TAU | The Contemplation Ladder; a scale score from 0‐100 of readiness, importance and confidence to change (median) | (1) 50.0, 50.0, 50.0, N = 30, (2) 50.0, 25.0, 50.0, N = 32 | (1) 56.25, 50.0, 75.0, N = 25 [83.3%], (2) 50.0, 50.0, 60.0, N = 29 [90.6%] | (1) vs (2) P value > 0.05, P value > 0.05, P value = 0.02 on the ‘confidence’ score at 3 month FU only, d = 0.64 |
| Budney 2000, (1) MET + CBT + CM‐abs, (2) MET + CBT, (3) MET | Adapted University of Rhode Island Change Assessment score, Situational Confidence Questionnaire (overall score least squares mean ± SE) | (1) 9.1 ± 0.36, 55.4 ± 3.9, N = 20, (2) 9.6 ± 3.5, 50.7 ± 3.9, N = 20, (3) 9.4 ± 0.34, 55.1 ± 4.3, N = 20 | (1) 8.5 ± 0.56, 68.4 ± 6.4, N = 14 [70.0%], (2) 8.6 ± 0.45, 79.0 ± 5.4, N = 15 [75.0%], (3) 6.6 ± 0.64, 58.3 ± 7.4, N = 16 [80.0%] | (1) vs (2)* P value > 0.05, P value < 0.05 [favours group 2]; (1) vs (3) P value > 0.05, P value > 0.05 (2) vs (3)* P value > 0.05, P value < 0.05 [favours group 2] |
| Edwards 2006, (1) DC, (2) TAU | Readiness to Change Questionnaire‐Cannabis (% in ‘action’ stage) | (1) 25.0, N = 23, (2) 29.5, N = 24 | (1) 27.3, N = 16 [69.6%], (2) 38.6, N = 17 [70.8%] | (1) vs (2) P value > 0.05 |
| Litt 2013, (1) MET + CBT + CM‐abs, (2) MET + CBT + CM‐adh, (3) Assessed control | Marijuana Self‐Efficacy Questionnaire, Coping Strategies Scale, Readiness to Change Questionnaire (data provided in unclear figure) | (1) Unclear, N = 73, (2) Unclear, N = 71, (3) Unclear, N = 71 | (1) Unclear, N = 60 [82.2%], (2) Unclear, N = 61 [85.9%], (3) Unclear, N = 61 [85.9%] | (1) vs (2) all P value > 0.05; (1) vs (3) all P value > 0.05; (2) vs (3) all P value > 0.05 |
| Stein 2011, (1) MET, (2) Assessed control | Percent with a desire to abstain (%) | (1) 56.8, N = 163, (2) 63.5, N = 169 | (1) 77.3, N = 126 [77.3%], (2) 80.5, N = 136 [80.5%] | (1) vs (2) P value > 0.05 |
| Stephens 2007, (1) MET, (2) Drug‐related health education, (3) DTC | Readiness to Change Questionnaire (% in pre‐contemplation or contemplation stage) | (1) 68, N = 62, (2) 87, N = 62, (3) 70, N = 64 | (1) Unclear, N = 49 [79.0%], (2) Unclear, N = 52 [83.9%], (3) Unclear, N = 62 [96.9%] | (1) vs (2) P value > 0.05; (1) vs (3) P value > 0.05; (2) vs (3) P value > 0.05 |
* Unless otherwise indicated, significant treatment outcomes favour the group with the lower number; exact P values are reported when provided
CBT: Cognitive‐behavioural therapy
CM‐abs: Contingency management with vouchers presented for negative urine
CM‐adh: Contingency management with vouchers presented for treatment attendance/adherence
DC: Drug counselling
DTC: Delayed treatment control
EoT: End of treatment
FU: Follow‐up
MET: Motivational enhancement therapy
RP: Relapse prevention
SE: Standard error
TAU: Treatment as usual
Other substance use
Differences in the measures used to assess non‐cannabis substance use and heterogeneity between studies investigating this outcome (12 studies) prevented meta‐analysis. Notably, no trial included more than one‐third of participants reporting heavy substance use at baseline (according to trial inclusion criteria for this review), and most did not recruit participants who reported recent illicit drug use.
Intervention versus inactive control
No active intervention was found to be superior to inactive control by final follow‐up (Hoch 2012; Hoch 2014; Jungerman 2007; Kadden 2007; MTPRG 2004; Stephens 2000; Stephens 2007).
Intervention versus treatment as usual
No included study of intervention versus treatment as usual compared changes to non‐cannabis substance use from baseline to follow‐up.
Intervention versus intervention
MET + CBT + CM‐abs versus alternative intervention
A single trial found that participants receiving a 14‐session MET + CBT + CM‐abs intervention reported greater reductions in alcohol use and other substance use at end of treatment compared with those receiving both four‐session MET (MD 0.80, 95% CI 0.75 to 0.85, one study, 30 participants; Analysis 3.8; and MD 0.11, 95% CI 0.06 to 0.16, one study, 30 participants; Analysis 3.9, respectively) and a 14 session MET + CBT intervention (MD 0.78, 95% CI 0.73 to 0.83, one study, 29 participants; Analysis 3.8; and MD 0.08, 95% CI 0.03 to 0.13, one study, 29 participants; Analysis 3.9, respectively) (Budney 2000). In contrast, no significant between‐group differences in severity of other drug dependence were noted between those receiving a nine‐session MET + CBT + CM‐abs intervention and those given nine sessions of MET + CBT or CM‐abs over 12 months (Kadden 2007).
MET versus alternative intervention
Two trials compared MET versus MET + CBT interventions and reported no significant between‐group differences at final follow‐up when alcohol and other drug dependence severity or frequency of alcohol use was assessed (Budney 2000; MTPRG 2004). Similarly, no between‐group differences were noted among participants receiving a two‐session MET intervention or 14 sessions of CBT (Stephens 2000) or a single session of MET compared with DC (Stephens 2007).
MET + CBT (low intensity) versus MET + CBT (high intensity)
A single trial assessed the impact of MET + CBT intervention intensity, reporting no effects for frequency of alcohol use, although the more intensive intervention was superior with regards to severity of drug dependence (MD 0.82, 95% CI 0.12 to 1.52, one study, 64 participants; Analysis 3.9).
RP versus SS
No significant between‐group differences were reported between those receiving 10‐session RP or 10‐session SS at one month (Roffman 1988) or over 12 months (although assessments for risk of bias were largely unclear for this study; Stephens 1994).
CBT + CM‐abs versus CBT + CM‐adh versus CM‐abs
A single trial compared 14‐session CBT + CM‐abs versus CBT + CM‐adh versus CM‐abs interventions over 12 months and reported no significant differences in days of use or severity of other drug use dependence (although this study was at high risk of detection bias; Budney 2006).
MET + CBT versus DC versus MET + CBT + AM‐abs + CM‐adh versus DC + CM‐abs + CM‐adh
A single trial compared eight‐session MET + CBT and DC interventions without and with CM‐abs + CM‐adh adjuncts and reported no significant between‐group differences in severity of alcohol and drug dependence over six months (Carroll 2006).
Summary of other substance use
Evidence for an intervention effect on other substance use was somewhat limited by heterogeneity in measures and few studies investigating this outcome (12 studies). In summary, given the lack of any particular intervention effectiveness over time, it is difficult for review authors to make any treatment recommendations for improving mental health without further research.
A summary of units of measurement and all included study findings regarding the impact of intervention and control on non‐cannabis substance use from baseline to follow‐up is provided in Table 8.
| Study and group | Measure | Baseline | Follow‐up [% with data] | Significance* |
| Budney 2000, (1) MET + CBT + CM‐abs, (2) MET + CBT, (3) MET | Addiction Severity Index ‘alcohol’ and ‘drug use’ composite scores (least squares mean ± SE) | (1) 0.9 ± 0.01, 0.22 ± 0.01, N = 20, (2) 0.12 ± 0.01, 0.20 ± 0.01, N = 20, (3) 0.07 ± 0.01, 0.21 ± 0.01, N = 20 | (1) 0.11 ± 0.02, 0.01 ± 0.02, N = 14 [70.0%], (2) 0.11 ± 0.02, 0.07 ± 0.02, N = 15 [75.0%], (3) 0.08 ± 0.02, 0.11 ± 0.02, N = 16 [80.0%] | (1) vs (2) P value > 0.05, P value < 0.05 [f = 0.23]; (1) vs (3) P value > 0.05, P value < 0.05 [f = 0.23]; (2) vs (3) P value > 0.05, P value > 0.05 |
| Budney 2006, (1) CBT + CM‐abs, (2) CBT + CM‐adh, (3) CM‐abs | Addiction Severity Index ‘alcohol’ and ‘drug use’ composite scores (mean ± SD) | (1) 0.09 ± 0.10, 0.23 ± 0.09, N = 30, (2) 0.10 ± 0.13, 0.25 ± 0.09, N = 30, (3) 0.11 ± 0.11, 0.24 ± 0.08, N = 30 | (1) Unclear, N = 21 [70.0%], (2) Unclear, N = 24 [80.0%], (3) Unclear, N = 22 [73.3%] | (1) vs (2) P value > 0.05; (1) vs (3) P value > 0.05; (2) vs (3) P value > 0.05 |
| Carroll 2006, (1) MET + CBT + CM‐abs + CM‐adh, (2) DC + CM‐abs + CM‐adh, (3) MET + CBT, (4) DC | Addiction Severity Index for alcohol and drug use (data not provided) | (1) Unclear, N = 33, (2) Unclear, N = 34, (3) Unclear, N = 36, (4) Unclear, N = 33 | (1) Unclear, N = 27 [81.8%], (2) Unclear, N = 24 [70.6%], (3) Unclear, N = 27 [75.0%], (4) Unclear, N = 30 [90.9%] | (1) vs (2) P value > 0.05; (1) vs (3) P value > 0.05; (1) vs (4) P value > 0.05; (2) vs (3) P value > 0.05; (3) vs (4) P value > 0.05; (2) vs (4) P value > 0.05 |
| Hoch 2012, (1) MET + CBT, (2) DTC | Addiction Severity Index ‘alcohol’ and ‘drug use’ composite scores (mean ± SD) | (1) 10.0 ± 1.0, 10.0 ± 0.7, N = 90, (2) 9.9 ± 0.8, 10.0 ± 0.7, N = 32 | (1) 11.0 ± 9.7, 3.0 ± 4.0, N = 79 [87.8%], (2) 13.7 ± 13.3, 8.3 ± 3.5, N = 31 [96.9%] | (1) vs (2) P value > 0.05, P value > 0.05 |
| Hoch 2014, (1) MET + CBT, (2) DTC | Litres per consumption day of alcohol (mean ± SD), proportion of daily smokers (%), proportion using any illicit drug (%) | (1) 0.2 ± 0.3, 78.2, 10.6, N = 166, (2) 0.2 ± 0.3, 82.0, 7.1, N = 130 | (1) 0.2 ± 0.4, 78.5, 13.0, N = 166 [100%], (2) 0.2 ± 0.02, 82.1, 8.6, N = 106 [81.5%] | (1) vs (2) P value > 0.05, P value > 0.05, P value > 0.05 |
| Jungerman 2007, (1) MET + CBT [3 months], (2) MET + CBT [1 month], (3) DTC | Percent of days post baseline used alcohol (mean ± SE), Addiction Severity Index drug use composite score (mean ± SE) | (1) 10.03 ± 2.20, 3.02 ± 0.21, N = 52, (2) 11.16 ± 2.12, 2.87 ± 0.20, N = 56, (3) 10.06 ± 2.20, 3.38 ± 0.21, N = 52 | (1) 7.09 ± 2.07, 2.10 ± 0.21 N = 27 [51.9%], (2) 9.13 ± 1.99, 2.77 ± 0.20, N = 37 [66.1%], (3) 9.01 ± 2.07, 2.81 ± 0.21, N = 35 [67.3%] | (1) vs (2) P value > 0.05, P value = 0.0121; (1) vs (3) P value > 0.05, P value > 0.05; (2) vs (3) P value > 0.05, P value > 0.05 |
| Kadden 2007 (1) MET + CBT + CM‐abs, (2) MET + CBT, (3) CM‐abs, (4) Health education | Addiction Severity Index ‘alcohol’ and ‘drug use’ composite scores (mean ± SD) | (1) 0.09 ± 0.10, 0.26 ± 0.05, N = 63, (2) 0.12 ± 0.12, 0.25 ± 0.07, N = 61, (3) 0.11 ± 0.14, 0.23 ± 0.07, N = 54, (4) 0.09 ± 0.09, 0.23 ± 0.07, N = 62 | (1) Unclear, N = 51 [81.0%], (2) Unclear, N = 49 [80.3%], (3) Unclear, N = 48 [88.9%], (4) Unclear, N = 52 [83.9%] | (1) vs (2) P value > 0.05, P value > 0.05; (1) vs (3) P value > 0.05, P value > 0.05; (1) vs (4) P value > 0.05, P value > 0.05; (2) vs (3) P value > 0.05, P value > 0.05; (3) vs (4) P value > 0.05, P value > 0.05; (2) vs (4) P value > 0.05, P value > 0.05 |
| MTPRG 2004, (1) MET + CBT, (2) MET, (3) Assessed control | Days alcohol used in prior 90 days (mean ± SD), Addiction Severity Index for alcohol (mean ± SD) | (1) 48.79 ± 79.10, 0.11 ± 0.13, N = 156, (2) 59.41 ± 84.56, 0.12 ± 0.13, N = 146, (3) 46.57 ± 85.48, 0.11 ± 0.12, N = 148 | (1) 46.12 ± 106.70, 0.10 ± 0.11, N = 129 [82.7%], (2) 45.56 ± 76.62, 0.12 ± 0.13, N = 120 [82.2%], (3) 42.92 ± 62.48, 0.11 ± 0.12, N = 137 [92.6%] | (1) vs (2) P value > 0.05, P value > 0.05; (1) vs (3) P value > 0.05, P value > 0.05; (2) vs (3) P value > 0.05, P value > 0.05 |
| Roffman 1988, (1) RP, (2) SS | Occasions of use in prior week for alcohol and tobacco, proportion reporting any illicit drug use (data provided for total sample only) | (1) Unclear, N = 54, (2) Unclear, N = 56 | (1) Unclear, N = 45 [83.3%], (2) Unclear, N = 52 [92.9%] | (1) vs (2) P value > 0.05 |
| Stephens 1994, (1) RP, (2) SS | Average occasions of use in a typical week for alcohol and illicit drugs in the prior 90 days, number of alcohol‐related and drug‐related problem scores from the Drug Abuse Screening Test (data provided for total sample only) | (1) Unclear, N = 106, (2) Unclear, N = 106 | (1) Unclear, N = 80 [75.5%], (2) Unclear, N = 87 [82.1%] | (1) vs (2) all P value > 0.05 |
| Stephens 2000, (1) MET, (2) CBT, (3) Assessed control | Frequency of alcohol and other drug use in the prior 90 days, number of alcohol and drug‐related problems from unclear 19‐item assessment (mean) | (1) Unclear, N = 88, (2) Unclear, N = 117, (3) Unclear, N = 86 [data reported as total sample only] | (1) 0.48, N = 80 [90.9%], (2) 0.76, N = 103 [88.0%], (3) 5.01, N = 79 [91.9%] [data reported as total sample only, with the exception of other drug use frequency] | (1) vs (2) all P value > 0.05; (1) vs (3) all P value > 0.05, except other drug use frequency P value < 0.05; (2) vs (3) all P value > 0.05, except other drug use frequency P value < 0.05 [significant at EoT only] |
| Stephens 2007, (1) MET, (2) Drug‐related health education, (3) DTC | Days used in prior week for alcohol and illicit drugs and number of alcohol and drug‐related problems from unclear assessment (mean ± SD when provided) | (1) 2.00 ± 2.08, 0.16 ± 0.43, Unclear, N = 62, (2) 1.38 ± 1.63, 0.13 ± 0.23, Unclear, N = 62, (3) 1.90 ± 2.12, 0.11 ± 0.19, Unclear, N = 64 | (1) Unclear, N = 49 [79.0%], (2) Unclear, N = 52 [83.9%], (3) Unclear, N = 62 [96.9%] | (1) vs (2) all P value > 0.05; (1) vs (3) all P value > 0.05; (2) vs (3) all P value > 0.05 |
* Unless otherwise indicated by *, significant treatment outcomes favour the group with the lower number; exact P values are reported when provided
CBT: Cognitive‐behavioural therapy
CM‐abs: Contingency management with vouchers presented for negative urine
CM‐adh: Contingency management with vouchers presented for treatment attendance/adherence
DC: Drug counselling
DTC: Delayed treatment control
EoT: End of treatment
FU: Follow‐up
MET: Motivational enhancement therapy
RP: Relapse prevention
SD: Standard deviation
SE: Standard error
SS: Social support
TAU: Treatment as usual
Mental health
Differences in the measures used to assess non‐cannabis substance use and heterogeneity between studies investigating this outcome (12 studies) prevented meta‐analysis.
Intervention versus inactive control
Five trials compared active treatments versus inactive control; none found a significant treatment effect on several measures of mental health (see Table 9).
| Study and group | Measure | Baseline | Follow‐up [% with data] | Significance* |
| Bonsack 2011, (1) MET, (2) TAU | PANSS‐P, PANSS‐N, GAF, SOFAS, Proportion admitted to hospital during trial period (median ± range) | (1) 17.0 ± 19.0, 18.0 ± 18, 40.0 ± 20.0, 40.0 ± 19.0, n/a, N = 30, (2) 17.0 ± 21.0, 17.5 ± 13, 40.0 ± 40.0, 40.0 ± 40.0, n/a, N = 32 | (1) 16.0 ± 22, 17.0 ± 16.0, 40 ± 24, 40.5 ± 24, 30.0, N = 25 [83.3%], (2) 16.0 ± 20.0, 17.5 ± 17.0, 40.0 ± 40.0, 41.0 ± 30.0, 34.4, N = 29 [90.6%] | (1) vs (2) P value > 0.05, P value > 0.05, P value > 0.05, P value > 0.05, P value > 0.05 |
| Budney 2000, (1) MET + CBT + CM‐abs, (2) MET + CBT, (3) MET | Global Symptom Index of the Brief Symptom Inventory (least squares, mean ± SE) | (1) 68.1 ± 1.8, N = 20, (2) 65.6 ± 1.8, N = 20, (3) 67.9 ± 1.9, N = 20 | (1) 58.9 ± 2.9, N = 14 [70.0%], (2) 55.4 ± 2.3, N = 15 [75.0%], (3) 58.7 ± 3.4, N = 16 [80.0%] | (1) vs (2) P value > 0.05; (1) vs (3) P value > 0.05; (2) vs (3) P value > 0.05 |
| Budney 2006, (1) CBT + CM‐abs, (2) CBT + CM‐adh, (3) CM‐abs | Global Symptom Index of the Brief Symptom Inventory, Beck Depression Inventory (least squares, mean ± SD) | (1) 1.0 ± 0.79, 14.2 ± 11.7, N = 30, (2) 1.1 ± 0.93, 15.6 ± 12.0, N = 30, (3) 1.1 ± 0.79, 15.0 ± 12.1, N = 30 | (1) Unclear, Unclear, N = 21 [70.0%], (2) Unclear, Unclear, N = 24 [80.0%], (3) Unclear, Unclear, N = 22 [73.3%] | (1) vs (2) P value > 0.05; (1) vs (3) P value > 0.05; (2) vs (3) P value > 0.05 |
| Carroll 2006, (1) MET + CBT + CM‐abs, + CM‐adh, (2) DC + CM‐abs + CM‐adh, (3) MET + CBT, (4) DC | Addiction Severity Index composite scores (data not shown) | (1) Unclear, N = 33, (2) Unclear, N = 34, (3) Unclear, N = 36, (4) Unclear, N = 33 | (1) Unclear, N = 27 [81.8%], (2) Unclear, N = 24 [70.6%], (3) Unclear, N = 27 [75.0%], (4) Unclear, N = 30 [90.9%] | (1) vs (2) P value > 0.05; (1) vs (3) P value > 0.05; (1) vs (4) P value > 0.05; (2) vs (3) P value > 0.05; (3) vs (4) P value = 0.05 [for the ‘legal’ score across FU]; (2) vs (4) P value > 0.05 |
| Copeland 2001, (1) CBT [6‐session], (2) CBT [1‐session], (3) DTC | Symptom Checklist‐90 Global Severity Index (mean ± SD) | (1) 0.7 ± 0.3, N = 78, (2) 0.7 ± 0.4, N = 82, (3) 0.7 ± 0.3, N = 69 | (1) 0.6 ± 0.3, N = 58 [74.4%], (2) 0.5 ± 0.4, N = 61 [74.4%], (3) 0.6 ± 0.4, N = 52 [75.4%] | (1) vs (2) P value > 0.05; (1) vs (3) P value > 0.05; (2) vs (3) P value > 0.05 |
| Edwards 2006, (1) DC, (2) TAU | BPRS‐E, BPRS‐PS, SANS, BDI‐SF, SOFAS, KAPQ (mean ± SD) | (1) 49.9 ± 16.3, 10.3 ± 5.4, 28 ± 16, 10.4 ± 6.6, 48.7 ± 17.2, 21.2 ± 3.9, N = 23, (2) 48.8 ±1 7, 10.8 ± 5.2, 24.7 ± 13.6, 8.8 ± 8.1, 49.8 ± 14.8, 20.3 ± 5.4, N = 24 | (1) 45.6 ± 13.5, 9.4 ± 4.6, 23.7 ± 17.2, 7.5 ± 6.3, 51.7 ± 18.3, 22.4 ± 4.0, N = 16 [69.6%], (2) 44.8 ± 15.4, 8.8 ± 4.8, 19.4 ± 13.5, 6.3 ± 7.2, 56.4 ± 15.9, 21.5 ± 4.1, N = 17 [70.8%] | (1) vs (2) all P value > 0.05 |
| Hoch 2012, (1) MET + CBT, (2) DTC | Brief Symptom Inventory, disability days in the prior month using the M‐CIDI (mean ± SD) | (1) 0.9 ± 0.6, 9.4 ± 10.2, N = 90, (2) 0.9 ± 0.5, 6.6 ± 8.7, N = 32 | (1) 0.4 ± 0.4, 3.2 ± 5.9, N = 79 [87.8%], (2) 0.7 ± 0.5, 6.5 ± 9.6, N = 31 [96.9%] | (1) vs (2) P value > 0.05, P value < 0.05 |
| Kadden 2007, (1) MET + CBT + CM‐abs, (2) MET + CBT, (3) CM‐abs, (4) Health education | Psychiatric composite score from the Addiction Severity Index (mean ± SD) | (1) 0.25 ± 0.19, N = 63, (2) 0.24 ± 0.20, N = 61, (3) 0.25 ± 0.21, N = 54, (4) 0.22 ± 0.23, N = 62 | (1) Unclear, N = 51 [81.0%], (2) Unclear, N = 49 [80.3%], (3) Unclear, N = 48 [88.9%], (4) Unclear, N = 52 [83.9%] | (1) vs (2) P value > 0.05; (1) vs (3) P value > 0.05; (1) vs (4) P value > 0.05; (2) vs (3) P value > 0.05; (3) vs (4) P value > 0.05; (2) vs (4) P value > 0.05 |
| Madigan 2013, (1) MET + CBT, (2) TAU | Insight composite of the BIS, SAPS, SANS, CDSS, GAF, WHOQOL (mean ± SD) | (1) 6.8 ± 2.8, 5.4 ± 4.0, 7.7 ± 3.1, 5.1 ± 5.7, 38.3 ± 13.1, 12.5 ± 4.0, N = 59, (2) 6.3 ± 2.7, 5.7 ± 4.8, 7.4 ± 3.0, 5.0 ± 6.4, 38.0 ± 9.0, 13.3 ± 2.8, N = 29 | (1) 7.0 ± 2.9, 4.9 ± 4.0, 4.6 ± 3.0, 4.3 ± 4.4, 37.6 ± 8.34, 12.6 ± 3.4, N = 32 [54.2%], (2) 6.6 ± 1.5, 5.1 ± 4.2, 4.8 ± 3.2, 4.3 ± 4.2, 37.2 ± 11.5, 11.1 ± 2.9, N = 19 [65.5%] | (1) vs (2) all P value > 0.05, except for the WHOQOL at P value = 0.05 |
| MTPRG 2004, (1) MET + CBT, (2) MET, (3) Assessed control | Beck Depression Inventory, STAI‐S (mean ± SD) | (1) 11.39 ± 7.00, 39.87 ± 11.62, N = 156, (2) 13.21 ± 8.60, 41.61 ± 12.19, N = 146, (3) 10.09 ± 7.35, 37.29 ± 11.53, N = 148 | (1) 7.34 ± 8.29, 33.61 ± 11.32, N = 129 [82.7%], (2) 10.16 ± 9.36, 38.85 ± 12.66, N = 120 [82.2%], (3) 7.87 ± 6.78, 35.50 ± 11.21, N = 137 [92.6%] | (1) vs (2) P value > 0.05, P value < 0.05 at 4 month FU only; (1) vs (3) P value > 0.05, P value < 0.05; (2) vs (3) P value > 0.05, P value > 0.05 |
* Unless otherwise indicated, significant treatment outcomes favour the group with the lower number; exact P values are reported when provided
BDI‐SF: Beck Depression Inventory‐Short Form
BIS: Birchwood Insight Scale
BPRS‐E: Brief Psychiatric Rating Scale‐Expanded
BPRS‐PS: Brief Psychiatric Rating Scale‐Positive Symptom subscale
CBT: Cognitive‐behavioural therapy
CDSS: Calgary Depression Scale for Schizophrenia
CM‐abs: Contingency management with vouchers presented for negative urine
CM‐adh: Contingency management with vouchers presented for treatment attendance/adherence
DC: Drug counselling
DTC: Delayed treatment control
EoT: End of treatment
FU: Follow‐up
GAF: Global Assessment of Functioning scale
KAPQ: Knowledge About Psychosis Questionnaire
M‐CIDI: Munich‐Composite International Diagnostic Interview
MET: Motivational enhancement therapy
PANSS: Positive and Negative Syndrome Scale
SANS: Scale for the Assessment of Negative Symptoms
SAPS: Scale for the Assessment of Positive Symptoms
SD: Standard deviation
SE: Standard error
SOFAS: Social and Occupational Functioning Scale
TAU: Treatment as usual
WHOQOL: World Health Organization, Quality of Life assessment
Intervention versus treatment as usual
Three studies compared active interventions versus treatment as usual among patients in psychiatric clinics (Bonsack 2011; Edwards 2006; Madigan 2013). No significant intervention effect was found at final follow‐up.
Intervention versus intervention
Several trials included comparisons between two active treatments; all reported no significant between‐group differences on a variety of measures of mental health by final follow‐up (see Table 9).
Summary of mental health
Evidence of an intervention effect on participant mental health was limited by the small number of studies investigating this outcome (10 studies). In summary, given the lack of effectiveness of any particular intervention over time, it is difficult to make treatment recommendations for improving mental health without further research. A further summary of units of measurement and all included study findings regarding the impact of intervention and control on participant mental health from baseline to follow‐up is provided in Table 9.
Discussion
A total of 23 studies, with a total of 4045 participants, met the inclusion criteria for this review. Several different treatment styles were examined, with the weight of evidence focusing on motivational enhancement therapy (MET) and cognitive‐behavioural therapy (CBT) interventions. Although moderate evidence indicates that significant reductions in cannabis use frequency are likely in the short term (within six months), complete abstinence was not often attained. Moreover, treatment was not consistently effective in reducing cannabis‐related problems or in addressing secondary outcomes such as other substance use and mental health concerns. Available evidence was most supportive of MET + CBT‐based interventions of greater intensity and longer duration (more than four sessions, delivered over more than one month). It is likely that complementing these treatments with contingency management with vouchers presented for negative urine (CM‐abs) will enhance effects on outcomes in the short term, but little evidence suggests that this addition would improve results over the long term (nine months onwards).
Summary of main results
For comparison of any intervention versus inactive control, frequency of cannabis use was most consistently assessed by all included trials. Each trial reported a significant reduction in cannabis use, and moderate evidence indicates that those receiving any intervention reported fewer days of cannabis use compared with those given inactive control through four‐month follow‐up. In contrast, scant evidence indicates that just over one‐third of intervention participants reported point‐prevalence abstinence immediately post treatment, and that this proportion was reduced as the follow‐up period increased to approximately one in four at final follow‐up. Studies typically confirmed these abstinence rates by using bioanalysis (urine and hair samples). For those who achieved abstinence but relapsed later, the period of abstinence was reported to last approximately one month. In addition, scant evidence suggests that participants who received any intervention reported fewer symptoms of cannabis dependence and fewer cannabis‐related problems compared with those given inactive control through four‐month follow‐up. Further, very little evidence suggested a treatment effect on the number of joints used per day of use when those receiving intervention reported fewer joints at up to approximately eight‐month follow‐up compared with those given inactive control. Little evidence was found on the effect of treatment over inactive control post eight‐month follow‐up. Heterogeneity in measurement of secondary outcomes prevented meta‐analysis, but little evidence showed any treatment effect over inactive control conditions on motivation to quit cannabis use, non‐cannabis substance use or mental health concerns. Finally, moderate evidence indicates that participants were likely to complete treatment as intended.
For any intervention versus treatment as usual, three included studies assessed intervention effect versus treatment as usual among patients at out‐patient psychiatric clinics. Investigators found no evidence of between‐group differences across these trials at final follow‐up on any of the primary or secondary treatment outcomes included in this review.
For intervention versus intervention, studies made few direct comparisons between intervention types, but MET + CBT interventions were most consistently effective compared with alternative treatments with regards to reductions in cannabis use frequency and symptoms of dependence. Moreover, meta‐analyses of primary outcomes found that MET + CBT interventions outperformed MET and CBT interventions delivered individually. Notably, two studies found that this type of intervention showed even greater effect on frequency of cannabis use when paired with CM‐abs adjunct treatment (Budney 2000; Carroll 2006). Finally, additional subgrouping showed that intensive interventions (more than four sessions or delivered over longer than one month) had greater treatment effect on each primary outcome compared with less intensive interventions. Little evidence was found to support one intervention over another with regards to all other investigated outcomes over the long term (particularly from nine‐month follow‐up onward).
In summary, despite an obvious need for future treatment comparisons that include greater focus on outcomes beyond frequency of cannabis use, available evidence shows the most consistent support for MET + CBT‐based cannabis interventions with the adjunct of CM‐abs when possible. Although it was not possible to determine an ideal number of sessions or treatment duration, evidence most consistently supported more intense and longer interventions over less intense and shorter counterparts. Given this finding, it is noteworthy that among experimental arms, an average of just six sessions was provided across trials, indicating that included interventions appear to favour brevity over intensity.
Overall completeness and applicability of evidence
This review was limited by a small number of studies on similar treatment types showing great heterogeneity (preventing any meta‐analysis), relatively few studies assessing treatment outcomes beyond six months and, finally, the fact that participants who were not frequent cannabis users were excluded from this review (thus, treatment trials for occasional users were excluded). In summary, review authors believe that this review update was produced through an unbiased process limited only by the adequacy of reporting in included studies. Despite reportedly successful delivery of each treatment in a research setting, the included studies suffered from serious limitations, which reduced the external validity of included treatment types and hampered recommendations of a particular treatment type. The most serious of these limitations are discussed here.
-
Although the range of included intervention types showed some breadth, MET‐ and CBT‐based interventions were prevalent, and more modern treatment types such as mindfulness techniques or acceptance commitment therapy were largely absent.
-
Great heterogeneity across studies was evident in assessment procedures chosen and measures used to assess primary (most notably, cannabis‐related problems) and secondary treatment outcomes (most notably, mental health concerns). Among the treatment outcomes noted in this review, only frequency of cannabis use and severity of cannabis use disorder shared relatively common measures across studies and were most impacted by treatment.
-
Included participants were typically white Caucasian males in their late twenties to early thirties. These features describe the typical cannabis treatment seeker, and the handful of trials that addressed this limitation reported no significant differences in treatment outcomes by gender or age. In contrast, the only study that addressed ethnicity when assessing treatment outcomes found that interventions including contingency management were significantly less effective among black than white participants, and that black participants were significantly less likely to complete all treatment sessions (Carroll 2006). Despite this, two separate trials, which included African American participants as the majority, found significant treatment effects on cannabis use over the long term (Bernstein 2009; Carroll 2012). The applicability of treatments to females, older adults and non‐Caucasian individuals is less clear.
-
Although the sample size of individual treatment groups was adequate across trials (n = 64.2 on average), and although most participants completed treatment as intended, an important minority of sessions were not completed. Whether reported treatment outcomes reflect those receiving the full complement of treatment or simply most of the treatment remains unclear. Indeed, only one trial found a significant association between treatment completers and improved outcomes compared with non‐completers. Future research is required to delineate the importance of treatment completion as compared with moderate to high attendance.
-
Only a handful of studies assessed participants' previous experience with cannabis treatment or previous attempts at quitting cannabis. Although it was unclear whether these studies directly investigated the impact of previous quit attempts, no study indicated that such experience had a significant impact on treatment outcomes.
-
Few included trials were conducted outside the USA, leaving the applicability of treatments to other cultures relatively unclear. On this basis, the external validity of included trials was rated as weak.
-
No study excluded participants on the basis of their use of tobacco, and only five studies assessed the status of tobacco use at baseline. Information on tobacco use during the trial period was provided by three studies; none found any intervention effect or change in tobacco use across follow‐up (Hoch 2014; Kadden 2007; Roffman 1988). No study provided specific information concerning how tobacco use was addressed during cannabis treatment. This lack of information on tobacco use is a matter of concern as outcomes of cannabis use treatment have been shown elsewhere to be significantly moderated by tobacco use (Agrawal 2012).
Quality of the evidence
As shown in summary of findings Table for the main comparison, the validity of the included trials was very low to moderate. The quality of evidence for the primary outcomes of cannabis use frequency and quantity and cannabis‐related problems was typically impacted by lack of assessment of non‐cannabis substance use or by use of additional treatments before or during the trial period. Across trials, performance and detection bias was a matter of concern, as participant blinding was not possible and researcher blinding was often left unclear or not reported. With the exception of assessment of dependence severity, data conversions were necessary to standardise outcome assessments. Also, with the exception of days of cannabis use, conversion to standardised mean differences was required for each of the primary outcomes because heterogeneity was noted in the measures used.
Notably, the few trials that assessed tobacco smoking found that smoking was prevalent but did not prevent a significant intervention effect on cannabis use frequency. Further, among the few trials that assessed use of additional treatments, the prevalence of accessing additional treatments during the trial period was found to be low. In addition, no trial was at high risk of selection bias because investigators used appropriate randomisation and participant allocation procedures. Similarly, it was common for the included studies to address trial drop‐out by providing appropriate analyses and plans and reporting all pre‐specified treatment outcomes, and no trial had high risk of attrition and reporting bias. Finally, the included trials recruited a large number of participants (total of n = 4045) and provided excellent training and supervision of therapists to ensure treatment fidelity.
Potential biases in the review process
Strengths of this review include use of two independent review authors (who did not have a financial interest in the outcome) in the processes of study selection, data collection and analysis and a strong likelihood that all relevant studies were identified (as per detailed search criteria).
Agreements and disagreements with other studies or reviews
Three relevant previous systematic reviews of cannabis treatments have been conducted, although one focused on prevention programmes specifically targeting adolescent cannabis use within schools as opposed to intervention programs (Tobler 1999). The two remaining reviews examined community‐delivered treatments for adolescent cannabis users (Bender 2011) and psychosocial interventions for individuals who were actively seeking treatment (excluding non‐treatment seekers with problematic use; Davis 2014). Treatments with best evidence for adolescent cannabis users included family members, such as multi‐dimensional family therapy (Bender 2011). In this meta‐analytical review, MET‐based interventions were comparable with family‐oriented interventions, and each had moderate treatment effects that waned after 12‐month follow‐up. Consistent with these results, the current review highlighted support for MET interventions but did not include family‐based interventions. Further, outcomes were seen to wane over time but perhaps earlier at post six‐ to nine‐month follow‐up. In the remaining review, behavioural therapies (including MET, CBT and CM) were found to be more effective over inactive control among adult treatment seekers, but review authors found no significant differences in treatment intensityand noted that only approximately one in two participants achieved abstinence (Davis 2014). Consistent with these results, the weight of evidence in the current review supports MET + CBT‐based interventions, and at treatment end, abstinence rates were comparably low, with an average of just over one in three participants achieving abstinence. In contrast, the current review identified consistency in studies that compared treatments of differing intensity and showed greater support for more intense treatments.

Study flow diagram.

Risk of bias summary: review authors' judgements about each risk of bias item for each included study.

Pooled analysis of retention in treatment.
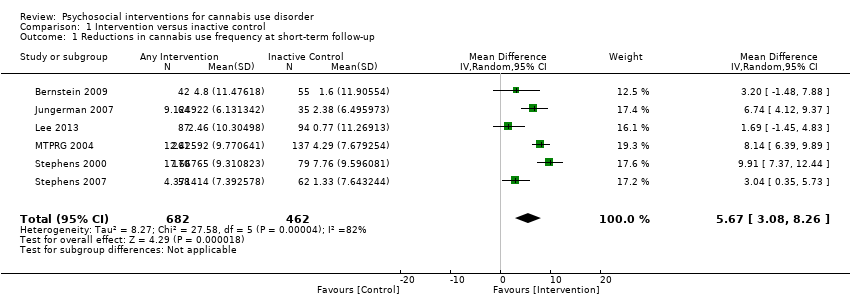
Comparison 1 Intervention versus inactive control, Outcome 1 Reductions in cannabis use frequency at short‐term follow‐up.

Comparison 1 Intervention versus inactive control, Outcome 2 Reduction in cannabis use frequency at short‐term follow‐up (intervention intensity).

Comparison 1 Intervention versus inactive control, Outcome 3 Reduction in cannabis use frequency at short‐term follow‐up (intervention type).

Comparison 1 Intervention versus inactive control, Outcome 4 Point‐prevalence abstinence at short‐term follow‐up.

Comparison 1 Intervention versus inactive control, Outcome 5 Point‐prevalence abstinence at short‐term follow‐up (intervention intensity).

Comparison 1 Intervention versus inactive control, Outcome 6 Point‐prevalence abstinence at short‐term follow‐up (intervention type).

Comparison 1 Intervention versus inactive control, Outcome 7 Reduction in joints per day at short‐term follow‐up.

Comparison 1 Intervention versus inactive control, Outcome 8 Reduction in joints per day at short‐term follow‐up (intervention intensity).
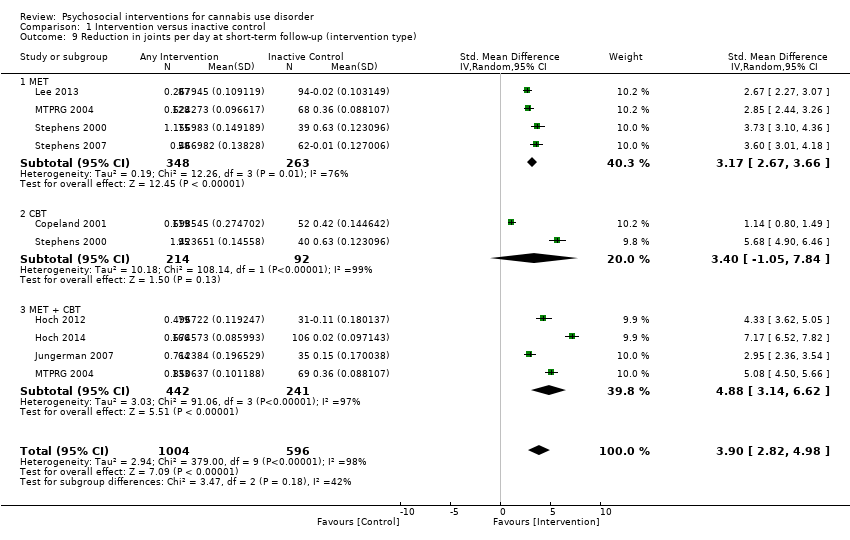
Comparison 1 Intervention versus inactive control, Outcome 9 Reduction in joints per day at short‐term follow‐up (intervention type).

Comparison 1 Intervention versus inactive control, Outcome 10 Reduction in symptoms of dependence at short‐term follow‐up.

Comparison 1 Intervention versus inactive control, Outcome 11 Reduction in symptoms of dependence at short‐term follow‐up (intervention intensity).
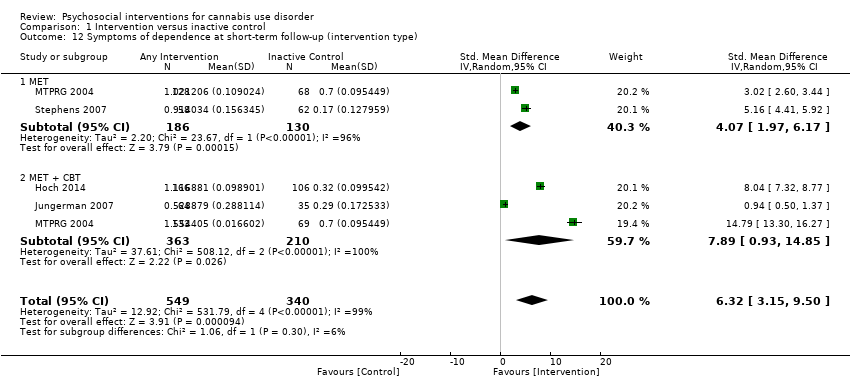
Comparison 1 Intervention versus inactive control, Outcome 12 Symptoms of dependence at short‐term follow‐up (intervention type).

Comparison 1 Intervention versus inactive control, Outcome 13 Reduction in cannabis‐related problems at short‐term follow‐up.
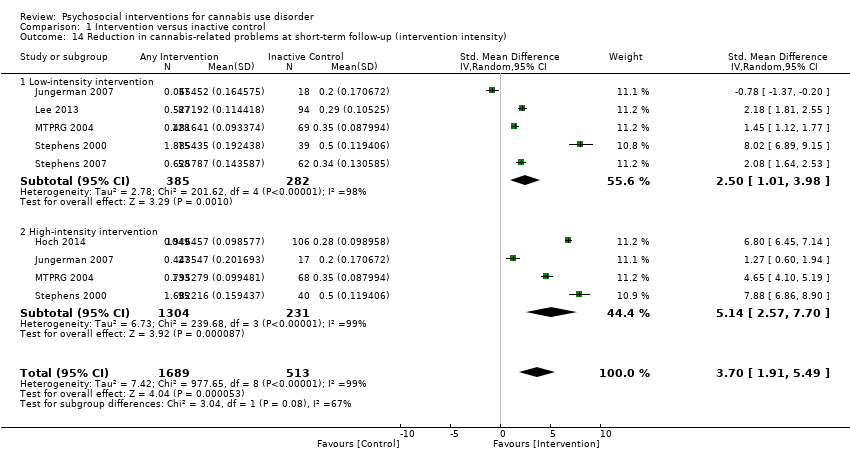
Comparison 1 Intervention versus inactive control, Outcome 14 Reduction in cannabis‐related problems at short‐term follow‐up (intervention intensity).
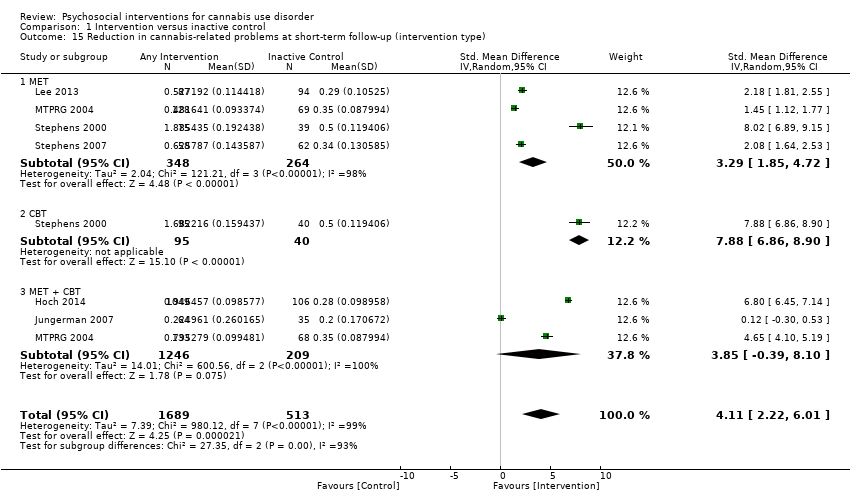
Comparison 1 Intervention versus inactive control, Outcome 15 Reduction in cannabis‐related problems at short‐term follow‐up (intervention type).
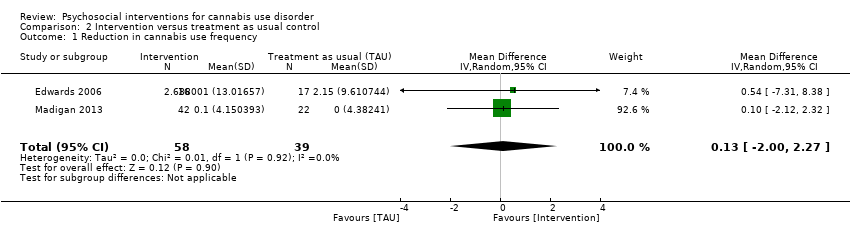
Comparison 2 Intervention versus treatment as usual control, Outcome 1 Reduction in cannabis use frequency.
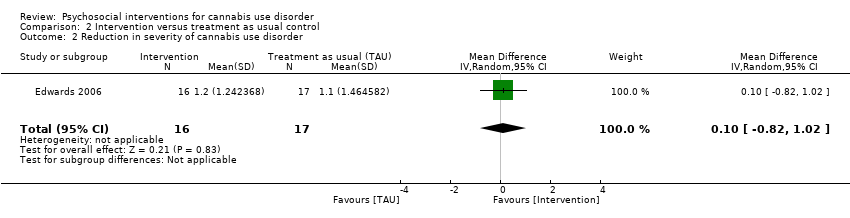
Comparison 2 Intervention versus treatment as usual control, Outcome 2 Reduction in severity of cannabis use disorder.

Comparison 3 Intervention A versus Intervention B, Outcome 1 Reduction in cannabis use frequency.

Comparison 3 Intervention A versus Intervention B, Outcome 2 Point‐prevalence abstinence.

Comparison 3 Intervention A versus Intervention B, Outcome 3 Reduction in joints used per day.

Comparison 3 Intervention A versus Intervention B, Outcome 4 Reduction in symptoms of dependence.
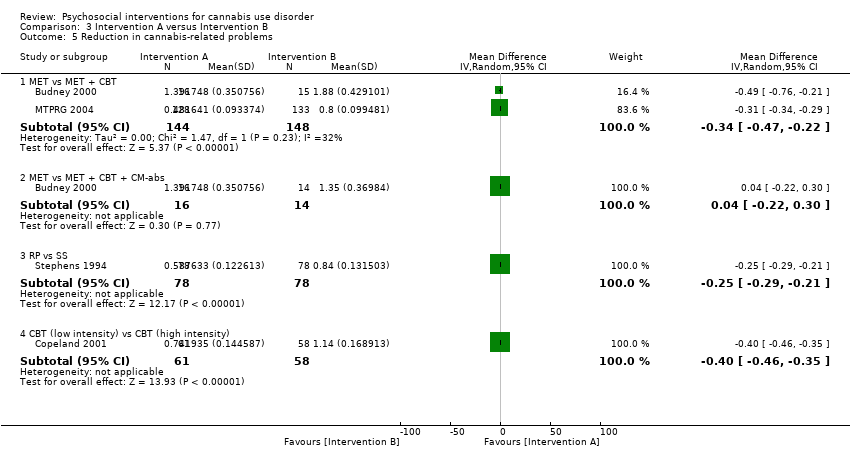
Comparison 3 Intervention A versus Intervention B, Outcome 5 Reduction in cannabis‐related problems.

Comparison 3 Intervention A versus Intervention B, Outcome 6 Treatment completion.

Comparison 3 Intervention A versus Intervention B, Outcome 7 Improvement in motivation to quit.
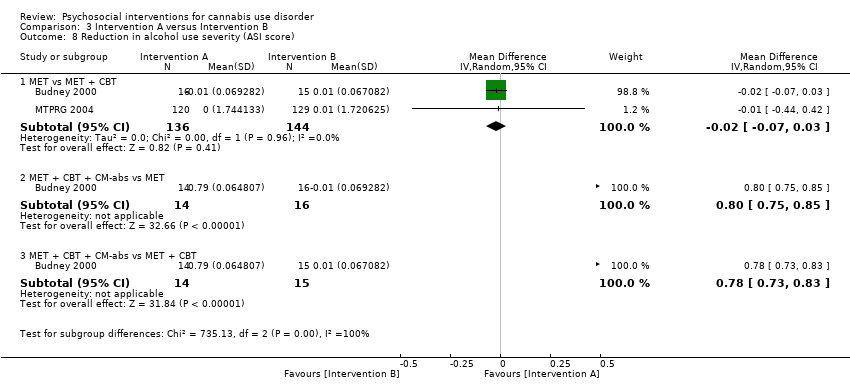
Comparison 3 Intervention A versus Intervention B, Outcome 8 Reduction in alcohol use severity (ASI score).

Comparison 3 Intervention A versus Intervention B, Outcome 9 Reduction in drug use severity (ASI score).

Comparison 3 Intervention A versus Intervention B, Outcome 10 Reduction in frequency of alcohol use.
| Psychosocial intervention compared with inactive control for cannabis use disorder | ||||||
| Patient or population: adults with cannabis use disorder or frequent cannabis use Settings: out‐patient treatment Intervention: psychosocial intervention Comparison: inactive control | ||||||
| Outcomes | Illustrative comparative risks* (95% CI) | Relative effect | Number of participants | Quality of the evidence | Comments | |
| Assumed risk | Corresponding risk | |||||
| Inactive control | Psychosocial intervention | |||||
| Cannabis use frequency at short‐term follow‐up | Mean number of cannabis using days in the past 30 days ranged across control groups from | Mean number of cannabis using days among intervention groups was | MD 5.67 (3.08 to 8.26) | 1144 (6) | ⊕⊕⊕⊝ | |
| Point‐prevalence abstinence rates at short‐term follow‐up | Proportion of participants achieving abstinence ranged from 2.70% to 44.21%, with an average of 23.02% across treatments | Average relative risk for achieving abstinence following intervention compared with control was 2.55 | RR 2.55 (1.34 to 4.83) | 1166 (6) | ⊕⊕⊕⊝ Lowa,d,e | |
| Cannabis use quantity per day at short‐term follow‐up | Mean number of joints smoked per day ranged across control groups from | Mean number of joints smoked per day among intervention groups was | SMD 3.55 (2.51 to 4.59) | 1600 (8) | ⊕⊝⊝⊝ | |
| Symptoms of dependence at short‐term follow‐up | Mean number of symptoms of dependence ranged across control groups from 2.4 to 5.1 | Mean number of symptoms of dependence among intervention groups was | SMD 4.15 (1.67 to 6.63) | 889 (4) | ⊕⊕⊕⊝ | |
| Cannabis‐related problems at short‐term follow‐up | Mean number of cannabis‐related problems ranged across control groups from | Mean number of cannabis‐related problems among intervention groups was | SMD 3.34 (1.26 to 5.42) | 2202 (6) | ⊕⊕⊝⊝ | |
| Retention in treatment | Proportion of participants completing treatment ranged from 50.0% to 88.7%, with an average of 71.8% across treatments | On average, 7 out of 10 participants completed treatment as it was intended | ES 0.71 (0.63 to 0.78) | 1424 (11) | ⊕⊕⊕⊕ Moderatea,e | |
| *The basis for the assumed risk (e.g. median control group risk across studies) is provided in footnotes. The corresponding risk (and its 95% confidence interval) is based on the assumed risk in the comparison group and the relative effect of the intervention (and its 95% CI) | ||||||
| GRADE Working Group grades of evidence | ||||||
| aAt least 1 study at high risk of other bias bData conversions were required because of heterogeneity in assessments cFollow‐up assessment periods varied (range, 7 weeks to 4 months) dFollow‐up assessment periods varied substantially (range, 3 months to 237 days) eHeterogeneity in outcome measures fFollow‐up assessment periods varied substantially (range, 7 weeks to 237 days) gSmall number of studies (4 studies) | ||||||
| Study and group | Follow‐up period |
| Bernstein 2009, (1) Brief MET + CBT, (2) assessed control | (1) and (2) at 3 and 12 months from baseline |
| Bonsack 2011, (1) MET, (2) TAU | (1) and (2) at 3, 6 and 12 months from baseline |
| Budney 2000, (1) MET + CBT + CM‐abs, (2) MET + CBT, (3) MET | (1), (2) and (3) at end of treatment [14 weeks from baseline] |
| Budney 2006, (1) CBT + CM‐abs, (2) CBT + CM‐adh, (3) CM‐abs | (1), (2) and (3) at end of treatment [14 weeks from baseline], then monthly for 12 months post treatment [data provided for 3, 6, 9 and 12 month assessments] |
| Carroll 2006, (1) MET + CBT + CM‐abs + CM‐adh, (2) DC + CM‐abs + CM‐adh, (3) MET + CBT, (4) DC | (1), (2), (3) and (4) at end of treatment [8 weeks from baseline], then at 3 and 6 months post treatment |
| Carroll 2012, (1) CBT, (2) CBT + CM‐adh, (3) CBT + CM‐abs, (4) CM‐abs | (1), (2), (3) and (4) at end of treatment [12 weeks from baseline], then at 3, 6, 9 and 12 months post treatment |
| Copeland 2001, (1) CBT (6‐session), (2) CBT (1‐session), (3) DTC | (1) at an average of 242 days from baseline; (2) at an average of 223.5 days from baseline; (3) at an average of 242.5 days from baseline |
| de Dios 2012, (1) MM, (2) Assessed control | (1) and (2) at end of treatment [2 weeks from baseline], then at 1 and 2 months from baseline |
| Edwards 2006, (1) CBT, (2) TAU | (1) and (2) at end of treatment [3 months from baseline], then at 6 months post treatment |
| Fischer 2012, (1) DC‐oral, (2) DC‐workbook, (3) Health promotion‐oral, (4) Health promotion‐workbook | (1), (2), (3) and (4) at 3 and 12 months post treatment |
| Hoch 2012, (1) MET + CBT, (2) DTC | (1) at end of treatment [8‐12 weeks from baseline], then at 3 and 6 months from baseline; (2) at 8‐12 weeks |
| Hoch 2014, (1) MET + CBT, (2) DTC | (1) at end of treatment [8 weeks], then at 3 and 6 months from baseline; (2) at 8 weeks |
| Jungerman 2007, (1) MET + CBT (3 months), (2) MET + CBT (1 month), (3) DTC | (1) at 1 month post treatment; (2) at 3 months post treatment; (3) at 4 months post baseline |
| Kadden 2007 (1) MET + CBT + CM‐abs, (2) MET + CBT, (3) CM‐abs, (4) TAU | (1), (2), (3) and (4) at end of treatment [2 month follow‐up] and at 5, 8, 11 and 14 months from baseline |
| Lee 2013, (1) MET, (2) Assessed control | (1) and (2) at 3 and 6 months from baseline |
| Litt 2013, (1) MET + CBT + CM‐abs, (2) MET + CBT + CM‐adh, (3) TAU | (1), (2) and (3) at end of treatment [2 months from baseline], then at 3, 6, 9 and 12 months post treatment |
| Madigan 2013, (1) MET + CBT, (2) TAU | (1) and (2) at 3 and 12 months from baseline |
| MTPRG 2004, (1) MET + CBT, (2) MET, (3) Assessed control | (1) and (2) at 4, 9 and 15 months from baseline; (3) at 4 months from baseline |
| Roffman 1988, (1) RP, (2) SS | (1) and (2) at end of treatment [12 weeks], then at 1, 3, 6, 9 and 12 months post treatment [only data from 1 month follow‐up are provided] |
| Stein 2011, (1) MET, (2) Assessed control | (1) and (2) at 1, 3 and 6 months from baseline |
| Stephens 1994, (1) RP, (2) SS | (1) and (2) at 1, 3, 6, 9 and 12 months post treatment |
| Stephens 2000, (1) CBT, (2) MET, (3) Assessed control | (1) at 1 month from baseline [during treatment], at end of treatment [4 months from baseline] then at 3, 9 and 12 months post treatment; (2) at end of treatment [1 month from baseline] then at 3, 6, 12 and 15 months post treatment; (3) at 4 months from baseline |
| Stephens 2007, (1) MET, (2) DC, (3) DTC | (1) and (2) end of treatment [7 weeks from baseline], then at 6 and 12 months from baseline; (3) at 7 weeks from baseline |
| CBT: Cognitive‐behavioural therapy CM‐abs: Contingency management with vouchers presented for negative urine CM‐adh: Contingency management with vouchers presented for treatment attendance/adherence DC: Drug counselling DTC: Delayed treatment control MET: Motivational enhancement therapy MM: Mindfulness‐based meditation RP: Relapse prevention SS: Social support TAU: Treatment as usual | |
| Study and group | Measure | Baseline | Follow‐up [% with data] | Significance* |
| Bernstein 2009, (1) Brief MET + CBT, (2) Assessed control | Days used in prior 30 days (mean ± SD) | (1) 19.0 ± 10.9, N = 68, (2) 15.3 ± 10.1, N = 71 | (1) 11.0 ± 10.7, N = 42 [69.1%], (2) 13.2 ± 11.7, N = 55 [77.5%] | (1) vs (2) P value = 0.024 |
| Bonsack 2011, (1) MET, (2) TAU | Days abstinent in prior ‘month’ (median ± range) | (1) 5.0 ± 24, N = 30, (2) 3.0 ± 27, N = 32 | (1) 5.5 ± 28, N = 25 [83.3%], (2) 8.5 ± 28, N = 29 [90.6%] | (1) vs (2) P value > 0.05 |
| Budney 2000, (1) MET + CBT + CM‐abs, (2) MET + CBT, (3) MI | Days used in prior 30 days (least squares mean ± SE) | (1) 24.1 ± 1.8, N = 20, (2) 20.4 ± 1.8, N = 20, (3) 23.2 ± 1.8, N = 20 | (1) 6.6 ± 2.6, N = 14 [70.0%], (2) 7.4 ± 2.3, N = 15 [75.0%], (3) 13.0 ± 2.1, N = 16 [80.0%] | (1) vs (2) P value > 0.05; (1) vs (3) P value > 0.05; (2) vs (3) P value > 0.05 |
| Budney 2006, (1) CBT + CM‐abs, (2) CBT + CM‐adh, (3) CM‐abs | Days used in prior 30 days (mean ± SD) | (1) 25.3 ± 8.0, N = 30, (2) 25.5 ± 7.4, N = 30, (3) 26.0 ± 6.2, N = 30 | (1) 12.5 ± 13.9, N = 21 [70.0%], (2) 18.3 ± 15.7, N = 24 [80.0%], (3) 18.1 ± 13.6, N = 22 [73.3%] | (1) vs (2) P value > 0.05; (1) vs (3) P value > 0.05; (2) vs (3) P value > 0.05 |
| Carroll 2006, (1) MET + CBT + CM‐abs + CM‐adh, (2) DC + CM‐abs + CM‐adh. (3) MET + CBT, (4) DC | Proportion of days used post treatment (mean ± SE) | (1) n/a, N = 33, (2) n/a, N = 34, (3) n/a, N = 36, (4) n/a, N = 33 | (1) 0.64 ± 0.06, N = 27 [81.8%], (2) 0.75 ± 0.1, N = 24 [70.6%], (3) 0.73 ± 0.05, N = 27 [75.0%], (4) 0.71 ± 0.06, N = 30 [90.9%] | (1) vs (2) P value > 0.05; (1) vs (3) P value > 0.05; (1) vs (4) P value = 0.02; (2) vs (3) P value > 0.05; (3) vs (4) P value = 0.02; (2) vs (4) P value > 0.05 |
| Carroll 2012, (1) CBT, (2) CBT + CM‐adh, (3) CBT + CM‐abs, (4) CM‐abs | Days used in prior 28 days (mean ± SD) | (1) 15.6 ± 9.8, N = 36, (2) 17.6 ± 8.6, N = 32, (3) 17.9 ± 9.6, N = 32, (4) 14.1 ± 10.6, N = 27 | (1) Unclear, N = 33 [91.7%], (2) Unclear, N = 25 [78.1%], (3) Unclear, N = 26 [81.3%], (4) Unclear, N = 23 [85.2%] | (1) vs (2) P value = 0.00; (1) vs (3) P value = 0.00; (1) vs (4) P value > 0.05; (2) vs (3) P value > 0.05; (3) vs (4)* P value = 0.00; (2) vs (4) P value = 0.00 |
| Copeland 2001, (1) CBT [6‐session], (2) CBT [1‐session], (3) DTC | Percent of days abstinent post treatment (mean ± SD) | (1) n/a, N = 78, (2) n/a, N = 82, (3) n/a, N = 69 | (1) 35.9 ± 34.8, N = 58 [74.4%], (2) 44.8 ± 37.7, N = 61 [74.4%], (3) 29.7 ± 32.6, N = 52 [75.4%] | (1) vs (2) P value > 0.05; (1) vs (3) P value > 0.05; (2) vs (3) P value > 0.05 |
| de Dios 2012, (1) MM, (2) Assessed control | Days used in prior 30 days (mean ± SD) | (1) 17.0 ± 9.96, N = 22, (2) 18.8 ± 8.1, N = 12 | (1) Unclear, N = 16 [72.7%], (2) Unclear, N = 9 [75.0%] | (1) vs (2) P value = 0.031 across FU |
| Edwards 2006, (1) DC, (2) TAU | % of days used in prior 4 weeks (mean ± SD) | (1) 39.4 ± 38.4, N = 23, (2) 26.0 ± 28.3, N = 24 | (1) 32.4 ± 44.9, N = 16 [69.6%], (2) 19.3 ± 30.4, N = 17 [70.8%] | (1) vs (2) P value > 0.05 |
| Fischer 2012, (1) DC‐oral, (2) DC‐workbook, (3) Health promotion‐oral, (4) Health promotion‐workbook | Days used in prior 30 days (mean, range) | (1) 21.96, 4.75, N = 24, (2) 24.82, 3.0, N = 47, (3) 21.36, 5.5, N = 25, (4) 25.36, 3.41, N = 37 | (1) Unclear, N = Unclear, (2) Unclear, N = Unclear, (3) Unclear, N = Unclear, (4) Unclear, N = Unclear | (1) vs (2) P value > 0.05; (1) vs (3) P value > 0.05; (1) vs (4) P value > 0.05; (2) vs (3) P value > 0.05; (3) vs (4) P value > 0.05; (2) vs (4) P value > 0.05 |
| Hoch 2012, (1) MET + CBT, (2) DTC | Percent reporting abstinence post treatment (%) | (1) n/a, N = 90, (2) n/a, N = 32 | (1) 49, N = 79 [87.8%], (2) 12.5, N = 31 [96.9%] | (1) vs (2) P value < 0.05 |
| Hoch 2014, (1) MET + CBT, (2) DTC | Percent reporting abstinence post treatment (%) | (1) n/a, N = 166, (2) n/a, N = 130 | (1) 53.3, N = 166 [100%], (2) 22, N = 106 [81.5%] | (1) vs (2) P value < 0.05 |
| Jungerman 2007, (1) MET + CBT [3 months], (2) MET + CBT [1 month], (3) DTC | Percent of days used in prior 90 days (mean ± SE) | (1) 88.17 ± 1.95, N = 52, (2) 94.19 ± 1.87, N = 56, (3) 94.06 ± 1.95, N = 52 | (1) 56.21 ± 4.38, N = 27 [51.9%], (2) 64.90 ± 4.27, N = 37 [66.1%], (3) 86.12 ± 4.38, N = 35 [67.3%] | (1) vs (2) P value > 0.05; (1) vs (3) P value = 0.0008; (2) vs (3) P value = 0.0002 |
| Kadden 2007 (1) MET + CBT + CM‐abs, (2) MET + CBT, (3) CM‐abs, (4) Health education | Proportion of days used in prior 90 days (mean ± SD) | (1) 0.11 ± 0.17, N = 63, (2) 0.08 ± 0.13, N = 61, (3) 0.15 ± 0.19, N = 54, (4) 0.08 ± 0.12, N = 62 | (1) 27, N = 51 [81.0%], (2) 19, N = 49 [80.3%], (3) Unclear, N = 48 [88.9%], (4) Unclear, N = 52 [83.9%] | (1) vs (2) P value > 0.05; (1) vs (3) P value > 0.05; (1) vs (4) P value < 0.05; (2) vs (3) P value > 0.05; (3) vs (4) P value > 0.05 [P value < 0.05 at 3 month FU only]; (2) vs (4) P value < 0.05 |
| Lee 2013, (1) MET, (2) Assessed control | Days used in prior 30 days (mean ± SD) | (1) 16.5 ± 8.2, N = 106, (2) 15.6 ± 8.8, N = 106 | (1) 13.2 ± 10.6, N = 89 [84.0%], (2) 11.7 ± 11.1, N = 86 [81.1%] | (1) vs (2) P value > 0.05 |
| Litt 2013, (1) MET + CBT + CM‐abs, (2) MET + CBT + CM‐adh, (3) Assessed control | Days used in prior 90 days (mean ± SD) | (1) 72.5 ± 28.0, N = 73, (2) 71.8 ± 27.8, N = 71, (3) 68.4 ± 31.5, N = 71 | (1) Unclear, N = 60 [82.2%], (2) Unclear, N = 61 [85.9%], (3) Unclear, N = 61 [85.9%] | (1) vs (2) P value < 0.05 [significant at FU months 5‐8 only]; (1) vs (3) P value > 0.05; (2) vs (3) P value > 0.05 |
| Madigan 2013, (1) MET + CBT, (2) TAU | Days used in prior 30 days (mean ± SD) | (1) 10.0 ± 3.6, N = 59, (2) 10.1 ± 3.7, N = 29 | (1) 9.8 ± 3.9, N = 32 [54.2%], (2) 10.1 ± 4.0, N = 19 [65.5%] | (1) vs (2) P value > 0.05 |
| MTPRG 2004, (1) MET + CBT, (2) MET, (3) Assessed control | Percent of days used in prior 90 days (mean ± SD) | (1) 87.56 ± 17.24, N = 156, (2) 86.92 ± 17.15, N = 146, (3) 89.88 ± 14.11, N = 148 | (1) 44.86 ± 40.52, N = 129 [82.7%], (2) 53.65 ± 38.57, N = 120 [82.2%], (3) 75.59 ± 30.69, N = 137 [92.6%] | (1) vs (2) P value < 0.05 [Cohen d = 0.22]; (1) vs (3) P value < 0.05 [Cohen d = 1.14]; (2) vs (3) P value < 0.05 [Cohen d = 0.59] |
| Roffman 1988, (1) RP, (2) SS | Days used in prior ‘month’ (mean ± SD) | (1) 27.13 ± 4.6, N = 54, (2) 26.36 ± 5.79, N = 56 | (1) 8.18 ± 10.48, N = 45 [83.3%], (2) 12.96 ± 11.56, N = 52 [92.9%] | (1) vs (2) P value < 0.05 |
| Stein 2011, (1) MET, (2) Assessed control | Proportion of days used in prior 90 days (mean ± SD) | (1) 0.59 ± 0.34, N = 163, (2) 0.55 ± 0.34, N = 169 | (1) Unclear, N = 126 [77.3%], (2) Unclear, N = 136 [80.5%] | (1) vs (2) P value = 0.01 [significant at 3 month FU only] |
| Stephens 1994, (1) RP, (2) SS | Days used in prior 30 days (mean ± SD) | (1) 27.04 ± 4.66, N = 106, (2) 26.36 ± 5.81, N = 106 | (1) 15.31 ± 12.49, N = 80 [75.5%], (2) 13.79 ± 11.9, N = 87 [82.1%] | (1) vs (2) P value > 0.05 |
| Stephens 2000, (1) MET, (2) CBT, (3) Assessed control | Days used in prior 90 days divided by 3 (mean ± SD) | (1) 24.24 ± 6.29, N = 88, (2) 25.38 ± 6.15, N = 117. (3) 24.85 ± 6.13, N = 86 | (1) 12.99 ± 11.61, N = 80 [90.9%], (2) 12.29 ± 12.34, N = 103 [88.0%], (3) 17.09 ± 10.73, N = 79 [91.9%] | (1) vs (2) P value < 0.02 [significant at EoT only, assessed during treatment for (2)]; (1) vs (3) P value < 0.001; (2) vs (3) P value < 0.001 [significant at EoT only] |
| Stephens 2007, (1) MET, (2) Drug‐related health education, (3) DTC | Days used in prior 90 days converted to average days per week (mean ± SE) | (1) 5.76 ± 0.15, N = 62. (2) 5.79 ± 0.15, N = 62, (3) 6.06 ± 0.15, N = 64 | (1) 4.65 ± 0.28, N = 49 [79.0%], (2) 5.58 ± 0.28, N = 52 [83.9%], (3) 5.75 ± 0.24, N = 62 [96.9%] | (1) vs (2) P value <0.05 [Cohen d = 0.45]; (1) vs (3) P value < 0.05 [significant at 1.75 month FU, Cohen d = 0.47]; (2) vs (3) P value > 0.05 |
| * Unless otherwise indicated by *, significant treatment outcomes favour the group with the lower number; exact P values are reported when provided CBT: Cognitive‐behavioural therapy CM‐abs: Contingency management with vouchers presented for negative urine CM‐adh: Contingency management with vouchers presented for treatment attendance/adherence DC: Drug counselling DTC: Delayed treatment control EoT: End of treatment FU: Follow‐up MET: Motivational enhancement therapy MM: Mindfulness‐based meditation RP: Relapse prevention SD: Standard deviation SE: Standard error TAU: Treatment as usual | ||||
| Study and group | Measure | Baseline | Follow‐up [% with data] | Significance* |
| Bonsack 2011, (1) MET, (2) TAU | Joints per week (median ± range at baseline, median reduction at follow‐up) | (1) 22.5 ± 89, N = 30, (2) 19.0 ± 95, N = 32 | (1) 10.0, N = 25 [83.3%], (2) 3.5, N = 29 [90.6%] | (1) vs (2) P value > 0.05 [significant at 3 and 6 months only, d = 0.65] |
| Budney 2006, (1) CBT + CM‐abs, (2) CBT + CM‐adh, (3) CM‐abs | Joints per day (mean ± SD) | (1) 4.2 ± 3.0, N = 30, (2) 3.7 ± 2.2, N = 30, (3) 3.8 ± 2.2, N = 30 | (1) Unclear, N = 21 [70.0%], (2) Unclear, N = 24 [80.0%], (3) Unclear, N = 22 [73.3%] | (1) vs (2) P value > 0.05; (1) vs (3) P value > 0.05; (2) vs (3) P value > 0.05 |
| Copeland 2001, (1) CBT [6‐session], (2) CBT [1‐session], (3) DTC | “daily amount used in the last month” (mean ± SD) | (1) 2.1 ± 0.8, N = 78, (2) 2.0 ± 0.8, N = 82, (3) 2.2 ± 0.9, N = 69 | (1) 1.3 ± 0.9, N = 58 [74.4%], (2) 1.5 ± 1.2, N = 61 [74.4%], (3) 1.8 ± 1.0, N = 52 [75.4%] | (1) vs (2) P value > 0.05; (1) vs (3) P value = 0.02; (2) vs (3) P value > 0.05 |
| Fischer 2012, (1) DC [oral], (2) DC [workbook], (3) Health promotion [oral], (4) Health promotion [workbook] | Number of cannabis use episodes per day (mean ± range; reported only as combined group scores) | (1) + (2) 2.3 ± 1.2, N = 71, (3) + (4) 2.0 ± 0.6, N = 62 | (1) + (2) 2.6 ± 2.1, N = unclear, (3) + (4) 2.2 ± 0.9 | (1) vs (2) P value > 0.05; (1) vs (3) P value > 0.05; (1) vs (4) P value > 0.05; (2) vs (3) P value > 0.05; (3) vs (4) P value > 0.05; (2) vs (4) P value > 0.05 |
| Hoch 2012, (1) MET + CBT, (2) DTC | Units in previous 7 days (mean ± SD) | (1) 25.2 ± 39.7, N = 90, (2) 21.3 ± 32.7, N = 32 | (1) 8.1 ± 18.1, N = 79 [87.8%], (2) 24.9 ± 33.4, N = 31 [96.9%] | (1) vs (2) P value < 0.05 |
| Hoch 2014, (1) MET + CBT, (2) DTC | Units in previous 7 days (mean ± SD) | (1) 20.8 ± 26.7, N = 90, (2) 21.3 ± 28.3, N = 32 | (1) 5.2 ± 13.0, N = 79 [87.8%], (2) 20.6 ± 30.0, N = 31 [96.9%] | (1) vs (2) P value < 0.001 [d = ‐0.9] |
| Jungerman 2007, (1) MET + CBT [3 months], (2) MET + CBT [1 month], (3) DTC | Joints per day (mean ± SE) | (1) 2.08 ± 0.29, N = 52, (2) 2.06 ± 0.28, N = 56, (3) 1.84 ± 0.29, N = 52 | (1) 0.77 ± 0.18, N = 27 [51.9%], (2) 0.78 ± 0.17, N = 37 [66.1%], (3) 1.56 ± 0.18, N = 35 [67.3%] | (1) vs (2) P value > 0.05; (1) vs (3) P value = 0.006; (2) vs (3) P value = 0.006 |
| Kadden 2007, (1) MET + CBT + CM‐abs, (2) MET + CBT, (3) CM‐abs, (4) Health education | Joints per day (mean ± SE) | (1) 4.76 ± 3.98, N = 63, (2) 4.67 ± 6.27, N = 61, (3) 3.24 ± 2.65, N = 54, (4) 5.20 ± 5.70, N = 62 | (1) Unclear, N = 51 [81.0%], (2) Unclear, N = 49 [80.3%], (3) Unclear, N = 48 [88.9%], (4) Unclear, N = 52 [83.9%] | (1) vs (2) P value > 0.05; (1) vs (3) P value > 0.05; (1) vs (4) P value > 0.05; (2) vs (3) P value > 0.05; (3) vs (4) P value > 0.05; (2) vs (4) P value > 0.05 |
| Lee 2013, (1) MET, (2) Assessed control | Joints per week (mean ± SD) | (1) 9.35 ± 9.8, N = 106, (2) 8.29 ± 9.5, N = 106 | (1) 7.26 ± 8.4, N = 89 [84.0%], (2) 7.47 ± 10.7, N = 86 [81.1%] | (1) vs (2) P value > 0.05 [P value < 0.05 at 3 month FU only] |
| MTPRG 2004, (1) MET + CBT, (2) MET, (3) Assessed control | Joints per day (mean ± SD) | (1) 2.79 ± 2.35, N = 156, (2) 3.02 ± 2.80, N = 146, (3) 2.77 ± 2.19, N = 148 | (1) Unclear, N = 129 [82.7%], (2) Unclear, N = 120 [82.2%], (3) 2.03 ± 1.94, N = 137 [92.6%] | (1) vs (2) P value > 0.05; (1) vs (3) P value < 0.05 [d = 0.43]; (2) vs (3) P value < 0.05 [d = 0.29] |
| Roffman 1988, (1) RP, (2) SS | Joints per day (mean ± SD) | (1) 2.58 ± 0.94, N = 54, (2) 2.85 ± 0.83, N = 56 | (1) 1.11 ± 1.11, N = 45 [83.3%], (2) 1.29 ± 1.00, N = 52 [92.9%] | (1) vs (2) P value > 0.05 |
| Stephens 2000, (1) MET, (2) CBT, (3) Assessed control | Scale of quantity where 1 = once, 2 = 2‐3 times, 3 = 4‐5 times and 4 = 6+ times per day (mean ± SD) | (1) 2.41 ± 0.85, N = 88, (2) 2.59 ± 0.89, N = 117, (3) 2.61 ± 0.93, N = 86 | (1) 1.41 ± 1.20, N = 80 [90.9%], (2) 1.39 ± 1.15, N = 103 [88.0%], (3) 1.97 ± 1.09, N = 79 [91.9%] | (1) vs (2) P value > 0.05; (1) vs (3) P value < 0.001; (2) vs (3) P value < 0.001 [significant at EoT only] |
| Stephens 2007, (1) MET, (2) Drug‐related health education, (3) DTC | Number of 6‐hour periods per day that were smoked (mean ± SE) | (1) 2.07 ± 0.10, N = 62, (2) 2.00 ± 0.10, N = 62, (3) 2.19 ± 0.09, N = 64 | (1) 4.65 ± 0.28, N = 49 [79.0%], (2) 5.58 ± 0.28, N = 52 [83.9%], (3) 5.75 ± 0.24, N = 62 [96.9%] | (1) vs (2) P value < 0.05 [significant at 1.75 month FU only, d = 0.42]; (1) vs (3) P value < 0.05 [significant at 1.75 month FU only, d = 0.69]; (2) vs (3) P value > 0.05 |
| * Unless otherwise indicated by *, significant treatment outcomes favour the group with the lower number; exact P values are reported when provided CBT: Cognitive‐behavioural therapy CM‐abs: Contingency management with vouchers presented for negative urine CM‐adh: Contingency management with vouchers presented for treatment attendance/adherence DC: Drug counselling EoT: End of treatment FU: Follow‐up MET: Motivational enhancement therapy RP: Relapse prevention SD: Standard deviation SE: Standard error SS: Social support TAU: Treatment as usual | ||||
| Study and group | Measure | Baseline | Follow‐up [% with data] | Significance* |
| Budney 2000, (1) MET + CBT + CM‐abs, (2) MET + CBT, (3) MI | Addiction Severity Index composite scores (lowest score mean ± SD – highest score mean ± SD) | (1) 0.09 ± 0.01 ‐ 0.33 ± .03, N = 20, (2) 0.08 ± 0.05 ‐ 0.39 ± .02, N = 20, (3) 0.07 ± 0.01 & 0.42 ± .02, N = 20 | (1) 0.01 ± 0.02 ‐ 0.32 ± .04, N = 14 [70.0%], (2) 0.05 ± 0.04 ‐ 0.32 ± .03, N = 15 [75.0%], (3) 0.01 ± 0.05 ‐ 0.32 ± .04, N = 16 [80.0%] | (1) vs (2) and (1) vs (3) data provided in aggregate: P value < 0.05 for the ‘medical’ [f = 0.16] and for the ‘drug’ [f = 0.23] composite scores; (2) vs (3) P value > 0.05 |
| Budney 2006, (1) CBT + CM‐abs, (2) CBT + CM‐adh, (3) CM‐abs | Proportion with no symptoms of dependence in prior ‘month’ (%), Addiction Severity Index composite scores (data not shown) | (1) Unclear, Unclear, N = 30, (2) Unclear, Unclear, N = 30, (3) Unclear, Unclear, N = 30 | (1) 37, Unclear, N = 21 [70.0%], (2) 30, Unclear, N = 24 [80.0%], (3) 27, Unclear, N = 22 [73.3%] | (1) vs (2) P value > 0.05, P value > 0.05; (1) vs (3) P value = 0.05 at 3 month FU only, P value > 0.05; (2) vs (3) P value > 0.05, P value > 0.05 |
| Carroll 2006, (1) MET + CBT + CM‐abs + CM‐adh, (2) DC + CM‐abs, + CM‐adh, (3) MET + CBT, (4) DC | Addiction Severity Index composite scores (data not shown) | (1) Unclear, N = 33, (2) Unclear, N = 34, (3) Unclear, N = 36, (4) Unclear, N = 33 | (1) Unclear, N = 27 [81.8%], (2) Unclear, N = 24 [70.6%], (3) Unclear, N = 27 [75.0%], (4) Unclear, N = 30 [90.9%] | (1) vs (2) P value > 0.05; (1) vs (3) P value > 0.05; (1) vs (4) P value > 0.05; (2) vs (3) P value > 0.05; (3) vs (4) P value = 0.05 for the ‘legal’ composite score across FU; (2) vs (4) P value > 0.05 |
| Copeland 2001, (1) CBT [6‐session], (2) CBT [1‐session], (3) DTC | Severity of Dependence Scale score (mean ± SD) | (1) 9.2 ± 3.2, N = 78, (2) 9.8 ± 2.9, N = 82, (3) 9.3 ± 2.6, N = 69 | (1) 5.8 ± 4.3, N = 58 [74.4%], (2) 7.6 ± 4.4, N = 61 [74.4%], (3) 9.2 ± 3.2, N = 52 [75.4%] | (1) vs (2) P value = 0.04 [t = ‐2.1]; (1) vs (3) P value < 0.0001 [t = ‐4.7]; (2) vs (3) P value = 0.008 [t = ‐2.7] |
| Edwards 2006, (1) DC, (2) TAU | Cannabis and Substance Use Assessment Schedule (mean ± SD) | (1) 2.6 ± 0.9, N = 23, (2) 2.4 ± 1.2, N = 24 | (1) 1.4 ± 1.4, N = 16 [69.6%], (2) 1.3 ± 1.5, N = 17 [70.8%] | (1) vs (2) P value > 0.05 |
| Hoch 2012, (1) MET + CBT, (2) DTC | Addiction Severity Index composite scores (lowest score mean ± SD – highest score mean ± SD) | (1) 9.9 ± 1.4 – 10.1 ± 1.7, N = 90, (2) 9.7 ± 1.8 – 10.1 ± 2.1, N = 32 | (1) 3.0 ± 4.0 – 11.0 ± 9.7, N = 79 [87.8%], (2) 4.1 ± 10.7 – 13.7 ± 13.3, N = 31 [96.9%] | (1) vs (2) P value < 0.05 [for drug, legal, medical, employment and family composite scores] |
| Hoch 2014, (1) MET + CBT, (2) DTC | Severity of Dependence Scale score, number of symptoms of dependence (mean ± SD) | (1) 9.0 ± 3.4, 3.3 ± 1.6, N = 166, (2) 9.1 ± 3.5, 3.1 ± 1.6, N = 130 | (1) 4.7 ± 4.2, 0.9 ± 1.6, N = 166 [100%], (2) 7.0 ± 4.1, 2.4 ± 2.1, N = 106 [81.5%] | (1) vs (2) P value < 0.001 [d = ‐0.6], P value < 0.001 [d = ‐0.9] |
| Jungerman 2007, (1) MET + CBT [3 months], (2) MET + CBT [1 month], (3) DTC | Number of symptoms of dependence, overall Addiction Severity Index score (mean ± SE) | (1) 5.78 ± 0.31, 3.02 ± 0.21, N = 52, (2) 5.59 ± 0.30, 2.87 ± 0.20, N = 56, (3) 5.71 ± 0.31, 3.38 ± 0.21, N = 52 | (1) 4.20 ± 0.33, 2.10 ± 0.21, N = 27 [51.9%], (2) 4.86 ± 0.32, 2.77 ± 0.20, N = 37 [66.1%], (3) 5.10 ± 0.33, 2.81 ± 0.21, N = 35 [67.3%] | (1) vs (2) P value = 0.0349, P value = 0.0121; (1) vs (3) P value = 0.0349, P value > 0.05; (2) vs (3) P value > 0.05, P value > 0.05 |
| Kadden 2007, (1) MET + CBT + CM‐abs, (2) MET + CBT, (3) CM‐abs, (4) Health education | Addiction Severity Index composite scores (lowest score mean ± SD – highest score mean ± SD) | (1) 0.09 ± 0.09 – 0.25 ± 0.19, N = 63. (2) 0.12 ± 0.12 – 0.25 ± 0.07, N = 61, (3) 0.09 ± 0.10 – 0.26 ± 0.05, N = 54, (4) 0.11 ± 0.14 – 0.25 ± 0.21, N = 62 | (1) Unclear, N = 51 [81.0%], (2) Unclear, N = 49 [80.3%], (3) Unclear, N = 48 [88.9%], (4) Unclear, N = 52 [83.9%] | (1) vs (2) P value > 0.05; (1) vs (3) P value > 0.05; (1) vs (4) P value > 0.05; (2) vs (3) P value > 0.05; (3) vs (4) P value > 0.05; (2) vs (4) P value > 0.05 |
| MTPRG 2004, (1) MET + CBT, (2) MET, (3) Assessed control | Number of symptoms of dependence (mean ± SD), Addiction Severity Index composite scores (lowest score mean ± SD – highest score mean ± SD) | (1) 5.62 ± 1.17, 0.11 ± 0.13 – 0.26 ± 0.30, N = 156, (2) 5.70 ± 1.20, 0.12 ± 0.13 – 0.28 ± 0.31, N = 146, (3) 5.56 ± 1.33, 0.11 ± 0.12 – 0.16 ± 0.25, N = 148 | (1) 2.81 ± 2.40, 0.10 ± 0.11 – 0.25 ± 0.32, N = 129 [82.7%], (2) 3.63 ± 2.08, 0.13 ± 0.10 – 0.26 ± 0.32, N = 120 [82.2%], (3) 4.36 ± 1.92, 0.11 ± 0.12 – 0.20 ± 0.17, N = 137 [92.6%] | (1) vs (2) P value < 0.05 [at 9 month FU only, d = 0.31], P value > 0.05; (1) vs (3) P value > 0.05, P value < 0.05 [for ‘employment’ composite only]; (2) vs (3) P value > 0.05, P value < 0.05 [for ‘employment’ composite only] |
| Stephens 2000, (1) MET, (2) CBT, (3) Assessed control | Number of symptoms of dependence (mean ± SD) | (1) Unclear, N = 88, (2) Unclear, N = 117, (3) Unclear, N = 86 [6.74 ± 1.97 for total sample with no significant group differences] | (1) 2.75 ± 3.18, N = 80 [90.9%], (2) 2.83 ± 3.27, N = 103 [88.0%], (3) 4.63 ± 2.59, N = 79 [91.9%] | (1) vs (2) P value > 0.05; (1) vs (3) P value < 0.001; (2) vs (3) P value < 0.001 [significant at EoT only] |
| Stephens 2007, (1) MET, (2) Drug‐related health education, (3) DTC | Number of symptoms of dependence (mean ± SD) | (1) 3.92 ± 1.78, N = 62, (2) 3.26 ± 1.93, N = 62, (3) 3.17 ± 1.93, N = 64 | (1) 2.43 ± .018, N = 49 [79.0%], (2) 2.88 ± 0.18, N = 52 [83.9%], (3) 2.85 ± 0.20, N = 62 [96.9%] | (1) vs (2) P value < 0.05 [d = 0.48, 0.45 and 0.37 across FU]; (1) vs (3) P value < 0.05 [significant at 1.75 month FU, d = 0.58]; (2) vs (3) P value > 0.05 |
| * Unless otherwise indicated by *, significant treatment outcomes favour the group with the lower number; exact P values are reported when provided. CBT: Cognitive‐behavioural therapy CM‐abs: Contingency management with vouchers presented for negative urine CM‐adh: Contingency management with vouchers presented for treatment attendance/adherence DC: Drug counselling DTC: Delayed treatment control EoT: End of treatment FU: Follow‐up MET: Motivational enhancement therapy SD: Standard deviation SE: Standard error TAU: Treatment as usual | ||||
| Study and group | Measure | Baseline | Follow‐up [% with data] | Significance* |
| Bernstein 2009, (1) Brief MET + CBT, (2) Assessed control | Percent reporting risky behaviours following use: fighting, driving, being careful (%) | (1) 50.0, 14.6, 78.1, N = 55, (2) 51.6, 14.8, 69.1, N = 64 | (1) 12.8, 17.0, 73.9, N = 47 [69.1%], (2) 34.6, 24.5, 70.4, N = 55 [77.5%] | (1) vs (2) all P value > 0.05 |
| Budney 2000, (1) MET + CBT + CM‐abs, (2) MET + CBT, (3) MET | Modified Drug Abuse Screening Test “Marijuana Consequences Questionnaire” (mean ± SE) | (1) 7.7 ± 0.62, N = 20, (2) 7.1 ± 0.60, N = 20, (3) 6.7 ± 0.60, N = 20 | (1) 3.7 ± 0.86, N = 14 [70.0%], (2) 1.9 ± 0.78, N = 15 [75.0%], (3) 1.5 ± 1.0, N = 16 [80.0%] | (1) vs (2) P value > 0.05; (1) vs (3) P value > 0.05; (2) vs (3) P value > 0.05 |
| Budney 2006, (1) CBT + CM‐abs, (2) CBT + CM‐adh, (3) CM‐abs | Marijuana Problem Scale (mean ± SD) | (1) 7.8 ± 4.8, N = 30, (2) 7.9 ± 4.0, N = 30, (3) 7.8 ± 4.4, N = 30 | (1) Unclear, N = 21 [70.0%], (2) Unclear, N = 24 [80.0%], (3) Unclear, N = 22 [73.3%] | (1) vs (2) P value > 0.05; (1) vs (3) P value > 0.05; (2) vs (3) P value > 0.05 |
| Copeland 2001, (1) CBT [6‐session], (2) CBT [1‐session], (3) DTC | Cannabis Problems Questionnaire (mean ± SD) | (1) 42.4 ± 17.1, N = 78, (2) 42.2 ± 18.6, N = 82, (3) 45.4 ± 16.3, N = 69 | (1) 23.0 ± 16.8, N = 58 [74.4%], (2) 28.4 ± 18.6, N = 61 [74.4%], (3) 39.1 ± 16.6, N = 52 [75.4%] | (1) vs (2) P value > 0.05; (1) vs (3) P value = 0.004; (2) vs (3) P value < 0.0001 |
| Hoch 2014, (1) MET + CBT, (2) DTC | Cannabis Problems Questionnaire, Cannabis Use Problems Identification Test (mean ± SD) | (1) 6.7 ± 4.2, 41.8 ± 11.7, N = 166, (2) 6.8 ± 4.3, 43.3 ± 11.3, N = 130 | (1) 27.1 ± 14.1, 2.9 ± 3.8, N = 166 [100%], (2) 37.1 ± 14.7, 5.6 ± 4.4, N = 106 [81.5%] | (1) vs (2) P value < 0.001 [d = ‐0.7], P value < 0.001 [d = ‐0.7] |
| Fischer 2012, (1) DC [oral], (2) DC [workbook], (3) Health promotion [oral], (4) Health promotion [workbook] | Proportion reporting driving a car while under the influence of cannabis, and deep inhalation smoking (%) | (1) 80.0, 40.0, N = 24, (2) 76.60, 46.81, N = 47, (3) 76.0, 29.17, N = 25, (4) 83.78, 27.59, N = 37 | (1) Unclear, N = Unclear, (2) Unclear, N = Unclear, (3) Unclear, N = Unclear, (4) Unclear, N = Unclear [data reported by combining groups (1) + (2) and (3) + (4)] | (1) vs (2) P value > 0.05; (1) vs (3) P value > 0.05; (1) vs (4) P value > 0.05; (2) vs (3) P value > 0.05; (3) vs (4) P value > 0.05; (2) vs (4) P value > 0.05 [combining (1) + (2) vs (3) + (4) was P value < 0.05, Q = 13.1, P value < 0.05, Q = 9.3] |
| Jungerman 2007, (1) MET + CBT [3 months], (2) MET + CBT [1 month], (3) DTC | Marijuana Problem Scale (mean ± SE) | (1) 10.21 ± 0.58, N = 52, (2) 9.80 ± 0.56, N = 56, (3) 9.71 ± 0.58, N = 52 | (1) 8.52 ± 0.63, N = 27 [51.9%], (2) 9.54 ± 0.61, N = 37 [66.1%], (3) 8.92 ± 0.64, N = 35 [67.3%] | (1) vs (2) P value > 0.05; (1) vs (3) P value > 0.05; (2) vs (3) P value > 0.05 |
| Kadden 2007 (1) MET + CBT + CM‐abs, (2) MET + CBT, (3) CM‐abs, (4) Health education | Marijuana Problem Scale (mean ± SD) | (1) 13.42 ± 6.84, N = 63, (2) 13.97 ± 7.52, N = 61, (3) 12.62 ± 6.09, N = 54, (4) 15.19 ± 6.74, N = 62 | (1) Unclear, N = 51 [81.0%], (2) Unclear, N = 49 [80.3%], (3) Unclear, N = 48 [88.9%], (4) Unclear, N = 52 [83.9%] | (1) vs (2) P value > 0.05; (1) vs (3) P value > 0.05; (1) vs (4) P value > 0.05; (2) vs (3) P value > 0.05; (3) vs (4) P value > 0.05; (2) vs (4) P value > 0.05 |
| Lee 2013, (1) MET, (2) Assessed control | Adapted Marijuana Problems Index (mean ± SD) | (1) 10.45 ± 4.9, N = 106, (2) 10.38 ± 5.9, N = 106 | (1) 6.54 ± 5.3, N = 89 [84.0%], (2) 6.75 ± 6.5, N = 86 [81.1%] | (1) vs (2) P value < 0.05, [significant at 3 month FU only] |
| Litt 2013, (1) MET + CBT + CM‐abs, (2) MET + CBT + CM‐adh, (3) Assessed control | Marijuana Problem Scale (data presented in an unclear figure) | (1) Unclear, N = 73, (2) Unclear, N = 71, (3) Unclear, N = 71 | (1) Unclear, N = 60 [82.2%], (2) Unclear, N = 61 [85.9%], (3) Unclear, N = 61 [85.9%] | (1) vs (2) P value > 0.05; (1) vs (3) P value > 0.05; (2) vs (3) P value > 0.05 |
| MTPRG 2004, (1) MET + CBT, (2) MET, (3) Assessed control | Marijuana Problem Scale (mean ± SD) | (1) 9.47 ± 3.51, N = 156, (2) 10.18 ± 3.47, N = 146, (3) 9.07 ± 3.53, N = 148 | (1) Unclear, N = 129 [82.7%], (2) Unclear, N = 120 [82.2%], (3) Unclear, N = 137 [92.6%] | (1) vs (2) P value > 0.05, [significant at 4 month FU only, d = 0.41]; (1) vs (3) P value < 0.05 [d = 0.53]; (2) vs (3) P value > 0.05 |
| Roffman 1988, (1) RP, (2) SS | Modified Drug Abuse Screening Test – Marijuana Problem Scale (data provided as total sample only) | (1) Unclear, N = 54, (2) Unclear, N = 56 | (1) Unclear, N = 45 [83.3%], (2) Unclear, N = 52 [92.9%] | (1) vs (2) P value < 0.05 |
| Stein 2011, (1) MET, (2) Assessed control | Marijuana Problem Scale (mean ± SD) | (1) 4.82 ± 4.66, N = 163, (2) 4.99 ± 4.71, N = 169 | (1) Unclear, N = 126 [77.3%], (2) Unclear, N = 136 [80.5%] | (1) vs (2) P value > 0.05 |
| Stephens 1994, (1) RP, (2) SS | Drug Abuse Screening Test (mean ± SD) | (1) 8.88 ± 2.86, N = 106, (2) 6.31 ± 4.28, N = 106 | (1) 3.27 ± 3.41, N = 80 [75.5%], (2) 2.91 ± 3.64, N = 87 [82.1%] | (1) vs (2) P value > 0.05 |
| Stephens 2000, (1) MET, (2) CBT, (3) Assessed control | Marijuana Problem Scale (mean ± SD) | (1) 9.99 ± 2.89, N = 88, (2) 9.86 ± 3.05, N = 117, (3) 9.78 ± 2.96, N = 86 | (1) 12.99 ± 11.61, N = 80 [90.9%], (2) 12.29 ± 12.34, N = 103 [88.0%], (3) 7.89 ± 4.23, N = 79 [91.9%] | (1) vs (2) P value > 0.05; (1) vs (3) P value < 0.001; (2) vs (3) P value < 0.001 [significant at EoT only] |
| Stephens 2007, (1) MET, (2) Drug‐related health education, (3) DTC | Marijuana Problem Scale (mean ± SE) | (1) 6.37 ± 3.71, N = 62, (2) 5.31 ± 3.53, N = 62, (3) 6.31 ± 4.28, N = 64 | (1) 3.95 ± 0.40, N = 49 [79.0%], (2) 5.21 ± 0.40, N = 52 [83.9%], (3) 5.01 ± 0.40, N = 62 [96.9%] | (1) vs (2) P value > 0.05; (1) vs (3) P value > 0.05; (2) vs (3) P value > 0.05 |
| * Unless otherwise indicated by *, significant treatment outcomes favour the group with the lower number; exact P values are reported when provided CBT: Cognitive‐behavioural therapy CM‐abs: Contingency management with vouchers presented for negative urine CM‐adh: Contingency Management with vouchers presented for treatment attendance/adherence DC: Drug counselling EoT: End of treatment FU: Follow‐up MET: Motivational enhancement therapy RP: Relapse prevention SD: Standard deviation SE: Standard error SS: Social support TAU: Treatment as usual | ||||
| Study | Intended number of sessions | Intended treatment duration, weeks | Treatment adherence, % | Completed sessions, mean ± SD |
| CBT | ||||
| 1 | n/a | 87.8% attended | n/a | |
| 6 | 6 | 91% attended ≥ 1; 50% completed | 4.2 ± 2.2 | |
| 12 | 12 | 53.1% completed treatment | 5.9 ± 3.8* | |
| 14 | 14 | 50% attended 10 or more sessions including sessions 9 and 10 | 8.42 ± 3.51 | |
| CBT + CM‐abs | ||||
| 14 | 14 | 87% provided 3 or more urine specimens | 9.6 ± 4.9 | |
| 12 | 12 | 47.2% completed treatment | 5.9 ± 3.8* | |
| CBT + CM‐adh | ||||
| 14 | 14 | 87% provided 3 or more urine specimens | 8.8 ± 5.0 | |
| 12 | 12 | 59.4% completed treatment | 5.9 ± 3.8* | |
| MET | ||||
| 4 | 14 | 45% completed ≥ 1 session and provided ≥ 1 urine specimen during the final 2 weeks of treatment | ‐ | |
| 2 | 4 | 80.4% completed treatment | 1.7 ± 0.6 | |
| 2 | 6 | 71.9% completed treatment | 1.6 | |
| 1 | 7 | 88.7% completed treatment | ‐ | |
| MET + CBT | ||||
| 9 | 12 | 47% completed treatment | 6.5 | |
| 2 | 56 | 100% completed ≥ 1 session | ‐ | |
| 4 | 4 | 85.7% completed treatment | ‐ | |
| 4 | 12 | 67.3% completed treatment | ‐ | |
| 9 | 9 | ‐ | 4.9 ± 3.3 | |
| 8 | 8 | 66.7% completed treatment | ‐ | |
| 10 | 5‐8 | 87.8% completed treatment | 7 | |
| 10 | 8‐12 | 65.1% completed treatment | ||
| 13 | 18 | 54.2% “declined the intervention” | ‐ | |
| 14 | 14 | 65% completed ≥ 1 session | ||
| MET + CBT + CM‐abs | ||||
| 14 | 14 | 55% completed ≥ 1 session | ‐ | |
| 9 | 9 | ‐ | 5.5 ± 3.8 | |
| 9 | 9 | ‐ | 5.6 ± 3.6 | |
| MET + CBT + CM‐adh | ||||
| 9 | 9 | ‐ | 5.7 ± 3.5 | |
| MET + CBT + CM‐abs + CM‐adh | ||||
| 8 | 8 | 69.7% completed treatment | 5.1 ± 2.5 | |
| DC | ||||
| 8 | 8 | 39.4% completed treatment | ‐ | |
| 10 | 12 | ‐ | 7.6 ± 2.8 | |
| Drug‐related health education | ||||
| 1 | 7 | 93.5% completed treatment | ‐ | |
| DC + CM‐abs + CM‐adh | ||||
| 8 | 8 | 63.7% completed treatment | ‐ | |
| MM | ||||
| 2 | 2 | 72.7% completed treatment | ||
| RP | ||||
| 10 | 12 | 87.8% received ≥ 4 sessions | 7.54* | |
| 14 | 18 | 69% attended 7 or more sessions* | 7.6 ± 2.5* | |
| SS | ||||
| 10 | 12 | 73.2% received ≥ 4 sessions | 7.54* | |
| 14 | 18 | 69% attended 7 or more sessions* | 7.6 ± 2.5* | |
| CM‐abs | ||||
| 12 | 12 | 83% provided 3 or more urine specimens | ‐ | |
| 12 | 12 | 59.3% completed treatment | ‐ | |
| 9 | 9 | ‐ | 5.5 ± 3.8 | |
| * These data were reported as a total sample only, although no between‐group differences were noted across interventions CBT: Cognitive‐behavioural therapy CM‐abs: Contingency management with vouchers presented for negative urine CM‐adh: Contingency management with vouchers presented for treatment attendance/adherence DC: Drug counselling DTC: Delayed treatment control MET: Motivational enhancement therapy MM: Mindfulness meditation RP: Relapse prevention SS: Social support | ||||
| Study and group | Measure | Baseline | Follow‐up [% with data] | Significance* |
| Bonsack 2011, (1) MET, (2) TAU | The Contemplation Ladder; a scale score from 0‐100 of readiness, importance and confidence to change (median) | (1) 50.0, 50.0, 50.0, N = 30, (2) 50.0, 25.0, 50.0, N = 32 | (1) 56.25, 50.0, 75.0, N = 25 [83.3%], (2) 50.0, 50.0, 60.0, N = 29 [90.6%] | (1) vs (2) P value > 0.05, P value > 0.05, P value = 0.02 on the ‘confidence’ score at 3 month FU only, d = 0.64 |
| Budney 2000, (1) MET + CBT + CM‐abs, (2) MET + CBT, (3) MET | Adapted University of Rhode Island Change Assessment score, Situational Confidence Questionnaire (overall score least squares mean ± SE) | (1) 9.1 ± 0.36, 55.4 ± 3.9, N = 20, (2) 9.6 ± 3.5, 50.7 ± 3.9, N = 20, (3) 9.4 ± 0.34, 55.1 ± 4.3, N = 20 | (1) 8.5 ± 0.56, 68.4 ± 6.4, N = 14 [70.0%], (2) 8.6 ± 0.45, 79.0 ± 5.4, N = 15 [75.0%], (3) 6.6 ± 0.64, 58.3 ± 7.4, N = 16 [80.0%] | (1) vs (2)* P value > 0.05, P value < 0.05 [favours group 2]; (1) vs (3) P value > 0.05, P value > 0.05 (2) vs (3)* P value > 0.05, P value < 0.05 [favours group 2] |
| Edwards 2006, (1) DC, (2) TAU | Readiness to Change Questionnaire‐Cannabis (% in ‘action’ stage) | (1) 25.0, N = 23, (2) 29.5, N = 24 | (1) 27.3, N = 16 [69.6%], (2) 38.6, N = 17 [70.8%] | (1) vs (2) P value > 0.05 |
| Litt 2013, (1) MET + CBT + CM‐abs, (2) MET + CBT + CM‐adh, (3) Assessed control | Marijuana Self‐Efficacy Questionnaire, Coping Strategies Scale, Readiness to Change Questionnaire (data provided in unclear figure) | (1) Unclear, N = 73, (2) Unclear, N = 71, (3) Unclear, N = 71 | (1) Unclear, N = 60 [82.2%], (2) Unclear, N = 61 [85.9%], (3) Unclear, N = 61 [85.9%] | (1) vs (2) all P value > 0.05; (1) vs (3) all P value > 0.05; (2) vs (3) all P value > 0.05 |
| Stein 2011, (1) MET, (2) Assessed control | Percent with a desire to abstain (%) | (1) 56.8, N = 163, (2) 63.5, N = 169 | (1) 77.3, N = 126 [77.3%], (2) 80.5, N = 136 [80.5%] | (1) vs (2) P value > 0.05 |
| Stephens 2007, (1) MET, (2) Drug‐related health education, (3) DTC | Readiness to Change Questionnaire (% in pre‐contemplation or contemplation stage) | (1) 68, N = 62, (2) 87, N = 62, (3) 70, N = 64 | (1) Unclear, N = 49 [79.0%], (2) Unclear, N = 52 [83.9%], (3) Unclear, N = 62 [96.9%] | (1) vs (2) P value > 0.05; (1) vs (3) P value > 0.05; (2) vs (3) P value > 0.05 |
| * Unless otherwise indicated, significant treatment outcomes favour the group with the lower number; exact P values are reported when provided CBT: Cognitive‐behavioural therapy CM‐abs: Contingency management with vouchers presented for negative urine CM‐adh: Contingency management with vouchers presented for treatment attendance/adherence DC: Drug counselling DTC: Delayed treatment control EoT: End of treatment FU: Follow‐up MET: Motivational enhancement therapy RP: Relapse prevention SE: Standard error TAU: Treatment as usual | ||||
| Study and group | Measure | Baseline | Follow‐up [% with data] | Significance* |
| Budney 2000, (1) MET + CBT + CM‐abs, (2) MET + CBT, (3) MET | Addiction Severity Index ‘alcohol’ and ‘drug use’ composite scores (least squares mean ± SE) | (1) 0.9 ± 0.01, 0.22 ± 0.01, N = 20, (2) 0.12 ± 0.01, 0.20 ± 0.01, N = 20, (3) 0.07 ± 0.01, 0.21 ± 0.01, N = 20 | (1) 0.11 ± 0.02, 0.01 ± 0.02, N = 14 [70.0%], (2) 0.11 ± 0.02, 0.07 ± 0.02, N = 15 [75.0%], (3) 0.08 ± 0.02, 0.11 ± 0.02, N = 16 [80.0%] | (1) vs (2) P value > 0.05, P value < 0.05 [f = 0.23]; (1) vs (3) P value > 0.05, P value < 0.05 [f = 0.23]; (2) vs (3) P value > 0.05, P value > 0.05 |
| Budney 2006, (1) CBT + CM‐abs, (2) CBT + CM‐adh, (3) CM‐abs | Addiction Severity Index ‘alcohol’ and ‘drug use’ composite scores (mean ± SD) | (1) 0.09 ± 0.10, 0.23 ± 0.09, N = 30, (2) 0.10 ± 0.13, 0.25 ± 0.09, N = 30, (3) 0.11 ± 0.11, 0.24 ± 0.08, N = 30 | (1) Unclear, N = 21 [70.0%], (2) Unclear, N = 24 [80.0%], (3) Unclear, N = 22 [73.3%] | (1) vs (2) P value > 0.05; (1) vs (3) P value > 0.05; (2) vs (3) P value > 0.05 |
| Carroll 2006, (1) MET + CBT + CM‐abs + CM‐adh, (2) DC + CM‐abs + CM‐adh, (3) MET + CBT, (4) DC | Addiction Severity Index for alcohol and drug use (data not provided) | (1) Unclear, N = 33, (2) Unclear, N = 34, (3) Unclear, N = 36, (4) Unclear, N = 33 | (1) Unclear, N = 27 [81.8%], (2) Unclear, N = 24 [70.6%], (3) Unclear, N = 27 [75.0%], (4) Unclear, N = 30 [90.9%] | (1) vs (2) P value > 0.05; (1) vs (3) P value > 0.05; (1) vs (4) P value > 0.05; (2) vs (3) P value > 0.05; (3) vs (4) P value > 0.05; (2) vs (4) P value > 0.05 |
| Hoch 2012, (1) MET + CBT, (2) DTC | Addiction Severity Index ‘alcohol’ and ‘drug use’ composite scores (mean ± SD) | (1) 10.0 ± 1.0, 10.0 ± 0.7, N = 90, (2) 9.9 ± 0.8, 10.0 ± 0.7, N = 32 | (1) 11.0 ± 9.7, 3.0 ± 4.0, N = 79 [87.8%], (2) 13.7 ± 13.3, 8.3 ± 3.5, N = 31 [96.9%] | (1) vs (2) P value > 0.05, P value > 0.05 |
| Hoch 2014, (1) MET + CBT, (2) DTC | Litres per consumption day of alcohol (mean ± SD), proportion of daily smokers (%), proportion using any illicit drug (%) | (1) 0.2 ± 0.3, 78.2, 10.6, N = 166, (2) 0.2 ± 0.3, 82.0, 7.1, N = 130 | (1) 0.2 ± 0.4, 78.5, 13.0, N = 166 [100%], (2) 0.2 ± 0.02, 82.1, 8.6, N = 106 [81.5%] | (1) vs (2) P value > 0.05, P value > 0.05, P value > 0.05 |
| Jungerman 2007, (1) MET + CBT [3 months], (2) MET + CBT [1 month], (3) DTC | Percent of days post baseline used alcohol (mean ± SE), Addiction Severity Index drug use composite score (mean ± SE) | (1) 10.03 ± 2.20, 3.02 ± 0.21, N = 52, (2) 11.16 ± 2.12, 2.87 ± 0.20, N = 56, (3) 10.06 ± 2.20, 3.38 ± 0.21, N = 52 | (1) 7.09 ± 2.07, 2.10 ± 0.21 N = 27 [51.9%], (2) 9.13 ± 1.99, 2.77 ± 0.20, N = 37 [66.1%], (3) 9.01 ± 2.07, 2.81 ± 0.21, N = 35 [67.3%] | (1) vs (2) P value > 0.05, P value = 0.0121; (1) vs (3) P value > 0.05, P value > 0.05; (2) vs (3) P value > 0.05, P value > 0.05 |
| Kadden 2007 (1) MET + CBT + CM‐abs, (2) MET + CBT, (3) CM‐abs, (4) Health education | Addiction Severity Index ‘alcohol’ and ‘drug use’ composite scores (mean ± SD) | (1) 0.09 ± 0.10, 0.26 ± 0.05, N = 63, (2) 0.12 ± 0.12, 0.25 ± 0.07, N = 61, (3) 0.11 ± 0.14, 0.23 ± 0.07, N = 54, (4) 0.09 ± 0.09, 0.23 ± 0.07, N = 62 | (1) Unclear, N = 51 [81.0%], (2) Unclear, N = 49 [80.3%], (3) Unclear, N = 48 [88.9%], (4) Unclear, N = 52 [83.9%] | (1) vs (2) P value > 0.05, P value > 0.05; (1) vs (3) P value > 0.05, P value > 0.05; (1) vs (4) P value > 0.05, P value > 0.05; (2) vs (3) P value > 0.05, P value > 0.05; (3) vs (4) P value > 0.05, P value > 0.05; (2) vs (4) P value > 0.05, P value > 0.05 |
| MTPRG 2004, (1) MET + CBT, (2) MET, (3) Assessed control | Days alcohol used in prior 90 days (mean ± SD), Addiction Severity Index for alcohol (mean ± SD) | (1) 48.79 ± 79.10, 0.11 ± 0.13, N = 156, (2) 59.41 ± 84.56, 0.12 ± 0.13, N = 146, (3) 46.57 ± 85.48, 0.11 ± 0.12, N = 148 | (1) 46.12 ± 106.70, 0.10 ± 0.11, N = 129 [82.7%], (2) 45.56 ± 76.62, 0.12 ± 0.13, N = 120 [82.2%], (3) 42.92 ± 62.48, 0.11 ± 0.12, N = 137 [92.6%] | (1) vs (2) P value > 0.05, P value > 0.05; (1) vs (3) P value > 0.05, P value > 0.05; (2) vs (3) P value > 0.05, P value > 0.05 |
| Roffman 1988, (1) RP, (2) SS | Occasions of use in prior week for alcohol and tobacco, proportion reporting any illicit drug use (data provided for total sample only) | (1) Unclear, N = 54, (2) Unclear, N = 56 | (1) Unclear, N = 45 [83.3%], (2) Unclear, N = 52 [92.9%] | (1) vs (2) P value > 0.05 |
| Stephens 1994, (1) RP, (2) SS | Average occasions of use in a typical week for alcohol and illicit drugs in the prior 90 days, number of alcohol‐related and drug‐related problem scores from the Drug Abuse Screening Test (data provided for total sample only) | (1) Unclear, N = 106, (2) Unclear, N = 106 | (1) Unclear, N = 80 [75.5%], (2) Unclear, N = 87 [82.1%] | (1) vs (2) all P value > 0.05 |
| Stephens 2000, (1) MET, (2) CBT, (3) Assessed control | Frequency of alcohol and other drug use in the prior 90 days, number of alcohol and drug‐related problems from unclear 19‐item assessment (mean) | (1) Unclear, N = 88, (2) Unclear, N = 117, (3) Unclear, N = 86 [data reported as total sample only] | (1) 0.48, N = 80 [90.9%], (2) 0.76, N = 103 [88.0%], (3) 5.01, N = 79 [91.9%] [data reported as total sample only, with the exception of other drug use frequency] | (1) vs (2) all P value > 0.05; (1) vs (3) all P value > 0.05, except other drug use frequency P value < 0.05; (2) vs (3) all P value > 0.05, except other drug use frequency P value < 0.05 [significant at EoT only] |
| Stephens 2007, (1) MET, (2) Drug‐related health education, (3) DTC | Days used in prior week for alcohol and illicit drugs and number of alcohol and drug‐related problems from unclear assessment (mean ± SD when provided) | (1) 2.00 ± 2.08, 0.16 ± 0.43, Unclear, N = 62, (2) 1.38 ± 1.63, 0.13 ± 0.23, Unclear, N = 62, (3) 1.90 ± 2.12, 0.11 ± 0.19, Unclear, N = 64 | (1) Unclear, N = 49 [79.0%], (2) Unclear, N = 52 [83.9%], (3) Unclear, N = 62 [96.9%] | (1) vs (2) all P value > 0.05; (1) vs (3) all P value > 0.05; (2) vs (3) all P value > 0.05 |
| * Unless otherwise indicated by *, significant treatment outcomes favour the group with the lower number; exact P values are reported when provided CBT: Cognitive‐behavioural therapy CM‐abs: Contingency management with vouchers presented for negative urine CM‐adh: Contingency management with vouchers presented for treatment attendance/adherence DC: Drug counselling DTC: Delayed treatment control EoT: End of treatment FU: Follow‐up MET: Motivational enhancement therapy RP: Relapse prevention SD: Standard deviation SE: Standard error SS: Social support TAU: Treatment as usual | ||||
| Study and group | Measure | Baseline | Follow‐up [% with data] | Significance* |
| Bonsack 2011, (1) MET, (2) TAU | PANSS‐P, PANSS‐N, GAF, SOFAS, Proportion admitted to hospital during trial period (median ± range) | (1) 17.0 ± 19.0, 18.0 ± 18, 40.0 ± 20.0, 40.0 ± 19.0, n/a, N = 30, (2) 17.0 ± 21.0, 17.5 ± 13, 40.0 ± 40.0, 40.0 ± 40.0, n/a, N = 32 | (1) 16.0 ± 22, 17.0 ± 16.0, 40 ± 24, 40.5 ± 24, 30.0, N = 25 [83.3%], (2) 16.0 ± 20.0, 17.5 ± 17.0, 40.0 ± 40.0, 41.0 ± 30.0, 34.4, N = 29 [90.6%] | (1) vs (2) P value > 0.05, P value > 0.05, P value > 0.05, P value > 0.05, P value > 0.05 |
| Budney 2000, (1) MET + CBT + CM‐abs, (2) MET + CBT, (3) MET | Global Symptom Index of the Brief Symptom Inventory (least squares, mean ± SE) | (1) 68.1 ± 1.8, N = 20, (2) 65.6 ± 1.8, N = 20, (3) 67.9 ± 1.9, N = 20 | (1) 58.9 ± 2.9, N = 14 [70.0%], (2) 55.4 ± 2.3, N = 15 [75.0%], (3) 58.7 ± 3.4, N = 16 [80.0%] | (1) vs (2) P value > 0.05; (1) vs (3) P value > 0.05; (2) vs (3) P value > 0.05 |
| Budney 2006, (1) CBT + CM‐abs, (2) CBT + CM‐adh, (3) CM‐abs | Global Symptom Index of the Brief Symptom Inventory, Beck Depression Inventory (least squares, mean ± SD) | (1) 1.0 ± 0.79, 14.2 ± 11.7, N = 30, (2) 1.1 ± 0.93, 15.6 ± 12.0, N = 30, (3) 1.1 ± 0.79, 15.0 ± 12.1, N = 30 | (1) Unclear, Unclear, N = 21 [70.0%], (2) Unclear, Unclear, N = 24 [80.0%], (3) Unclear, Unclear, N = 22 [73.3%] | (1) vs (2) P value > 0.05; (1) vs (3) P value > 0.05; (2) vs (3) P value > 0.05 |
| Carroll 2006, (1) MET + CBT + CM‐abs, + CM‐adh, (2) DC + CM‐abs + CM‐adh, (3) MET + CBT, (4) DC | Addiction Severity Index composite scores (data not shown) | (1) Unclear, N = 33, (2) Unclear, N = 34, (3) Unclear, N = 36, (4) Unclear, N = 33 | (1) Unclear, N = 27 [81.8%], (2) Unclear, N = 24 [70.6%], (3) Unclear, N = 27 [75.0%], (4) Unclear, N = 30 [90.9%] | (1) vs (2) P value > 0.05; (1) vs (3) P value > 0.05; (1) vs (4) P value > 0.05; (2) vs (3) P value > 0.05; (3) vs (4) P value = 0.05 [for the ‘legal’ score across FU]; (2) vs (4) P value > 0.05 |
| Copeland 2001, (1) CBT [6‐session], (2) CBT [1‐session], (3) DTC | Symptom Checklist‐90 Global Severity Index (mean ± SD) | (1) 0.7 ± 0.3, N = 78, (2) 0.7 ± 0.4, N = 82, (3) 0.7 ± 0.3, N = 69 | (1) 0.6 ± 0.3, N = 58 [74.4%], (2) 0.5 ± 0.4, N = 61 [74.4%], (3) 0.6 ± 0.4, N = 52 [75.4%] | (1) vs (2) P value > 0.05; (1) vs (3) P value > 0.05; (2) vs (3) P value > 0.05 |
| Edwards 2006, (1) DC, (2) TAU | BPRS‐E, BPRS‐PS, SANS, BDI‐SF, SOFAS, KAPQ (mean ± SD) | (1) 49.9 ± 16.3, 10.3 ± 5.4, 28 ± 16, 10.4 ± 6.6, 48.7 ± 17.2, 21.2 ± 3.9, N = 23, (2) 48.8 ±1 7, 10.8 ± 5.2, 24.7 ± 13.6, 8.8 ± 8.1, 49.8 ± 14.8, 20.3 ± 5.4, N = 24 | (1) 45.6 ± 13.5, 9.4 ± 4.6, 23.7 ± 17.2, 7.5 ± 6.3, 51.7 ± 18.3, 22.4 ± 4.0, N = 16 [69.6%], (2) 44.8 ± 15.4, 8.8 ± 4.8, 19.4 ± 13.5, 6.3 ± 7.2, 56.4 ± 15.9, 21.5 ± 4.1, N = 17 [70.8%] | (1) vs (2) all P value > 0.05 |
| Hoch 2012, (1) MET + CBT, (2) DTC | Brief Symptom Inventory, disability days in the prior month using the M‐CIDI (mean ± SD) | (1) 0.9 ± 0.6, 9.4 ± 10.2, N = 90, (2) 0.9 ± 0.5, 6.6 ± 8.7, N = 32 | (1) 0.4 ± 0.4, 3.2 ± 5.9, N = 79 [87.8%], (2) 0.7 ± 0.5, 6.5 ± 9.6, N = 31 [96.9%] | (1) vs (2) P value > 0.05, P value < 0.05 |
| Kadden 2007, (1) MET + CBT + CM‐abs, (2) MET + CBT, (3) CM‐abs, (4) Health education | Psychiatric composite score from the Addiction Severity Index (mean ± SD) | (1) 0.25 ± 0.19, N = 63, (2) 0.24 ± 0.20, N = 61, (3) 0.25 ± 0.21, N = 54, (4) 0.22 ± 0.23, N = 62 | (1) Unclear, N = 51 [81.0%], (2) Unclear, N = 49 [80.3%], (3) Unclear, N = 48 [88.9%], (4) Unclear, N = 52 [83.9%] | (1) vs (2) P value > 0.05; (1) vs (3) P value > 0.05; (1) vs (4) P value > 0.05; (2) vs (3) P value > 0.05; (3) vs (4) P value > 0.05; (2) vs (4) P value > 0.05 |
| Madigan 2013, (1) MET + CBT, (2) TAU | Insight composite of the BIS, SAPS, SANS, CDSS, GAF, WHOQOL (mean ± SD) | (1) 6.8 ± 2.8, 5.4 ± 4.0, 7.7 ± 3.1, 5.1 ± 5.7, 38.3 ± 13.1, 12.5 ± 4.0, N = 59, (2) 6.3 ± 2.7, 5.7 ± 4.8, 7.4 ± 3.0, 5.0 ± 6.4, 38.0 ± 9.0, 13.3 ± 2.8, N = 29 | (1) 7.0 ± 2.9, 4.9 ± 4.0, 4.6 ± 3.0, 4.3 ± 4.4, 37.6 ± 8.34, 12.6 ± 3.4, N = 32 [54.2%], (2) 6.6 ± 1.5, 5.1 ± 4.2, 4.8 ± 3.2, 4.3 ± 4.2, 37.2 ± 11.5, 11.1 ± 2.9, N = 19 [65.5%] | (1) vs (2) all P value > 0.05, except for the WHOQOL at P value = 0.05 |
| MTPRG 2004, (1) MET + CBT, (2) MET, (3) Assessed control | Beck Depression Inventory, STAI‐S (mean ± SD) | (1) 11.39 ± 7.00, 39.87 ± 11.62, N = 156, (2) 13.21 ± 8.60, 41.61 ± 12.19, N = 146, (3) 10.09 ± 7.35, 37.29 ± 11.53, N = 148 | (1) 7.34 ± 8.29, 33.61 ± 11.32, N = 129 [82.7%], (2) 10.16 ± 9.36, 38.85 ± 12.66, N = 120 [82.2%], (3) 7.87 ± 6.78, 35.50 ± 11.21, N = 137 [92.6%] | (1) vs (2) P value > 0.05, P value < 0.05 at 4 month FU only; (1) vs (3) P value > 0.05, P value < 0.05; (2) vs (3) P value > 0.05, P value > 0.05 |
| * Unless otherwise indicated, significant treatment outcomes favour the group with the lower number; exact P values are reported when provided BDI‐SF: Beck Depression Inventory‐Short Form BIS: Birchwood Insight Scale BPRS‐E: Brief Psychiatric Rating Scale‐Expanded BPRS‐PS: Brief Psychiatric Rating Scale‐Positive Symptom subscale CBT: Cognitive‐behavioural therapy CDSS: Calgary Depression Scale for Schizophrenia CM‐abs: Contingency management with vouchers presented for negative urine CM‐adh: Contingency management with vouchers presented for treatment attendance/adherence DC: Drug counselling DTC: Delayed treatment control EoT: End of treatment FU: Follow‐up GAF: Global Assessment of Functioning scale KAPQ: Knowledge About Psychosis Questionnaire M‐CIDI: Munich‐Composite International Diagnostic Interview MET: Motivational enhancement therapy PANSS: Positive and Negative Syndrome Scale SANS: Scale for the Assessment of Negative Symptoms SAPS: Scale for the Assessment of Positive Symptoms SD: Standard deviation SE: Standard error SOFAS: Social and Occupational Functioning Scale TAU: Treatment as usual WHOQOL: World Health Organization, Quality of Life assessment | ||||
| Outcome or subgroup title | No. of studies | No. of participants | Statistical method | Effect size |
| 1 Reductions in cannabis use frequency at short‐term follow‐up Show forest plot | 6 | 1144 | Mean Difference (IV, Random, 95% CI) | 5.67 [3.08, 8.26] |
| 2 Reduction in cannabis use frequency at short‐term follow‐up (intervention intensity) Show forest plot | 6 | 1144 | Mean Difference (IV, Random, 95% CI) | 6.39 [4.01, 8.78] |
| 2.1 Low‐intensity intervention | 6 | 763 | Mean Difference (IV, Random, 95% CI) | 4.58 [2.65, 6.50] |
| 2.2 High‐intensity intervention | 3 | 381 | Mean Difference (IV, Random, 95% CI) | 10.02 [7.69, 12.34] |
| 3 Reduction in cannabis use frequency at short‐term follow‐up (intervention type) Show forest plot | 6 | 1144 | Mean Difference (IV, Random, 95% CI) | 6.34 [3.80, 8.88] |
| 3.1 MET | 4 | 612 | Mean Difference (IV, Random, 95% CI) | 4.45 [1.90, 7.00] |
| 3.2 CBT | 1 | 134 | Mean Difference (IV, Random, 95% CI) | 10.94 [7.44, 14.44] |
| 3.3 MET + CBT | 3 | 398 | Mean Difference (IV, Random, 95% CI) | 7.38 [3.18, 11.57] |
| 4 Point‐prevalence abstinence at short‐term follow‐up Show forest plot | 6 | 1166 | Risk Ratio (M‐H, Random, 95% CI) | 2.55 [1.34, 4.83] |
| 5 Point‐prevalence abstinence at short‐term follow‐up (intervention intensity) Show forest plot | 6 | 1166 | Risk Ratio (M‐H, Random, 95% CI) | 1.96 [1.20, 3.21] |
| 5.1 Low‐intensity intervention | 4 | 435 | Risk Ratio (M‐H, Random, 95% CI) | 0.92 [0.51, 1.66] |
| 5.2 High‐intensity intervention | 5 | 731 | Risk Ratio (M‐H, Random, 95% CI) | 3.09 [2.23, 4.29] |
| 6 Point‐prevalence abstinence at short‐term follow‐up (intervention type) Show forest plot | 6 | 1166 | Risk Ratio (M‐H, Random, 95% CI) | 2.17 [1.24, 3.80] |
| 6.1 MET | 1 | 197 | Risk Ratio (M‐H, Random, 95% CI) | 1.19 [0.43, 3.28] |
| 6.2 CBT | 1 | 171 | Risk Ratio (M‐H, Random, 95% CI) | 4.81 [1.17, 19.70] |
| 6.3 MET + CBT | 5 | 798 | Risk Ratio (M‐H, Random, 95% CI) | 2.17 [1.10, 4.32] |
| 7 Reduction in joints per day at short‐term follow‐up Show forest plot | 8 | 1600 | Std. Mean Difference (IV, Random, 95% CI) | 3.55 [2.51, 4.59] |
| 8 Reduction in joints per day at short‐term follow‐up (intervention intensity) Show forest plot | 8 | 1600 | Std. Mean Difference (IV, Random, 95% CI) | 3.71 [2.71, 4.71] |
| 8.1 Low‐intensity intervention | 6 | 752 | Std. Mean Difference (IV, Random, 95% CI) | 2.70 [1.69, 3.70] |
| 8.2 High‐intensity intervention | 6 | 848 | Std. Mean Difference (IV, Random, 95% CI) | 4.74 [3.49, 6.00] |
| 9 Reduction in joints per day at short‐term follow‐up (intervention type) Show forest plot | 8 | 1600 | Std. Mean Difference (IV, Random, 95% CI) | 3.90 [2.82, 4.98] |
| 9.1 MET | 4 | 611 | Std. Mean Difference (IV, Random, 95% CI) | 3.17 [2.67, 3.66] |
| 9.2 CBT | 2 | 306 | Std. Mean Difference (IV, Random, 95% CI) | 3.40 [‐1.05, 7.84] |
| 9.3 MET + CBT | 4 | 683 | Std. Mean Difference (IV, Random, 95% CI) | 4.88 [3.14, 6.62] |
| 10 Reduction in symptoms of dependence at short‐term follow‐up Show forest plot | 4 | 889 | Std. Mean Difference (IV, Random, 95% CI) | 4.15 [1.67, 6.63] |
| 11 Reduction in symptoms of dependence at short‐term follow‐up (intervention intensity) Show forest plot | 4 | 889 | Std. Mean Difference (IV, Random, 95% CI) | 5.56 [2.73, 8.39] |
| 11.1 Low‐intensity intervention | 3 | 370 | Std. Mean Difference (IV, Random, 95% CI) | 2.83 [0.41, 5.24] |
| 11.2 High‐intensity intervention | 3 | 519 | Std. Mean Difference (IV, Random, 95% CI) | 8.37 [2.51, 14.23] |
| 12 Symptoms of dependence at short‐term follow‐up (intervention type) Show forest plot | 4 | 889 | Std. Mean Difference (IV, Random, 95% CI) | 6.32 [3.15, 9.50] |
| 12.1 MET | 2 | 316 | Std. Mean Difference (IV, Random, 95% CI) | 4.07 [1.97, 6.17] |
| 12.2 MET + CBT | 3 | 573 | Std. Mean Difference (IV, Random, 95% CI) | 7.89 [0.93, 14.85] |
| 13 Reduction in cannabis‐related problems at short‐term follow‐up Show forest plot | 6 | 2202 | Std. Mean Difference (IV, Random, 95% CI) | 3.34 [1.26, 5.42] |
| 14 Reduction in cannabis‐related problems at short‐term follow‐up (intervention intensity) Show forest plot | 6 | 2202 | Std. Mean Difference (IV, Random, 95% CI) | 3.70 [1.91, 5.49] |
| 14.1 Low‐intensity intervention | 5 | 667 | Std. Mean Difference (IV, Random, 95% CI) | 2.50 [1.01, 3.98] |
| 14.2 High‐intensity intervention | 4 | 1535 | Std. Mean Difference (IV, Random, 95% CI) | 5.14 [2.57, 7.70] |
| 15 Reduction in cannabis‐related problems at short‐term follow‐up (intervention type) Show forest plot | 6 | 2202 | Std. Mean Difference (IV, Random, 95% CI) | 4.11 [2.22, 6.01] |
| 15.1 MET | 4 | 612 | Std. Mean Difference (IV, Random, 95% CI) | 3.29 [1.85, 4.72] |
| 15.2 CBT | 1 | 135 | Std. Mean Difference (IV, Random, 95% CI) | 7.88 [6.86, 8.90] |
| 15.3 MET + CBT | 3 | 1455 | Std. Mean Difference (IV, Random, 95% CI) | 3.85 [‐0.39, 8.10] |
| Outcome or subgroup title | No. of studies | No. of participants | Statistical method | Effect size |
| 1 Reduction in cannabis use frequency Show forest plot | 2 | 97 | Mean Difference (IV, Random, 95% CI) | 0.13 [‐2.00, 2.27] |
| 2 Reduction in severity of cannabis use disorder Show forest plot | 1 | 33 | Mean Difference (IV, Random, 95% CI) | 0.10 [‐0.82, 1.02] |
| Outcome or subgroup title | No. of studies | No. of participants | Statistical method | Effect size |
| 1 Reduction in cannabis use frequency Show forest plot | 6 | Mean Difference (IV, Random, 95% CI) | Subtotals only | |
| 1.1 RP vs SS | 1 | 97 | Mean Difference (IV, Random, 95% CI) | 5.55 [1.89, 9.21] |
| 1.2 MET vs DC | 1 | 112 | Mean Difference (IV, Random, 95% CI) | 3.99 [0.89, 7.08] |
| 1.3 MET vs CBT | 1 | 179 | Mean Difference (IV, Random, 95% CI) | ‐0.86 [‐3.86, 2.14] |
| 1.4 MET vs MET + CBT | 1 | 31 | Mean Difference (IV, Random, 95% CI) | ‐2.80 [‐9.94, 4.34] |
| 1.5 MET vs MET + CBT + CM‐abs (EoT) | 1 | 30 | Mean Difference (IV, Random, 95% CI) | ‐7.30 [‐13.68, ‐0.92] |
| 1.6 MET vs MET + CBT + CM‐abs | 1 | 266 | Mean Difference (IV, Random, 95% CI) | ‐4.96 [‐7.18, ‐2.74] |
| 1.7 CBT + CM‐abs vs CM‐abs | 1 | 43 | Mean Difference (IV, Random, 95% CI) | 4.9 [‐1.95, 11.75] |
| 1.8 CBT + CM‐adh vs CM‐abs | 1 | 46 | Mean Difference (IV, Random, 95% CI) | ‐0.70 [‐7.61, 6.21] |
| 1.9 CBT + CM‐abs vs CBT + CM‐adh | 1 | 45 | Mean Difference (IV, Random, 95% CI) | 5.60 [‐1.65, 12.85] |
| 2 Point‐prevalence abstinence Show forest plot | 8 | Odds Ratio (M‐H, Fixed, 95% CI) | Subtotals only | |
| 2.1 MET vs MET + CBT | 2 | 301 | Odds Ratio (M‐H, Fixed, 95% CI) | 3.59 [1.80, 7.20] |
| 2.2 MET + CBT vs MET + CBT + CM‐abs + CM‐adh | 1 | 43 | Odds Ratio (M‐H, Fixed, 95% CI) | 0.72 [0.21, 2.50] |
| 2.3 MET + CBT vs DC | 1 | 156 | Odds Ratio (M‐H, Fixed, 95% CI) | 1.38 [0.44, 4.38] |
| 2.4 DC vs DC + CM‐abs + CM‐adh | 1 | 41 | Odds Ratio (M‐H, Fixed, 95% CI) | 0.42 [0.10, 1.81] |
| 2.5 MET + CBT + CM‐abs + CM‐adh vs DC + CM‐abs + CM‐adh | 1 | 40 | Odds Ratio (M‐H, Fixed, 95% CI) | 1.38 [0.38, 5.07] |
| 2.6 MET + CBT vs DC + CM‐abs + CM‐adh | 1 | 39 | Odds Ratio (M‐H, Fixed, 95% CI) | 1.0 [0.26, 3.80] |
| 2.7 MET vs CBT | 1 | 170 | Odds Ratio (M‐H, Fixed, 95% CI) | 0.80 [0.43, 1.47] |
| 2.8 RP vs SS | 1 | 167 | Odds Ratio (M‐H, Fixed, 95% CI) | 1.06 [0.54, 2.08] |
| 2.9 MET + CBT (low intensity) vs MET + CBT (high intensity) | 1 | 64 | Odds Ratio (M‐H, Fixed, 95% CI) | 0.35 [0.03, 4.04] |
| 2.10 CBT + CM‐abs vs CBT + CM‐adh | 1 | 45 | Odds Ratio (M‐H, Fixed, 95% CI) | 1.85 [0.52, 6.62] |
| 2.11 CBT + CM‐abs vs CM‐abs | 1 | 43 | Odds Ratio (M‐H, Fixed, 95% CI) | 2.77 [0.69, 11.19] |
| 2.12 CBT + CM‐adh vs CM‐abs | 1 | 46 | Odds Ratio (M‐H, Fixed, 95% CI) | 1.5 [0.36, 6.23] |
| 2.13 CBT (low intensity) vs CBT (high intensity) | 1 | 119 | Odds Ratio (M‐H, Fixed, 95% CI) | 0.75 [0.30, 1.90] |
| 3 Reduction in joints used per day Show forest plot | 7 | Std. Mean Difference (IV, Random, 95% CI) | Subtotals only | |
| 3.1 MET vs CBT | 1 | 183 | Std. Mean Difference (IV, Random, 95% CI) | ‐1.63 [‐1.97, ‐1.29] |
| 3.2 MET vs MET + CBT + CM‐abs | 1 | 266 | Std. Mean Difference (IV, Random, 95% CI) | 0.22 [‐0.02, 0.46] |
| 3.3 MET vs DC | 1 | 101 | Std. Mean Difference (IV, Random, 95% CI) | 1.81 [1.35, 2.28] |
| 3.4 CBT (low intensity) vs CBT (high intensity) | 1 | 119 | Std. Mean Difference (IV, Random, 95% CI) | ‐3.15 [‐3.69, ‐2.61] |
| 3.5 RP vs SS | 1 | 97 | Std. Mean Difference (IV, Random, 95% CI) | ‐1.22 [‐1.66, ‐0.79] |
| 3.6 MET + CBT (low intensity) vs MET + CBT (high intensity) | 1 | 64 | Std. Mean Difference (IV, Random, 95% CI) | ‐0.08 [‐0.58, 0.41] |
| 3.7 CBT + CM‐adh vs CBT + CM‐abs | 1 | 52 | Std. Mean Difference (IV, Random, 95% CI) | 2.45 [1.72, 3.18] |
| 3.8 CBT + CM‐abs vs CM‐abs | 1 | 50 | Std. Mean Difference (IV, Random, 95% CI) | ‐0.03 [‐0.59, 0.52] |
| 3.9 CBT + CM‐adh vs CM‐abs | 1 | 50 | Std. Mean Difference (IV, Random, 95% CI) | 2.37 [1.63, 3.10] |
| 4 Reduction in symptoms of dependence Show forest plot | 5 | Std. Mean Difference (IV, Random, 95% CI) | Subtotals only | |
| 4.1 MET vs Drug education control | 1 | 101 | Std. Mean Difference (IV, Random, 95% CI) | 4.32 [3.60, 5.04] |
| 4.2 MET vs MET + CBT | 1 | 266 | Std. Mean Difference (IV, Random, 95% CI) | ‐1.78 [‐2.07, ‐1.50] |
| 4.3 MET vs CBT | 1 | 183 | Std. Mean Difference (IV, Random, 95% CI) | 0.06 [‐0.23, 0.36] |
| 4.4 MET + CBT (high intensity) vs MET + CBT (low intensity) | 1 | 64 | Std. Mean Difference (IV, Random, 95% CI) | 4.96 [3.95, 5.98] |
| 4.5 CBT (low intensity) vs CBT (high intensity) | 1 | 119 | Std. Mean Difference (IV, Random, 95% CI) | ‐2.66 [‐3.16, ‐2.16] |
| 5 Reduction in cannabis‐related problems Show forest plot | 4 | Mean Difference (IV, Random, 95% CI) | Subtotals only | |
| 5.1 MET vs MET + CBT | 2 | 292 | Mean Difference (IV, Random, 95% CI) | ‐0.34 [‐0.47, ‐0.22] |
| 5.2 MET vs MET + CBT + CM‐abs | 1 | 30 | Mean Difference (IV, Random, 95% CI) | 0.04 [‐0.22, 0.30] |
| 5.3 RP vs SS | 1 | 156 | Mean Difference (IV, Random, 95% CI) | ‐0.25 [‐0.29, ‐0.21] |
| 5.4 CBT (low intensity) vs CBT (high intensity) | 1 | 119 | Mean Difference (IV, Random, 95% CI) | ‐0.40 [‐0.46, ‐0.35] |
| 6 Treatment completion Show forest plot | 5 | Risk Ratio (M‐H, Random, 95% CI) | Subtotals only | |
| 6.1 MET vs MET + CBT (high intensity) | 1 | 302 | Risk Ratio (M‐H, Random, 95% CI) | 1.54 [1.26, 1.87] |
| 6.2 MET + CBT (low intensity) vs MET + CBT (high intensity) | 1 | 108 | Risk Ratio (M‐H, Random, 95% CI) | 1.27 [1.02, 1.58] |
| 6.3 CBT (low intensity) vs CBT (high intensity) | 1 | 160 | Risk Ratio (M‐H, Random, 95% CI) | 1.76 [1.39, 2.22] |
| 6.4 MET + CBT vs MET + CBT + CM‐abs + CM‐adh | 1 | 69 | Risk Ratio (M‐H, Random, 95% CI) | 0.96 [0.69, 1.32] |
| 6.5 DC vs DC + CM‐adh + CM‐abs | 1 | 67 | Risk Ratio (M‐H, Random, 95% CI) | 0.61 [0.37, 0.99] |
| 6.6 MET + CBT vs DC | 1 | 69 | Risk Ratio (M‐H, Random, 95% CI) | 1.69 [1.04, 2.74] |
| 6.7 MET + CBT vs DC + CM‐adh + CM‐abs | 1 | 70 | Risk Ratio (M‐H, Random, 95% CI) | 1.03 [0.73, 1.45] |
| 6.8 MET + CBT + CM‐abs + CM‐adh vs DC | 1 | 66 | Risk Ratio (M‐H, Random, 95% CI) | 1.77 [1.10, 2.86] |
| 6.9 MET + CBT + CM‐adh + CM‐abs vs DC + CM‐adh + CM‐abs | 1 | 67 | Risk Ratio (M‐H, Random, 95% CI) | 1.08 [0.77, 1.51] |
| 6.10 CBT vs CBT + CM‐abs | 1 | 68 | Risk Ratio (M‐H, Random, 95% CI) | 1.13 [0.70, 1.82] |
| 6.11 CBT vs CBT + CM‐adh | 1 | 68 | Risk Ratio (M‐H, Random, 95% CI) | 0.89 [0.58, 1.35] |
| 6.12 CBT + CM‐abs vs CBT + CM‐adh | 1 | 64 | Risk Ratio (M‐H, Random, 95% CI) | 0.79 [0.49, 1.26] |
| 6.13 CBT vs CM‐abs | 1 | 63 | Risk Ratio (M‐H, Random, 95% CI) | 0.89 [0.57, 1.38] |
| 6.14 CBT + CM‐abs vs CM‐abs | 1 | 59 | Risk Ratio (M‐H, Random, 95% CI) | 0.79 [0.49, 1.28] |
| 6.15 CBT + CM‐adh vs CM‐abs | 1 | 59 | Risk Ratio (M‐H, Random, 95% CI) | 1.00 [0.66, 1.53] |
| 7 Improvement in motivation to quit Show forest plot | 1 | Mean Difference (IV, Random, 95% CI) | Subtotals only | |
| 7.1 MET + CBT vs MET | 1 | 31 | Mean Difference (IV, Random, 95% CI) | 25.1 [9.79, 40.41] |
| 7.2 MET vs MET + CBT + CM‐abs | 1 | 30 | Mean Difference (IV, Random, 95% CI) | ‐9.8 [‐25.83, 6.23] |
| 7.3 MET + CBT vs MET + CBT + CM‐abs | 1 | 29 | Mean Difference (IV, Random, 95% CI) | 15.3 [‐0.56, 31.16] |
| 8 Reduction in alcohol use severity (ASI score) Show forest plot | 2 | Mean Difference (IV, Random, 95% CI) | Subtotals only | |
| 8.1 MET vs MET + CBT | 2 | 280 | Mean Difference (IV, Random, 95% CI) | ‐0.02 [‐0.07, 0.03] |
| 8.2 MET + CBT + CM‐abs vs MET | 1 | 30 | Mean Difference (IV, Random, 95% CI) | 0.8 [0.75, 0.85] |
| 8.3 MET + CBT + CM‐abs vs MET + CBT | 1 | 29 | Mean Difference (IV, Random, 95% CI) | 0.78 [0.73, 0.83] |
| 9 Reduction in drug use severity (ASI score) Show forest plot | 2 | Mean Difference (IV, Random, 95% CI) | Subtotals only | |
| 9.1 MET vs MET + CBT | 1 | 31 | Mean Difference (IV, Random, 95% CI) | ‐0.03 [‐0.08, 0.02] |
| 9.2 MET + CBT + CM‐abs vs MET | 1 | 30 | Mean Difference (IV, Random, 95% CI) | 0.11 [0.06, 0.16] |
| 9.3 MET + CBT + CM‐abs vs MET + CBT | 1 | 29 | Mean Difference (IV, Random, 95% CI) | 0.08 [0.03, 0.13] |
| 9.4 MET + CBT (high intensity) vs MET + CBT (low intensity) | 1 | 64 | Mean Difference (IV, Random, 95% CI) | 0.82 [0.12, 1.52] |
| 10 Reduction in frequency of alcohol use Show forest plot | 2 | Mean Difference (IV, Random, 95% CI) | Subtotals only | |
| 10.1 MET vs MET + CBT | 1 | 249 | Mean Difference (IV, Random, 95% CI) | 11.18 [‐13.43, 35.79] |
| 10.2 MET + CBT (high intensity) vs MET + CBT (low intensity) | 1 | 64 | Mean Difference (IV, Random, 95% CI) | 0.82 [‐5.58, 7.21] |