முழங்கால் கீல்வாதத்திற்கான உள்‐மூட்டு கார்டிகோஸ்டீராய்டு
Abstract
Background
Knee osteoarthritis is a leading cause of chronic pain, disability, and decreased quality of life. Despite the long‐standing use of intra‐articular corticosteroids, there is an ongoing debate about their benefits and safety. This is an update of a Cochrane review first published in 2005.
Objectives
To determine the benefits and harms of intra‐articular corticosteroids compared with sham or no intervention in people with knee osteoarthritis in terms of pain, physical function, quality of life, and safety.
Search methods
We searched the Cochrane Central Register of Controlled Trials (CENTRAL), MEDLINE, and EMBASE (from inception to 3 February 2015), checked trial registers, conference proceedings, reference lists, and contacted authors.
Selection criteria
We included randomised or quasi‐randomised controlled trials that compared intra‐articular corticosteroids with sham injection or no treatment in people with knee osteoarthritis. We applied no language restrictions.
Data collection and analysis
We calculated standardised mean differences (SMDs) and 95% confidence intervals (CI) for pain, function, quality of life, joint space narrowing, and risk ratios (RRs) for safety outcomes. We combined trials using an inverse‐variance random‐effects meta‐analysis.
Main results
We identified 27 trials (13 new studies) with 1767 participants in this update. We graded the quality of the evidence as 'low' for all outcomes because treatment effect estimates were inconsistent with great variation across trials, pooled estimates were imprecise and did not rule out relevant or irrelevant clinical effects, and because most trials had a high or unclear risk of bias. Intra‐articular corticosteroids appeared to be more beneficial in pain reduction than control interventions (SMD ‐0.40, 95% CI ‐0.58 to ‐0.22), which corresponds to a difference in pain scores of 1.0 cm on a 10‐cm visual analogue scale between corticosteroids and sham injection and translates into a number needed to treat for an additional beneficial outcome (NNTB) of 8 (95% CI 6 to 13). An I2 statistic of 68% indicated considerable between‐trial heterogeneity. A visual inspection of the funnel plot suggested some asymmetry (asymmetry coefficient ‐1.21, 95%CI ‐3.58 to 1.17). When stratifying results according to length of follow‐up, benefits were moderate at 1 to 2 weeks after end of treatment (SMD ‐0.48, 95% CI ‐0.70 to ‐0.27), small to moderate at 4 to 6 weeks (SMD ‐0.41, 95% CI ‐0.61 to ‐0.21), small at 13 weeks (SMD ‐0.22, 95% CI ‐0.44 to 0.00), and no evidence of an effect at 26 weeks (SMD ‐0.07, 95% CI ‐0.25 to 0.11). An I2 statistic of ≥ 63% indicated a moderate to large degree of between‐trial heterogeneity up to 13 weeks after end of treatment (P for heterogeneity≤0.001), and an I2 of 0% indicated low heterogeneity at 26 weeks (P=0.43). There was evidence of lower treatment effects in trials that randomised on average at least 50 participants per group (P=0.05) or at least 100 participants per group (P=0.013), in trials that used concomittant viscosupplementation (P=0.08), and in trials that used concomitant joint lavage (P≤0.001).
Corticosteroids appeared to be more effective in function improvement than control interventions (SMD ‐0.33, 95% CI ‐0.56 to ‐0.09), which corresponds to a difference in functions scores of ‐0.7 units on standardised Western Ontario and McMaster Universities Arthritis Index (WOMAC) disability scale ranging from 0 to 10 and translates into a NNTB of 10 (95% CI 7 to 33). An I2 statistic of 69% indicated a moderate to large degree of between‐trial heterogeneity. A visual inspection of the funnel plot suggested asymmetry (asymmetry coefficient ‐4.07, 95% CI ‐8.08 to ‐0.05). When stratifying results according to length of follow‐up, benefits were small to moderate at 1 to 2 weeks after end of treatment (SMD ‐0.43, 95% CI ‐0.72 to ‐0.14), small to moderate at 4 to 6 weeks (SMD ‐0.36, 95% CI ‐0.63 to ‐0.09), and no evidence of an effect at 13 weeks (SMD ‐0.13, 95% CI ‐0.37 to 0.10) or at 26 weeks (SMD 0.06, 95% CI ‐0.16 to 0.28). An I2 statistic of ≥ 62% indicated a moderate to large degree of between‐trial heterogeneity up to 13 weeks after end of treatment (P for heterogeneity≤0.004), and an I2 of 0% indicated low heterogeneity at 26 weeks (P=0.52). We found evidence of lower treatment effects in trials that randomised on average at least 50 participants per group (P=0.023), in unpublished trials (P=0.023), in trials that used non‐intervention controls (P=0.031), and in trials that used concomitant viscosupplementation (P=0.06).
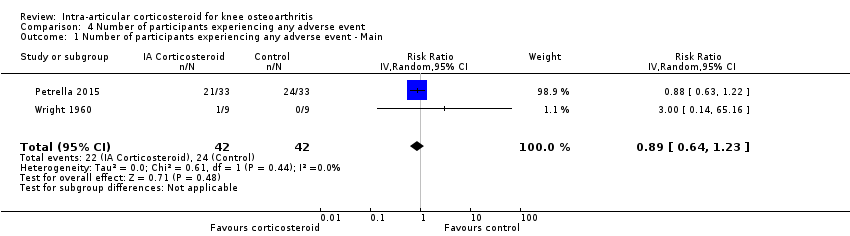
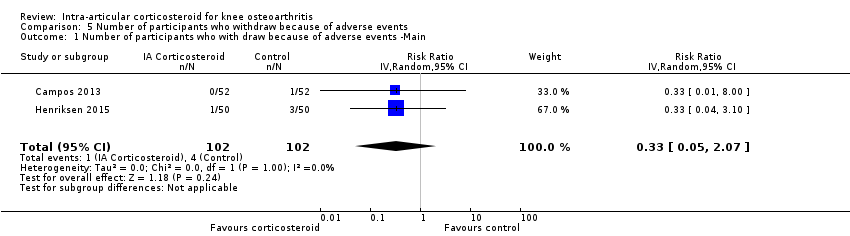
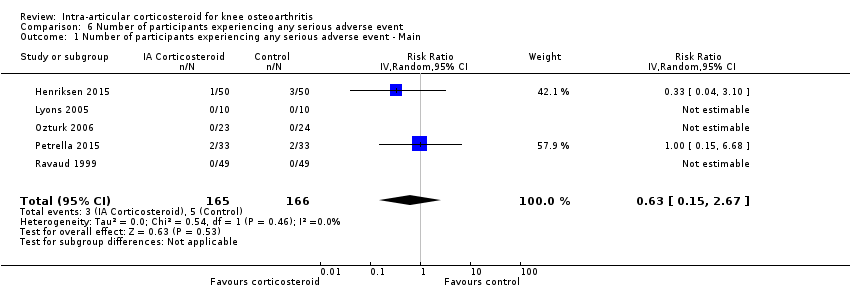
Participants on corticosteroids were 11% less likely to experience adverse events, but confidence intervals included the null effect (RR 0.89, 95% CI 0.64 to 1.23, I2=0%). Participants on corticosteroids were 67% less likely to withdraw because of adverse events, but confidence intervals were wide and included the null effect (RR 0.33, 95% CI 0.05 to 2.07, I2=0%). Participants on corticosteroids were 27% less likely to experience any serious adverse event, but confidence intervals were wide and included the null effect (RR 0.63, 95% CI 0.15 to 2.67, I2=0%).
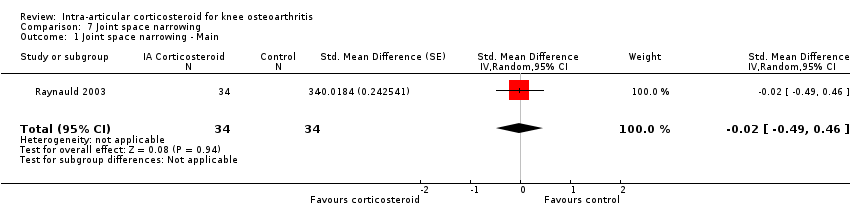
We found no evidence of an effect of corticosteroids on quality of life compared to control (SMD ‐0.01, 95% CI ‐0.30 to 0.28, I2=0%). There was also no evidence of an effect of corticosteroids on joint space narrowing compared to control interventions (SMD ‐0.02, 95% CI ‐0.49 to 0.46).
Authors' conclusions
Whether there are clinically important benefits of intra‐articular corticosteroids after one to six weeks remains unclear in view of the overall quality of the evidence, considerable heterogeneity between trials, and evidence of small‐study effects. A single trial included in this review described adequate measures to minimise biases and did not find any benefit of intra‐articular corticosteroids.
In this update of the systematic review and meta‐analysis, we found most of the identified trials that compared intra‐articular corticosteroids with sham or non‐intervention control small and hampered by low methodological quality. An analysis of multiple time points suggested that effects decrease over time, and our analysis provided no evidence that an effect remains six months after a corticosteroid injection.
PICO
எளியமொழிச் சுருக்கம்
முழங்கால் கீல்வாதத்திற்கான உள்‐மூட்டு கார்டிகோஸ்டீராய்டு ஊசி
திறனாய்வு கேள்வி
முழங்கால் கீல்வாதம் உள்ள மக்களில் உள்‐மூட்டு கார்டிகோஸ்டீராய்டுகளை (மூட்டிற்கு உள்ளே செலுத்தப்படும்), ஒரு போலி ஊசி அல்லது சிகிச்சையின்மையோடு ஒப்பிடுகையில், வலி, செயல்பாடு, வாழ்க்கைத் தரம், மற்றும் பாதுகாப்பு ஆகியவற்றின் மீதான விளைவுகள் பற்றிய ஆய்வுகளுக்கு 3 பிப்ரவரி 2015 வரையிலான இலக்கியத்தை நாங்கள் தேடினோம்.
பின்புலம்
கீல்மூட்டு வாதம் என்பது முழங்கால் போன்ற மூட்டுகளின் குருத்தெலும்பு பழுதடைவதோடு தொடர்புடையதாகும். மூட்டு அதன் குருத்தெலும்பை இழக்கும் போது, வழக்கத்திற்கு மாறாக எலும்பு வளர்வதன் மூலம் உடல் பதிலளிக்கிறது, இதனால், எலும்பானது உருவிழந்து, வலி, மற்றும் ஸ்திரமற்ற மூட்டிற்கு வழி வகுக்கும். இது, உடல் செயல்பாடு மற்றும் மூட்டின் பயன்பாட்டு திறனை பாதிக்கும்.
பொதுவாக, கீல்வாதம் என்பது வீக்கத்தின் மூலத்தைக் கொண்டது என்பதை விட சிதைவு என்று கருதப்படுகிறது என்றாலும், சில நேரங்களில், ஒரு வீக்க கூறு இருக்கக் கூடும். உள்‐மூட்டு கார்ட்டிக்கோஸ்டீராய்டுகள், முழங்கால் மூட்டு உள்ளே செலுத்தப்படும் ஆற்றல் மிக்க அழற்சி ‐நீக்கி செயலிகளாகும்.
ஆய்வு பண்புகள்
3 பிப்ரவரி 2015 வரை தொடர்புடைய அனைத்து ஆய்வுகளை தேடிய பிறகு, இரண்டு வாரங்கள் முதல் ஒரு ஆண்டு வரையிலான காலஅளவு மற்றும் மொத்தம் 1767 பங்கேற்பாளர்களைக் கொண்டிருந்த 27 சீரற்ற கட்டுப்பாட்டு சோதனைகளைக் நாங்கள் கண்டறிந்தோம்.
முக்கிய முடிவுகள்
வலி
• உள்‐ மூட்டு கார்ட்டிக்கோஸ்டீராய்டுகளை பெற்றவர்கள் 1 மாதம் கழித்து, அவர்களின் வலியை 0 (வலி இல்லை)‐10 (உச்சக்கட்ட வலி) என்ற ஒரு அளவுக்கோலில், 3 என்ற அளவில் முன்னேற்றமடைந்ததாக மதிப்பிட்டனர்.
• போலி மருந்து பெற்றவர்கள் 1 மாதம் கழித்து, அவர்களின் வலியை 0 (வலி இல்லை)‐10 (உச்சக்கட்ட வலி) என்ற ஒரு அளவுக்கோலில், 2 என்ற அளவில் முன்னேற்றமடைந்ததாக மதிப்பிட்டனர்.
இதனை வேறு விதமாக கூறலாம்:
• உள்‐ மூட்டு கார்ட்டிக்கோஸ்டீராய்டுகளை பெற்ற 100 பேரில் 44 பேர்சிகிச்சையினால் மாற்றத்தை உணர்ந்தனர் (44 %).
• போலிமருந்து பெற்ற 100 மக்களில் 31 பேர் சிகிச்சையினால் மாற்றத்தை உணர்ந்தனர் (31 %).
• போலி மருந்தை விட, 13 அதிகபேர் உள்‐ மூட்டு கார்டிகோஸ்டெராய்டுகளுக்கு சிகிச்சையினால் மாற்றத்தை உணர்ந்தனர் (13% வேறுபாடு).
ஆதாரத்தின் குறைந்த தரத்தினால், இந்த எண்கள் உண்மையான நன்மைகளை கணிசமான அளவில் அதிகமாக மதிப்பீடு செய்திருக்கலாம் என்பதை கருத்தில் கொள்ள வேண்டும்.
உடல் செயல்பாடு
• உள்‐ மூட்டு கார்ட்டிக்கோஸ்டீராய்டுகளை பெற்ற மக்கள் 1 மாதம் கழித்து அவர்களின் உடல் செயல்பாட்டை 0(இயலாமை இல்லை )‐10(உச்சக்கட்ட இயலாமை) என்ற ஒரு அளவுக்கோலில் , 2 என்ற அளவில் முன்னேற்றமடைந்ததாக மதிப்பிட்டனர்.
• போலி மருந்தை பெற்ற மக்கள் 1 மாதம் கழித்து, அவர்களின் உடல் செயல்பாட்டை 0 (இயலாமை இல்லை) ‐10(உச்சக்கட்ட இயலாமை) என்ற ஒரு அளவுக்கோலில், 1 என்ற அளவில் முன்னேற்றமடைந்ததாக மதிப்பிட்டனர்.
இதனை வேறு விதமாக கூறலாம் :
• உள்‐ மூட்டு கார்ட்டிக்கோஸ்டீராய்டுகளை பெற்ற 100 மக்களில் 36 பேர் சிகிச்சையினால் மாற்றத்தை உணர்ந்தனர் (36%).
• போலி மருந்து பெற்ற 100 மக்களில் 26 பேர் சிகிச்சையினால் மாற்றத்தை உணர்ந்தனர் (26 %).
• போலி மருந்தை விட, 10 அதிக மக்கள் உள்‐ மூட்டு கார்டிகோஸ்டெராய்டு சிகிச்சையினால் மாற்றத்தை உணர்ந்தனர் (10% வேறுபாடு).
ஆதாரத்தின் குறைந்த தரத்தினால், இந்த எண்கள் உண்மையான நன்மைகளை கணிசமான அளவில் அதிகமாக மதிப்பீடு செய்திருக்கலாம் என்பதை கருத்தில் கொள்ள வேண்டும்.
பக்க விளைவுகள்
• உள்‐ மூட்டு கார்ட்டிக்கோஸ்டீராய்டுகளை பெற்ற 100 மக்களில் 13 பேர் பக்க விளைவுகளை அனுபவித்தனர் (13 %).
• போலி மருந்து பெற்ற 100 மக்களில் 15 பேர் பக்க விளைவுகளை அனுபவித்தனர் (15%).
• உள்‐ மூட்டு கார்டிகோஸ்டெராய்டுகளை விட, போலி மருந்தை பெற்ற 2 அதிகமான பேர் பக்க விளைவுகளை அனுபவித்தனர் (2% வேறுபாடு).
பக்க விளைவுகள் காரணமாக விலகியவர்கள்
• உள்‐ மூட்டு கார்ட்டிக்கோஸ்டீராய்டுகளை பயன்படுத்திய 1000 மக்களில் 6 பேர் பக்க விளைவுகளால் ஆய்வை விட்டு விலகினர் (0.6%).
• போலி மருந்து பயன்படுத்திய 1000 மக்களில் 17 பேர் பக்க விளைவுகளால் ஆய்வை விட்டு விலகினர் (1.7%).
• உள்‐ மூட்டு கார்டிகோஸ்டெராய்டுகளை விட, போலி மருந்தினால் ஏற்பட்ட பக்க விளைவுகளால் 11 அதிகமான பேர் விலகினர்.(1.1% வேறுபாடு).
மருத்துவமனையில் அனுமதி, நிலையான இயலாமை அல்லது மரணம் ஆகியவற்றுக்கு வழி வகுத்த பக்க விளைவுகள்
உள்‐ மூட்டு கார்ட்டிக்கோஸ்டீராய்டுகளை பயன்படுத்திய 1000 மக்களில் 3 பேர் பக்க விளைவுகளால மருத்துவமனையில் இருத்தல் , நிலையான இயலாமை அல்லது மரணத்தை அனுபவித்தனர் (0.3%). போலி மருந்து பயன்படுத்திய 1000 மக்களில் 4 பேர் பக்க விளைவுகளால் மருத்துவமனையில் இருத்தல் , நிலையான இயலாமை அல்லது மரணத்தை அனுபவித்தனர்.(0.4%).உள்‐ மூட்டு கோர்டிகோஸ்டெராய்டுகளை விட, போலி மருந்து பெற்றவர்களில், 1 நபர் அதிகமாக பக்க விளைவுகளால் மருத்துவமனையில் இருத்தல் , நிலையான இயலாமை அல்லது மரணத்தை அனுபவித்தனர்.(0.1%வேறுபாடு).
ஆதாரத்தின் அடிப்படையில், உள்‐மூட்டு கார்ட்டிக்கோஸ்டீராய்டுகள், வலியில் ஒரு மிதமான முன்னேற்றத்தையும் மற்றும் உடல் செயல்பாட்டில் ஒரு சிறிய முன்னேற்றத்தயும் ஏற்படுத்தலாம், ஆனால் ஆதாரங்களின் தரம் குறைந்ததாகவும் மற்றும் முடிவுகள் முடிவற்றதுமாய் இருக்கிறது. உள்‐மூட்டு கார்டிகோஸ்டீராய்டுகள் ஒரு போலி மருந்தை போன்றே பல பக்க விளைவுகளை ஏற்படுத்துவதாக தோன்றுகிறது. எனினும், பக்க விளைவுகள் பற்றி துல்லியமான மற்றும் நம்பத் தகுந்த தகவல் நமக்கு இல்லை.
சான்றின் தரம்
எங்களின் எல்லா கண்டுபிடிப்புகளை குறைந்த தர ஆதாரமாகவே நாங்கள் மதிப்பிட்டோம் அதாவது இந்த முடிவுகளில் எங்களுக்கு சிறிதளவே நம்பிக்கை உள்ளது. ஏனெனில் பொதுவாக, முடிவுகள் ஆய்வுகளில் மிகவும் உடன்பாடற்று மற்றும் முக்கியமாக தரம் குறைந்த சிறிய ஆய்வுகளின் அடிப்படையில் இருந்தது.
Authors' conclusions
Summary of findings
| Intra‐articular corticosteroid compared with sham injection for osteoarthritis of the knee | ||||||
| Patient or population: participants with osteoarthritis of the knee Settings: various orthopaedic or rheumatology clinics Intervention: intra‐articular corticosteroid Comparison: sham injection | ||||||
| Outcomes | Illustrative comparative risks* (95% CI) | Relative effect | No of Participants | Quality of the evidence | Comments | |
| Assumed risk | Corresponding risk | |||||
| Sham injection | Intra‐articular corticosteroid | |||||
| Pain intensity Various pain scales. (median follow‐up: 12 weeks) | ‐1.8 cm change on 10‐cm VAS1 | ‐2.8 cm change 46% improvement | SMD ‐0.40 (‐0.58 to ‐0.22) Predictive interval (‐1.20 to 0.40) | 1749 (26) | ⊕⊕⊝⊝ | NNTB 8 (95% CI 6 to 13)4 |
| Function Various function scales. (median follow‐up: 12 weeks) | ‐1.2 units on WOMAC (range 0 to 10)1 | ‐1.9 units on WOMAC 34% improvement | SMD ‐0.33 (‐0.56 to ‐0.09) Predictive interval (‐1.19 to 0.54) | 1014 (15) | ⊕⊕⊝⊝ | NNTB 10 (95% CI 7 to 33)7 |
| Number of participants experiencing any adverse event (median follow‐up: 17 weeks) | 150 per 1000 participant‐years8 | 134 per 1000 participant‐years | RR 0.89 (0.64 to 1.23) | 84 (2) | ⊕⊕⊝⊝ | Little evidence of harmful effect (NNTB not statistically significant) |
| Number of participants who withdraw because of adverse events (median follow‐up: 25 weeks) | 17 per 1000 participant‐years8 | 6 per 1000 participant‐years | RR 0.33 (0.05 to 2.07) | 204 (2) | ⊕⊕⊝⊝ | Little evidence of harmful effect (NNTB not statistically significant) |
| Number of participants experiencing any serious adverse event (median follow‐up: 26 weeks) | 4 per 1000 participant‐years8 | 3 per 1000 participant‐years | RR 0.63 (0.15 to 2.67) | 331 (5) | ⊕⊕⊝⊝ | Little evidence of harmful effect (NNTB not statistically significant) |
| *The basis for the assumed risk (e.g. the median control group risk across studies) is provided in footnotes. The corresponding risk (and its 95% confidence interval) is based on the assumed risk in the comparison group and the relative effect of the intervention (and its 95% CI). | ||||||
| GRADE Working Group grades of evidence 1 Median reduction as observed across placebo groups in large osteoarthritis trials (see methods section, Nüesch 2009). 5 SMDs were back‐transformed onto a standardised Western Ontario and McMaster Universities Arthritis Index (WOMAC) disability score ranging from 0 to 10 on the basis of a typical pooled SD of 2.1 in trials that assessed function using WOMAC disability scores and expressed as change based on an assumed standardised reduction of 0.58 SD units in the control group. 9 Downgraded (2 levels) because: Most studies that reported this outcome are of high or unclear risk of bias, and statistical heterogeneity is large. 10 Downgraded (3 levels) because: 50% or more of the studies that reported this outcome are of high or unclear risk of bias, and the confidence interval of the pooled estimate is wide and includes the null effect. | ||||||
Background
Description of the condition
Knee osteoarthritis is a leading cause of chronic disability in the United States (Felson 2000;Felson 2000a). It results from a multitude of both local and systemic factors. Progression of the disease leads to cartilage degeneration and thinning of the joint surface with subsequent joint pain and stiffness (Brandt 1996).
Description of the intervention
Intra‐articular corticosteroid therapy has been used in knee osteoarthritis for over 50 years. The first clinical trial of intra‐articular corticosteroids in knee osteoarthritis was performed in 1958 by Miller and colleagues (Miller 1958). Corticosteroids are available in both crystalline and non‐crystalline forms. The crystalline triamcinolone and the non‐crystalline prednisolone and methylprednisolone are used most frequently. Although this review is restricted to osteoarthritis of the knee joint, intra‐articular corticosteroids have also been evaluated in osteoarthritis of various other joints (McColl 2000; Rozental 2000).
How the intervention might work
Although osteoarthritis is generally thought to be of degenerative rather than inflammatory origin, there is evidence that an inflammatory component may be present in at least some phases of the disease (Creamer 1997). Corticosteroids are known as potent anti‐inflammatory agents that act through a variety of mechanisms on different cellular levels.
Why it is important to do this review
The 2012 American College of Rheumatology (ACR) guidelines recommend the participation in exercise programs as well as weight loss (for overweight patients) as first‐line treatments for symptomatic knee osteoarthritis. There is no strong recommendation for any pharmacological treatment other than over‐the‐counter paracetamol or nonsteroidal anti‐inflammatory drugs. However, for people unresponsive to the basic treatment, there is a conditional, weak recommendation for the use of intra‐articular corticosteroids (Hochberg 2012). Despite the long‐standing use of intra‐articular corticosteroids, there is an ongoing debate about their effectiveness and safety. Concerns have been expressed that intra‐articular corticosteroids might mask the pain, enabling patients to prematurely mobilise and hereby promoting further destruction of the joint (Brandt 2001)
Objectives
To determine the benefits and harms of intra‐articular corticosteroids compared with sham or no intervention in people with knee osteoarthritis in terms of pain, physical function, quality of life, and safety.
Methods
Criteria for considering studies for this review
Types of studies
Randomised or quasi‐randomised controlled trials with a control group receiving sham or no intervention.
Types of participants
At least 75% of participants with clinically or radiologically confirmed osteoarthritis of the knee. We did not consider trials that included exclusively people with inflammatory arthritis, such as rheumatoid arthritis.
Types of interventions
The experimental intervention of interest is any type of intra‐articular corticosteroid. The control interventions of interest are sham intra‐articular corticosteroid and no intervention.
Types of outcome measures
Primary outcomes
The main outcomes were pain and function, as currently recommended for osteoarthritis trials (Altman 1996; Pham 2004), reported within four and six weeks after end of treatment. If data on more than one pain scale were provided for a trial, we referred to a previously described hierarchy of pain‐related outcomes (Jüni 2006; Reichenbach 2007), and extracted data on the pain scale that was highest on this list:
-
global pain;
-
pain on walking;
-
Western Ontario and McMaster Universities Arthritis Index (WOMAC) osteoarthritis index pain subscore;
-
composite pain scores other than WOMAC;
-
pain on activities other than walking;
-
rest pain or pain during the night;
-
WOMAC global algofunctional score;
-
Lequesne osteoarthritis index global score;
-
other algofunctional scale;
-
participant's global assessment;
-
physician's global assessment.
If data on more than one function scale were provided for a trial, we extracted data according to the hierarchy:
-
global disability score;
-
walking disability;
-
WOMAC disability subscore;
-
composite disability scores other than WOMAC;
-
disability other than walking;
-
WOMAC global scale;
-
Lequesne osteoarthritis index global score;
-
other algofunctional scale;
-
participant's global assessment;
-
physician's global assessment
Secondary outcomes
Secondary outcomes were pain and function assessed at 1 to 2, 4 to 6, 13, and 26 weeks after end of treatment, quality of life assessed at 1 to 2, 4 to 6, 13, and 26 weeks, and the following safety outcomes: joint space narrowing assessed at 1 to 2, 4 to 6, 13, and 26 weeks; the number of participants who experienced any adverse event; withdrew because of adverse events; and experienced any serious adverse events. We defined serious adverse events as events resulting in hospitalisation, prolongation of hospitalisation, persistent or significant disability, congenital abnormality or birth defect of offspring, life‐threatening events, or death.
Search methods for identification of studies
Electronic searches
Please see Bellamy 2006 for information on electronic searches applied in the previous version of this review. Here, we developed a new search strategy using the electronic databases the Cochrane Central Register of Controlled Trials (CENTRAL, Issue 1, 2015; mrw.interscience.wiley.com/cochrane/), MEDLINE, and EMBASE (Ovid SP platform). We did a top‐up search in PubMed to capture citations not yet indexed in MEDLINE. We used a combination of text words and controlled terms (MeSH or MeSH‐like terms), including truncated variations of preparation names and brand names combined with terms related to osteoarthritis. We applied a validated methodological filter for controlled clinical trials (Dickersin 1994; Lefebvre 2008). We have displayed the specific search algorithms in Appendix 1 and Appendix 2. We performed the searches from inception to 3 February 2015.
Searching other resources
We manually searched the proceedings of the European League Against Rheumatism at http://www.abstracts2view.com/eular/sessionindex.php, the American College of Rheumatology at http://acrannualmeeting.org/abstracts/abstract‐archives/ (we no longer have access to Osteoarthritis Research Society International); used Science Citation Index to retrieve reports citing relevant articles; contacted content experts and trialists; and screened reference lists of all obtained articles. We also retrieved and screened systematic reviews published since January 2004 that evaluated the effects and safety of corticosteroid injections for knee osteoarthritis (Abdulla 2013; Arroll 2004; Avouac 2010; Bannuru 2015; Bellamy 2006; Bjordal 2007; Cheng 2012; Garg 2014; Godwin 2004; Hepper 2009; Hirsch 2013; Maricar 2013). Finally, we searched the following clinical trial registries: ClinicalTrials.gov, metaRegister of Controlled Trials (http://www.controlled‐trials.com/), Australian New Zealand Clinical Trials Registry (http://www.anzctr.org.au/TrialSearch.aspx), and UMIN Clinical Trials Registry (http://www.umin.ac.jp/ctr)) to identify ongoing trials. We performed the last update of the search on 26 March 2015.
Data collection and analysis
We used a generic protocol with instructions for data extraction, quality assessment, and statistical analyses, which we also used in our previous Cochrane reviews (da Costa 2012; da Costa 2014; Reichenbach 2010; Rutjes 2009; Rutjes 2009a; Rutjes 2010).
Selection of studies
Please see Bellamy 2006 for information on the selection of studies in the original review. In this review update, two out of three review authors independently evaluated all titles and abstracts for eligibility (MGS, MdN and AR). We resolved disagreements by discussion. We applied no language restrictions. If multiple reports described the same trial, we considered all.
Data extraction and management
Please see Bellamy 2006 for information on data extraction and management in the original review. In this review update, two out of three review authors (BDC, RF, RH) extracted trial information independently and in duplicate using a standardised, piloted extraction form accompanied by a codebook. We resolved disagreements by discussion. We extracted characteristics of the experimental intervention (ultrasound‐guided injection, use of local anesthetic, crystalline preparation, and prednisolone equivalance), the type of control used, dosage, frequency, duration of treatment, participant characteristics, types of measures used and pain‐, function‐, and quality of life‐related outcomes, trial design, trial size, duration of follow‐up, type and source of financial support, and publication status. When necessary, we approximated means and measures of dispersion from figures in the reports. For cross‐over trials, we extracted data from the first period only. Whenever possible, we used results from an intention‐to‐treat analysis.
Assessment of risk of bias in included studies
Two out of three review authors (BDC, RF, RH) assessed randomisation, blinding, and adequacy of analyses independently and in duplicate (Jüni 2001). We resolved disagreements by consensus. We assessed two components of randomisation: generation of allocation sequences and concealment of allocation. We considered generation of sequences to be adequate if it resulted in an unpredictable allocation schedule; mechanisms considered adequate included random‐number tables, computer‐generated random numbers, minimisation, coin tossing, shuffling cards, and drawing lots. We considered trials using an unpredictable allocation sequence to be randomised and trials using potentially predictable allocation mechanisms, such as alternation or the allocation of participants according to date of birth to be quasi‐randomised. We considered concealment of allocation to be adequate if participants and investigators responsible for participant selection were unable to suspect before allocation which treatment was next. Methods considered adequate included central randomisation; pharmacy‐controlled randomisation using identical, pre‐numbered containers; and sequentially numbered, sealed, opaque envelopes. We considered blinding of participants to be adequate if a sham injection was used with a syringe that was identical in appearance to the control intervention, or an attempt was made to hide the participant's view of the injected knee by placing screens, for example. We considered blinding of therapists to be adequate if a credible blinding attempt was described, such as the use of independently prepared, opaque syringes. We considered analyses to be performed according to the intention‐to‐treat principle if all randomised participants were included in the analysis. We further assessed the reporting of primary outcomes, sample size calculations, and funding source. Finally, we used GRADE to describe the quality of the overall body of evidence (Guyatt 2008; Higgins 2011), defined as the extent of confidence into the estimates of treatment benefits and harms.
Measures of treatment effect
We summarised continuous outcomes using standardised mean differences (SMD) with 95% confidence intervals (CI), with the differences in mean change from baseline values across treatment groups divided by the pooled standard deviation (SD). If differences in mean change were unavailable, we used differences in mean values at the end of the treatment (da Costa 2013). If some of the required data were unavailable, we used approximations, as previously described (Reichenbach 2007). An SMD of ‐0.20 SD units can be considered a small difference between the experimental and control groups, an SMD of ‐0.50 a moderate difference, and ‐0.80 a large difference (Cohen 1988; Jüni 2006). SMDs can also be interpreted in terms of the percent of overlap of the experimental group's scores with scores of the control group. An SMD of ‐0.20 indicates an overlap in the distribution of pain or function scores in about 85% of cases, an SMD of ‐0.50 in about 67%, and an SMD of ‐0.80 in about 53% of cases (Cohen 1988; Jüni 2006). On the basis of a median pooled SD of 2.5 cm, found in large‐scale osteoarthritis trials that assessed pain using a 10‐cm visual analogue scale (VAS) (Nüesch 2009), SMDs of ‐0.20 correspond to approximate differences in pain scores between experimental and control groups of 0.5 cm on a 10‐cm VAS, ‐0.50 of 1.25 cm, and ‐0.80 of 2 cm. We back transformed SMDs for function to a standardised WOMAC disability score (Bellamy 1995), ranging from 0 to 10 on the basis of a median pooled SD of 2.1 units observed in large‐scale osteoarthritis trials (Nüesch 2009). We expressed binary outcomes as risk ratios (RR) with 95% CI.
Data synthesis
We used a standard inverse‐variance random‐effects meta‐analysis to combine the trials (DerSimonian 1986). We quantified heterogeneity between trials using the I2 statistic (Higgins 2003), which describes the percentage of variation across trials that is attributable to heterogeneity rather than to chance. I2 values of 25% may be interpreted as low, 50% as moderate, and 75% as high between‐trial heterogeneity (da Costa 2014a), although interpretation of I2 depends on the size and number of trials included (Rucker 2008). Each trial contributed once to our main effectiveness analyses with the effect estimate closer to our primary time point of interest at four to six weeks. We investigated the association between trial size and treatment effects in contour‐enhanced funnel plots (Peters 2008), plotting effect sizes on the vertical axis against their standard errors on the horizontal axis (Sterne 2001; Sterne 2011; Thompson 1999), accompanied by a regression test for asymmetry (Egger 1997). We then performed stratified analyses of the primary outcomes, pain and function, accompanied by interaction tests according to the following trial characteristics: concealment of allocation (adequate versus inadequate or unclear), blinding of participants (adequate versus inadequate or unclear), blinding of therapists (adequate versus inadequate or unclear), type of control (placebo versus no intervention), analysis in accordance with the intention‐to‐treat principle (yes versus no or unclear), trial size, funding (funding independent of industry versus industry or unclear source of funding), publication type (full journal article versus other type or unpublished material), ultrasound‐guidance of injections (yes versus no or unclear), use of local anaesthetic (yes versus no or unclear), use of crystalline preparation (yes versus no or unclear), prednisolone equivalence dose (≥ 50 mg versus < 50 mg), use of intra‐articular viscosupplementation as co‐intervention (yes versus no or unclear), and use of joint lavage as co‐intervention (yes versus no or unclear). We prespecified a cutoff of 100 allocated participants per trial arm to distinguish between small and large trials. A sample size of 2 x 100 participants will yield more than 80% power to detect a small to moderate SMD of ‐0.40 at a two‐sided P value of 0.05, which corresponds to a difference of 1 cm on a 10‐cm VAS between the experimental and control intervention (Nüesch 2010). Since only one large trial was available, we also used a less stringent cutoff of 50 participants per arm as previously described (Nüesch 2013). Two arms with 50 participants each will yield more than 80% power to detect a moderate to large SMD of ‐0.60. We calculated prednisolone equivalence doses, with prednisolone 10 mg considered equivalent to betametasone 1.6 mg, cortivazol 0.8 mg, dexamethasone 1.6 mg, hydrocortisone 40 mg, methylprednisolone 8 mg, and triamcinolone 8 mg. Interaction tests were based on z scores of the difference in effect sizes between strata divided by the corresponding standard error.
We converted SMDs of pain intensity and function to number needed to treat for an additional beneficial outcome on pain or function as compared with placebo (NNTB), and number needed to treat for an additional harmful outcome (NNTH) (da Costa 2012a). We defined treatment response as a 50% improvement in scores (Clegg 2006; Dworkin 2008; Dworkin 2009). With a median standardised pain intensity at baseline of 2.4 SD units, observed in large osteoarthritis trials (Nüesch 2009), this corresponds to a mean decrease in scores of 1.2 SD units. Based on the median standardised decrease in pain scores of 0.72 SD units (Nüesch 2009), we calculated that a median of 31% of participants in the placebo group would achieve an improvement of pain scores of 50% or more. We used this percentage as the control group response rate to calculate NNTBs for pain. Based on the median standardised WOMAC function score at baseline of 2.7 SD units and the median standardised decrease in function scores of 0.58 SD units (Nüesch 2009), 26% of participants in the placebo group would achieve a reduction in function of 50% or more. Again, we used this percentage as the control group response rate to calculate NNTBs for function. We used the median risks of 150 patients with adverse events per 1000 patient‐years, four patients with serious adverse events per 1000 patient‐years, and 17 dropouts due to adverse events per 1000 patient‐years as observed in placebo groups in large osteoarthritis trials to calculate NNTHs for safety outcomes (Nüesch 2009). All P values were two‐sided. We performed analyses using Review Manager 5.3 (RevMan 2014), and STATA version 14.0 (StataCorp, College Station, Texas).
Results
Description of studies
Results of the search
We identified 2324 potentially relevant references through our electronic searches and 20 additional references through other sources (Figure 1). We excluded 1769 references after screening titles and abstracts and retrieved 154 potentially relevant references for full‐text assessment. We included 33 reports on 27 RCTs in the review.
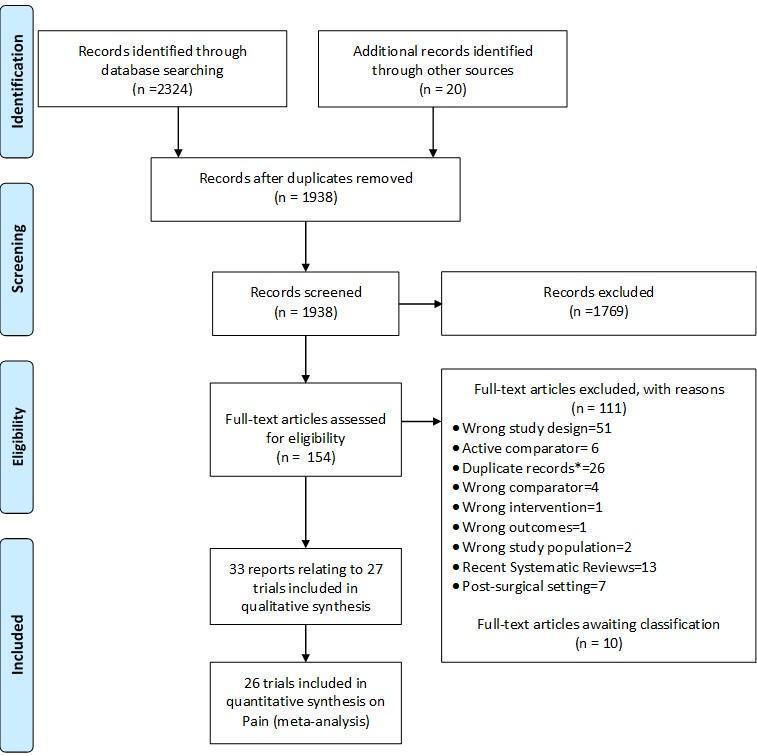
Study flow chart. *records with the exact same bibliographic information of another already‐screened record.
Included studies
Twenty‐six trials reported effectiveness data. We included all 26 trials in the analysis of pain outcomes, 15 trials in the analysis of function outcomes (Beyaz 2012; Campos 2013; Castro 2007; Chao 2010; Di Sante 2012; Gaffney 1995; Henriksen 2015; Lyons 2005; Petrella 2015; Popov 1989; Ravaud 1999; Raynauld 2003; Smith 2003; Yavuz 2012; Young 2001), and two trials in the analysis of quality‐of‐life outcomes (Gaffney 1995; Henriksen 2015). Of the 26 included trials, 19 compared corticosteroid injection to sham injection (Beyaz 2012; Cederlof 1966; Chao 2010; Dieppe 1980; Friedman 1980; Gaffney 1995; Henriksen 2015; Jones 1996; NCT00414427; Lyons 2005; Miller 1958; Popov 1989; Ravaud 1999; Raynauld 2003; Schue 2011; Smith 2003; Yavuz 2012; Young 2001; Zhilyayev 2012), and 7 compared corticosteroid injection to no treatment (Campos 2013; Castro 2007; Di Sante 2012; Frías 2004; Grecomoro 1992; Ozturk 2006; Petrella 2015).
Triamcinolone was used in 15 trials (Beyaz 2012; Campos 2013; Castro 2007; Chao 2010; Dieppe 1980; Frías 2004; Friedman 1980; Gaffney 1995; NCT00414427; Ozturk 2006; Petrella 2015; Popov 1989; Raynauld 2003; Yavuz 2012; Zhilyayev 2012), methylprednisolone in seven trials (Di Sante 2012; Henriksen 2015; Lyons 2005; Schue 2011; Smith 2003; Yavuz 2012; Young 2001), hydrocortisone in two trials (Miller 1958; Popov 1989), prednisolone in two trials (Cederlof 1966; Jones 1996), dexamethasonephosphate in one trial (Grecomoro 1992), betametazone disodium phosphate in one trial (Yavuz 2012), and cortivazol in one trial (Ravaud 1999). Four trials used viscosupplementation as a concomitant treatment (Campos 2013; Grecomoro 1992; Ozturk 2006; Petrella 2015), and four trials used lavage as a concomitant treatment (Castro 2007; Frías 2004; Ravaud 1999; Smith 2003). Two trials used ultrasound to assure intra‐articular delivery of corticosteroid preparation (Di Sante 2012; Henriksen 2015). The median prednisolone equivalence dose across all trials was 50 mg, and the median number of corticosteroid injections was one. Trials randomised a median of 76 participants (range 16 to 205 participants).
One additional trial investigating hydrocortisone only reported safety data, on number of participants experiencing any adverse event (Wright 1960).
Excluded studies
The Characteristics of excluded studies table displays the reasons for excluding trials in this systematic review. Typical reasons were wrong study design, use of active control interventions, more than 25% of participants with rheumatoid arthritis in the sample, or the use of cross‐over designs without providing sufficient information on the first phase.
Risk of bias in included studies
Figure 2 summarises the methodological characteristics and sources of funding of included trials. Two trials (7%) reported both adequate sequence generation and adequate allocation concealment (Henriksen 2015; Smith 2003), and six trials reported only adequate sequence generation (Campos 2013; Cederlof 1966; Di Sante 2012; Ozturk 2006; Petrella 2015; Raynauld 2003). In the remaining 18 trials, low quality of reporting hampered any judgement regarding sequence generation and concealment of allocation. Six trials reported the use of indistinguishable interventions to blind participants, and three trials reported the use of indistinguishable interventions to blind therapists. Nine and five trials conducted analysis of pain and function outcomes according to the intention‐to‐treat principle, respectively. Eleven trials received financial support from a nonprofit organisation, and no trial was explicitly supported by a commercial organisation. Twenty‐three trials used parallel‐group randomisation, and two were cross‐over trials (Dieppe 1980; Jones 1996).
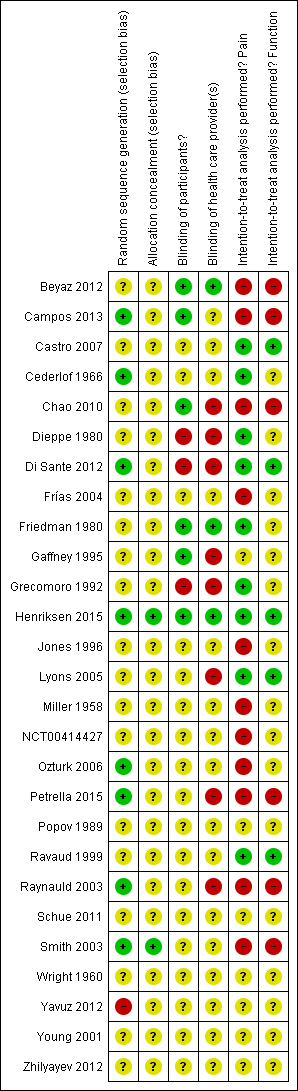
Risk of bias summary: review authors' judgements about each risk of bias item for each included study.
For the effectiveness outcomes pain and function, we classified the quality of the evidence as low in view of the high risk of bias in the included trials and the high heterogeneity between trials (summary of findings Table for the main comparison) (Guyatt 2008).
For adverse event, dropouts due to adverse events, and serious adverse event outcomes, we classified the quality of the evidence as low because of the small number of trials reporting the outcomes and the small number of overall events, which resulted in imprecise estimates, and because we considered 50% or more of these trials to be at high risk of bias (summary of findings Table for the main comparison) (Guyatt 2008).
Effects of interventions
See: Summary of findings for the main comparison
Primary outcomes
Knee pain
Figure 3 presents results of the overall analysis of knee pain reported closest to four to six weeks after end of treatment. Corticosteroids were more effective in pain reduction than control interventions (SMD ‐0.40, 95% CI ‐0.58 to ‐0.22), which corresponds to a difference in pain scores of 1.0 cm on a 10‐cm VAS between corticosteroids and sham injection. This corresponds to a difference in improvement of 17% (95% CI 10% to 25%) between corticosteroids and sham injection (summary of findings Table for the main comparison), which translates into a NNTB to cause one additional treatment response on pain of 8 (95% CI 6 to 13) (summary of findings Table for the main comparison). An I2 statistic of 68% indicated a moderate to large degree of between‐trial heterogeneity (P for heterogeneity < 0.001). A visual inspection of the funnel plot suggested some asymmetry (asymmetry coefficient ‐1.21, 95% CI ‐3.58 to 1.17), but the corresponding regression test for asymmetry indicated no evidence for asymmetry (P = 0.30) (Figure 4).

Forest plot of comparison: 1 Pain, outcome: 1.1 Pain ‐ Main.

Contour‐enhanced funnel plot for effects on knee pain. Numbers on x axis refer to standardised mean differences (SMDs), on y axis to standard errors of SMDs
Figure 5 presents results stratified according to length of follow‐up. Benefits were moderate at 1 to 2 weeks after end of treatment (SMD ‐0.48, 95% CI ‐0.70 to ‐0.27), small to moderate at 4 to 6 weeks (SMD ‐0.41, 95% CI ‐0.61 to ‐0.21), small at 13 weeks (SMD ‐0.22, 95% CI ‐0.44 to 0.00), and no effect at 26 weeks (SMD ‐0.07, 95% CI ‐0.25 to 0.11). An I2 statistic of ≥ 63% indicated a moderate to large degree of between‐trial heterogeneity up to 13 weeks after end of treatment (P for heterogeneity ≤ 0.001), and an I2 of 0% indicated low heterogeneity at 26 weeks (P = 0.43).
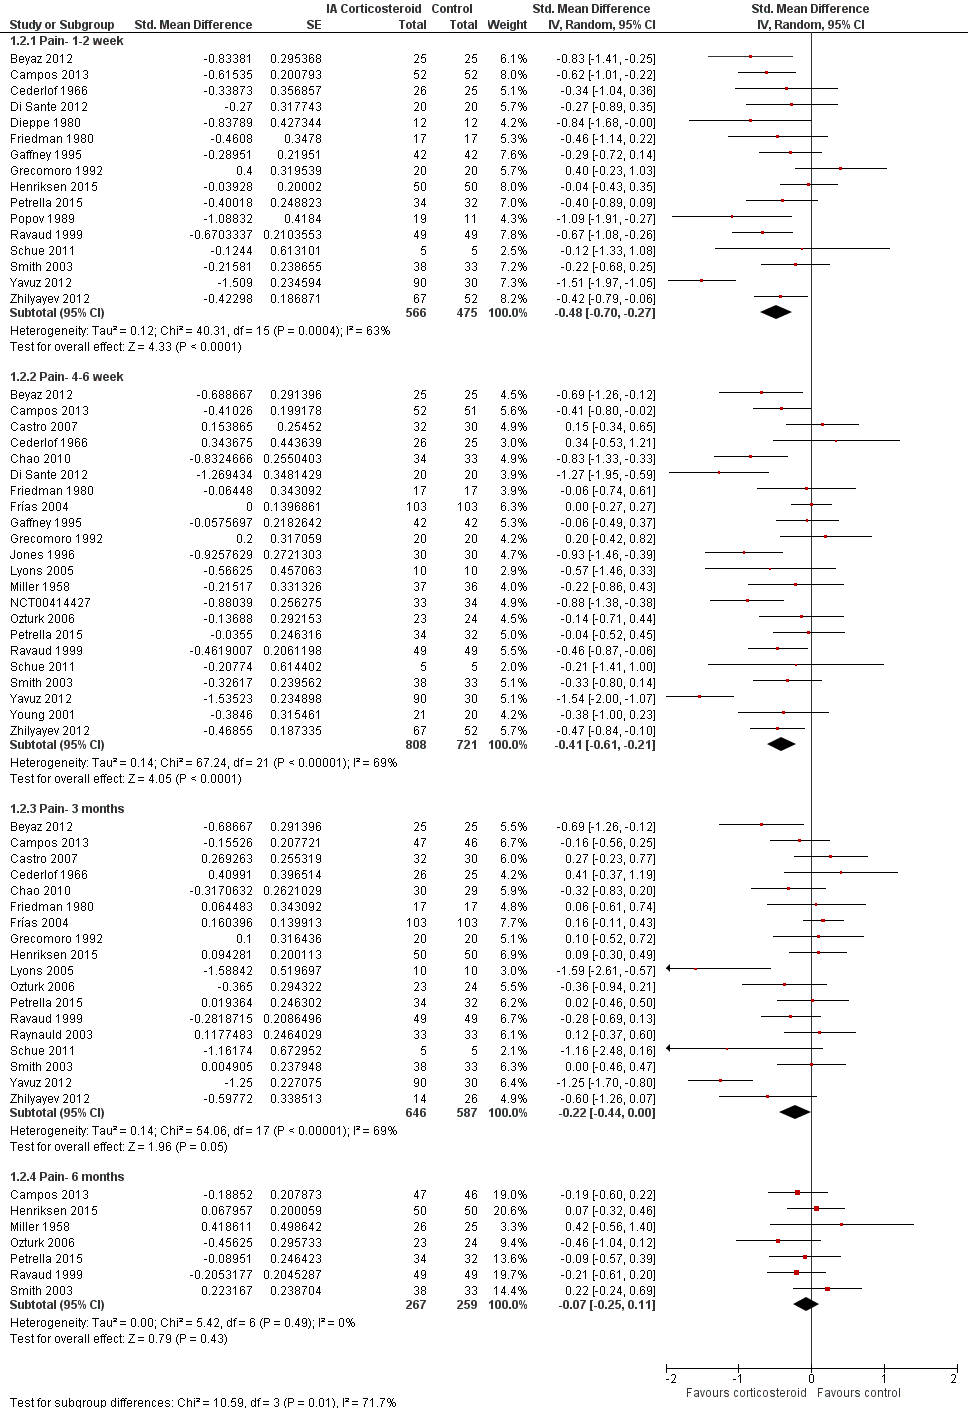
Forest plot of comparison: 1 Pain, outcome: 1.2 Pain ‐ Time points. P for trend = 0.001
Table 1 presents the results of stratified analyses. We found little or no evidence for an association of SMDs with corticosteroid dosages, ultrasound guidance, local anesthetic, crystalline preparation, type of control intervention, financial support, publication type, concealment of allocation, adequate blinding of participants or therapists, or intention‐to‐treat analysis (P ≥ 0.10). There was some evidence of lower treatment effects in trials that randomised on average at least 50 participants per group (P = 0.05), or in trials that used viscosupplementation as a co‐intervention (P = 0.08). There was strong evidence of lower treatment effects in trials that randomised on average at least 100 participants per group (P = 0.013), or in trials that used joint lavage as a co‐intervention (P ≤ 0.001).
| Variable | Number of studies | N of participants corticosteroids | N of participants control | Pain intensity SMD (95% CI) | Heterogeneity I2 (%) | P value* |
| All trials | 26 | 922 | 827 | ‐0.40 (‐0.58 to ‐0.22) | 68% | |
| Allocation concealment | 0.15 | |||||
| Adequate | 2 | 88 | 83 | ‐0.16 (‐0.46 to 0.14) | 0% | |
| Inadequate or unclear | 24 | 834 | 744 | ‐0.42 (‐0.62 to ‐0.22) | 69% | |
| Blinding of participants | 0.64 | |||||
| Adequate | 6 | 220 | 218 | ‐0.34 (‐0.61 to ‐0.06) | 49% | |
| Inadequate or unclear | 20 | 702 | 609 | ‐0.42 (‐0.65 to ‐0.19) | 72% | |
| Blinding of therapists | 0.45 | |||||
| Adequate | 3 | 92 | 92 | ‐0.24 (‐0.66 to 0.17) | 44% | |
| Inadequate or unclear | 23 | 830 | 735 | ‐0.42 (‐0.62 to ‐0.22) | 70% | |
| Intention‐to‐treat analysis | 0.29 | |||||
| Yes | 9 | 236 | 233 | ‐0.26 (‐0.57 to 0.06) | 59% | |
| No or unclear | 17 | 686 | 594 | ‐0.47 (‐0.69 to ‐0.24) | 71% | |
| Type of control intervention | 0.08 | |||||
| Sham injection | 19 | 614 | 526 | ‐0.50 (‐0.72 to ‐0.28) | 65% | |
| No intervention | 7 | 284 | 280 | ‐0.18 (‐0.47 to 0.11) | 63% | |
| Funding independent of industry | 0.80 | |||||
| Yes | 11 | 341 | 333 | ‐0.37 (‐0.55 to ‐0.18) | 26% | |
| No or unclear | 15 | 581 | 494 | ‐0.41 (‐0.70 to ‐0.12) | 78% | |
| Trial size | 0.05 | |||||
| ≥ 50 per trial group | 3 | 205 | 204 | ‐0.13 (‐0.37 to 0.12) | 34% | |
| < 50 per trial group | 23 | 717 | 623 | ‐0.44 (‐0.65 to ‐0.24) | 67% | |
| Trial size | 0.013 | |||||
| ≥ 100 per trial group | 1 | 103 | 103 | 0.00 (‐0.27 to 0.27) | N/A | |
| < 100 per trial group | 25 | 819 | 724 | ‐0.42 (‐0.61 to ‐0.23) | 66% | |
| Publication type | 0.93 | |||||
| Full journal article | 22 | 785 | 706 | ‐0.40 (‐0.61 to ‐0.20) | 70% | |
| Other type or unpublished material | 4 | 137 | 121 | ‐0.38 (‐0.84 to ‐0.08) | 65% | |
| Ultrasound guidance of injections | 0.71 | |||||
| Yes | 2 | 70 | 70 | ‐0.62 (‐1.83 to 0.58) | 89% | |
| No or unclear | 24 | 852 | 757 | ‐0.39 (‐0.57 to ‐0.20) | 67% | |
| Use of local anaesthetic | 0.41 | |||||
| Yes | 5 | 172 | 157 | ‐0.55 (‐0.93 to ‐0.16) | 62% | |
| No or unclear | 21 | 750 | 670 | ‐0.36 (‐0.57 to ‐0.15) | 70% | |
| Concomitant viscosupplementation | 0.08 | |||||
| Yes | 4 | 129 | 127 | ‐0.16 (‐0.42 to 0.09) | 4% | |
| No or unclear | 22 | 793 | 700 | ‐0.46 (‐0.67 to ‐0.25) | 71% | |
| Concomitant joint lavage | ≤ 0.001 | |||||
| Yes | 4 | 197 | 187 | ‐0.06 (‐0.26 to 0.15) | 0% | |
| No or unclear | 26 | 725 | 640 | ‐0.57 (‐0.78 to ‐0.35) | 72% | |
| Use of crystalline preparation | 0.82 | |||||
| Yes | 18 | 623 | 562 | ‐0.47 (‐0.69 to ‐0.24) | 72% | |
| No or unclear | 12 | 299 | 265 | ‐0.52 (‐0.90 to ‐0.14) | 76% | |
| Prednisolone equivalence dose | 0.53 | |||||
| ≥ 50 mg | 17 | 520 | 470 | ‐0.55 (‐0.85 to ‐0.25) | 80% | |
| < 50 mg | 13 | 402 | 357 | ‐0.43 (‐0.66 to ‐0.20) | 56% | |
Number of randomised comparisons are shown in "number of studies" for stratified analyses according to use of lavage as co‐intervention, crystalline preparation, prednisolone equivalence. *P value for interaction. N/A: not available.
CI: confidence interval
SMD: standardised mean difference
Knee function
Figure 6 presents results of the overall analysis of knee function reported closest to four to six weeks after end of treatment. Corticosteroids were more effective in function improvement than control interventions (SMD ‐0.33, 95% CI ‐0.56 to ‐0.09), which corresponds to a difference in functions scores of ‐0.7 units on standardised WOMAC disability scale ranging from 0 to 10. This corresponds to a difference in improvement of 13% (95% CI 4% to 22%) between corticosteroids and sham injection (summary of findings Table for the main comparison), which translates into a NNTB to cause one additional treatment response on function of 10 (95% CI 7 to 33) (summary of findings Table for the main comparison). An I2 statistic of 69% indicated a moderate to large degree of between‐trial heterogeneity (P for heterogeneity < 0.001). A visual inspection of the funnel plot suggested asymmetry (asymmetry coefficient ‐4.07, 95% CI ‐8.08 to ‐0.05), and the test for asymmetry showed evidence for asymmetry (P = 0.047) (Figure 7).
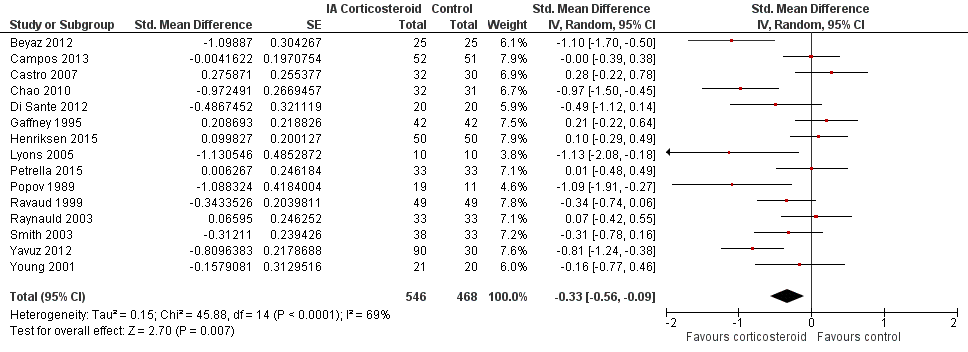
Forest plot of comparison: 2 Function, outcome: 2.1 Function ‐ Main.

Contour‐enhanced funnel plot for effects on knee function. Numbers on x axis refer to standardised mean differences (SMDs), on y axis to standard errors of SMDs
Figure 8 presents results stratified according to length of follow‐up. Benefits were small to moderate at 1 to 2 weeks after end of treatment (SMD ‐0.43, 95% CI ‐0.72 to ‐0.14), small at 4 to 6 weeks (SMD ‐0.36, 95% CI ‐0.63 to ‐0.09), no effect at 13 weeks (SMD ‐0.13, 95% CI ‐0.37 to 0.10), and no effect at 26 weeks (SMD 0.06, 95% CI ‐0.16 to 0.28). An I2 statistic of ≥ 62% indicated a moderate to large degree of between‐trial heterogeneity up to 13 weeks after end of treatment (P for heterogeneity ≤ 0.004), and an I2 of 0% indicated low heterogeneity at 26 weeks (P = 0.52).

Forest plot of comparison: 2 Function, outcome: 2.2 Function ‐ Time points. P for trend = 0.011
Table 2 presents the results of stratified analyses. We found little or no evidence for an association of SMDs with corticosteroid dosages, ultrasound guidance, local anaesthetic, crystalline preparation, joint lavage as a co‐intervention, financial support, concealment of allocation, adequate blinding of participants or therapists, or intention‐to‐treat analysis (P ≥ 0.10). There was some evidence of lower treatment effects in trials that randomised on average at least 50 participants per group (P = 0.023), in unpublished trials (P = 0.023), in trials that used no intervention as control (P = 0.031), or in trials that used intra‐articular viscosupplementation as a co‐intervention (P = 0.06).
| Variable | Number of studies | N of participants corticosteroids | N of participants control | Function SMD (95% CI) | Heterogeneity I2 (%) | P value* |
| All trials | 15 | 546 | 468 | ‐0.33 (‐0.56 to ‐0.09) | 69% | |
| Allocation concealment | 0.25 | |||||
| Adequate | 2 | 88 | 83 | ‐0.09 (‐0.49 to 0.32) | 43% | |
| Inadequate or unclear | 13 | 458 | 385 | ‐0.37 (‐0.64 to ‐0.10) | 72% | |
| Blinding of participants | 0.97 | |||||
| Adequate | 5 | 201 | 199 | ‐0.32 (‐0.82 to 0.18) | 83% | |
| Inadequate or unclear | 10 | 345 | 269 | ‐0.33 (‐0.59 to ‐0.07) | 58% | |
| Blinding of therapists | 0.78 | |||||
| Adequate | 2 | 75 | 75 | ‐0.48 (‐1.65 to 0.70) | 91% | |
| Inadequate or unclear | 13 | 471 | 393 | ‐0.31 (‐0.55 to ‐0.06) | 66% | |
| Intention‐to‐treat analysis | 0.49 | |||||
| Yes | 5 | 161 | 159 | ‐0.21 (‐0.59 to 0.17) | 62% | |
| No or unclear | 10 | 385 | 309 | ‐0.38 (‐0.69 to ‐0.07) | 73% | |
| Type of control intervention | 0.031 | |||||
| Sham injection | 11 | 409 | 334 | ‐0.45 (‐0.74 to ‐0.15) | 73% | |
| No intervention | 4 | 137 | 134 | ‐0.01 (‐0.27 to 0.25) | 13% | |
| Funding independent of industry | 0.73 | |||||
| Yes | 9 | 310 | 302 | ‐0.36 (‐0.66 to ‐0.07) | 68% | |
| No or unclear | 6 | 236 | 166 | ‐0.27 (‐0.71 to 0.16) | 76% | |
| Trial size | 0.023 | |||||
| ≥ 50 per trial group | 2 | 102 | 101 | 0.05 (‐0.23 to 0.32) | 0% | |
| < 50 per trial group | 13 | 444 | 367 | ‐0.40 (‐0.67 to ‐0.13) | 70% | |
| Trial size | N/A | |||||
| ≥ 100 per trial group | 0 | 0 | 0 | N/A | N/A | |
| < 100 per trial group | 15 | 546 | 468 | ‐0.33 (‐0.56 to ‐0.09) | 69% | |
| Publication type | 0.023 | |||||
| Full journal article | 14 | 514 | 438 | ‐0.37 (‐0.61 to ‐0.13) | 68% | |
| Other type or unpublished material | 1 | 32 | 30 | 0.28 (‐0.22 to 0.78) | N/A | |
| Ultrasound guidance of injections | 0.49 | |||||
| Yes | 2 | 70 | 70 | ‐0.14 (‐0.70 to 0.43) | 58% | |
| No or unclear | 13 | 476 | 398 | ‐0.36 (‐0.62 to ‐0.09) | 71% | |
| Use of local anaesthetic | 0.34 | |||||
| Yes | 4 | 105 | 105 | ‐0.60 (‐1.25 to 0.05) | 78% | |
| No or unclear | 11 | 441 | 363 | ‐0.25 (‐0.51 to 0.00) | 68% | |
| Concomitant viscosupplementation | 0.06 | |||||
| Yes | 2 | 85 | 84 | ‐0.00 (‐0.30 to 0.30) | 0% | |
| No or unclear | 13 | 461 | 384 | ‐0.39 (‐0.66 to ‐0.12) | 72% | |
| Concomitant joint lavage | 0.18 | |||||
| Yes | 3 | 94 | 84 | ‐0.13 (‐0.55 to 0.28) | 48% | |
| No or unclear | 16 | 452 | 384 | ‐0.46 (‐0.71 to ‐0.21) | 70% | |
| Use of crystalline preparation | 0.66 | |||||
| Yes | 12 | 365 | 319 | ‐0.37 (‐0.66 to ‐0.08) | 73% | |
| No or unclear | 7 | 181 | 149 | ‐0.47 (‐0.83 to ‐0.11) | 61% | |
| Prednisolone equivalence dose | 0.16 | |||||
| ≥ 50 mg | 12 | 328 | 277 | ‐0.52 (‐0.83 to ‐0.20) | 74% | |
| < 50 mg | 7 | 218 | 191 | ‐0.22 (‐0.48 to 0.05) | 47% | |
Number of randomised comparisons are shown in "number of studies" for stratified analyses according to use of lavage as co‐intervention, crystalline preparation, prednisolone equivalence. *P value for interaction. N/A: not available.
CI: confidence interval
SMD: standardised mean difference
Secondary outcomes
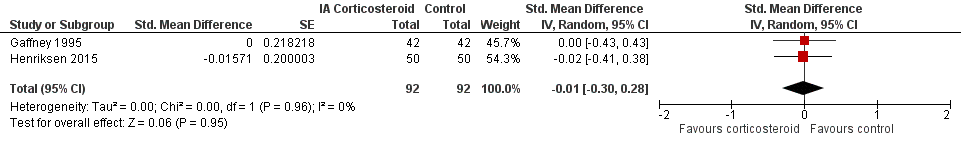
Figure 9 presents results of the overall analysis on quality of life reported closest to four to six weeks after end of treatment. Corticosteroids had no effect on quality of life compared to control interventions (SMD ‐0.01, 95% CI ‐0.30 to 0.28). An I2 statistic of 0% indicated a low degree of between‐trial heterogeneity (P for heterogeneity = 0.96). Figure 10 presents results of the overall analysis on joint space narrowing reported closest to four to six weeks after end of treatment. Corticosteroids had no effect in joint space narowing compared to control interventions (SMD ‐0.02, 95% CI ‐0.49 to 0.46). An I2 statistic was not estimable because only one trial was included in this analysis. There was not enough data to report results according to the pre‐specified time points neither for quality of life nor joint space narrowing outcomes.

Forest plot of comparison: 3 Quality of life, outcome: 3.1 Quality of life ‐ Main.
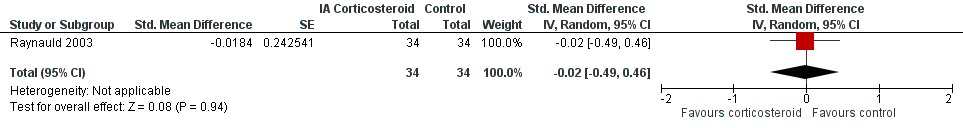
Forest plot of comparison: 7 Joint space narrowing, outcome: 7.1 Joint space narrowing ‐ Main.
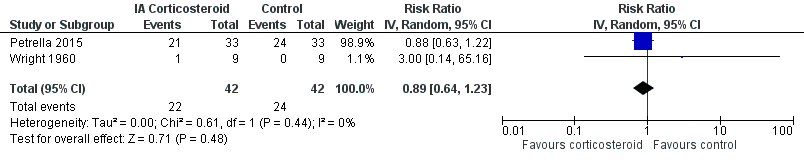
Figure 11 presents results of the overall analysis on number of participants experiencing any type of adverse event. We included 2 trials with a total of 84 participants and 46 events in this analysis. Participants on corticosteroids were 11% less likely to experience adverse events, but confidence intervals included the null effect (RR 0.89, 95% CI 0.64 to 1.23). An I2 statistic of 0% indicated a low degree of between‐trial heterogeneity (P for heterogeneity = 0.44). Due to the imprecision in results, we were not able to calculate meaningful NNTHs.
Forest plot of comparison: 4 Number of participants experiencing any adverse event, outcome: 4.1 Number of participants experiencing any adverse event ‐ Main.
Figure 12 presents results of the overall analysis on number of participants who withdraw because of adverse events. We included 2 trials with a total of 204 participants and 5 events in this analysis. Participants on corticosteroids were 67% less likely to withdraw because of adverse events, but confidence intervals were wide and included the null effect (RR 0.33, 95% CI 0.05 to 2.07). An I2 statistic of 0% indicated a low degree of between‐trial heterogeneity (P for heterogeneity = 1.00). Due to the imprecision in results, we were not able to calculate meaningful NNTHs.

Forest plot of comparison: 5 Number of participants who withdraw because of adverse events, outcome: 5.1 Number of participants who withdraw because of adverse events ‐Main.
Figure 13 presents results of the overall analysis on number of participants experiencing serious adverse events. We included 5 trials with a total of 331 participants and 8 events in this analysis. Participants on corticosteroids were 27% less likely to withdraw because of adverse events, but confidence intervals were wide and included the null effect (RR 0.63, 95% CI 0.15 to 2.67). An I2 statistic of 0% indicated a low degree of between‐trial heterogeneity (P for heterogeneity = 0.46). Due to the imprecision in results, we were not able to calculate meaningful NNTHs.

Forest plot of comparison: 6 Number of participants experiencing any serious adverse event, outcome: 6.1 Number of participants experiencing any serious adverse event ‐ Main.
Quality of the evidence (GRADE)
We graded the quality of the evidence as 'low' for all outcomes because treatment effect estimates were inconsistent with great variation across trials, pooled estimates were imprecise and did not rule out relevant or irrelevant clinical effects, and because most trials had a high or unclear risk of bias.
Discussion
Summary of main results
In this update of the systematic review and meta‐analysis by Bellamy (Bellamy 2006), we found most of the identified trials that compared intra‐articular corticosteroids with sham or non‐intervention control to be small and hampered by low methodological quality, and graded the quality of evidence for the major outcomes as 'low'. Only one trial was considered large according to our prespecified criteria (Frías 2004), with an average sample size of 100 participants or more per group, but this trial did not report adequate randomisation, participant blinding, or an intention‐to‐treat analysis. Conversely, only one trial reported adequate randomisation, participant blinding, and an intention‐to‐treat analysis (Henriksen 2015), but it was of moderate size only. An analysis of multiple time points suggested that effects decrease over time (P ≤ 0.011), and our analysis provides no evidence that an effect remains six months after a corticosteroid injection. Whether there are clinically important benefits after one to six weeks remains unclear in view of the overall quality of the evidence. A single trial included in this review described adequate measures to consistently minimise biases (Henriksen 2015); this trial did not find any benefit of intra‐articular corticosteroids (SMD 0.04, 95% CI ‐0.43 to 0.35).
Quality of the evidence
The overall analyses of pain and function were difficult to interpret in view of the large extent of heterogeneity between trials. Stratified analyses suggested an association of estimates of treatment effects with sample size (P ≤ 0.05), and funnel plots appeared asymmetrical, even though the accompanying asymmetry test was positive only for function (P = 0.047). Stratified analyses according to components of methodological quality showed negative interaction tests. Conversely, trials with protocol‐mandated concomitant lavage or viscosupplementation treatment in both experimental and control groups appeared to show smaller benefits of corticosteroids as compared with control.
The largest trial used joint lavage as concomitant treatment in all participants (Frías 2004). It therefore ultimately remains unclear whether the lack of treatment effect in this trial is a function of study size in the presence of small‐study effects (Nüesch 2010), or a function of the concomitant use of joint lavage, which may act as an effect modifier even in the absence of a specific therapeutic effect (Reichenbach 2010). However, among the three largest trials, which included at least 50 participants per group, only one used lavage (Frías 2004), another used viscosupplementation as concomitant treatment (Campos 2013), and the third used neither (Henriksen 2015). When pooling these moderate‐to‐large trials, we found only a small, clinically irrelevant, and statistically non‐significant effect on pain and function with a low degree of heterogeneity.
For other clinical characteristics including the use of ultrasound to guide injections, crystalline preparations, and prednisone equivalent doses, we did not find a treatment by subgroup interaction. Only two trials used ultrasound guidance to ensure proper placement of needles (Di Sante 2012, Henriksen 2015), however contradictory results and insufficient data are available to determine whether ultrasound guidance is associated with larger treatment effects.
Potential biases in the review process
We based our review on an extensive literature search, and so it seems unlikely that we missed relevant trials, provided that they were published as full‐text articles or accessible in conference proceedings or trial registries (Egger 2003). Two review authors independently performed selection of trials and data extraction in order to reduce bias and transcription errors (Egger 2001; Gøtzsche 2007). We are therefore confident that potential biases during the review process were minimised.
Agreements and disagreements with other studies or reviews
Our update of the previous systematic review and meta‐analysis by Bellamy identified 14 new trials that compared intra‐articular corticosteroids with sham or non‐intervention control (Bellamy 2006). In view of the overall body of evidence, we are as confident as Bellamy et al that no effect of intra‐articular corticosteroids remains after six months, but are less confident than Bellamy that there is a clinically relevant short‐term effect in view of large heterogeneity and possible small‐study effects.
The most recent systematic review and network meta‐analysis on intra‐articular corticosteroids in knee osteoarthritis (Bannuru 2015), carried out in August 2014, identified seven trials comparing intra‐articular corticosteroids to intra‐articular placebo, all of which we included in our analysis. Again, we are less confident than these authors that there is a clinically relevant short‐term effect of intra‐articular corticosteroids considering the issues described above.

Study flow chart. *records with the exact same bibliographic information of another already‐screened record.

Risk of bias summary: review authors' judgements about each risk of bias item for each included study.
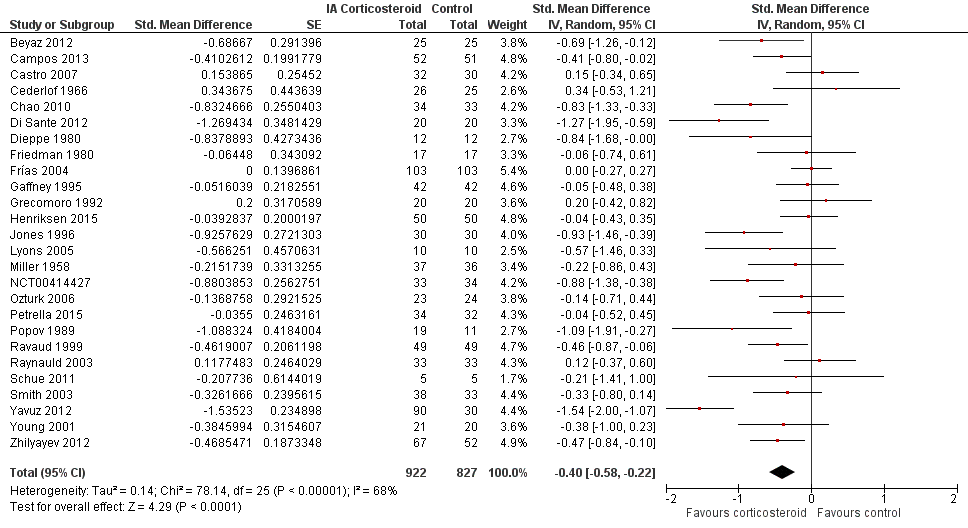
Forest plot of comparison: 1 Pain, outcome: 1.1 Pain ‐ Main.

Contour‐enhanced funnel plot for effects on knee pain. Numbers on x axis refer to standardised mean differences (SMDs), on y axis to standard errors of SMDs

Forest plot of comparison: 1 Pain, outcome: 1.2 Pain ‐ Time points. P for trend = 0.001

Forest plot of comparison: 2 Function, outcome: 2.1 Function ‐ Main.

Contour‐enhanced funnel plot for effects on knee function. Numbers on x axis refer to standardised mean differences (SMDs), on y axis to standard errors of SMDs
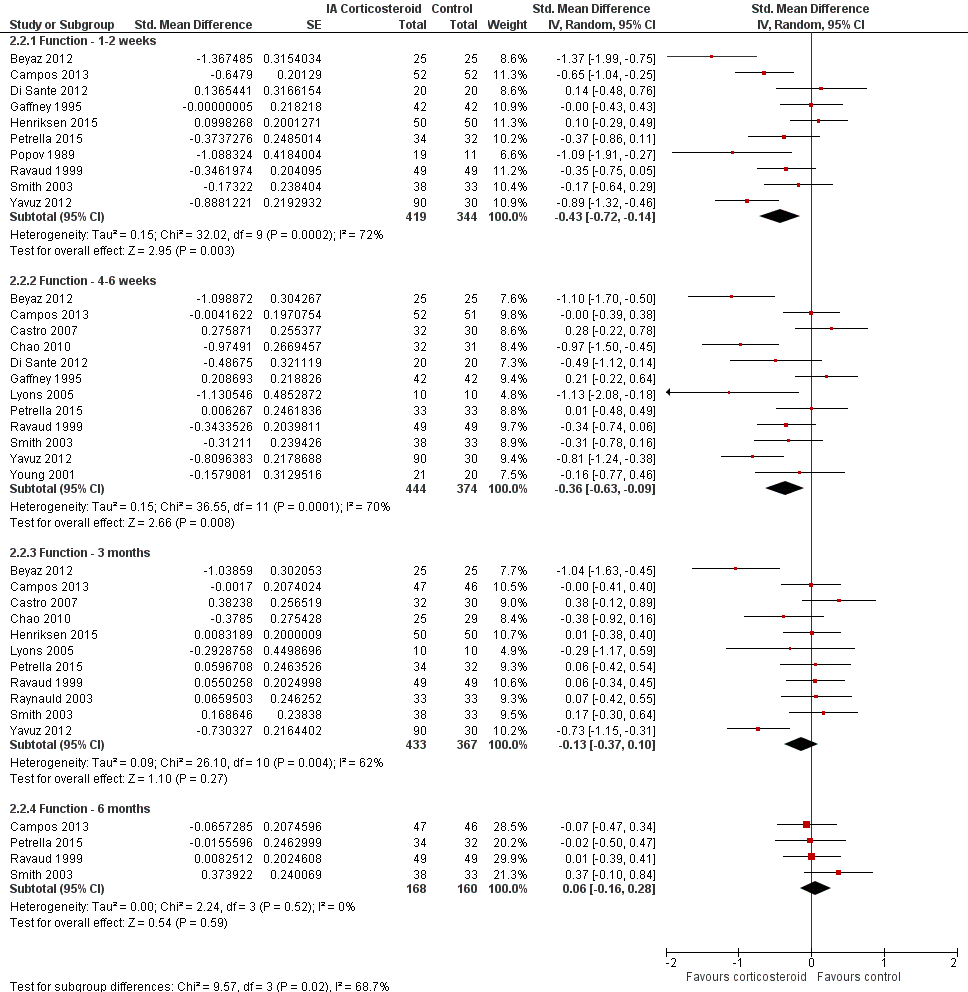
Forest plot of comparison: 2 Function, outcome: 2.2 Function ‐ Time points. P for trend = 0.011
Forest plot of comparison: 3 Quality of life, outcome: 3.1 Quality of life ‐ Main.

Forest plot of comparison: 7 Joint space narrowing, outcome: 7.1 Joint space narrowing ‐ Main.

Forest plot of comparison: 4 Number of participants experiencing any adverse event, outcome: 4.1 Number of participants experiencing any adverse event ‐ Main.

Forest plot of comparison: 5 Number of participants who withdraw because of adverse events, outcome: 5.1 Number of participants who withdraw because of adverse events ‐Main.

Forest plot of comparison: 6 Number of participants experiencing any serious adverse event, outcome: 6.1 Number of participants experiencing any serious adverse event ‐ Main.

Comparison 1 Pain, Outcome 1 Pain ‐ Main.
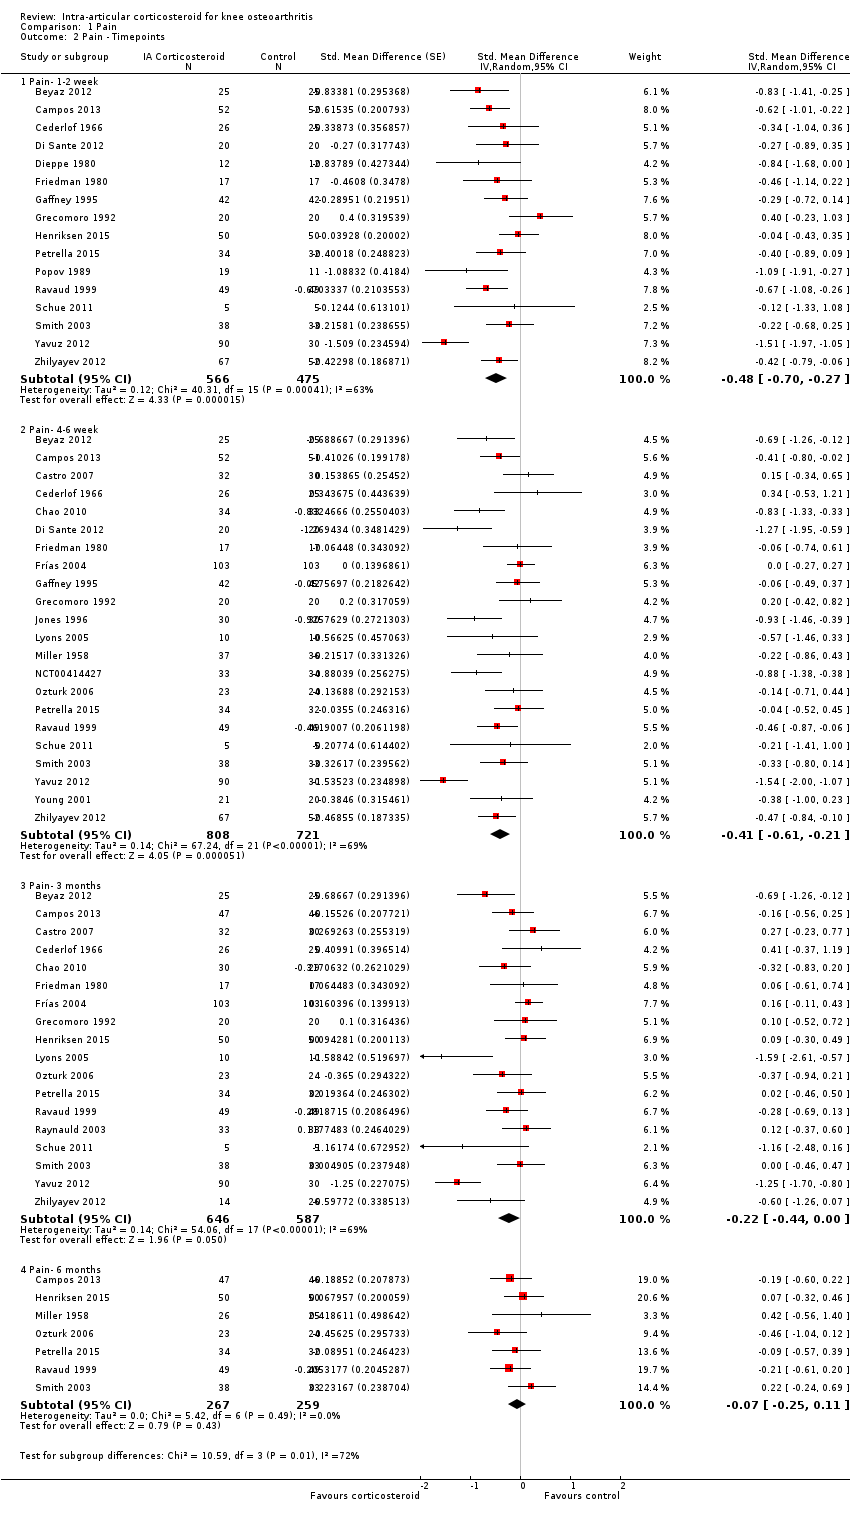
Comparison 1 Pain, Outcome 2 Pain ‐ Timepoints.
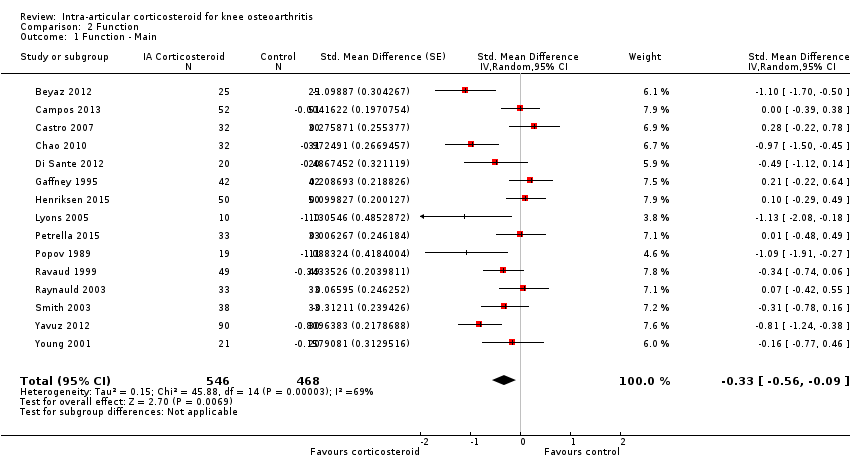
Comparison 2 Function, Outcome 1 Function ‐ Main.
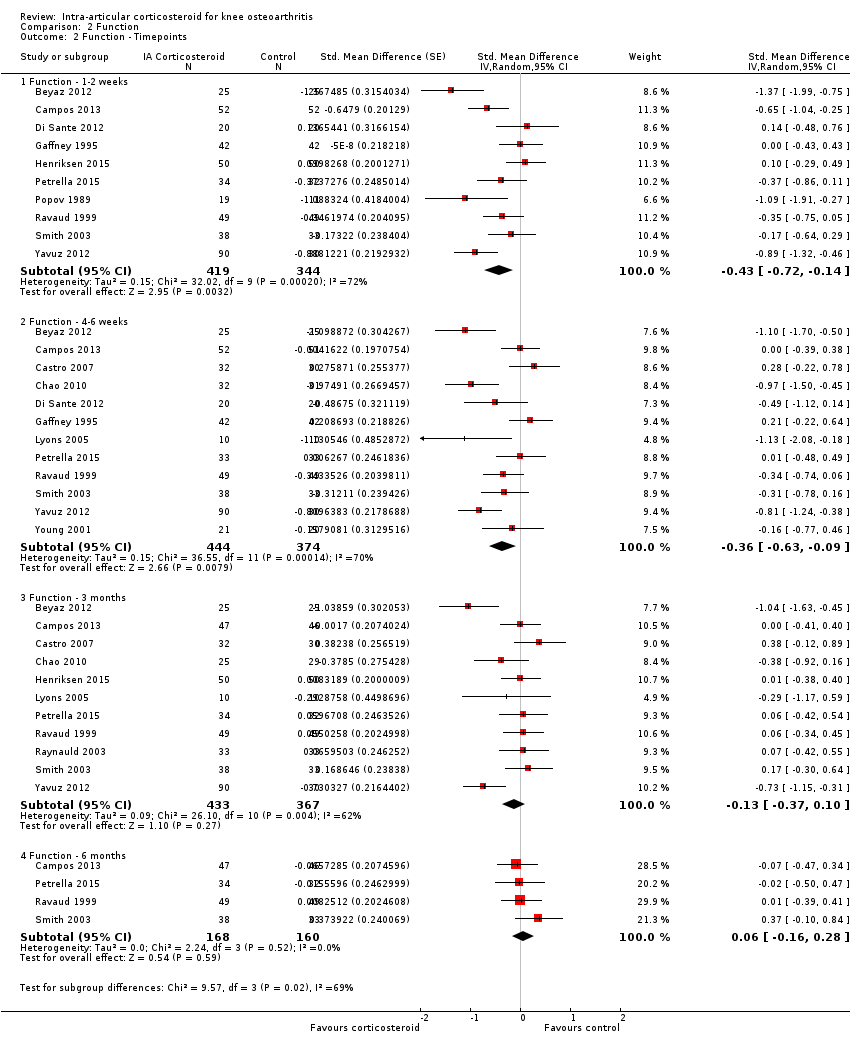
Comparison 2 Function, Outcome 2 Function ‐ Timepoints.

Comparison 3 Quality of life, Outcome 1 Quality of life ‐ Main.
Comparison 4 Number of participants experiencing any adverse event, Outcome 1 Number of participants experiencing any adverse event ‐ Main.
Comparison 5 Number of participants who withdraw because of adverse events, Outcome 1 Number of participants who with draw because of adverse events ‐Main.
Comparison 6 Number of participants experiencing any serious adverse event, Outcome 1 Number of participants experiencing any serious adverse event ‐ Main.
Comparison 7 Joint space narrowing, Outcome 1 Joint space narrowing ‐ Main.
| Intra‐articular corticosteroid compared with sham injection for osteoarthritis of the knee | ||||||
| Patient or population: participants with osteoarthritis of the knee Settings: various orthopaedic or rheumatology clinics Intervention: intra‐articular corticosteroid Comparison: sham injection | ||||||
| Outcomes | Illustrative comparative risks* (95% CI) | Relative effect | No of Participants | Quality of the evidence | Comments | |
| Assumed risk | Corresponding risk | |||||
| Sham injection | Intra‐articular corticosteroid | |||||
| Pain intensity Various pain scales. (median follow‐up: 12 weeks) | ‐1.8 cm change on 10‐cm VAS1 | ‐2.8 cm change 46% improvement | SMD ‐0.40 (‐0.58 to ‐0.22) Predictive interval (‐1.20 to 0.40) | 1749 (26) | ⊕⊕⊝⊝ | NNTB 8 (95% CI 6 to 13)4 |
| Function Various function scales. (median follow‐up: 12 weeks) | ‐1.2 units on WOMAC (range 0 to 10)1 | ‐1.9 units on WOMAC 34% improvement | SMD ‐0.33 (‐0.56 to ‐0.09) Predictive interval (‐1.19 to 0.54) | 1014 (15) | ⊕⊕⊝⊝ | NNTB 10 (95% CI 7 to 33)7 |
| Number of participants experiencing any adverse event (median follow‐up: 17 weeks) | 150 per 1000 participant‐years8 | 134 per 1000 participant‐years | RR 0.89 (0.64 to 1.23) | 84 (2) | ⊕⊕⊝⊝ | Little evidence of harmful effect (NNTB not statistically significant) |
| Number of participants who withdraw because of adverse events (median follow‐up: 25 weeks) | 17 per 1000 participant‐years8 | 6 per 1000 participant‐years | RR 0.33 (0.05 to 2.07) | 204 (2) | ⊕⊕⊝⊝ | Little evidence of harmful effect (NNTB not statistically significant) |
| Number of participants experiencing any serious adverse event (median follow‐up: 26 weeks) | 4 per 1000 participant‐years8 | 3 per 1000 participant‐years | RR 0.63 (0.15 to 2.67) | 331 (5) | ⊕⊕⊝⊝ | Little evidence of harmful effect (NNTB not statistically significant) |
| *The basis for the assumed risk (e.g. the median control group risk across studies) is provided in footnotes. The corresponding risk (and its 95% confidence interval) is based on the assumed risk in the comparison group and the relative effect of the intervention (and its 95% CI). | ||||||
| GRADE Working Group grades of evidence 1 Median reduction as observed across placebo groups in large osteoarthritis trials (see methods section, Nüesch 2009). 5 SMDs were back‐transformed onto a standardised Western Ontario and McMaster Universities Arthritis Index (WOMAC) disability score ranging from 0 to 10 on the basis of a typical pooled SD of 2.1 in trials that assessed function using WOMAC disability scores and expressed as change based on an assumed standardised reduction of 0.58 SD units in the control group. 9 Downgraded (2 levels) because: Most studies that reported this outcome are of high or unclear risk of bias, and statistical heterogeneity is large. 10 Downgraded (3 levels) because: 50% or more of the studies that reported this outcome are of high or unclear risk of bias, and the confidence interval of the pooled estimate is wide and includes the null effect. | ||||||
| Variable | Number of studies | N of participants corticosteroids | N of participants control | Pain intensity SMD (95% CI) | Heterogeneity I2 (%) | P value* |
| All trials | 26 | 922 | 827 | ‐0.40 (‐0.58 to ‐0.22) | 68% | |
| Allocation concealment | 0.15 | |||||
| Adequate | 2 | 88 | 83 | ‐0.16 (‐0.46 to 0.14) | 0% | |
| Inadequate or unclear | 24 | 834 | 744 | ‐0.42 (‐0.62 to ‐0.22) | 69% | |
| Blinding of participants | 0.64 | |||||
| Adequate | 6 | 220 | 218 | ‐0.34 (‐0.61 to ‐0.06) | 49% | |
| Inadequate or unclear | 20 | 702 | 609 | ‐0.42 (‐0.65 to ‐0.19) | 72% | |
| Blinding of therapists | 0.45 | |||||
| Adequate | 3 | 92 | 92 | ‐0.24 (‐0.66 to 0.17) | 44% | |
| Inadequate or unclear | 23 | 830 | 735 | ‐0.42 (‐0.62 to ‐0.22) | 70% | |
| Intention‐to‐treat analysis | 0.29 | |||||
| Yes | 9 | 236 | 233 | ‐0.26 (‐0.57 to 0.06) | 59% | |
| No or unclear | 17 | 686 | 594 | ‐0.47 (‐0.69 to ‐0.24) | 71% | |
| Type of control intervention | 0.08 | |||||
| Sham injection | 19 | 614 | 526 | ‐0.50 (‐0.72 to ‐0.28) | 65% | |
| No intervention | 7 | 284 | 280 | ‐0.18 (‐0.47 to 0.11) | 63% | |
| Funding independent of industry | 0.80 | |||||
| Yes | 11 | 341 | 333 | ‐0.37 (‐0.55 to ‐0.18) | 26% | |
| No or unclear | 15 | 581 | 494 | ‐0.41 (‐0.70 to ‐0.12) | 78% | |
| Trial size | 0.05 | |||||
| ≥ 50 per trial group | 3 | 205 | 204 | ‐0.13 (‐0.37 to 0.12) | 34% | |
| < 50 per trial group | 23 | 717 | 623 | ‐0.44 (‐0.65 to ‐0.24) | 67% | |
| Trial size | 0.013 | |||||
| ≥ 100 per trial group | 1 | 103 | 103 | 0.00 (‐0.27 to 0.27) | N/A | |
| < 100 per trial group | 25 | 819 | 724 | ‐0.42 (‐0.61 to ‐0.23) | 66% | |
| Publication type | 0.93 | |||||
| Full journal article | 22 | 785 | 706 | ‐0.40 (‐0.61 to ‐0.20) | 70% | |
| Other type or unpublished material | 4 | 137 | 121 | ‐0.38 (‐0.84 to ‐0.08) | 65% | |
| Ultrasound guidance of injections | 0.71 | |||||
| Yes | 2 | 70 | 70 | ‐0.62 (‐1.83 to 0.58) | 89% | |
| No or unclear | 24 | 852 | 757 | ‐0.39 (‐0.57 to ‐0.20) | 67% | |
| Use of local anaesthetic | 0.41 | |||||
| Yes | 5 | 172 | 157 | ‐0.55 (‐0.93 to ‐0.16) | 62% | |
| No or unclear | 21 | 750 | 670 | ‐0.36 (‐0.57 to ‐0.15) | 70% | |
| Concomitant viscosupplementation | 0.08 | |||||
| Yes | 4 | 129 | 127 | ‐0.16 (‐0.42 to 0.09) | 4% | |
| No or unclear | 22 | 793 | 700 | ‐0.46 (‐0.67 to ‐0.25) | 71% | |
| Concomitant joint lavage | ≤ 0.001 | |||||
| Yes | 4 | 197 | 187 | ‐0.06 (‐0.26 to 0.15) | 0% | |
| No or unclear | 26 | 725 | 640 | ‐0.57 (‐0.78 to ‐0.35) | 72% | |
| Use of crystalline preparation | 0.82 | |||||
| Yes | 18 | 623 | 562 | ‐0.47 (‐0.69 to ‐0.24) | 72% | |
| No or unclear | 12 | 299 | 265 | ‐0.52 (‐0.90 to ‐0.14) | 76% | |
| Prednisolone equivalence dose | 0.53 | |||||
| ≥ 50 mg | 17 | 520 | 470 | ‐0.55 (‐0.85 to ‐0.25) | 80% | |
| < 50 mg | 13 | 402 | 357 | ‐0.43 (‐0.66 to ‐0.20) | 56% | |
| Number of randomised comparisons are shown in "number of studies" for stratified analyses according to use of lavage as co‐intervention, crystalline preparation, prednisolone equivalence. *P value for interaction. N/A: not available. CI: confidence interval | ||||||
| Variable | Number of studies | N of participants corticosteroids | N of participants control | Function SMD (95% CI) | Heterogeneity I2 (%) | P value* |
| All trials | 15 | 546 | 468 | ‐0.33 (‐0.56 to ‐0.09) | 69% | |
| Allocation concealment | 0.25 | |||||
| Adequate | 2 | 88 | 83 | ‐0.09 (‐0.49 to 0.32) | 43% | |
| Inadequate or unclear | 13 | 458 | 385 | ‐0.37 (‐0.64 to ‐0.10) | 72% | |
| Blinding of participants | 0.97 | |||||
| Adequate | 5 | 201 | 199 | ‐0.32 (‐0.82 to 0.18) | 83% | |
| Inadequate or unclear | 10 | 345 | 269 | ‐0.33 (‐0.59 to ‐0.07) | 58% | |
| Blinding of therapists | 0.78 | |||||
| Adequate | 2 | 75 | 75 | ‐0.48 (‐1.65 to 0.70) | 91% | |
| Inadequate or unclear | 13 | 471 | 393 | ‐0.31 (‐0.55 to ‐0.06) | 66% | |
| Intention‐to‐treat analysis | 0.49 | |||||
| Yes | 5 | 161 | 159 | ‐0.21 (‐0.59 to 0.17) | 62% | |
| No or unclear | 10 | 385 | 309 | ‐0.38 (‐0.69 to ‐0.07) | 73% | |
| Type of control intervention | 0.031 | |||||
| Sham injection | 11 | 409 | 334 | ‐0.45 (‐0.74 to ‐0.15) | 73% | |
| No intervention | 4 | 137 | 134 | ‐0.01 (‐0.27 to 0.25) | 13% | |
| Funding independent of industry | 0.73 | |||||
| Yes | 9 | 310 | 302 | ‐0.36 (‐0.66 to ‐0.07) | 68% | |
| No or unclear | 6 | 236 | 166 | ‐0.27 (‐0.71 to 0.16) | 76% | |
| Trial size | 0.023 | |||||
| ≥ 50 per trial group | 2 | 102 | 101 | 0.05 (‐0.23 to 0.32) | 0% | |
| < 50 per trial group | 13 | 444 | 367 | ‐0.40 (‐0.67 to ‐0.13) | 70% | |
| Trial size | N/A | |||||
| ≥ 100 per trial group | 0 | 0 | 0 | N/A | N/A | |
| < 100 per trial group | 15 | 546 | 468 | ‐0.33 (‐0.56 to ‐0.09) | 69% | |
| Publication type | 0.023 | |||||
| Full journal article | 14 | 514 | 438 | ‐0.37 (‐0.61 to ‐0.13) | 68% | |
| Other type or unpublished material | 1 | 32 | 30 | 0.28 (‐0.22 to 0.78) | N/A | |
| Ultrasound guidance of injections | 0.49 | |||||
| Yes | 2 | 70 | 70 | ‐0.14 (‐0.70 to 0.43) | 58% | |
| No or unclear | 13 | 476 | 398 | ‐0.36 (‐0.62 to ‐0.09) | 71% | |
| Use of local anaesthetic | 0.34 | |||||
| Yes | 4 | 105 | 105 | ‐0.60 (‐1.25 to 0.05) | 78% | |
| No or unclear | 11 | 441 | 363 | ‐0.25 (‐0.51 to 0.00) | 68% | |
| Concomitant viscosupplementation | 0.06 | |||||
| Yes | 2 | 85 | 84 | ‐0.00 (‐0.30 to 0.30) | 0% | |
| No or unclear | 13 | 461 | 384 | ‐0.39 (‐0.66 to ‐0.12) | 72% | |
| Concomitant joint lavage | 0.18 | |||||
| Yes | 3 | 94 | 84 | ‐0.13 (‐0.55 to 0.28) | 48% | |
| No or unclear | 16 | 452 | 384 | ‐0.46 (‐0.71 to ‐0.21) | 70% | |
| Use of crystalline preparation | 0.66 | |||||
| Yes | 12 | 365 | 319 | ‐0.37 (‐0.66 to ‐0.08) | 73% | |
| No or unclear | 7 | 181 | 149 | ‐0.47 (‐0.83 to ‐0.11) | 61% | |
| Prednisolone equivalence dose | 0.16 | |||||
| ≥ 50 mg | 12 | 328 | 277 | ‐0.52 (‐0.83 to ‐0.20) | 74% | |
| < 50 mg | 7 | 218 | 191 | ‐0.22 (‐0.48 to 0.05) | 47% | |
| Number of randomised comparisons are shown in "number of studies" for stratified analyses according to use of lavage as co‐intervention, crystalline preparation, prednisolone equivalence. *P value for interaction. N/A: not available. CI: confidence interval | ||||||
| Outcome or subgroup title | No. of studies | No. of participants | Statistical method | Effect size |
| 1 Pain ‐ Main Show forest plot | 26 | 1749 | Std. Mean Difference (Random, 95% CI) | ‐0.40 [‐0.58, ‐0.22] |
| 2 Pain ‐ Timepoints Show forest plot | 26 | Std. Mean Difference (Random, 95% CI) | Subtotals only | |
| 2.1 Pain‐ 1‐2 week | 16 | 1041 | Std. Mean Difference (Random, 95% CI) | ‐0.48 [‐0.70, ‐0.27] |
| 2.2 Pain‐ 4‐6 week | 22 | 1529 | Std. Mean Difference (Random, 95% CI) | ‐0.41 [‐0.61, ‐0.21] |
| 2.3 Pain‐ 3 months | 18 | 1233 | Std. Mean Difference (Random, 95% CI) | ‐0.22 [‐0.44, 0.00] |
| 2.4 Pain‐ 6 months | 7 | 526 | Std. Mean Difference (Random, 95% CI) | ‐0.07 [‐0.25, 0.11] |
| Outcome or subgroup title | No. of studies | No. of participants | Statistical method | Effect size |
| 1 Function ‐ Main Show forest plot | 15 | 1014 | Std. Mean Difference (Random, 95% CI) | ‐0.33 [‐0.56, ‐0.09] |
| 2 Function ‐ Timepoints Show forest plot | 15 | Std. Mean Difference (Random, 95% CI) | Subtotals only | |
| 2.1 Function ‐ 1‐2 weeks | 10 | 763 | Std. Mean Difference (Random, 95% CI) | ‐0.43 [‐0.72, ‐0.14] |
| 2.2 Function ‐ 4‐6 weeks | 12 | 818 | Std. Mean Difference (Random, 95% CI) | ‐0.36 [‐0.63, ‐0.09] |
| 2.3 Function ‐ 3 months | 11 | 800 | Std. Mean Difference (Random, 95% CI) | ‐0.13 [‐0.37, 0.10] |
| 2.4 Function ‐ 6 months | 4 | 328 | Std. Mean Difference (Random, 95% CI) | 0.06 [‐0.16, 0.28] |
| Outcome or subgroup title | No. of studies | No. of participants | Statistical method | Effect size |
| 1 Quality of life ‐ Main Show forest plot | 2 | 184 | Std. Mean Difference (Random, 95% CI) | ‐0.01 [‐0.30, 0.28] |
| Outcome or subgroup title | No. of studies | No. of participants | Statistical method | Effect size |
| 1 Number of participants experiencing any adverse event ‐ Main Show forest plot | 2 | 84 | Risk Ratio (IV, Random, 95% CI) | 0.89 [0.64, 1.23] |
| Outcome or subgroup title | No. of studies | No. of participants | Statistical method | Effect size |
| 1 Number of participants who with draw because of adverse events ‐Main Show forest plot | 2 | 204 | Risk Ratio (IV, Random, 95% CI) | 0.33 [0.05, 2.07] |
| Outcome or subgroup title | No. of studies | No. of participants | Statistical method | Effect size |
| 1 Number of participants experiencing any serious adverse event ‐ Main Show forest plot | 5 | 331 | Risk Ratio (IV, Random, 95% CI) | 0.63 [0.15, 2.67] |
| Outcome or subgroup title | No. of studies | No. of participants | Statistical method | Effect size |
| 1 Joint space narrowing ‐ Main Show forest plot | 1 | 68 | Std. Mean Difference (Random, 95% CI) | ‐0.02 [‐0.49, 0.46] |