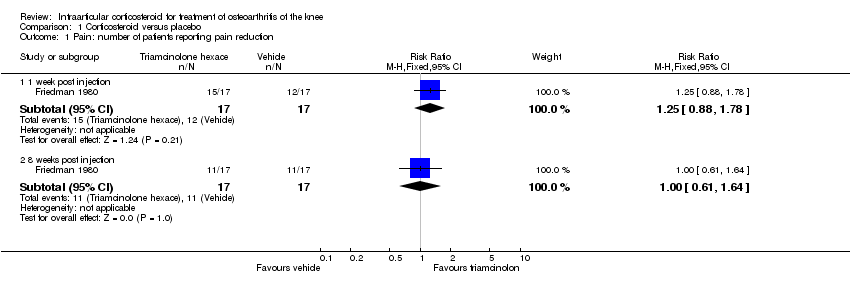
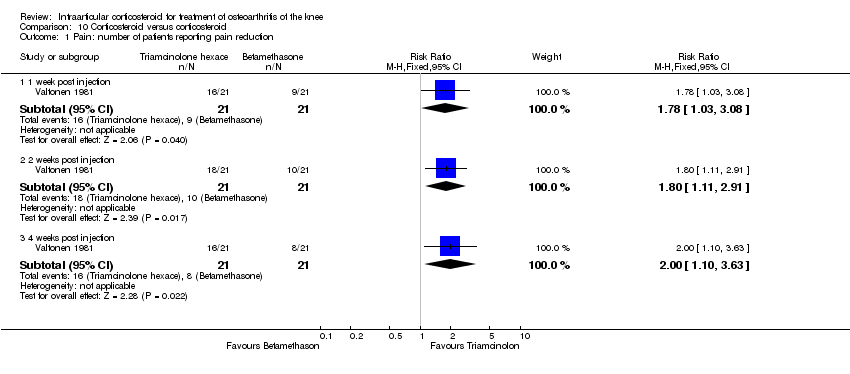
| 1 Pain: number of patients reporting pain reduction Show forest plot | 1 | | Risk Ratio (M‐H, Fixed, 95% CI) | Subtotals only |
|
| 1.1 1 week post injection | 1 | 34 | Risk Ratio (M‐H, Fixed, 95% CI) | 1.25 [0.88, 1.78] |
| 1.2 8 weeks post injection | 1 | 34 | Risk Ratio (M‐H, Fixed, 95% CI) | 1.0 [0.61, 1.64] |
| 2 Number of knees reported with improvement 2 weeks post injection Show forest plot | 1 | | Risk Ratio (M‐H, Fixed, 95% CI) | Subtotals only |
|
| 3 Number of knees reported with improvement 2 weeks post injection Show forest plot | 1 | | Risk Ratio (M‐H, Fixed, 95% CI) | Subtotals only |
|
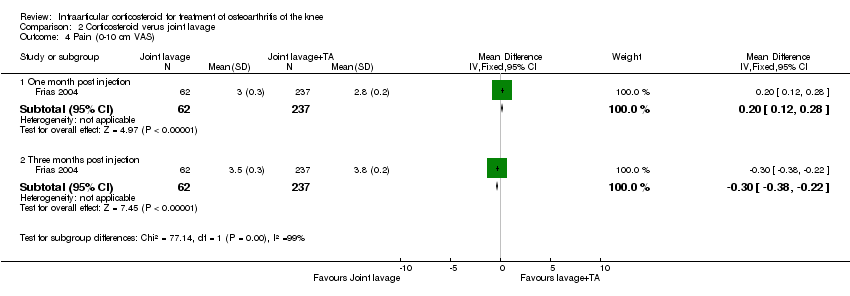
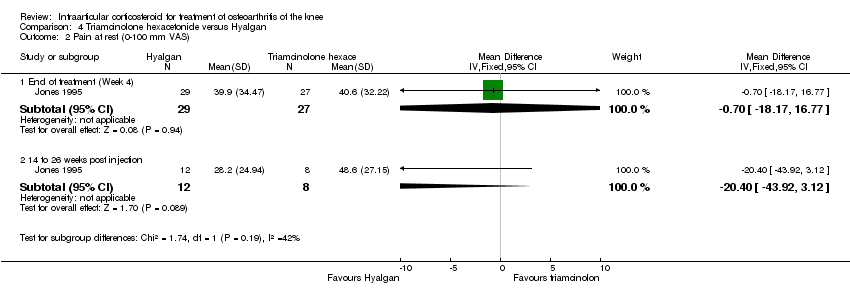
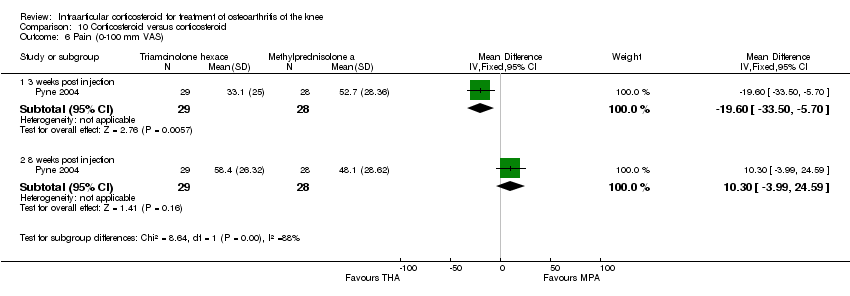
| 4 Pain: 0‐100 mm VAS Show forest plot | 3 | | Mean Difference (IV, Fixed, 95% CI) | Subtotals only |
|
| 4.1 1 week post injection | 3 | 161 | Mean Difference (IV, Fixed, 95% CI) | ‐21.91 [‐29.93, ‐13.89] |
| 4.2 4 weeks post injection | 1 | 53 | Mean Difference (IV, Fixed, 95% CI) | ‐11.20 [‐25.49, 3.09] |
| 4.3 6 weeks post injection | 1 | 84 | Mean Difference (IV, Fixed, 95% CI) | ‐7.10 [‐18.39, 4.19] |
| 4.4 12 weeks post injection | 1 | 53 | Mean Difference (IV, Fixed, 95% CI) | ‐14.20 [‐27.44, ‐0.96] |
| 4.5 24 weeks post injection | 1 | 53 | Mean Difference (IV, Fixed, 95% CI) | ‐7.30 [‐22.61, 8.01] |
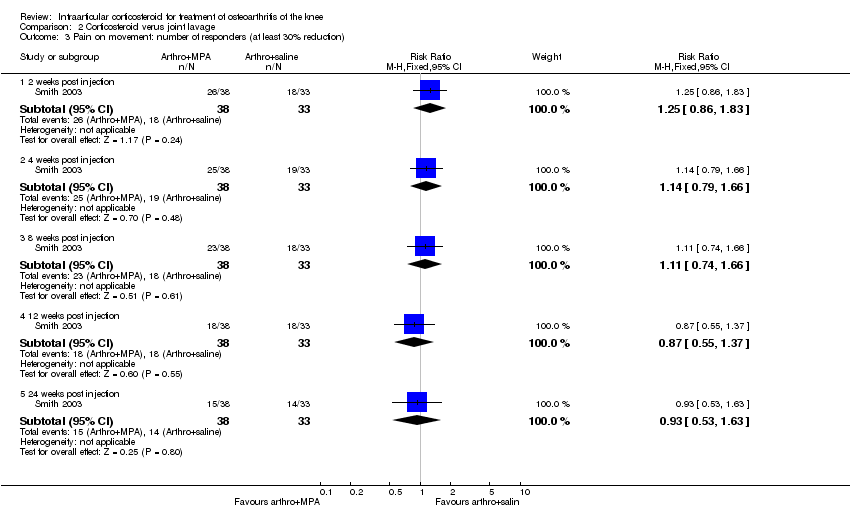
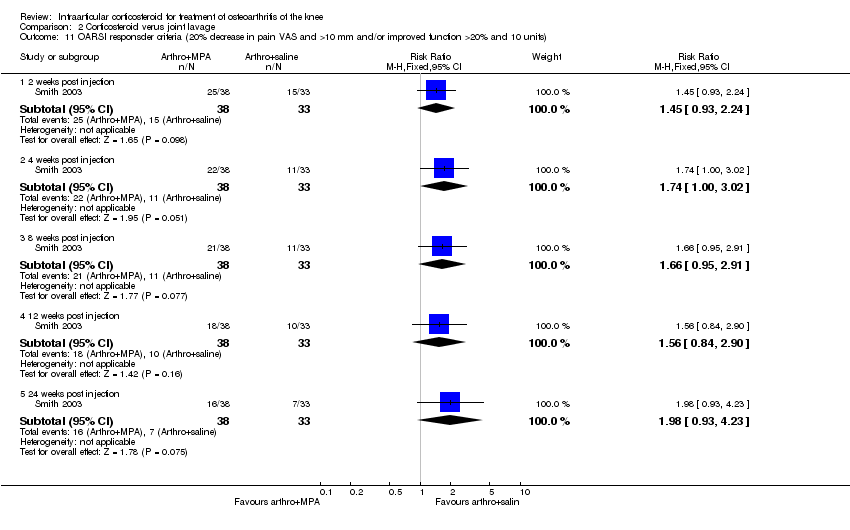
| 5 Number of responders (greater than 30% decrease in pain VAS from baseline) Show forest plot | 1 | | Risk Ratio (M‐H, Fixed, 95% CI) | Subtotals only |
|
| 5.1 1 week post injection | 1 | 53 | Risk Ratio (M‐H, Fixed, 95% CI) | 2.56 [1.26, 5.18] |
| 5.2 4 weeks post injection | 1 | 53 | Risk Ratio (M‐H, Fixed, 95% CI) | 1.96 [0.99, 3.87] |
| 5.3 12 weeks post injection | 1 | 53 | Risk Ratio (M‐H, Fixed, 95% CI) | 1.82 [0.91, 3.65] |
| 5.4 24 weeks post injection | 1 | 53 | Risk Ratio (M‐H, Fixed, 95% CI) | 2.24 [0.99, 5.08] |
| 6 Number of responders (greater than 15% decrease in pain VAS) 3 weeks post injection Show forest plot | 1 | | Risk Ratio (M‐H, Fixed, 95% CI) | Subtotals only |
|
| 7 Pain: WOMAC pain (0‐100 mm VAS) Show forest plot | 1 | | Mean Difference (IV, Fixed, 95% CI) | Subtotals only |
|
| 7.1 52 weeks post injection | 1 | 66 | Mean Difference (IV, Fixed, 95% CI) | ‐13.8 [‐26.79, ‐0.81] |
| 7.2 104 weeks post injection | 1 | 66 | Mean Difference (IV, Fixed, 95% CI) | ‐5.20 [‐18.19, 7.79] |
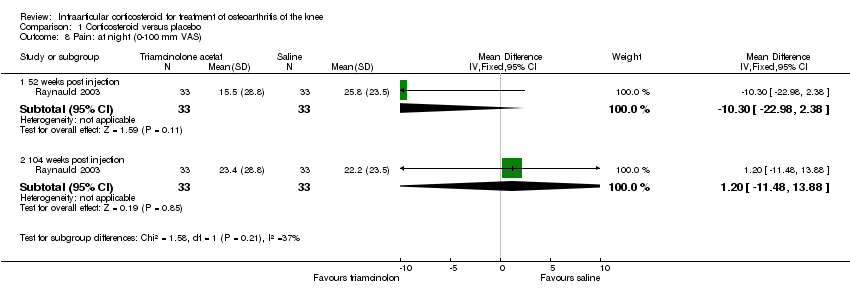
| 8 Pain: at night (0‐100 mm VAS) Show forest plot | 1 | | Mean Difference (IV, Fixed, 95% CI) | Subtotals only |
|
| 8.1 52 weeks post injection | 1 | 66 | Mean Difference (IV, Fixed, 95% CI) | ‐10.3 [‐22.98, 2.38] |
| 8.2 104 weeks post injection | 1 | 66 | Mean Difference (IV, Fixed, 95% CI) | 1.20 [‐11.48, 13.88] |
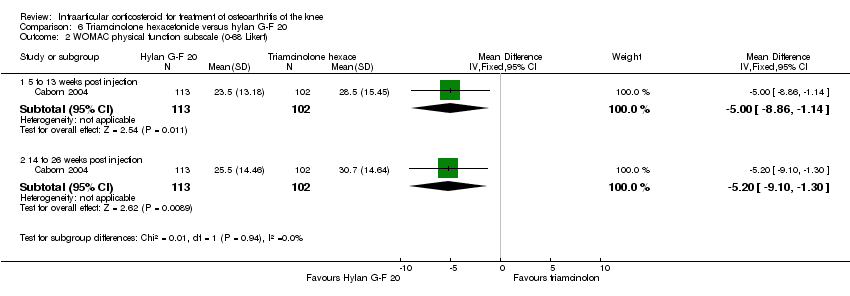
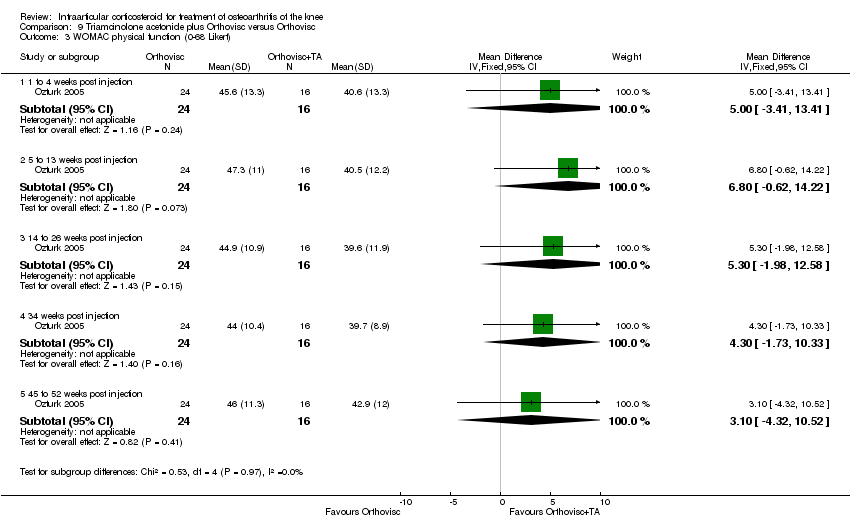
| 9 Function: WOMAC physical function (0‐100 mm VAS) Show forest plot | 1 | | Mean Difference (IV, Fixed, 95% CI) | Subtotals only |
|
| 9.1 52 weeks post injection | 1 | 66 | Mean Difference (IV, Fixed, 95% CI) | ‐6.0 [‐17.77, 5.77] |
| 9.2 104 weeks post injection | 1 | 66 | Mean Difference (IV, Fixed, 95% CI) | ‐4.20 [‐15.97, 7.57] |
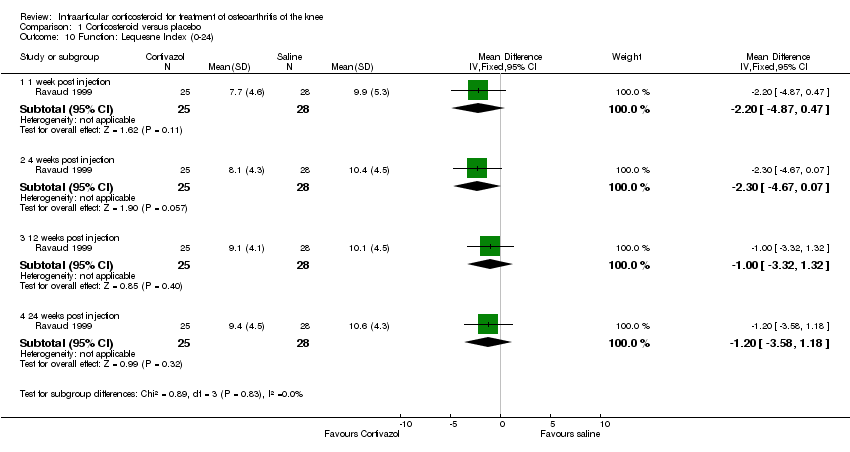
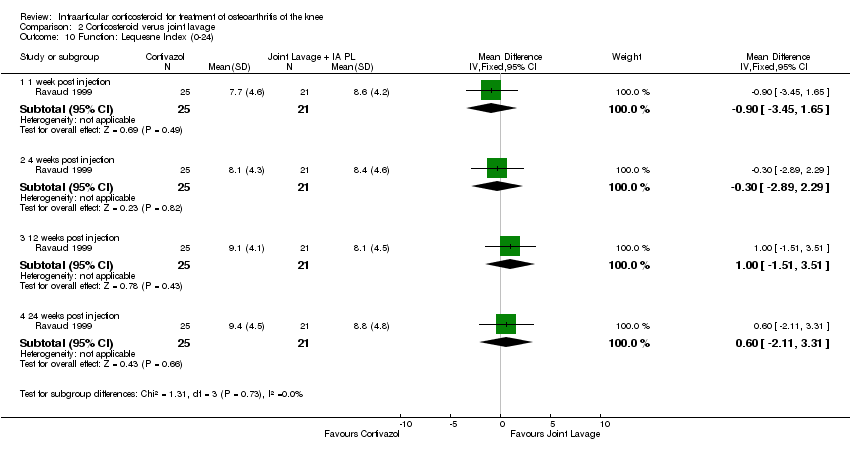
| 10 Function: Lequesne Index (0‐24) Show forest plot | 1 | | Mean Difference (IV, Fixed, 95% CI) | Subtotals only |
|
| 10.1 1 week post injection | 1 | 53 | Mean Difference (IV, Fixed, 95% CI) | ‐2.2 [‐4.87, 0.47] |
| 10.2 4 weeks post injection | 1 | 53 | Mean Difference (IV, Fixed, 95% CI) | ‐2.30 [‐4.67, 0.07] |
| 10.3 12 weeks post injection | 1 | 53 | Mean Difference (IV, Fixed, 95% CI) | ‐1.0 [‐3.32, 1.32] |
| 10.4 24 weeks post injection | 1 | 53 | Mean Difference (IV, Fixed, 95% CI) | ‐1.20 [‐3.58, 1.18] |
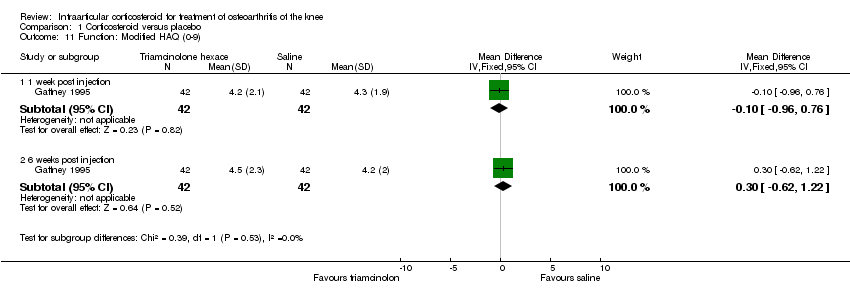
| 11 Function: Modified HAQ (0‐9) Show forest plot | 1 | | Mean Difference (IV, Fixed, 95% CI) | Subtotals only |
|
| 11.1 1 week post injection | 1 | 84 | Mean Difference (IV, Fixed, 95% CI) | ‐0.10 [‐0.96, 0.76] |
| 11.2 6 weeks post injection | 1 | 84 | Mean Difference (IV, Fixed, 95% CI) | 0.30 [‐0.62, 1.22] |
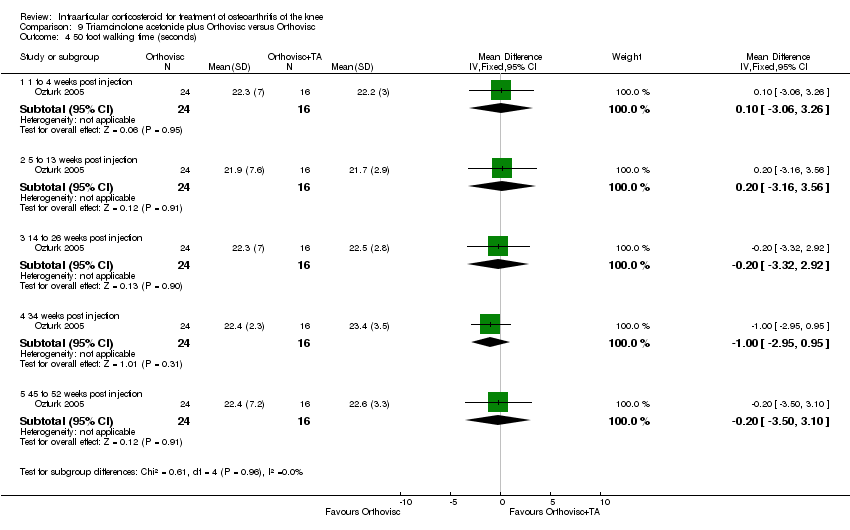
| 12 Function: 50 foot walking time (sec) Show forest plot | 1 | | Mean Difference (IV, Fixed, 95% CI) | Subtotals only |
|
| 12.1 52 weeks post injection | 1 | 66 | Mean Difference (IV, Fixed, 95% CI) | ‐0.20 [‐1.62, 1.22] |
| 12.2 104 weeks post injection | 1 | 66 | Mean Difference (IV, Fixed, 95% CI) | ‐0.70 [‐2.12, 0.72] |
| 13 Function: walking distance (m) Show forest plot | 1 | | Mean Difference (IV, Fixed, 95% CI) | Subtotals only |
|
| 13.1 1 week post injection | 1 | 84 | Mean Difference (IV, Fixed, 95% CI) | 2.40 [‐4.36, 9.16] |
| 13.2 6 weeks post injection | 1 | 84 | Mean Difference (IV, Fixed, 95% CI) | ‐0.80 [‐7.20, 5.60] |
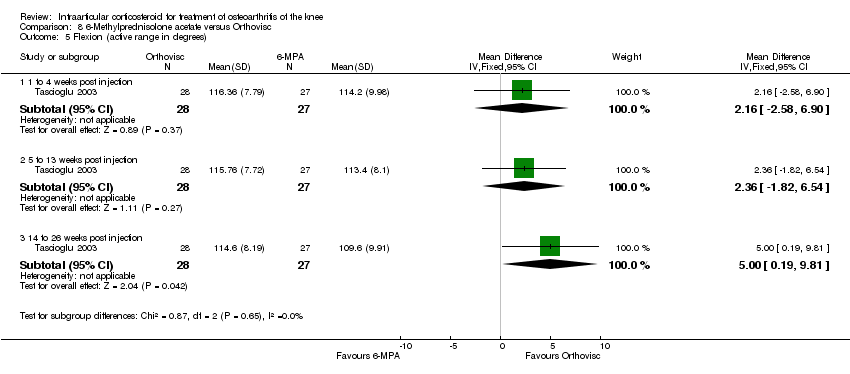
| 14 Range of motion (degrees) Show forest plot | 1 | | Mean Difference (IV, Fixed, 95% CI) | Subtotals only |
|
| 14.1 52 weeks post injection | 1 | 66 | Mean Difference (IV, Fixed, 95% CI) | ‐1.30 [‐7.66, 5.06] |
| 14.2 104 weeks post injection | 1 | 66 | Mean Difference (IV, Fixed, 95% CI) | 10.40 [4.04, 16.76] |
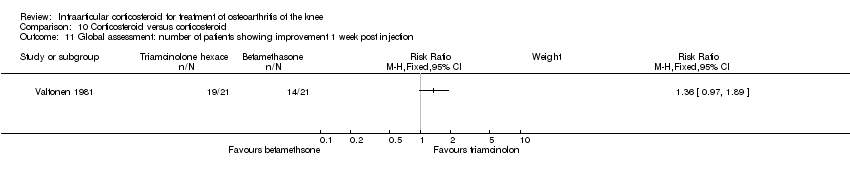
| 15 Global assessment: number of patients showing improvement Show forest plot | 4 | | Risk Ratio (M‐H, Fixed, 95% CI) | Subtotals only |
|
| 15.1 1 week post injection | 3 | 158 | Risk Ratio (M‐H, Fixed, 95% CI) | 1.44 [1.13, 1.82] |
| 15.2 3 weeks post injection | 1 | 51 | Risk Ratio (M‐H, Fixed, 95% CI) | 0.91 [0.67, 1.24] |
| 15.3 6 weeks post injection | 2 | 157 | Risk Ratio (M‐H, Fixed, 95% CI) | 1.06 [0.86, 1.31] |
| 15.4 8 weeks post injection | 1 | 51 | Risk Ratio (M‐H, Fixed, 95% CI) | 0.86 [0.60, 1.23] |
| 15.5 6 months post injection | 1 | 68 | Risk Ratio (M‐H, Fixed, 95% CI) | 0.94 [0.81, 1.09] |
| 16 Global assessment: number of patients preferring treatment Show forest plot | 3 | | Risk Ratio (M‐H, Fixed, 95% CI) | Subtotals only |
|
| 17 Patient global assessment (0‐100 mm VAS) Show forest plot | 2 | | Mean Difference (IV, Fixed, 95% CI) | Subtotals only |
|
| 17.1 1 week post injection | 1 | 53 | Mean Difference (IV, Fixed, 95% CI) | ‐15.5 [‐32.32, 1.32] |
| 17.2 4 weeks post injection | 1 | 53 | Mean Difference (IV, Fixed, 95% CI) | ‐12.90 [‐29.51, 3.71] |
| 17.3 12 weeks post injection | 1 | 53 | Mean Difference (IV, Fixed, 95% CI) | ‐9.20 [‐24.18, 5.78] |
| 17.4 24 weeks post injection | 1 | 53 | Mean Difference (IV, Fixed, 95% CI) | ‐3.70 [‐20.47, 13.07] |
| 17.5 52 weeks post injection | 1 | 66 | Mean Difference (IV, Fixed, 95% CI) | ‐0.40 [‐14.16, 13.36] |
| 17.6 104 weeks post injection | 1 | 66 | Mean Difference (IV, Fixed, 95% CI) | ‐1.10 [‐14.86, 12.66] |
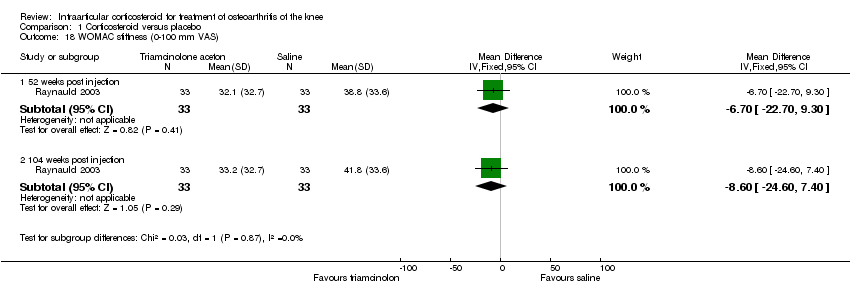
| 18 WOMAC stiffness (0‐100 mm VAS) Show forest plot | 1 | | Mean Difference (IV, Fixed, 95% CI) | Subtotals only |
|
| 18.1 52 weeks post injection | 1 | 66 | Mean Difference (IV, Fixed, 95% CI) | ‐6.70 [‐22.70, 9.30] |
| 18.2 104 weeks post injection | 1 | 66 | Mean Difference (IV, Fixed, 95% CI) | ‐8.60 [‐24.60, 7.40] |
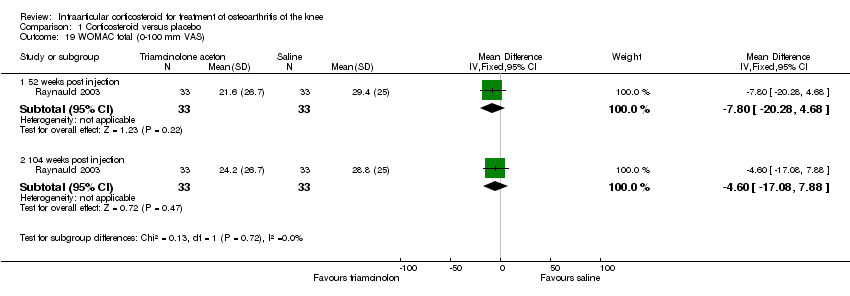
| 19 WOMAC total (0‐100 mm VAS) Show forest plot | 1 | | Mean Difference (IV, Fixed, 95% CI) | Subtotals only |
|
| 19.1 52 weeks post injection | 1 | 66 | Mean Difference (IV, Fixed, 95% CI) | ‐7.80 [‐20.28, 4.68] |
| 19.2 104 weeks post injection | 1 | 66 | Mean Difference (IV, Fixed, 95% CI) | ‐4.60 [‐17.08, 7.88] |
| 20 Joint space width (mm) Show forest plot | 1 | | Mean Difference (IV, Fixed, 95% CI) | Subtotals only |
|
| 20.1 1 year post injection | 1 | 66 | Mean Difference (IV, Fixed, 95% CI) | 0.14 [‐2.90, 3.18] |
| 20.2 2 years post injection | 1 | 66 | Mean Difference (IV, Fixed, 95% CI) | 0.16 [‐2.23, 2.55] |
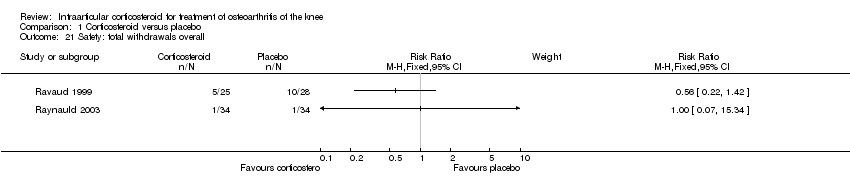
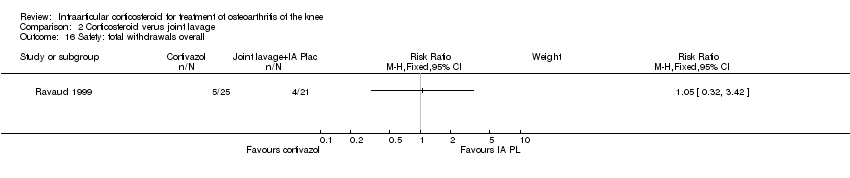
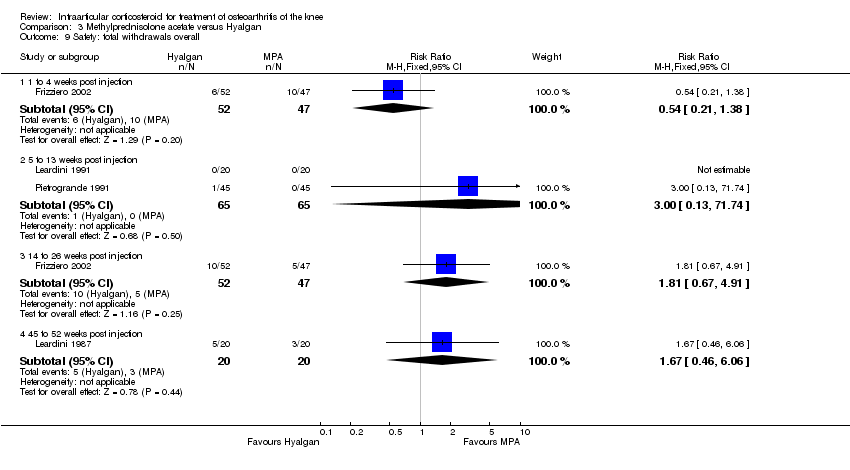
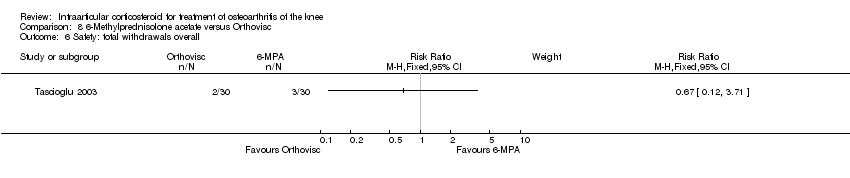
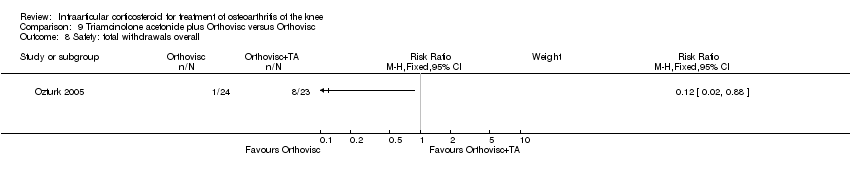
| 21 Safety: total withdrawals overall Show forest plot | 2 | | Risk Ratio (M‐H, Fixed, 95% CI) | Subtotals only |
|
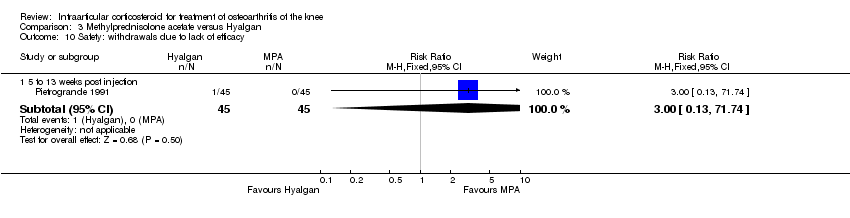
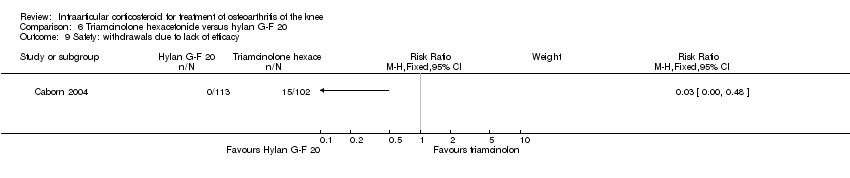
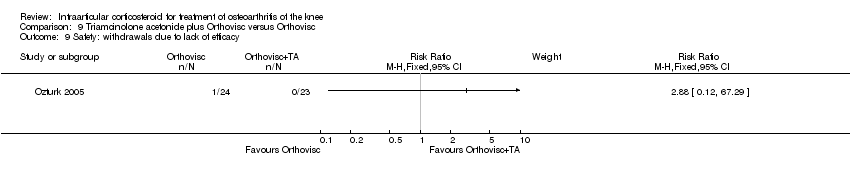
| 22 Safety: withdrawals due to lack of efficacy Show forest plot | 2 | | Risk Ratio (M‐H, Fixed, 95% CI) | Subtotals only |
|
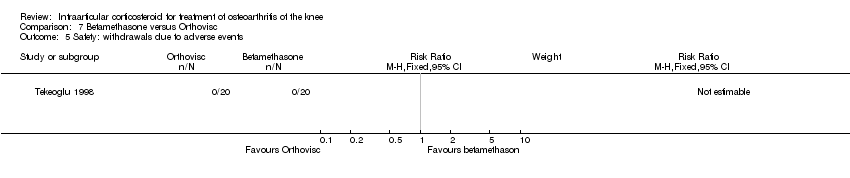
| 23 Safety: withdrawals due to adverse events | 0 | | Risk Ratio (M‐H, Fixed, 95% CI) | Subtotals only |
| 24 Safety: number of patients experiencing post injection flare Show forest plot | 1 | | Risk Ratio (M‐H, Fixed, 95% CI) | Subtotals only |
|
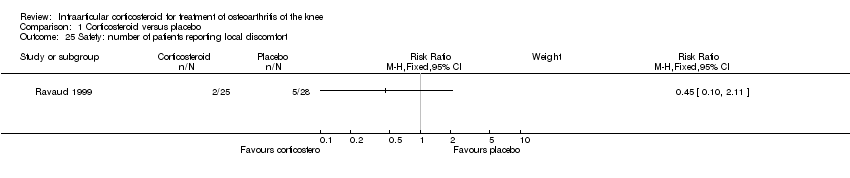
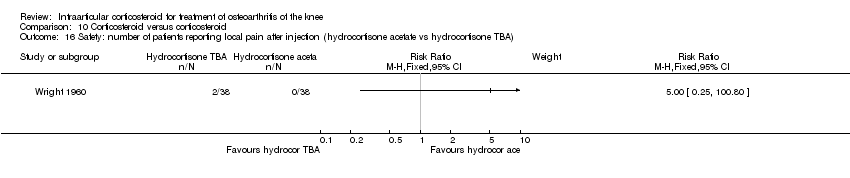
| 25 Safety: number of patients reporting local discomfort Show forest plot | 1 | | Risk Ratio (M‐H, Fixed, 95% CI) | Subtotals only |
|