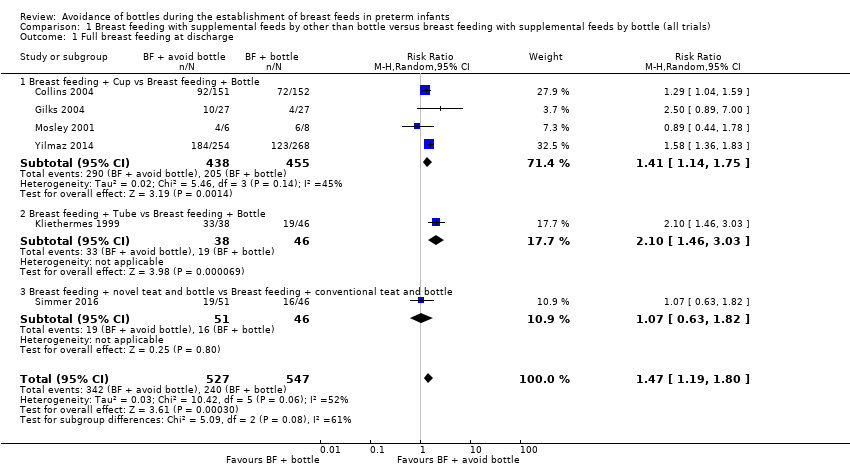
| 1 Full breast feeding at discharge Show forest plot | 6 | 1074 | Risk Ratio (M‐H, Random, 95% CI) | 1.47 [1.19, 1.80] |
|
| 1.1 Breast feeding + Cup vs Breast feeding + Bottle | 4 | 893 | Risk Ratio (M‐H, Random, 95% CI) | 1.41 [1.14, 1.75] |
| 1.2 Breast feeding + Tube vs Breast feeding + Bottle | 1 | 84 | Risk Ratio (M‐H, Random, 95% CI) | 2.10 [1.46, 3.03] |
| 1.3 Breast feeding + novel teat and bottle vs Breast feeding + conventional teat and bottle | 1 | 97 | Risk Ratio (M‐H, Random, 95% CI) | 1.07 [0.63, 1.82] |
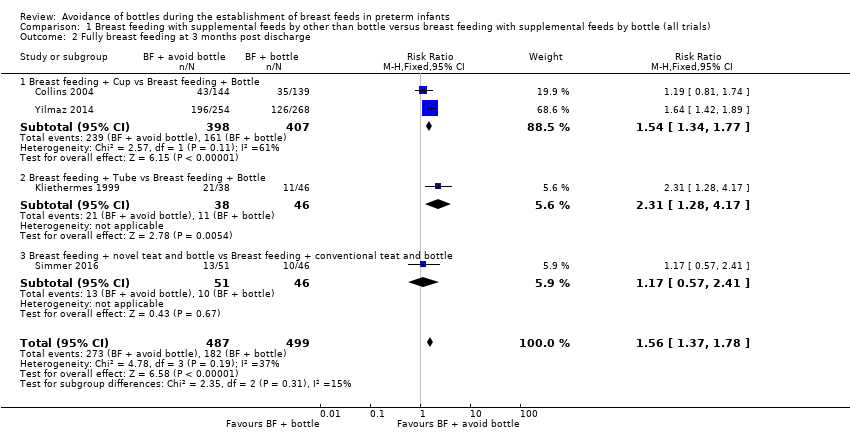
| 2 Fully breast feeding at 3 months post discharge Show forest plot | 4 | 986 | Risk Ratio (M‐H, Fixed, 95% CI) | 1.56 [1.37, 1.78] |
|
| 2.1 Breast feeding + Cup vs Breast feeding + Bottle | 2 | 805 | Risk Ratio (M‐H, Fixed, 95% CI) | 1.54 [1.34, 1.77] |
| 2.2 Breast feeding + Tube vs Breast feeding + Bottle | 1 | 84 | Risk Ratio (M‐H, Fixed, 95% CI) | 2.31 [1.28, 4.17] |
| 2.3 Breast feeding + novel teat and bottle vs Breast feeding + conventional teat and bottle | 1 | 97 | Risk Ratio (M‐H, Fixed, 95% CI) | 1.17 [0.57, 2.41] |
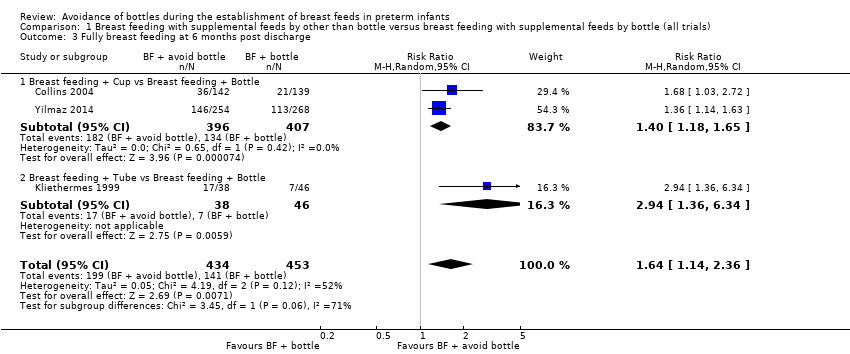
| 3 Fully breast feeding at 6 months post discharge Show forest plot | 3 | 887 | Risk Ratio (M‐H, Random, 95% CI) | 1.64 [1.14, 2.36] |
|
| 3.1 Breast feeding + Cup vs Breast feeding + Bottle | 2 | 803 | Risk Ratio (M‐H, Random, 95% CI) | 1.40 [1.18, 1.65] |
| 3.2 Breast feeding + Tube vs Breast feeding + Bottle | 1 | 84 | Risk Ratio (M‐H, Random, 95% CI) | 2.94 [1.36, 6.34] |
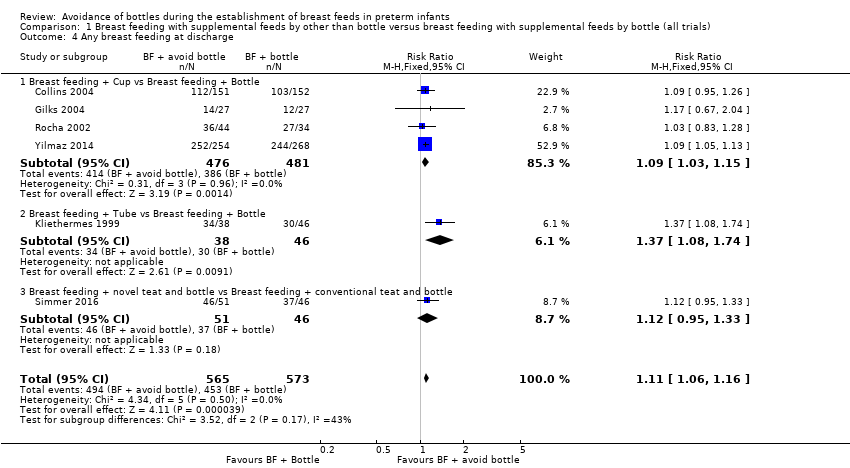
| 4 Any breast feeding at discharge Show forest plot | 6 | 1138 | Risk Ratio (M‐H, Fixed, 95% CI) | 1.11 [1.06, 1.16] |
|
| 4.1 Breast feeding + Cup vs Breast feeding + Bottle | 4 | 957 | Risk Ratio (M‐H, Fixed, 95% CI) | 1.09 [1.03, 1.15] |
| 4.2 Breast feeding + Tube vs Breast feeding + Bottle | 1 | 84 | Risk Ratio (M‐H, Fixed, 95% CI) | 1.37 [1.08, 1.74] |
| 4.3 Breast feeding + novel teat and bottle vs Breast feeding + conventional teat and bottle | 1 | 97 | Risk Ratio (M‐H, Fixed, 95% CI) | 1.12 [0.95, 1.33] |
| 5 Any breast feeding at 3 months post discharge Show forest plot | 5 | 1063 | Risk Ratio (M‐H, Random, 95% CI) | 1.31 [1.01, 1.71] |
|
| 5.1 Breast feeding + Cup vs Breast feeding + Bottle | 3 | 883 | Risk Ratio (M‐H, Random, 95% CI) | 1.24 [0.89, 1.71] |
| 5.2 Breast feeding + Tube vs Breast feeding + Bottle | 1 | 83 | Risk Ratio (M‐H, Random, 95% CI) | 1.69 [1.19, 2.41] |
| 5.3 Breast feeding + novel teat and bottle vs Breast feeding + conventional teat and bottle | 1 | 97 | Risk Ratio (M‐H, Random, 95% CI) | 1.20 [0.80, 1.80] |
| 6 Any breast feeding at 6 months post discharge Show forest plot | 3 | 886 | Risk Ratio (M‐H, Fixed, 95% CI) | 1.25 [1.10, 1.41] |
|
| 6.1 Breast feeding + Cup vs Breast feeding + Bottle | 2 | 803 | Risk Ratio (M‐H, Fixed, 95% CI) | 1.20 [1.06, 1.36] |
| 6.2 Breast feeding + Tube vs Breast feeding + Bottle | 1 | 83 | Risk Ratio (M‐H, Fixed, 95% CI) | 2.07 [1.18, 3.64] |
| 7 Days to reach full sucking feeds Show forest plot | 3 | 429 | Mean Difference (IV, Random, 95% CI) | 2.56 [‐7.17, 12.28] |
|
| 7.1 Breast feeding + Cup vs Breast feeding + Bottle | 2 | 332 | Mean Difference (IV, Random, 95% CI) | 5.08 [‐6.43, 16.59] |
| 7.2 Breast feeding + novel teat and bottle vs Breast feeding + conventional teat and bottle | 1 | 97 | Mean Difference (IV, Random, 95% CI) | ‐4.0 [‐15.63, 7.63] |
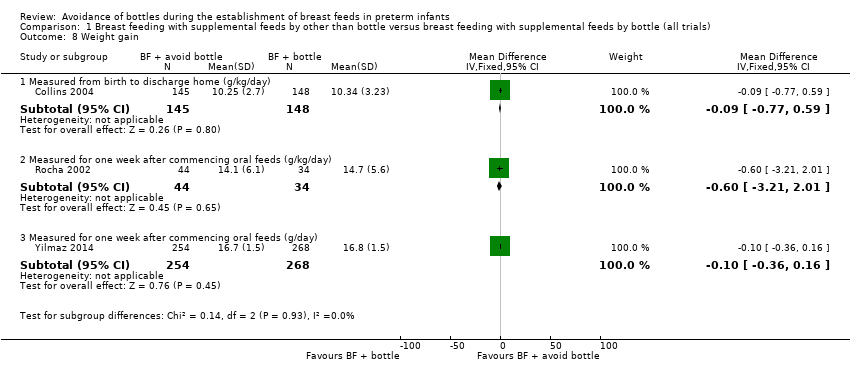
| 8 Weight gain Show forest plot | 3 | | Mean Difference (IV, Fixed, 95% CI) | Subtotals only |
|
| 8.1 Measured from birth to discharge home (g/kg/day) | 1 | 293 | Mean Difference (IV, Fixed, 95% CI) | ‐0.09 [‐0.77, 0.59] |
| 8.2 Measured for one week after commencing oral feeds (g/kg/day) | 1 | 78 | Mean Difference (IV, Fixed, 95% CI) | ‐0.60 [‐3.21, 2.01] |
| 8.3 Measured for one week after commencing oral feeds (g/day) | 1 | 522 | Mean Difference (IV, Fixed, 95% CI) | ‐0.10 [‐0.36, 0.16] |
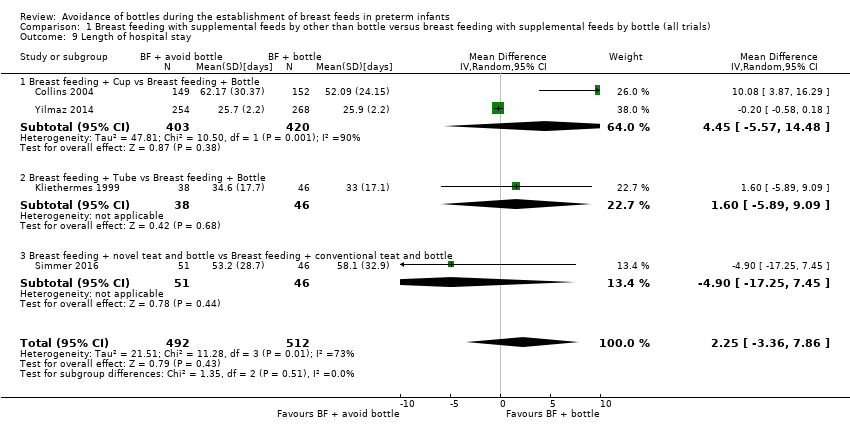
| 9 Length of hospital stay Show forest plot | 4 | 1004 | Mean Difference (IV, Random, 95% CI) | 2.25 [‐3.36, 7.86] |
|
| 9.1 Breast feeding + Cup vs Breast feeding + Bottle | 2 | 823 | Mean Difference (IV, Random, 95% CI) | 4.45 [‐5.57, 14.48] |
| 9.2 Breast feeding + Tube vs Breast feeding + Bottle | 1 | 84 | Mean Difference (IV, Random, 95% CI) | 1.60 [‐5.89, 9.09] |
| 9.3 Breast feeding + novel teat and bottle vs Breast feeding + conventional teat and bottle | 1 | 97 | Mean Difference (IV, Random, 95% CI) | ‐4.90 [‐17.25, 7.45] |
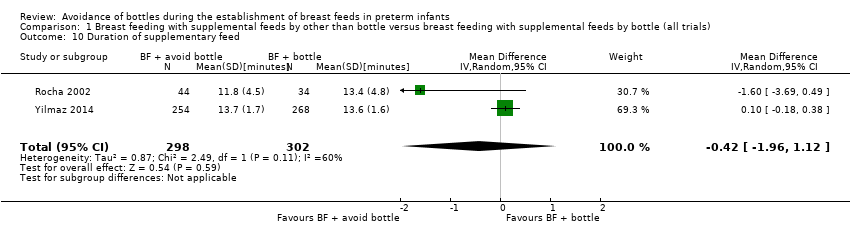
| 10 Duration of supplementary feed Show forest plot | 2 | 600 | Mean Difference (IV, Random, 95% CI) | ‐0.42 [‐1.96, 1.12] |
|
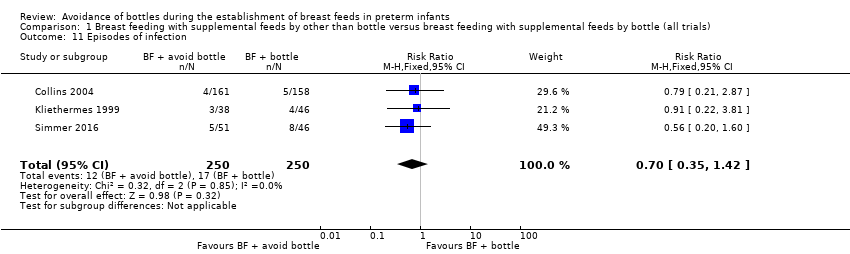
| 11 Episodes of infection Show forest plot | 3 | 500 | Risk Ratio (M‐H, Fixed, 95% CI) | 0.70 [0.35, 1.42] |
|