避免早產兒於母乳哺育建立期使用瓶餵牛奶
Appendices
Appendix 1. Standard search methods
PubMed: ((infant, newborn[MeSH] OR newborn OR neonate OR neonatal OR premature OR low birth weight OR VLBW OR LBW or infan* or neonat*) AND (randomized controlled trial [pt] OR controlled clinical trial [pt] OR Clinical Trial[ptyp] OR randomized [tiab] OR placebo [tiab] OR clinical trials as topic [mesh: noexp] OR randomly [tiab] OR trial [ti]) NOT (animals [mh] NOT humans [mh]))
Embase: (infant, newborn or newborn or neonate or neonatal or premature or very low birth weight or low birth weight or VLBW or LBW or Newborn or infan* or neonat*) AND (human not animal) AND (randomized controlled trial or controlled clinical trial or randomized or placebo or clinical trials as topic or randomly or trial or clinical trial)
CINAHL: (infant, newborn OR newborn OR neonate OR neonatal OR premature OR low birth weight OR VLBW OR LBW or Newborn or infan* or neonat*) AND (randomized controlled trial OR controlled clinical trial OR randomized OR placebo OR clinical trials as topic OR randomly OR trial OR PT clinical trial)
The Cochrane Library: (infant or newborn or neonate or neonatal or premature or very low birth weight or low birth weight or VLBW or LBW)
Appendix 2. Risk of bias tool
1. Selection bias (random sequence generation and allocation concealment)
For each included trial, we planned to categorise the risk of selection bias as:
1a. Random sequence generation
-
Low risk: Investigators describe a random component in the sequence generation process, such as referring to a random number table, using a computer random number generator, tossing a coin, shuffling cards or envelopes, throwing dice, drawing lots or conducting minimisation.
-
High risk: Investigators describe a non‐random component in the sequence generation process (sequence generated by odd or even date of birth, sequence generated by some rule based on date or day of admission, sequence generated by some rule based on hospital or clinic record number, allocation by judgement of the clinician, allocation by preference of the participant, allocation based on results of a laboratory test or a series of tests or allocation by availability of the intervention).
-
Unclear risk: No or unclear information is provided.
1b. Allocation concealment
For each included trial, we planned to categorise the risk of bias regarding allocation concealment as:
-
Low risk: Participant and investigators enrolling participants could not foresee assignment because one of the following, or an equivalent method, was used to conceal allocation: central allocation (including telephone, web‐based and pharmacy‐controlled randomisation), sequentially numbered drug containers or identical appearance or sequentially numbered sealed opaque envelopes.
-
High risk: Participant and investigators enrolling participants could possibly foresee assignments and thus introduce selection bias, such as allocation based on open random allocation schedule (e.g. a list of random numbers), unsealed or non‐opaque envelopes, alternation or rotation, date of birth or case record number.
-
Unclear risk: No or unclear information is provided.
2. Blinding (performance bias)
For each included trial, we planned to categorise the methods used to blind study personnel from knowledge of which intervention a participant received.
-
Low risk: no blinding or incomplete blinding, but review authors judge that the outcome is not likely to be influenced by lack of blinding; blinding of participants and key study personnel ensured; unlikely that blinding could have been broken.
-
High risk: no blinding or incomplete blinding, and the outcome is likely to be influenced by lack of blinding; blinding of key trial participants and personnel attempted, but likely that blinding could have been broken, and the outcome is likely to be influenced by lack of blinding.
-
Unclear risk: No or unclear information is provided.
3. Blinding (detection bias)
For each included trial, we planned to categorise the methods used to blind outcome assessors from knowledge of which intervention a participant received.
-
Low risk: no blinding or incomplete blinding, but review authors judge that the outcome is not likely to be influenced by lack of blinding; blinding of participants and key study personnel ensured; unlikely that blinding could have been broken.
-
High risk: no blinding of outcome assessment, but review authors judge that outcome measurement is not likely to be influenced by lack of blinding; blinding of outcome assessment; likely that the blinding could have been broken, and outcome measurement is likely to be influenced by lack of blinding.
-
Unclear risk: No or unclear information is provided.
4. Incomplete outcome data (attrition bias)
For each included trial and for each outcome, we planned to describe the completeness of data including attrition and exclusions from the analysis.
-
Low risk:
-
No missing outcome data.
-
Reasons for missing outcome data unlikely to be related to true outcome (for survival data, censoring unlikely to be introducing bias).
-
Missing outcome data balanced in numbers across intervention groups, with similar reasons for missing data across groups.
-
For dichotomous outcome data, the proportion of missing outcomes compared with observed event risk is not enough to have a clinically relevant impact on the intervention effect estimate.
-
For continuous outcome data, plausible effect size (difference in means or standardized difference in means) among missing outcomes is not enough to have a clinically relevant impact on observed effect size.
-
Missing data have been imputed by appropriate methods.
-
-
High risk:
-
Reasons for missing outcome data likely to be related to true outcome, with imbalance in numbers or reasons for missing data across intervention groups.
-
For dichotomous outcome data, the proportion of missing outcomes compared with observed event risk is enough to induce clinically relevant bias in intervention effect estimate.
-
For continuous outcome data, plausible effect size (difference in means or standardized difference in means) among missing outcomes is enough to induce clinically relevant bias in observed effect size.
-
"As‐treated" analysis done with substantial departure of the intervention received from that assigned at randomization.
-
Potentially inappropriate application of simple imputation.
-
-
Unclear risk: No or unclear information is provided.
5. Selective reporting (reporting bias)
For each included trial, we planned to describe how we investigated the risk of selective outcome reporting bias and what we found. We planned to access all protocols of the included trials through a search of clinical trials registries (clinicaltrials.gov; controlled‐trials.com; and who.int/ictrp) and by direct contact with trial authors.
We planned to assess the methods as follows.
-
Low risk: The study protocol is available, and all of the trial's prespecified (primary and secondary) outcomes of interest in the review have been reported in the prespecified way; or the study protocol is not available, but it is clear that published reports include all expected outcomes, including those that were prespecified (convincing text of this nature may be uncommon).
-
High risk: Not all of the trial's prespecified primary outcomes have been reported; one or more primary outcomes are reported using measurements, analysis methods or subsets of the data (e.g. subscales) that were not prespecified; one or more reported primary outcomes were not prespecified (unless clear justification for their reporting is provided, such as an unexpected adverse effect); one or more outcomes of interest in the review are reported incompletely so that they cannot be entered in a meta‐analysis; the study report fails to include results for a key outcome that would be expected to have been reported for such a trial.
-
Unclear risk: No or unclear information is provided (the study protocol is not available).
6. Other potential sources of bias (other bias)
For each included trial, we planned to describe any important concerns that we had about other possible sources of bias (e.g. whether a potential source of bias is related to the specific study design used).
We planned to assess whether each trial was free of other problems that could put it at risk of bias as follows.
-
Low risk: The trial appears to be free of other sources of bias.
-
High risk: The trial has at least one important risk of bias (e.g. the trial had a potential source of bias related to the specific study design used or has been claimed to have been fraudulent or had some other problem).
-
Unclear risk: Risk of bias may be present, but information is insufficient for assessment of whether an important risk of bias exists, or rationale or evidence is insufficient to suggest that an identified problem will introduce bias.

Study flow diagram: review update.

Risk of bias summary: review authors' judgements about each risk of bias item for each included study.
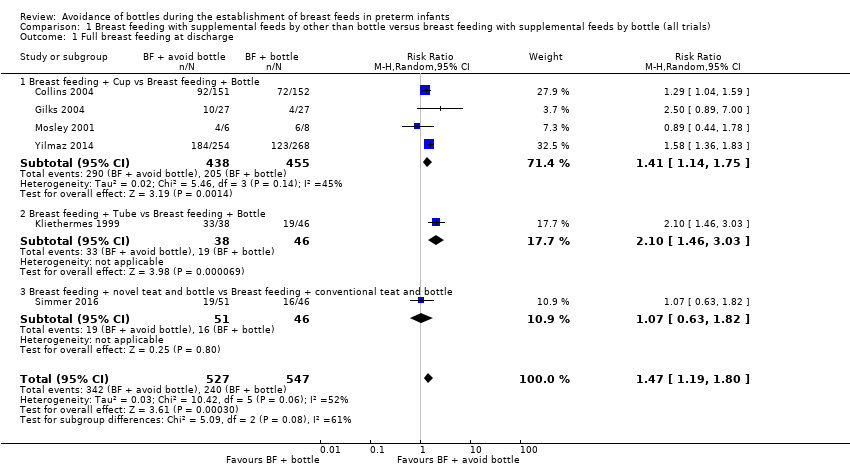
Comparison 1 Breast feeding with supplemental feeds by other than bottle versus breast feeding with supplemental feeds by bottle (all trials), Outcome 1 Full breast feeding at discharge.
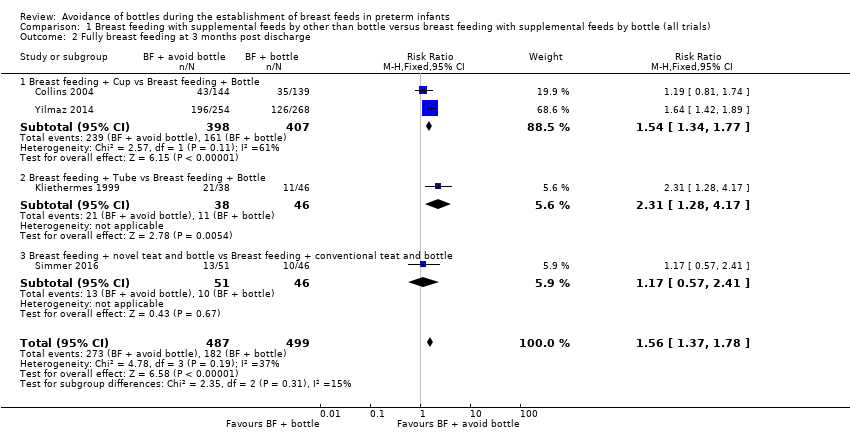
Comparison 1 Breast feeding with supplemental feeds by other than bottle versus breast feeding with supplemental feeds by bottle (all trials), Outcome 2 Fully breast feeding at 3 months post discharge.
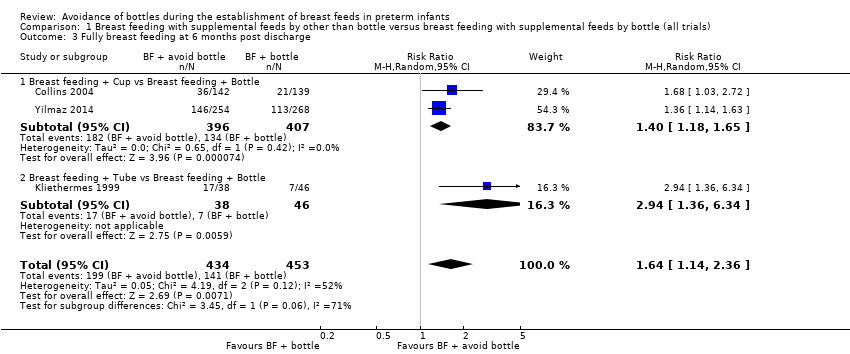
Comparison 1 Breast feeding with supplemental feeds by other than bottle versus breast feeding with supplemental feeds by bottle (all trials), Outcome 3 Fully breast feeding at 6 months post discharge.
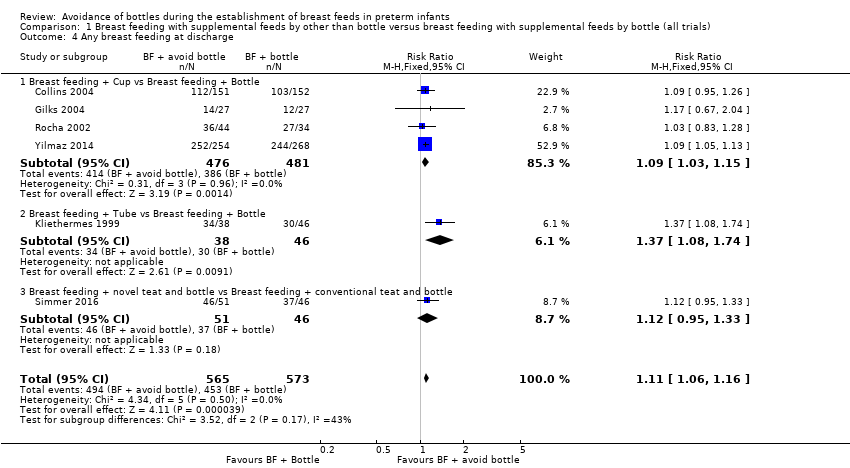
Comparison 1 Breast feeding with supplemental feeds by other than bottle versus breast feeding with supplemental feeds by bottle (all trials), Outcome 4 Any breast feeding at discharge.

Comparison 1 Breast feeding with supplemental feeds by other than bottle versus breast feeding with supplemental feeds by bottle (all trials), Outcome 5 Any breast feeding at 3 months post discharge.

Comparison 1 Breast feeding with supplemental feeds by other than bottle versus breast feeding with supplemental feeds by bottle (all trials), Outcome 6 Any breast feeding at 6 months post discharge.

Comparison 1 Breast feeding with supplemental feeds by other than bottle versus breast feeding with supplemental feeds by bottle (all trials), Outcome 7 Days to reach full sucking feeds.
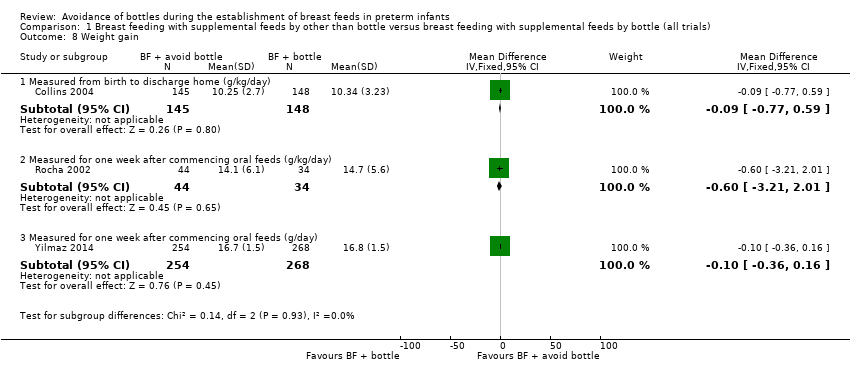
Comparison 1 Breast feeding with supplemental feeds by other than bottle versus breast feeding with supplemental feeds by bottle (all trials), Outcome 8 Weight gain.
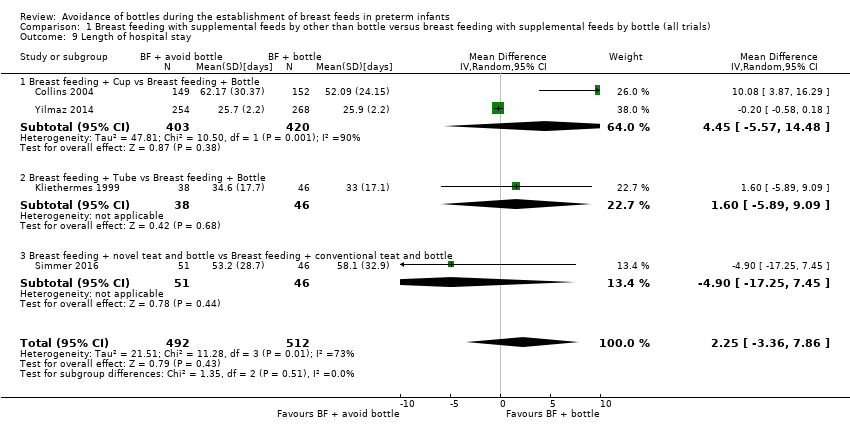
Comparison 1 Breast feeding with supplemental feeds by other than bottle versus breast feeding with supplemental feeds by bottle (all trials), Outcome 9 Length of hospital stay.
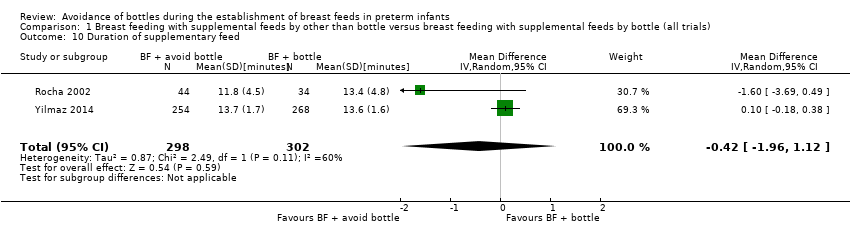
Comparison 1 Breast feeding with supplemental feeds by other than bottle versus breast feeding with supplemental feeds by bottle (all trials), Outcome 10 Duration of supplementary feed.
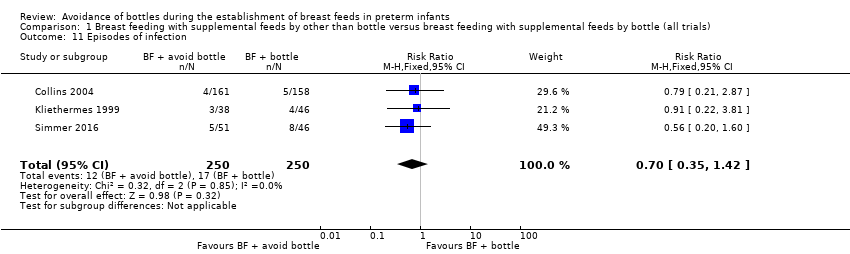
Comparison 1 Breast feeding with supplemental feeds by other than bottle versus breast feeding with supplemental feeds by bottle (all trials), Outcome 11 Episodes of infection.
| Breast feeding with supplemental feeds by other than bottle compared with breast feeding with supplemental feeds by bottle (all trials) in preterm infants | ||||||
| Patient or population: preterm infants | ||||||
| Outcomes | Anticipated absolute effects* (95% CI) | Relative effect | No. of participants | Quality of the evidence | Comments | |
| Risk with breast feeding with supplemental feeds by bottle (all trials) | Risk with breast feeding with supplemental feeds by other than bottle | |||||
| Full breast feeding at discharge | Study population | RR 1.47 | 1074 | ⊕⊕⊝⊝ | ||
| 44 per 100 | 64 per 100 | |||||
| Full breast feeding at 3 months post discharge | Study population | RR 1.56 | 986 | ⊕⊕⊕⊝ | ||
| 36 per 100 | 57 per 100 | |||||
| Full breast feeding at 6 months post discharge | Study population | RR 1.64 | 887 | ⊕⊕⊝⊝ | ||
| 31 per 100 | 51 per 100 | |||||
| Any breast feeding at discharge | Study population | RR 1.11 | 1138 | ⊕⊕⊕⊝ | ||
| 79 per 100 | 88 per 100 | |||||
| Any breast feeding at 3 months post discharge | Study population | RR 1.31 | 1063 | ⊕⊝⊝⊝ | ||
| 60 per 100 | 78 per 100 | |||||
| Any breast feeding at 6 months post discharge | Study population | RR 1.25 | 886 | ⊕⊝⊝⊝ | ||
| 45 per 100 | 56 per 100 | |||||
| Length of hospital stay | MD 2.25 higher | ‐ | 1004 | ⊕⊝⊝⊝ | ||
| Episodes of infection | Study population | RR 0.70 | 500 | ⊕⊕⊕⊝ | ||
| 7 per 100 | 5 per 100 | |||||
| *The risk in the intervention group (and its 95% confidence interval) is based on the assumed risk in the comparison group and the relative effect of the intervention (and its 95% CI). | ||||||
| GRADE Working Group grades of evidence | ||||||
| aAttrition bias (14% and 15% attrition in two included studies). bModerate heterogeneity (I2 = 52%). cModerate heterogeneity (I2 = 73%). dModerate heterogeneity (I2 = 71%). | ||||||
| Outcome or subgroup title | No. of studies | No. of participants | Statistical method | Effect size |
| 1 Full breast feeding at discharge Show forest plot | 6 | 1074 | Risk Ratio (M‐H, Random, 95% CI) | 1.47 [1.19, 1.80] |
| 1.1 Breast feeding + Cup vs Breast feeding + Bottle | 4 | 893 | Risk Ratio (M‐H, Random, 95% CI) | 1.41 [1.14, 1.75] |
| 1.2 Breast feeding + Tube vs Breast feeding + Bottle | 1 | 84 | Risk Ratio (M‐H, Random, 95% CI) | 2.10 [1.46, 3.03] |
| 1.3 Breast feeding + novel teat and bottle vs Breast feeding + conventional teat and bottle | 1 | 97 | Risk Ratio (M‐H, Random, 95% CI) | 1.07 [0.63, 1.82] |
| 2 Fully breast feeding at 3 months post discharge Show forest plot | 4 | 986 | Risk Ratio (M‐H, Fixed, 95% CI) | 1.56 [1.37, 1.78] |
| 2.1 Breast feeding + Cup vs Breast feeding + Bottle | 2 | 805 | Risk Ratio (M‐H, Fixed, 95% CI) | 1.54 [1.34, 1.77] |
| 2.2 Breast feeding + Tube vs Breast feeding + Bottle | 1 | 84 | Risk Ratio (M‐H, Fixed, 95% CI) | 2.31 [1.28, 4.17] |
| 2.3 Breast feeding + novel teat and bottle vs Breast feeding + conventional teat and bottle | 1 | 97 | Risk Ratio (M‐H, Fixed, 95% CI) | 1.17 [0.57, 2.41] |
| 3 Fully breast feeding at 6 months post discharge Show forest plot | 3 | 887 | Risk Ratio (M‐H, Random, 95% CI) | 1.64 [1.14, 2.36] |
| 3.1 Breast feeding + Cup vs Breast feeding + Bottle | 2 | 803 | Risk Ratio (M‐H, Random, 95% CI) | 1.40 [1.18, 1.65] |
| 3.2 Breast feeding + Tube vs Breast feeding + Bottle | 1 | 84 | Risk Ratio (M‐H, Random, 95% CI) | 2.94 [1.36, 6.34] |
| 4 Any breast feeding at discharge Show forest plot | 6 | 1138 | Risk Ratio (M‐H, Fixed, 95% CI) | 1.11 [1.06, 1.16] |
| 4.1 Breast feeding + Cup vs Breast feeding + Bottle | 4 | 957 | Risk Ratio (M‐H, Fixed, 95% CI) | 1.09 [1.03, 1.15] |
| 4.2 Breast feeding + Tube vs Breast feeding + Bottle | 1 | 84 | Risk Ratio (M‐H, Fixed, 95% CI) | 1.37 [1.08, 1.74] |
| 4.3 Breast feeding + novel teat and bottle vs Breast feeding + conventional teat and bottle | 1 | 97 | Risk Ratio (M‐H, Fixed, 95% CI) | 1.12 [0.95, 1.33] |
| 5 Any breast feeding at 3 months post discharge Show forest plot | 5 | 1063 | Risk Ratio (M‐H, Random, 95% CI) | 1.31 [1.01, 1.71] |
| 5.1 Breast feeding + Cup vs Breast feeding + Bottle | 3 | 883 | Risk Ratio (M‐H, Random, 95% CI) | 1.24 [0.89, 1.71] |
| 5.2 Breast feeding + Tube vs Breast feeding + Bottle | 1 | 83 | Risk Ratio (M‐H, Random, 95% CI) | 1.69 [1.19, 2.41] |
| 5.3 Breast feeding + novel teat and bottle vs Breast feeding + conventional teat and bottle | 1 | 97 | Risk Ratio (M‐H, Random, 95% CI) | 1.20 [0.80, 1.80] |
| 6 Any breast feeding at 6 months post discharge Show forest plot | 3 | 886 | Risk Ratio (M‐H, Fixed, 95% CI) | 1.25 [1.10, 1.41] |
| 6.1 Breast feeding + Cup vs Breast feeding + Bottle | 2 | 803 | Risk Ratio (M‐H, Fixed, 95% CI) | 1.20 [1.06, 1.36] |
| 6.2 Breast feeding + Tube vs Breast feeding + Bottle | 1 | 83 | Risk Ratio (M‐H, Fixed, 95% CI) | 2.07 [1.18, 3.64] |
| 7 Days to reach full sucking feeds Show forest plot | 3 | 429 | Mean Difference (IV, Random, 95% CI) | 2.56 [‐7.17, 12.28] |
| 7.1 Breast feeding + Cup vs Breast feeding + Bottle | 2 | 332 | Mean Difference (IV, Random, 95% CI) | 5.08 [‐6.43, 16.59] |
| 7.2 Breast feeding + novel teat and bottle vs Breast feeding + conventional teat and bottle | 1 | 97 | Mean Difference (IV, Random, 95% CI) | ‐4.0 [‐15.63, 7.63] |
| 8 Weight gain Show forest plot | 3 | Mean Difference (IV, Fixed, 95% CI) | Subtotals only | |
| 8.1 Measured from birth to discharge home (g/kg/day) | 1 | 293 | Mean Difference (IV, Fixed, 95% CI) | ‐0.09 [‐0.77, 0.59] |
| 8.2 Measured for one week after commencing oral feeds (g/kg/day) | 1 | 78 | Mean Difference (IV, Fixed, 95% CI) | ‐0.60 [‐3.21, 2.01] |
| 8.3 Measured for one week after commencing oral feeds (g/day) | 1 | 522 | Mean Difference (IV, Fixed, 95% CI) | ‐0.10 [‐0.36, 0.16] |
| 9 Length of hospital stay Show forest plot | 4 | 1004 | Mean Difference (IV, Random, 95% CI) | 2.25 [‐3.36, 7.86] |
| 9.1 Breast feeding + Cup vs Breast feeding + Bottle | 2 | 823 | Mean Difference (IV, Random, 95% CI) | 4.45 [‐5.57, 14.48] |
| 9.2 Breast feeding + Tube vs Breast feeding + Bottle | 1 | 84 | Mean Difference (IV, Random, 95% CI) | 1.60 [‐5.89, 9.09] |
| 9.3 Breast feeding + novel teat and bottle vs Breast feeding + conventional teat and bottle | 1 | 97 | Mean Difference (IV, Random, 95% CI) | ‐4.90 [‐17.25, 7.45] |
| 10 Duration of supplementary feed Show forest plot | 2 | 600 | Mean Difference (IV, Random, 95% CI) | ‐0.42 [‐1.96, 1.12] |
| 11 Episodes of infection Show forest plot | 3 | 500 | Risk Ratio (M‐H, Fixed, 95% CI) | 0.70 [0.35, 1.42] |