Selenium untuk mencegah kanser
Abstract
Background
This review is the third update of the Cochrane review "Selenium for preventing cancer". Selenium is a naturally occurring element with both nutritional and toxicological properties. Higher selenium exposure and selenium supplements have been suggested to protect against several types of cancer.
Objectives
To gather and present evidence needed to address two research questions:
1. What is the aetiological relationship between selenium exposure and cancer risk in humans?
2. Describe the efficacy of selenium supplementation for cancer prevention in humans.
Search methods
We updated electronic searches of the Cochrane Central Register of Controlled Trials (CENTRAL; 2017, Issue 2), MEDLINE (Ovid, 2013 to January 2017, week 4), and Embase (2013 to 2017, week 6), as well as searches of clinical trial registries.
Selection criteria
We included randomised controlled trials (RCTs) and longitudinal observational studies that enrolled adult participants.
Data collection and analysis
We performed random‐effects (RE) meta‐analyses when two or more RCTs were available for a specific outcome. We conducted RE meta‐analyses when five or more observational studies were available for a specific outcome. We assessed risk of bias in RCTs and in observational studies using Cochrane's risk assessment tool and the Newcastle‐Ottawa Scale, respectively. We considered in the primary analysis data pooled from RCTs with low risk of bias. We assessed the certainty of evidence by using the GRADE approach.
Main results
We included 83 studies in this updated review: two additional RCTs (10 in total) and a few additional trial reports for previously included studies. RCTs involved 27,232 participants allocated to either selenium supplements or placebo. For analyses of RCTs with low risk of bias, the summary risk ratio (RR) for any cancer incidence was 1.01 (95% confidence interval (CI) 0.93 to 1.10; 3 studies, 19,475 participants; high‐certainty evidence). The RR for estimated cancer mortality was 1.02 (95% CI 0.80 to 1.30; 1 study, 17,448 participants). For the most frequently investigated site‐specific cancers, investigators provided little evidence of any effect of selenium supplementation. Two RCTs with 19,009 participants indicated that colorectal cancer was unaffected by selenium administration (RR 0.99, 95% CI 0.69 to 1.43), as were non‐melanoma skin cancer (RR 1.16, 95% CI 0.30 to 4.42; 2 studies, 2027 participants), lung cancer (RR 1.16, 95% CI 0.89 to 1.50; 2 studies, 19,009 participants), breast cancer (RR 2.04, 95% CI 0.44 to 9.55; 1 study, 802 participants), bladder cancer (RR 1.07, 95% CI 0.76 to 1.52; 2 studies, 19,009 participants), and prostate cancer (RR 1.01, 95% CI 0.90 to 1.14; 4 studies, 18,942 participants). Certainty of the evidence was high for all of these cancer sites, except for breast cancer, which was of moderate certainty owing to imprecision, and non‐melanoma skin cancer, which we judged as moderate certainty owing to high heterogeneity. RCTs with low risk of bias suggested increased melanoma risk.
Results for most outcomes were similar when we included all RCTs in the meta‐analysis, regardless of risk of bias. Selenium supplementation did not reduce overall cancer incidence (RR 0.99, 95% CI 0.86 to 1.14; 5 studies, 21,860 participants) nor mortality (RR 0.81, 95% CI 0.49 to 1.32; 2 studies, 18,698 participants). Summary RRs for site‐specific cancers showed limited changes compared with estimates from high‐quality studies alone, except for liver cancer, for which results were reversed.
In the largest trial, the Selenium and Vitamin E Cancer Trial, selenium supplementation increased risks of alopecia and dermatitis, and for participants with highest background selenium status, supplementation also increased risk of high‐grade prostate cancer. RCTs showed a slightly increased risk of type 2 diabetes associated with supplementation. A hypothesis generated by the Nutritional Prevention of Cancer Trial ‐ that individuals with low blood selenium levels could reduce their risk of cancer (particularly prostate cancer) by increasing selenium intake ‐ has not been confirmed. As RCT participants have been overwhelmingly male (88%), we could not assess the potential influence of sex or gender.
We included 15 additional observational cohort studies (70 in total; over 2,360,000 participants). We found that lower cancer incidence (summary odds ratio (OR) 0.72, 95% CI 0.55 to 0.93; 7 studies, 76,239 participants) and lower cancer mortality (OR 0.76, 95% CI 0.59 to 0.97; 7 studies, 183,863 participants) were associated with the highest category of selenium exposure compared with the lowest. Cancer incidence was lower in men (OR 0.72, 95% CI 0.46 to 1.14, 4 studies, 29,365 men) than in women (OR 0.90, 95% CI 0.45 to 1.77, 2 studies, 18,244 women). Data show a decrease in risk of site‐specific cancers for stomach, colorectal, lung, breast, bladder, and prostate cancers. However, these studies have major weaknesses due to study design, exposure misclassification, and potential unmeasured confounding due to lifestyle or nutritional factors covarying with selenium exposure beyond those taken into account in multi‐variable analyses. In addition, no evidence of a dose‐response relation between selenium status and cancer risk emerged. Certainty of evidence was very low for each outcome. Some studies suggested that genetic factors might modify the relation between selenium and cancer risk ‐ an issue that merits further investigation.
Authors' conclusions
Well‐designed and well‐conducted RCTs have shown no beneficial effect of selenium supplements in reducing cancer risk (high certainty of evidence). Some RCTs have raised concerns by reporting a higher incidence of high‐grade prostate cancer and type 2 diabetes in participants with selenium supplementation. No clear evidence of an influence of baseline participant selenium status on outcomes has emerged in these studies.
Observational longitudinal studies have shown an inverse association between selenium exposure and risk of some cancer types, but null and direct relations have also been reported, and no systematic pattern suggesting dose‐response relations has emerged. These studies suffer from limitations inherent to the observational design, including exposure misclassification and unmeasured confounding.
Overall, there is no evidence to suggest that increasing selenium intake through diet or supplementation prevents cancer in humans. However, more research is needed to assess whether selenium may modify the risk of cancer in individuals with a specific genetic background or nutritional status, and to investigate possible differential effects of various forms of selenium.
PICO
Ringkasan bahasa mudah
Selenium untuk mencegah kanser
Soalan ulasan
Kami mengulas bukti yang menyiasat hubung kait antara pengambilan selenium dengan pencegahan kanser. Ulasan ini mengemas kini ulasan Cochrane yang terbaharu topik ini (Vinceti 2014), yang merupakan kemas kini kepada Dennert 2011.
Latar belakang
Selenium adalah satu unsur semula jadi yang mana individu‐individu terdedah kepadanya melalui pengambilan makanan, walaupun pendedahan juga boleh berlaku melalui udara, air minuman dan tambahan diet. Selenium dalam amaun yang kecil adalah penting untuk beberapa fungsi biologi manusia, tetapi jumlah yang lebih tinggi boleh menimbulkan risiko ketoksikan, menjadikan selenium satu unsur dengan julat pendedahan selamat yang sempit tetapi tidak jelas. Selenium wujud dalam pelbagai bentuk kimia dengan aktiviti biologi yang berlainan. Sejak akhir 1960an, beberapa kajian pengamatan melaporkan orang dengan paras selenium yang tinggi dalam diet atau tisu‐tisu badan berisiko kanser lebih rendah, dan beberapa kajian makmal menunjukkan selenium boleh merencatkan pertumbuhan sel‐sel kanser. Ini membawa kepada minat yang meluas dalam penambahan selenium dan tuntutan pengambilan tambahan tersebut boleh mencegah kanser. Sejak itu, lebih banyak kajian pengamatan telah dijalankan untuk membandingkan kadar kanser antara individu‐individu dengan pendedahan selenium yang tinggi dan rendah. Terbaharu, beberapa kajian rawak terkawal yang direka untuk menilai sama ada penambahan selenium dapat mencegah kanser telah dijalankan. Kajian‐kajian ini memain peranan penting dalam meningkatkan kefahaman terhadap hubung kait antara selenium dan risiko kanser, kerana reka bentuk kajian tersebut lebih mantap berbanding kajian pengamatan. Kajian‐kajian terkini khususnya telah menunjukkan kualiti metodologi dan kuasa statistik yang tinggi. Beberapa kajian memfokus sama ada selenium boleh mencegah kanser prostat.
Ciri‐ciri kajian
Ulasan ini memasukkan10 kajian di mana orang dewasa dibahagikan secara rawak untuk menerima selenium tambahan atau plasebo, dan 70 kajian pengamatan di mana orang dewasa telah disusul untuk satu jangka masa bagi menentukan sama ada status dasar selenium mereka berkait dengan risiko kanser. Bukti adalah terkini sehingga Januari 2017.
Keputusan‐keputusan utama
Kesemua kajian rawak yang berkualiti tinggi melaporkan tiada kesan selenium dalam mengurangkan risiko kanser secara keseluruhan atau risiko kanser‐kanser tertentu, termasuk hasil yang paling disiasat ‐ kanser prostat. Tanpa diduga beberapa kajian mencadangkan selenium mungkin meningkatkan risiko kanser prostat gred tinggi, diabetes jenis 2, dan ketaknormalan dermatologi.
Kajian pengamatan telah menghasilkan bukti yang tidak konsisten mengenai kemungkinan kesan pendedahan selenium terhadap risiko kanser, tanpa bukti hubungan dos‐respons. Apabila kami gabungkan keputusan‐keputusan kajian‐kajian, secara keselluruhan ia mencadangkan hubungan songsang antara pendedahan kanser dengan insiden kanser atau kanser‐kanser tertentu, seperti kanser kolon dan prostat. Walau bagaimanapun, kajian pengamatan mempunyai kelemahan‐kelemahan yang besar. Status pendedahan selenium peserta mungkin telah tersalah klasifikasi akibat keterbatasan petunjuk pendedahan selenium yang digunakan, serta ketidakpastian spesies selenium yang menyumbang kepada pendedahan keseluruhan. Tambahan pula, pembauran tidak terukur dari faktor gaya hidup dan nutrisi ‐ satu sumber bias yang utama dalam kajian epidemiologi nutrisi berbentuk pengamatan ‐ mungkin wujud. Oleh itu, kesahihan internal kajian‐kajian ini adalah terhad.
Terkini, hipotesis peningkatan pengambilan selenium mungkin mengurangkan risiko kanser tidak disokong oleh bukti epidemiologi. Penyelidikan tambahan adalah diperlukan untuk menilai sama ada selenium boleh mempengaruhi risiko kanser dalam kalangan individu yang mempunyai latar belakang genetik atau status nutrisi tertentu, dan untuk menentukan bagaimana pelbagai bentuk kimia sebatian selenium mempunyai kesan yang berlainan kepada risiko kanser.
Authors' conclusions
Summary of findings
| Highest compared with lowest selenium exposure for preventing cancer in randomised controlled studies with low risk of bias | ||||||
| Patient or population: Participants in trials with low risk of bias | ||||||
| Outcomes | Relative effect | Anticipated absolute effects* (95% CI) | Quality of the evidence | Comments | ||
| Without highest | With highest | Difference | ||||
| Any cancer risk | RR 1.01 | Study population | ⊕⊕⊕⊕ | SELECT study had the strongest influence on the effect estimate. The RR in all RCTs is 0.99 (95% CI 0.86 to 1.14). | ||
| 10.0% | 10.1% | 0.1% more | ||||
| Cancer mortality risk | RR 1.02 | Study population | ⊕⊕⊕⊕ | The effect is led from the study SELECT. The RR in all RCTs is 0.81 (95% CI 0.49 to 1.32). | ||
| 1.4% | 1.5% | 0.0% more | ||||
| Colorectal cancer risk | RR 0.99 | Study population | ⊕⊕⊕⊕ | SELECT study had the strongest influence on the effect estimate. The RR in all RCTs is 0.74 (95% CI 0.41 to 1.33). | ||
| 0.7% | 0.7% | 0.0% fewer | ||||
| Non‐melanoma skin cancer risk | RR 1.16 | Study population | ⊕⊕⊕⊝ | Pooled estimate is imprecise owing to high heterogeneity. The RR in all RCTs is 1.23 (95% CI 0.73 to 2.08). | ||
| 2.9% | 3.4% | 0.5% more | ||||
| Lung cancer risk | RR 1.16 | Study population | ⊕⊕⊕⊕ | The RR in all RCTs is 1.03 (95% CI 0.78 to 1.37). | ||
| 1.0% | 1.2% | 0.2% more | ||||
| Breast cancer risk | RR 2.04 | Study population | ⊕⊕⊕⊝ | The RR in all RCTs is 1.44 (95% CI 0.96 to 2.17). | ||
| 0.7% | 1.5% | 0.8% more | ||||
| Bladder cancer risk | RR 1.07 | Study population | ⊕⊕⊕⊕ | SELECT study had the strongest influence on the effect estimate. The RR in all RCTs is 1.10 (95% CI 0.79 to 1.52). | ||
| 0.6% | 0.7% | 0.0% fewer | ||||
| Prostate cancer risk | RR 1.01 | Study population | ⊕⊕⊕⊕ | SELECT study had the strongest influence on the effect estimate. The RR in all RCTs is 0.91 (95% CI 0.75 to 1.12). | ||
| 5.4% | 5.4% | 0.1% more | ||||
| *The risk in the intervention group (and its 95% confidence interval) is based on the assumed risk in the comparison group and the relative effect of the intervention (and its 95% CI). | ||||||
| GRADE Working Group grades of evidence. | ||||||
| aDowngraded one level for moderate heterogeneity (tau² = 0.69, I² = 72%, P = 0.06) not explained. | ||||||
| Highest compared with lowest selenium exposure for preventing cancer in observational studies | ||
| Patient or population: Participants in non experimental cohort studies on selenium and cancer | ||
| Outcomes | Relative effect | Certainty of the evidence |
| Any cancer risk No. of participants: 76,239 | OR 0.72 | ⊕⊝⊝⊝ |
| Cancer mortality risk No. of participants: 183,863 | OR 0.76 (0.59 to 0.97) | ⊕⊝⊝⊝ |
| Colorectal cancer risk No. of participants: 712,746 | OR 0.82 | ⊕⊝⊝⊝ |
| Lung cancer risk No. of participants: 371,067 | OR 0.82 | ⊕⊝⊝⊝ |
| Breast cancer risk (women) No. of participants: 169,028 | OR 1.09 | ⊕⊝⊝⊝ |
| Bladder cancer risk No. of participants: 279,100 | OR 0.67 | ⊕⊝⊝⊝ |
| Prostate cancer risk No. of participants: 576,667 | OR 0.84 | ⊕⊝⊝⊝ |
| CI: confidence interval; OR: odds ratio. | ||
| GRADE Working Group grades of evidence. | ||
| aDowngraded one level owing to risk of bias, which we deemed as serious because of inability to rule out unmeasured confounding, particularly from lifestyle or nutritional factors that might covary with selenium exposure beyond those factors taken into account in the multi‐variable analyses. | ||
Background
This review is the third update of the Cochrane review titled "Selenium for preventing cancer" (Dennert 2011; Vinceti 2014).
Description of the condition
Cancer is a leading cause of death worldwide (WHO 2017). According to estimates of the International Agency for Cancer Research, 14.1 million people developed and 8.2 million died of cancer in 2012, and more than half of all new cases occurred in less developed regions of the world (IARC 2014).
The role of diet and nutrition in carcinogenesis and cancer prevention and the identification of nutritional factors and supplements with cancer preventive properties have been areas of active research for decades. Dietary factors that reduce cancer risk would clearly have major public health implications, but unfortunately, investigations into supplementation of various vitamins, trace elements, and other dietary constituents have typically yielded disappointing and even troubling results (Bjelakovic 2014; Fortmann 2013; Guallar 2013; Rocourt 2013; Schwingshackl 2017). Selenium is one of these nutritional factors (Vinceti 2013b).
Description of the intervention
The element selenium has received considerable attention as a potential cancer preventive agent, at least in populations with low intake. Selenium is recognised as nutritionally essential for humans, but it is toxic at levels slightly higher than those required for health, with a narrow and still not well‐defined safe range of intake (Jablonska 2015a; Vinceti 2017a). Whether selenium provides various health benefits (including a cancer preventive effect) beyond its essential nutritional role continues to be a matter of debate (Allingstrup 2015; Bodnar 2012; Brigelius‐Flohe 2017; Fortmann 2013; Karp 2013; Lippman 2009, in: SELECT 2009; Rayman 2012; Stranges 2010;Vinceti 2013a; Vinceti 2013b; Vinceti 2014a; Vinceti 2017a; Visser 2017; Wichman 2016). Humans usually ingest this trace element with crop, animal products, fish, and seafood, and sometimes in supplements (Hurst 2013a; Vinceti 2017a).
Chemical forms and concentrations of selenium in environmental matrices, foods, drinking water, and other sources of exposure vary considerably (Fairweather‐Tait 2011). Selenium species can be classified into organically bound selenium forms (e.g. selenomethionine, selenocysteine) and inorganic forms (e.g. selenate, selenite) (Gammelgaard 2011; Weekley 2013). Organically bound selenium is present in the large number of selenoproteins identified in living organisms including humans, although the exact activity of some of these proteins remains to be identified (Brigelius‐Flohe 2017; Hatfield 2014; Labunskyy 2014). Selenium yeast refers to a selenium‐enriched yeast medium that usually contains selenium that is almost entirely organically bound, along with a high proportion of selenomethionine (Block 2004; Rayman 2004).
Recommended intake of selenium varies considerably among different regulatory agencies and scientific authorities (Vinceti 2017a). For example, the USA Institute of Medicine recommends daily intake of 55 µg/d for adults (Institute of Medicine 2009), whereas the World Health Organization (WHO) recommends amounts ranging from 25 to 34 µg/d, depending on age and sex (WHO 2004). More generally, international bodies have recommended amounts ranging from 25 to 70 µg/d for the adult population (Vinceti 2017a). The main reason for these differences in recommendations is the differing value and weight given to the proteomic effects of selenium, in particular whether or not selenoproteins sensitive to selenium supply must be up regulated to their maximal level, and whether any adverse health effects may arise at lower selenium intakes than those required to maximise selenoprotein expression (Jablonska 2015a; Vinceti 2017a). In addition, these standards generally do not take into account the chemical forms nor the source of selenium (diet, drinking water, air, etc.), despite established relevance of selenium speciation in addressing and assessing the health effects of this element (Vinceti 2013a; Vinceti 2013c; Weekley 2013; Vinceti 2017d).
To prevent adverse effects due to excessive selenium intake, the USA Institute of Medicine has set the tolerable upper intake level at 400 µg/d for adults (Office of Dietary Supplements 2009). However, recent epidemiological studies suggest overt human toxicity at lower intake levels (Lippman 2009, in: SELECT 2009; Stranges 2007; Vinceti 2017a), and lower upper safe levels have already been proposed (Tsubota‐Utsugi 2012). In addition to the acute and chronic toxicity of high selenium exposure, possible harmful effects of long‐term overexposure to lower dosages have been a matter of concern. However, these effects, such as those affecting the endocrine system, remain inadequately investigated (Vinceti 2001; Vinceti 2017a). Furthermore, evidence shows different biological activities of the various organic and inorganic forms of selenium (Hazane‐Puch 2013; Mandrioli 2017; Vinceti 2013c; Vinceti 2017d; Weekley 2013), emphasising the need to better characterise the specific toxicological and nutritional properties of each selenium species in humans, in animals, and in the environment. Recent publications have questioned the adequacy of the current upper safe limit of intake (Jablonska 2015a; Jerome‐Morais 2011; Marschall 2017; Morris 2013; Moyad 2012; Rocourt 2013; Sacco 2013; Vinceti 2013b; Vinceti 2017a) and have espoused the need to set different limits for the many different sources of organic and inorganic selenium. On the other hand, other investigators have described claims of widespread deficient intake of selenium (Hughes 2016).
Accurate estimation of selenium exposure in epidemiological studies presents several challenges. Individual exposure is typically assessed by using peripheral biomarkers of exposure, such as blood (usually plasma or serum) or nail concentrations, or by estimating dietary intake (Ashton 2009). Each of these methods has strengths and limitations and has had its validity questioned (Ashton 2009; Haldimann 1996; Vinceti 2013b). However, levels of selenium in peripheral biomarkers such as blood, toenail, and hair have been found to correlate to a moderate degree with dietary intake as assessed through self‐reported consumption of supplements, food frequency questionnaires, and dietary records (Hurst 2013a; Longnecker 1996; Ovaskainen 1993; Pestitschek 2013; van den Brandt 1993). Stronger correlation has been seen at high intake levels (Morris 2013), although results of some studies were not consistent (Hunter 1990; Karita 2003; Satia 2006; Vinceti 2012). Assessment of selenium levels in specific body tissues is extremely complex, as these levels are not necessarily homogeneously reflected by all biomarkers because overall selenium exposure, as well as its chemical forms and other factors, influences distribution of the metalloid into various body compartments (Behne 1996; Behne 2010; Panter 1996; Vinceti 2000; Vinceti 2013c). For example, circulating levels of some selenium species and of total selenium did not correlate with selenium content in the central nervous system as assessed by cerebrospinal fluid concentrations (Solovyev 2013; Vinceti 2013c), indicating both the tissue‐specific significance of biomarkers and the importance of selenium speciation when the distribution of selenium in different body compartments, representing target organs for different diseases, is assessed.
Selenium levels found in human specimens and characterising intake of selenium show high global variability due to variation in factors such as dietary habits, food and soil selenium content, ethnicity, sex, age, individual metabolism, occupational exposure, exposure to coal and other sources of combustion, and smoking (Fairweather‐Tait 2011; Haldimann 1996; Jablonska 2013; Rayman 2008). It is interesting to note that smoking tends to lower selenium biomarker concentrations, even though smoking is a source of selenium exposure ‐ a phenomenon that might be related to increased excretion of the metalloid due to interaction with cadmium or other heavy metals (Jossa 1991; Kafai 2003). Globally, inconsistencies have been noted as to how these factors are associated with selenium levels (Haldimann 1996; Vinceti 2000). For example, selenium levels increased with age in women, but not in men, in the French SU.VI.M.AX cohort study (Arnaud 2007), but decreased with age in a female population in Ohio (Smith 2000); however, two studies in Switzerland and Austria could not find an association between age and selenium status among individuals of either sex (Burri 2008; Gundacker 2006). Sex‐specific nutritional and health behaviours, as well as sex‐specific differences in selenium metabolism and distribution across various body compartments, may contribute to observed discrepancies in selenium levels between men and women (Combs 2012; Rodriguez 1995).
How the intervention might work
The ability of selenium to counteract cancer cell growth as observed in a large number of laboratory studies may be due to its effects on DNA stability, cell proliferation, necrotic and apoptotic cell death in healthy and malignant cells, and/or regulation of oxidative stress and the immune system (for reviews, see: Fernandes 2015; Misra 2015). These abilities have suggested the possible utility of selenium compounds not only for cancer prevention but also for cancer therapy ‐ a hypothesis that has been under active investigation (Bhattacharjee 2017; Shigemi 2017; Vinceti 2017b). Selenium may be involved in cancer prevention through the antioxidant properties of selenoproteins (Hatfield 2014; Labunskyy 2014), as well as through several other mechanisms (Fernandes 2015; Misra 2015;Weekley 2013). However, laboratory studies have shown that selenium can promote malignant cell transformation and progression (Chen 2000; Kandas 2009; Kasaikina 2013; National Toxicology Program 2011; Novoselov 2005; Rose 2014; Su 2005; Tsuji 2015), thus confirming the complex ‘dual personality’ of both this Janus‐faced element and selenoproteins in preventing and promoting cancer (Hatfield 2014).
In addition, numerous epidemiological studies of observational design, which have reported an inverse association between selenium exposure and cancer risk (Vinceti 2017b), have provided support for the potential of selenium in cancer prevention. The first of these studies used an ecological study design (Schrauzer 1977; Shamberger 1969). These were followed by case‐control and cohort observational studies, then by randomised trials, some of which received substantial attention from both the general public and the scientific community (Brinkman 2006; Fortmann 2013; Steinbrenner 2013; Vinceti 2013b). Some observational and experimental human studies have suggested that sex‐related differences regarding effects of selenium on cancer risk, as well as differences in selenium tissue distribution, tumour biology, and other factors, may explain the possibly greater beneficial effect of selenium for men than for women in the earliest studies (NPCT 2002; Waters 2004).
Why it is important to do this review
Findings of laboratory studies and early epidemiological studies have led to the suggestion that selenium may be involved in central anticarcinogenic processes. This has resulted in widespread marketing of selenium supplements with associated health claims, particularly claims for prevention of cancer (Dennert 2011; Vinceti 2013b), as well as prevention of cardiovascular disease (Rees 2013). However, accumulating evidence suggests that this early optimism may have been unwarranted (Kryscio 2017; Lance 2017; Lu 2016; Ramamoorthy 2015; Vinceti 2017a; Vinceti 2017b). In particular, additional evidence on selenium and cancer risk gathered by high‐quality randomised controlled trials (RCTs) has become available in recent years, and a few observational studies have been published, thus justifying an update on epidemiological evidence regarding selenium exposure and cancer risk. We undertook this updated review to perform a comprehensive synthesis of current epidemiological evidence.
Objectives
To gather and present evidence needed to address two research questions:.
-
What is the aetiological relationship between selenium exposure and cancer risk in humans?
-
Which is the efficacy of selenium supplementation for cancer prevention in humans?
Methods
Criteria for considering studies for this review
Types of studies
We included published randomised controlled trials (RCTs) and observational studies of longitudinal design (i.e. cohort studies and nested case‐control studies), irrespective of publication status or language, provided they were published in extenso. We also included conference abstracts in this review when we were able to retrieve them through citation chasing (Vinceti 2017c).
Types of participants
Adult participants (18 years of age and older).
Types of interventions
We considered RCTs for inclusion if they used selenium supplementation at any dose or route of administration for a minimum of four weeks versus placebo or no intervention. We excluded trials using selenium supplementation as part of a multi‐component preparation if they did not include a study arm using selenium monotherapy supplementation.
We considered prospective observational studies (cohort studies and cohort‐nested and nested case‐control studies) for inclusion if they assessed baseline exposure to selenium in apparently cancer‐free individuals as a biomarker of selenium status or as dietary assessment of selenium intake at study entry, provided that such assessment was based on exposure categories ‐ not just on continuous values.
Types of outcome measures
We systematically analysed all (primary and secondary) outcomes.
Primary outcomes
-
Incidence of any cancer and of site‐specific cancers, assessed as proportions of participants developing cancers during the study period.
-
Mortality from any cancer and from site‐specific cancer, assessed as proportions of participants dying from cancers during the study period.
Secondary outcomes
-
Incidence of selected adverse effects, assessed as proportions of participants developing adverse health conditions (RCTs only).
Search methods for identification of studies
Using the search strategies described previously, we conducted updated electronic searches of the Cochrane Central Register of Controlled Trials (CENTRAL; 2017, Issue 2), MEDLINE (Ovid, 2013 to January 2017, week 4), Embase (2013 to 2017, week 6), CancerLit (cancer literature database; February 2004), and Clinical Contents in Medicine (CCMed; February 2011). We conducted the initial search in 2004 and updated searches in July 2007, January 2009, October 2009, February 2011, February 2013, and February 2017. As MEDLINE now includes the journals indexed in CancerLit no further searches of this database were made after 2004.
We also searched the following online clinical trials databases as in the previous review Vinceti 2014.
-
Clinical Trials of the American Cancer Society (http://www.cancer.gov; February 2011).
-
metaRegister of Controlled Trials (http://www.controlled‐trials.com; February 2011).
-
German Cancer Study Register (http://www.studien.de; February 2011).
-
System for Information on Grey Literature in Europe (SIGLE) (February 2004, discontinued in 2005).
-
International Standard Registered Clinical/Social Study Number (ISRCTN) registry (http://www.isrctn.com; February 2017).
-
ClinicalTrials.gov registry (https://clinicaltrials.gov; February 2017).
We have provided the search strategies in Appendix 1.
Data collection and analysis
Selection of studies
Two review authors independently checked all electronic search results for eligibility. When search results could not be rejected with certainty on the basis of title, abstract, or both, we obtained full‐text material.
We scanned bibliographies of papers retrieved using the described search strategy to identify additional studies. When additional information was needed, we contacted the correspondent authors of included studies; we also asked investigators for information about unpublished RCTs.
Two review authors (MV and TF) independently applied the inclusion and exclusion criteria, if necessary with the assistance of a translator. We resolved disagreements by discussion and with involvement of a third review author (CDG).
Data extraction and management
We used piloted extraction forms for epidemiological studies and RCTs to document data from the original material and to assess the quality of studies. One review author (TF) extracted data, and two review authors (MV and CDG) checked extracted data for discrepancies, which the three review authors (TF, MV, and CDG) then discussed. If several reports from the same study were available, we considered as primary publications studies reporting the entire period of follow‐up with active selenium supplementation, when available, but we also extracted study details and results available from other publications, if they were not reported in the primary study reference.
For comparison of selenium exposure measured in serum and plasma specimens, we converted all data into the unit µg/L. We converted results provided as ppm (parts per million) or µg/g by using the factor 1.026 g/mL (density of blood plasma), and we converted data provided as µmol/L using the factor 78.96 (atomic weight of selenium).
For inclusion, prospective observational studies had to report estimates of risk ratio (RR), such as hazard ratio (HR) or odds ratio (OR), for various selenium category exposure levels. We did not include in the analysis studies reporting only the RR for a one‐unit increase in selenium exposure on a continuous scale.
Assessment of risk of bias in included studies
Randomised controlled trials
We categorised generation of allocation sequence, allocation concealment, blinding, and completeness of outcome data as adequate (low risk of bias), inadequate (high risk of bias), or unclear, according to the criteria specified in the Cochrane Handbook for Systematic Reviews of Interventions and Higgins et al (Higgins 2011a; Higgins 2011b). We considered these four items to be key domains for risk of bias assessment. We considered studies that were categorised as 'adequate' in all four domains to have low risk of bias; and studies with 'inadequate' procedures in one or more key domains to have high risk of bias. We considered studies with 'unclear' procedures in one or more key domains to have unclear risk of bias.
We assessed fulfilment of ethical standards as follows.
-
Was informed consent obtained from participants? (yes/no/unclear).
-
Was approval obtained from an ethics board? (yes/no/unclear).
Observational studies
We assessed risk of bias in observational studies by using assessment forms adapted from the Newcastle‐Ottawa Quality Assessment Scale (NOS) for cohort and case‐control studies (Wells 2004). We used the NOS form for cohort studies for all included observational studies, and the NOS case‐control form for nested case‐control studies. Both forms must be adapted a priori for use in a systematic review according to the research questions examined and the review topic explored. The NOS uses a star system by which studies are judged on key domains pertaining to selection and comparability of study groups, ascertainment of exposure and outcomes, and duration of follow‐up. For each domain, we assigned either a 'star' or 'no star', with a star indicating that study design element was considered adequate and was less likely to introduce bias. A study could receive a maximum of nine stars during the cohort assessment (Appendix 2) and nine stars during assessment of the case‐control portion (Appendix 3).
The risk of bias assessment was based on data provided in the included publications. When relevant data for such assessment were missing, we tried to contact the trial authors to ask that they provide them.
Measures of treatment effect
This review includes only the binary outcome of cancer diagnosis (i.e. cancer incidence) or death from cancer (i.e. cancer mortality), or a combination of both. We used the term 'cancer risk' in this paper as a generic term that refers generally to cancer incidence, cancer mortality, and combined incidence/mortality data.
For RCTs, we used risk ratios (RRs) and their 95% confidence intervals (95% CIs). When hazard ratios (HRs) rather than RRs were reported in the original study, we reported individual study results as HRs along with their 95% CIs.
For observational studies, we used odds ratios (ORs), risk ratios (RRs), or hazard ratios (HRs) and their corresponding 95% CIs as measures of association between cancer risk and selenium exposure. When adjusted estimates were reported, we used those with the most extensive covariate adjustment reported in the publication.
Dealing with missing data
When data were missing or when discrepancies in study publications were found, we tried to contact the study investigators to request further information. In most cases, review authors resolved the issues through collaboration; when no reply came from the trial authors, we did not use the corresponding data.
When a study combined subgroups, only some of which fulfilled our eligibility criteria (e.g. including individuals not affected by cancer), or did not report enough information to be included in this update, we systematically contacted trial authors to ask that they provide the additional information. We are grateful to the several trial authors who agreed to provide these additional data.
Assessment of heterogeneity
We used the Chi² test for heterogeneity and I² statistics to quantify heterogeneity of study results (Higgins 2003).
Assessment of reporting biases
We evaluated the possibility of reporting bias by using funnel plots.
Data synthesis
We performed data synthesis and analysis separately for RCTs and observational studies.
For RCTs, we performed meta‐analyses for all cancers or site‐specific cancers when at least two trials could provide data, given their fundamental importance in epidemiological research. When more than one publication from the same trial was available and reported different periods of follow‐up for the same cancer site, we included in the meta‐analysis only the longest period of follow‐up, provided that the experimental protocol was ongoing at the time of follow‐up (i.e. that selenium supplementation was still actively supplied). We assessed the stability of effect estimates through their 95% or 99% confidence intervals. We included lack of precision of effect estimates among the factors used to downgrade the certainty (quality) of evidence generated by studies via the GRADE approach (www.gradeworkinggroup.org). For RCTs, we considered pooled data from studies with low risk of bias as the primary analysis.
For observational studies, the minimum number of studies for inclusion in the meta‐analysis was five, as in the previous version of the review. We applied this latter restriction not only to limit the number of analyses performed, but also because results were largely expected to be heterogeneous, and heterogeneity cannot be described and quantified adequately if too few studies are available (Higgins 2009).
We calculated RRs and 95% CIs using numbers of participants and cases when these were provided in the publication and the meta‐analysis tool provided by Review Manager 2014; otherwise, we used RRs reported in the original publication, and, in particular, we selected RRs with the least adjustment for potential confounders. We used the same approach in calculating the RRs of adverse outcomes. We conducted random‐effects meta‐analyses of summary statistics for both observational studies and RCTs. For observational studies, we used the OR or RR comparing highest and lowest selenium exposure categories. We entered effect estimates as the natural logarithm of the OR or RR, and we used the squared standard error of the natural logarithm of the OR or RR as a weight. We calculated the latter from reported upper and lower boundaries of the 95% CI of the OR or RR. If a 95% CI was not reported, we used the total number of cases and the total number of controls, as well as the number of categories of selenium exposure, to estimate numbers of cases and controls per exposure category. We then used the standard normal approximation formula to calculate the standard error of the OR, comparing the highest versus the lowest exposure category (lnOR = (1/a + 1/b + 1/c + 1/d), where a, b, c, and d are the four counts needed to calculate the OR via (a*d)/(b*c)). For experimental studies, we computed the RR of cancer in the intervention group compared with that in the placebo group. For one study, which included more than one treatment (Algotar 2013), we used only results for the lowest dose (200 µg/d) for consistency with other studies. We conducted all meta‐analyses by using Review Manager 5.3.5 and Stata‐15 statistical tools. To do this, we copied logarithmic data for the OR and the standard error from Stata into Review Manager, then double‐checked results for errors.
Subgroup analysis and investigation of heterogeneity
We carried out a subgroup meta‐analysis for high‐quality RCTs while excluding from analysis all trials showing high or uncertain risk of bias.
For observational studies, we used sex‐disaggregated data from mixed‐sex studies, together with data from single‐sex cohorts, to conduct subgroup analyses by sex. We also carried out subgroup analyses specific for baseline selenium status. For these analyses, we assessed the evidence for an exposure‐response relation by examining studies in ascending order from the bottom category of selenium exposure and by examining differences between highest and lowest exposure categories.
Sensitivity analysis
For RCTs, we considered risk estimates derived by pooling data from all studies, regardless of risk of bias, as part of a sensitivity analysis.
For observational studies, we conducted sensitivity analyses to assess the effects of different methods used to assess selenium status (i.e. assessment of intake via dietary assessment methods or measurement of exposure biomarkers such as blood and toenail selenium content).
'Summary of findings' table
We presented the overall certainty (quality) of evidence for the risk of any cancer, cancer mortality, colorectal cancer, lung cancer, non‐melanoma skin cancer, breast cancer, bladder cancer, and prostate cancer from RCTs with low risk of bias. We also presented the overall certainty of evidence for these outcomes from observational studies, with the exception of non‐melanoma skin cancer.
We evaluated the overall certainty of evidence according to the Grading of Recommendations Assessment, Development and Evaluation (GRADE) approach (GRADE Working Group 2004), which takes into account issues related not only to internal validity (risk of bias, inconsistency, imprecision, publication bias) but also to external validity, such as directness of results (Langendam 2013). We created two 'Summary of findings' tables (summary of findings Table for the main comparison; summary of findings Table 2) while adhering to the methods described in the Cochrane Handbook for Systematic Reviews of Interventions (Higgins 2011a) and using GRADEpro GDT We used the GRADE checklist and GRADE Working Group certainty (quality) of evidence definitions (Meader 2014), as follows.
-
High quality: We are very confident that the true effect lies close to that of the estimate of the effect.
-
Moderate quality: We are moderately confident in the effect estimate: The true effect is likely to be close to the estimate of the effect, but there is a possibility that it is substantially different.
-
Low quality: Our confidence in the effect estimate is limited: The true effect may be substantially different from the estimate of the effect.
-
Very low quality: We have very little confidence in the effect estimate: The true effect is likely to be substantially different from the estimate of effect.
When possible, for each outcome in RCTs, we based the assumed risk in the control group on the proportion of events in the included studies. In accordance with GRADE methodological criteria, we based our assessment of the certainty (quality) of evidence on RCTs with low risk of bias (Guyatt 2011). We downgraded the evidence from 'high' quality by one level for serious (or by two levels for very serious) concerns regarding each of the validity issues.
Results
Description of studies
Citation style: Please note that we reference the sources of relevant information in a certain way to enhance traceability of our results for interested readers. When the source of information is not the primary publication of an included study, we also reference the specific publication of interest. For example "Hakama 1990, in: Knekt 1990" indicates that the cited paper is "Hakama 1990" as part of the mentioned study.
We could not access three full‐text theses published in the United States (Coates 1987, in: Coates 1988; Menkes 1986a, in: Menkes 1986; Schober 1986, in: Menkes 1986). However, later journal publications were available, and we included them in this review as main study publications (Coates 1988, in: Coates 1988; Menkes 1986b, in: Menkes 1986; Schober 1987, in: Menkes 1986). Thus we considered retrieval of the full‐text theses to be unnecessary.
Results of the search
In the previous Cochrane review, of 4082 hits of potential relevance, we retrieved 268 publications in full text. Of these, we considered 137 papers as relevant (see the flow chart of the literature search in Dennert 2011).
In our first updated search, after we excluded internal duplicates and duplicates against the database of the literature search conducted in January 2011, we retrieved 766 hits. Of these, we excluded 744 references as clearly irrelevant on the basis of title and abstract review (see the flow chart of the literature search in Vinceti 2014).
In the second updated search process, conducted in February 2017, including online database searches and searches within grey literature, study references, and trial databases, we identified 859 new hits after de‐duplication. Of these, we excluded 831 references as clearly irrelevant on the basis of the title and abstract review (see the flow chart of the literature search in Figure 1). We considered the remaining 28 publications of possible relevance and re‐evaluated and retrieved them in full text from this updated search. Upon further review, we considered 20 of these publications relevant.

Flow chart.
Included studies
In total, from the previous Cochrane review and from our updates, we identified 168 papers for inclusion in this review: 105 papers referred to 70 completed observational studies, and 63 papers referred to one ongoing and 10 completed RCTs (Figure 1). (The previous version of the review was based on 148 papers; 89 referred to one ongoing and 55 completed observational studies, and 59 papers referred to four ongoing and eight completed RCTs.)
We have provided a detailed description of the included studies in the Characteristics of included studies table.
Randomised controlled trials
We included in this review 11 randomised controlled trials (RCTs) with a total of 44,743 participants (94% men). All used parallel‐group designs with two arms (Dreno 2007; Karp 2013; Li 2000; Lubinski 2011; Marshall 2011; NPCT 2002; Reid 2008; Yu 1991; Yu 1997), three arms (Algotar 2013), or four arms (SELECT 2009). Three were conducted in China (Li 2000; Yu 1991; Yu 1997), four in the United States (Karp 2013; Marshall 2011; NPCT 2002; Reid 2008), one in the United States/New Zealand (Algotar 2013), one in the United States/Canada/Puerto Rico (SELECT 2009), and one in Europe (Lubinski 2011).
Investigators administered selenium supplements and placebos daily. As an active intervention, trials used selenium 200 µg/d (Dreno 2007; Karp 2013; Marshall 2011; NPCT 2002; Yu 1991; Yu 1997), or 400 µg/d (Reid 2008), in the form of selenised yeast tablets, composed almost entirely of organic selenium and particularly of selenomethionine (Block 2004). Algotar 2013 used 200 µg and 400 µg as different arms. Li 2000 used 500 µg sodium selenite, and SELECT 2009 used 200 µg/d of selenomethionine. Lubinski 2011 used 250 µg/d of inorganic selenite.
Three Chinese trials investigated the preventive efficacy of selenium supplementation against primary liver cancer for different high‐risk populations. Participants were carriers of the hepatitis B surface antigen (HBs‐Ag) with normal liver function, or they were first‐degree relatives of patients with liver cancer. Two trials used selenised yeast (Yu 1991; Yu 1997), and one used sodium selenite (Li 2000).
The Nutritional Prevention of Cancer Trial (NPCT) investigated the influence of selenium on the development of non‐melanoma skin cancer (basal and squamous cell carcinoma) in a population considered at high risk of the disease, namely, patients with a history of non‐melanoma skin cancer (NPCT 2002). Participants consisted of 1312 men and women from the eastern United States 18 to 80 years of age, with a history of two or more basal cell carcinomas or of one squamous cell carcinoma. Investigators reported RR estimates for basal cell carcinoma, squamous cell carcinoma, and overall non‐melanoma skin cancer for two periods of follow‐up: an intermediate study period (from 15 September 1983 to 31 December 1993: Clark 1996, in: NPCT 2002), and the entire blinded intervention period (from 15 September 1983 to 31 January 1996: Duffield‐Lillico 2002 for secondary outcomes; Duffield‐Lillico 2003a for the primary outcome, i.e. non‐melanoma skin cancer; and Duffield‐Lillico 2003b for an in‐depth analysis of prostate cancer risk; see NPCT 2002). In the present analysis, we used only final reports concerning the entire period of blinded follow‐up, which was characterised by active administration of selenium supplements.
In 1990, NPCT 2002 identified additional secondary endpoints post hoc (i.e. total cancer mortality; total cancer incidence; incidence of lung, prostate, and colorectal cancers). Trial publications also reported incidences of female breast cancer, bladder cancer, oesophageal cancer, melanoma, haematological cancer, and cancers of the head and neck (NPCT 2002).
A substudy of the NPCT investigated the efficacy of a higher selenium dose, supplied as selenised yeast orally, for prevention of non‐melanoma skin cancer at one of the NPCT study sites (Reid 2008). Study design was similar to that of the NPCT study, except that investigators randomly assigned 423 participants at this site to placebo or intervention with 400 µg/d of selenium. Reid 2008 also reported the incidence of internal cancers.
Dreno 2007 evaluated the incidence of skin cancer as a secondary outcome in a group of 184 organ transplant recipients who received 200 µg/d of selenium for three years, then were followed up for an additional two years. In this multi‐centre, randomised, placebo‐controlled trial, investigators monitored 91 selenium‐supplemented participants and 93 non‐supplemented participants for development of both non‐malignant (warts and various keratoses) and malignant skin lesions.
The Selenium and Vitamin E Cancer Prevention Trial (SELECT 2009) investigated the effect of selenium as L‐selenomethionine and/or vitamin E supplementation in men of diverse ethnic backgrounds against the development of prostate cancer and other 'secondary' outcomes (i.e. risk of all cancers, lung cancer, colorectal cancer, and bladder cancer). This study was a very large phase 3 randomised, placebo‐controlled trial, activated in June 2001 and originally designed for a 7‐ to 12‐year period of follow‐up, carried out at 427 sites in the United States, Canada, and Puerto Rico. However, the independent Data and Safety Monitoring Committee (DSMC) recommended on 15 September 2008, discontinuation of study supplements based on absence of benefit from vitamin E or selenium and no possibility of benefit to the planned degree with additional follow‐up (SELECT 2009). The Committee also expressed concern about increased prostate cancer risk among vitamin E–treated participants and increased diabetes risk among selenium‐supplemented participants (SELECT 2009) (RR 1.07, 99% CI 0.94 to 1.22). Therefore, investigators discontinued administration of these supplements on 23 October 2008, in spite of the planned supplementation period of 12 years. Results of SELECT are based on follow‐up provided at the end of the blinded supplementation period, which included 117,660 person‐years of follow‐up ‐ not on an extended period of follow‐up, which encompassed an additional 32 months of surveillance (144,846 person‐years in total) after the end of the supplementation period (Klein 2011, in: SELECT 2009). Endpoints were prostate cancer (the 'primary' endpoint) and colorectal cancer, lung cancer, all other cancers, and all cancers overall. A subsequent study from SELECT also evaluated the risk of bladder cancer, adding to standard follow‐up an additional post supplementation period of 32 months (Lotan 2012, in: SELECT 2009).
Three phase III trials published in 2011 ‐ Marshall 2011 ‐ and in 2013 ‐ Algotar 2013; Karp 2013 ‐ also evaluated the effect of selenium supplementation on prostate cancer. In Marshall 2011 (trial code SWOG S9917), investigators randomly assigned 423 men with high‐grade prostatic intraepithelial neoplasia, and therefore considered to be at very high risk of prostate cancer, to selenium (200 µg/d as selenomethionine) or placebo. Algotar 2013 evaluated whether supplementation with 200 or 400 µg/d of selenium as selenised yeast reduced the risk of prostate cancer among men at high risk of the disease, based on a prostate‐specific antigen (PSA) level exceeding 4 ng/L, suspicious digital rectal examination. and PSA velocity greater than 0.75 ng/mL/y. This trial, called the Negative Biopsy Trial (NBT), followed study participants in the United States (where both supplementation and follow‐up were completed for such period) for five years, and in New Zealand for no longer than three years, and was discontinued after an external DSMC issued a recommendation to stop the trial. Karp 2013 investigated the effect of supplementation of 200 µg/d selenium as selenised yeast in 1561 individuals with resected stage I non–small‐cell lung cancer (trial code ECOG 5597). The primary outcome was the incidence of second primary tumours. Investigators enrolled both men and women in the study and investigated all cancer types and a few major side effects during follow‐up. Follow‐up included the period of active supplementation and some additional follow‐up after the trial anticipated discontinuation. This decision was made by the trial DSMC, which, on October 21, 2009, reviewed the first planned interim analysis of the primary endpoint and recommended that the study should be terminated for futility. Based on that DSMC recommendation, on November 5, 2009, accrual for the Eastern Cooperative Oncology Group (ECOG) trial was interrupted, and all current participants were invited to discontinue selenium/placebo tablets and were monitored only for follow‐up of cancer incidence and survival. In accordance with recommendations by the trial DSMC concerning possible adverse effects of selenium supplementation, the incidence of basal and squamous cell skin cancers, as well as type 2 diabetes, was monitored. The main paper reported follow‐up until June 2011 (Karp 2013), and results for only second primary lung tumours were updated as of January 2014, including a longer post supplementation period of follow‐up (Pillai 2014, in: Karp 2013).
Investigators conducted a trial in Poland that included a female population of carriers of a breast cancer‐related mutation, BRCA1 (Lubinski 2011). Trial authors randomised 1135 women carrying that mutation to 250 µg/d of selenium in its inorganic tetravalent form (selenite), or to placebo, in a double‐blind trial. Median follow‐up lasted 35 months (ranging from 6 to 62 months), and final analysis was based on 105 incident cases diagnosed during follow‐up ‐ 60 cases in the selenium‐supplemented arm and 45 cases in the placebo arm.
Observational studies
We included in this review 70 completed observational studies. Forty‐five studies were nested case‐control studies, the others were subcohort‐controlled or cohort studies, and one study used a cohort together with a nested case‐control design. Subcohort‐controlled studies used (random) samples of the cohort as controls. The original papers were published between 1983 and 2017. Eight studies were conducted in Asia (China, Iran, Japan, and Taiwan), one in Australia, 30 in Europe (Belgium, Denmark, Germany, Greece, Italy, Netherlands, Norway, Spain, Sweden, Channel Islands, Finland, France, and UK), 30 in the United States, and one in Canada. Overall, studies included more than 2,300,000 participants. Study populations in Europe made up 42.9%, North America 44.3%, Asia 11.4%, and Australia 1.4% of all study participants. The median size of study populations was 11,457. Forty‐one studies included men and women, one did not report sex, 22 included only men, and six included only women. Eleven studies with mixed‐sex populations reported results stratified by sex. Study populations were derived from 55 different cohorts. Twenty‐four cohorts were non‐randomly recruited (e.g. included volunteers), and 31 cohorts consisted of a random sample of the population of interest. Fifty‐two studies reported mean or median age, 12 studies reported only age range, and six studies did not report this information on study participants. Most studies included adults older than 40 years of age.
Sixteen studies investigated nutritional and/or supplemental selenium intake by using food frequency questionnaires or interviews. Fifty‐four studies assessed biochemical selenium status whereby:
-
9 used toenail specimens;
-
14 used plasma specimens;
-
29 used serum specimens;
-
1 used both serum and plasma specimens; and
-
1 measured both serum selenium levels and intake.
The mean follow‐up period lasted up to three years in five studies, and longer than three years in the remaining studies. Generally, study authors grouped cases according to the version of the International Classification of Diseases (ICD) that was up‐to‐date at the inception of the cohort observation. The level of disaggregation of data varied markedly between studies. Although some studies reported cancer risk according to organ system (e.g. urinary tract, respiratory tract), others reported cancer risk for one or two organs (e.g. female breast, urinary bladder). Only in the case of skin cancer did studies also differentiate according to histological type (e.g. melanoma, basal cell carcinoma).
For the following outcomes, we included five or more studies in the review and meta‐analysed observational data.
-
Any cancer (16 studies).
-
Female breast cancer (8 studies).
-
Urinary bladder cancer (6 studies).
-
Lung cancer (15 studies).
-
Prostate cancer (21 studies).
-
Stomach cancer (5 studies).
-
Colorectal cancer (6 studies) and colon cancer (5 studies).
Goyal 2013 updated results of Bleys 2008, which reported longer follow‐up for the same population.
Table 1 provides an overview of the studies examining each outcome. Five studies provided data for the group of 'other' cancers, which encompassed any type of cancer not reported separately in study publications. The definition of 'other' cancers varied between studies, including rare cancers but also cancers of unknown origin. We have mentioned results of studies within the category 'other cancers' for the sake of completeness; however, because of the diversity of outcomes, we have not included these results in further analysis or discussion of this review.
| Organ system | Outcome | Number of studies/case definitions | Meta‐ | Countries | Number of participants | Number of cases | Selenium assessment | Reporting study |
| Any cancer | Any cancer | total: 16 incidence: 7 | ✓ yes | USA China Japan | total: ˜ 276,000 | total: 6488 male: 3196 female: 1541 | serum: 12 plasma: 2 serum + plasma: 1 dietary intake: 1 | Salonen 1985 |
| Gynaecological cancer | Female breast cancer | total: 8 incidence: 8 | ✓ yes | USA | total/female: 169,028 | total/female: 1277 | serum: 2 plasma: 1 serum + plasma: 1 toenail: 3 intake: 1 | |
| Cervical cancer | total: 2 incidence: 2 | ✗ no | USA | total/female: > 15,161 (1 study did not report cohort size by sex) | total/female: 62 | serum: 2 | ||
| Uterine cancer | total: 1 incidence: 1 | ✗ no | USA | total/female: 62,641 | total/female: 91 | toenail: 1 | ||
| Ovarian cancer | total: 4 incidence: 4 | ✗ no | USA | total/female: ˜ 214,000 | total/female: 568 | serum: 2 toenail: 1 supplemental intake: 1 | ||
| Gynaecological cancer (without breast cancer) | total: 1 incidence: 1 | ✗ no | Finland | total/female: 18,096 | total/female: 86 | serum: 1 | ||
| Urological cancers | Renal cancer | total: 1 incidence: 1 | ✗ no | United Kindom | total: 23,658 | total: 65 | dietary intake: 1 | |
| Urinary bladder cancer | total: 6 incidence: 6 | ✓ yes | USA/Hawaii | total: 279,100 female: 130,786 male: 128,009 | total: 1295 female: 175 male 755 | serum: 3 toenail: 3 | ||
| Urinary tract cancer | total: 1 incidence: 1 | ✗ no | Netherlands | total: 38,500 | total: 47 male: 34 female: 13 | serum: 1 | ||
| Respiratory tract cancers | Lung cancer | total: 15 incidence: 13 | ✓ yes | China Denmark | total: 371,067 male: 125,341 female: 181,895 | total: 2223 male: 1384 female: 416 | serum: 9 serum + plasma: 2 toenail: 2 dietary intake: 2 (1 study reported both serum levels and food intake) | Menkes 1986 Knekt 1990 |
| Oral/pharyngeal cancer | total: 1 incidence: 1 | ✗ no | USA | total: 20,305 | total: 28 | serum: 1 | ||
| Andrological cancers | Prostate cancer | total: 21 incidence: 21 | ✓ yes | USA Canada Puerto Rico | total/male: 576,667 | total/male: 14,950 | serum: 8 plasma: 5 toenail: 4 dietary intake: 4 | Coates 1988 Brooks 2001 |
| Gastrointestinal cancers | Oesophageal cancer | total: 2 incidence: 2 | ✗ no | China | total: 29,923 | total: > 959 | serum: 1 supplemental intake: 1 | |
| Oesophageal squamous cell carcinoma | total:2 incidence: 2 | ✗ no | Netherlands Iran | total: 168,257 | total: 265 | toenail: 1 intake: 1 | ||
| Oesophageal adenocarcinoma | total:1 incidence:1 | ✗ no | Netherlands | total: 120,852 | total: 112 | toenail: 1 | ||
| Oesophageal/stomach cancer | total: 1 incidence: 1 | ✗ no | Netherlands | total: 36,265 | total: 86 male: 51 female: 35 | serum: 1 | ||
| Gastric cardia adenocarcinoma | total:1 incidence:1 | ✗ no | Netherlands | total: 120,852 | total:114 | toenail: 1 | ||
| Stomach cancer | total: 5 incidence: 5 | ✓ yes | China | total: ˜ 197,000 male: 86,311 female: 80,669 | total: 955 male: 626 female: 329 | serum: 4 toenail: 1 | ||
| Primary liver cancer | total: 4 incidence: 3 | ✗ no | China Europe Taiwan | total: 701,809 male: 61,470 female: 74,941 | total: 877 male: 567 female: 204 | plasma: 1 serum: 1 toenail: 1 intake: 1 | ||
| Pancreatic cancer | total: 4 incidence: 4 | ✗ no | USA UK | total: 159,062 | total: 311 male: 69 female: 84 | serum: 2 intake: 1 supplemental intake: 1 | ||
| Colorectal cancer | total: 6 incidence: 6 | ✓ yes | USA/Hawaii | total: 712,746 male: 216,272 female: 442,266 | total: 2627 male: 810 female: 797 | serum: 3 toenail: 2 supplement use: 1 | ||
| Colon cancer | total: 5 incidence: 5 | ✓ yes | USA/Hawaii Europe | total: 636,641 male: 195,100 female: 361,529 | total: 1677 male: 525 female: 510 | serum: 3 toenail: 1 supplement use: 1 | ||
| Rectal cancer | total: 4 incidence: 4 | ✗ no | USA/Hawaii | total: 610,837 male: 195,100 female: 361,529 | total: 861 male: 303 female: 210 | serum: 2 toenail: 1 supplement use:1 | ||
| All gastrointestinal cancers | total: 1 incidence: 1 | ✗ no | USA | total: 6,167 | total: 143 | plasma and serum: 1 | ||
| Skin cancer | Melanoma | total: 3 incidence: 3 | ✗ no | USA | total: ˜ 158,000 | total: 547 | serum: 1 toenail: 1 supplemental intake: 1 | |
| Basal cell carcinoma | total: 3 incidence: 3 | ✗ no | Australia | total: > 66,000 | total: 292 | serum: 3 dietary intake: 1 | ||
| Squamous cell carcinoma | total: 4 incidence: 4 | ✗ no | Australia | total: ˜ 30,000 | total: 488 | serum: 2 plasma: 1 dietary intake: 1 | ||
| Total non‐melanoma skin cancer | total: 1 incidence: 1 | ✗ no | USA | total: 117 | total: 19 | plasma: 1 | ||
| Rare and other cancers | Haematological cancers | total: 1 incidence: 1 | ✗ no | USA | total: 6167 | total: 12 | serum + plasma: 1 | |
| Thyroid cancer | total: 2 incidence: 2 | ✗ no | Norway | total: 582,807 male: 287,944 female: 194,863 | total: 635 male: 269 female: 366 | serum: 1 intake:1 | ||
| Other cancers | total: 4 incidence: 3 | ✗ no | China | total: 109,179 male: 21,172 female: 80,737 | total: 512 male: 169 female: 285 | serum: 2 serum + plasma: 1 toenail: 1 |
Some studies did not report the sex of participants or cancer cases; consequently, figures for women and men do not always sum up to the total number of participants or cancer cases.
Excluded studies
Of 28 potentially relevant papers retrieved in the updated search, eight papers did not fulfil the inclusion criteria. We rejected six of these publications as investigators did not report results according to inclusion criteria; one paper because trial authors reported duplicated data from an already included study; and another paper because the trial was carried out in patients with cancer. The Characteristics of excluded studies table describes the reasons for exclusion of trials from the previous Cochrane review and from this update.
Risk of bias in included studies
Randomised controlled trials
We assessed risk of bias of the included RCTs according to Cochrane criteria (Higgins 2011a; Higgins 2011b). We presented judgements about each risk of bias item as percentages across all included RCTs, and we provided a summary of the risk of bias assessment in Figure 2. We provided details on the judgement for each RCT and the reason for that judgement in Characteristics of included studies.
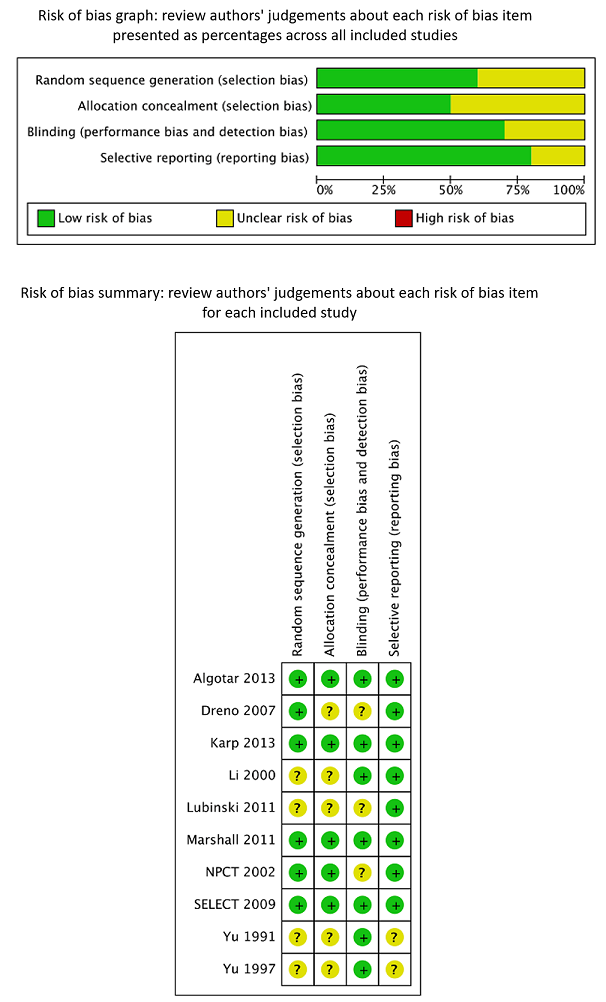
Review authors’ judgements about each risk of bias item presented as percentages across all included RCTs and summary of review authors’ judgements about each risk of bias item for the included RCTs.
We considered all three trials on liver cancer risk (Li 2000; Yu 1991; Yu 1997), as well as the trial on breast cancer (Lubinski 2011), to have unclear risk of bias. These trials did not report generation of allocation sequence and allocation concealment. One study mentioned that the dropout rate was similar in intervention and control groups; the remaining three studies did not report the completeness of outcome data. We judged blinding as adequate in three studies, as investigators reported the use of placebo supplements. We inferred from this procedure that at least the study participants and the physicians directly involved were blinded towards treatment status.
In addition, it is unclear whether Li 2000 was an individually randomised controlled trial. Study investigators used the phrase "randomisation based on the residence area" and did not describe the randomisation procedure any further. As participants were recruited from 17 villages, these villages ‐ not individual participants ‐ may have been randomly assigned to intervention and control groups. However, we could not make contact with study investigators to clarify these questions. Randomisation of villages instead of individuals could have introduced bias into the study results, as the incidence of liver cancer is known to differ between geographical areas as a result of lifestyle and environmental factors.
It has been found that RCTs with inadequate or unclear allocation concealment, especially those with subjective outcomes, may overestimate the benefit of interventions (Pildal 2007; Wood 2008). All three RCTs on liver cancer did not report follow‐up and case detection procedures, so the influence of subjective factors on case detection, such as interpretation of bodily symptoms as triggers of further diagnostic tests, is unknown. Although we judged blinding as 'adequate' in all three liver cancer trials, we do not know whether blinding was successful in practice for participants, healthcare providers, and outcome assessors.
These uncertainties about study methods seriously weaken our confidence in reported RCT results on liver cancer risk.
We considered Algotar 2013, Karp 2013, Marshall 2011, and SELECT 2009 to have low risk of bias because they reported adequate generation of allocation sequence, allocation concealment, blinding, and completeness of outcome data.
We judged Dreno 2007 and Duffield‐Lillico 2002 to 2003, in: NPCT 2002 to have unclear risk of bias. Dreno 2007 provided unclear generation of allocation sequence, allocation concealment, and blinding; only completeness of outcome data was adequate. We considered NPCT to be at unclear risk of bias because of exposure‐related detection bias for its primary outcome, as the percentage of study participants with an abnormal PSA (> 4 ng/mL) who underwent biopsy varied according to selenium treatment group, at 35% in the placebo group and 14% in the selenium‐treated group (Duffield‐Lillico 2003b, in: NPCT 2002; Marshall 2011). As reported by the trial authors themselves in analyses stratified by baseline selenium concentration, the difference was greatest among participants in the lowest tertile, in whom the inverse association between selenium administration and prostate cancer risk was strongest. The difference in biopsy rates could not be accounted for by factors such as PSA concentration, age at which abnormal PSA was detected, or alternative diagnostic procedures. Although a difference this large could have occurred by chance, this finding raises concerns about possible disruption of blinding. Investigators provided no information as to the prostate biopsy rate among participants with lower PSA levels or biopsy rates for the primary outcome of non‐melanoma skin cancer, which also requires pathological confirmation, nor for the secondary outcomes examined in this trial.
Observational studies
We presented in Table 2 a summary of study ratings according to the Newcastle‐Ottawa Scale (NOS). The median number of assigned stars was eight for both (nested) case‐control and cohort study assessments, out of a maximum of nine stars each.
| Study | Publication | Newcastle‐Ottawa Scale (cohort) | Newcastle‐Ottawa Scale (case‐control) | ||||||
| Selection | Comparability | Outcome | Total | Selection | Comparability | Exposure | Total | ||
| 0‐1‐0‐1 | 1 | 1‐1‐0 | 5 | 0‐1‐0‐1 | 1 | 1‐1‐0 | 5 | ||
| 0‐1‐1‐1 | 2 | 0‐1‐0 | 6 | .‐.‐.‐. | . | .‐.‐. | . | ||
| 1‐1‐1‐1 | 2 | 1‐1‐0 | 8 | 1‐1‐1‐1 | 2 | 1‐1‐1 | 9 | ||
| 1‐1‐1‐1 | 2 | 1‐1‐1 | 9 | 1‐1‐1‐1 | 2 | 1‐1‐1 | 9 | ||
| Barrass 2013 | 1‐1‐1‐1 | 2 | 1‐1‐1 | 9 | 1‐1‐1‐1 | 2 | 1‐1‐1 | 9 | |
| 1‐1‐1‐1 | 2 | 1‐1‐1 | 9 | .‐.‐.‐. | . | .‐.‐. | . | ||
| 1‐1‐1‐1 | 2 | 1‐1‐1 | 9 | .‐.‐.‐. | . | .‐.‐. | . | ||
| 0‐1‐1‐0 | 2 | 1‐0‐0 | 5 | 1‐0‐1‐1 | 2 | 1‐1‐0 | 7 | ||
| 0‐1‐1‐0 | 0 | 0‐0‐0 | 2 | .‐.‐.‐. | . | .‐.‐. | . | ||
| 0‐1‐1‐0 | 1 | 1‐1‐0 | 5 | 1‐0‐1‐0 | 1 | 1‐1‐1 | 6 | ||
| Coates 1987 | .‐.‐.‐. | . | .‐.‐. | . | .‐.‐.‐. | . | .‐.‐. | . | |
| 0‐1‐1‐0 | 2 | 1‐0‐0 | 5 | .‐.‐.‐. | . | .‐.‐. | . | ||
| 0‐1‐1‐0 | 2 | 1‐1‐0 | 6 | 1‐1‐1‐1 | 2 | 1‐1‐1 | 9 | ||
| 1‐1‐1‐1 | 2 | 1‐1‐1 | 9 | .‐.‐.‐. | . | .‐.‐. | . | ||
| 0‐1‐1‐1 | 2 | 0‐1‐0 | 6 | 1‐1‐1‐1 | 2 | 1‐1‐1 | 9 | ||
| 0‐1‐1‐1 | 2 | 1‐1‐0 | 7 | 0‐1‐1‐1 | 2 | 1‐1‐1 | 8 | ||
| Gill 2009 | 0‐1‐1‐1 | 1 | 1‐1‐0 | 6 | 0‐1‐1‐1 | 1 | 1‐1‐1 | 7 | |
| 1‐1‐1‐0 | 2 | 1‐1‐1 | 8 | 1‐0‐1‐1 | 2 | 1‐1‐1 | 8 | ||
| 1‐1‐1‐1 | 2 | 1‐1‐1 | 9 | .‐.‐.‐. | . | .‐.‐. | . | ||
| 0‐1‐1‐1 | 2 | 1‐1‐1 | 8 | 1‐1‐1‐1 | 2 | 1‐1‐1 | 9 | ||
| 0‐1‐1‐1 | 2 | 1‐1‐1 | 8 | 1‐1‐1‐1 | 2 | 1‐1‐1 | 9 | ||
| 0‐1‐1‐0 | 1 | 1‐1‐1 | 6 | 1‐1‐1‐1 | 1 | 1‐1‐1 | 8 | ||
| 0‐1‐1‐0 | 2 | 1‐1‐0 | 6 | 1‐1‐1‐1 | 2 | 1‐1‐1 | 9 | ||
| 0‐1‐1‐1 | 2 | 1‐1‐0 | 7 | 1‐1‐1‐1 | 2 | 1‐1‐1 | 9 | ||
| 1‐1‐1‐1 | 2 | 1‐1‐1 | 9 | .‐.‐.‐. | . | .‐.‐. | . | ||
| 0‐1‐0‐1 | 2 | 1‐1‐0 | 7 | .‐.‐.‐. | . | .‐.‐. | . | ||
| 0‐1‐1‐1 | 1 | 1‐1‐1 | 7 | .‐.‐.‐. | . | .‐.‐. | . | ||
| 1‐1‐0‐1 | 2 | 1‐1‐0 | 7 | .‐.‐.‐. | . | .‐.‐. | . | ||
| 1‐1‐1‐1 | 2 | 1‐1‐1 | 9 | .‐.‐.‐. | . | .‐.‐. | . | ||
| 0‐1‐1‐1 | 1 | 1‐1‐0 | 6 | 1‐1‐1‐1 | 1 | 1‐1‐1 | 8 | ||
| 1‐1‐1‐1 | 2 | 0‐1‐0 | 7 | 0‐1‐1‐1 | 2 | 1‐1‐1 | 8 | ||
| 1‐1‐1‐1 | 2 | 0‐1‐1 | 8 | 0‐1‐1‐1 | 2 | 1‐1‐1 | 8 | ||
| 0‐1‐1‐1 | 2 | 1‐1‐0 | 7 | 0‐1‐1‐1 | 2 | 1‐1‐1 | 8 | ||
| 0‐1‐1‐1 | 2 | 1‐1‐1 | 8 | 1‐1‐1‐1 | 2 | 1‐1‐1 | 9 | ||
| 1‐1‐1‐1 | 2 | 1‐1‐1 | 9 | 0‐1‐1‐1 | 2 | 1‐1‐1 | 8 | ||
| Hakama 1990 | 1‐1‐1‐1 | 2 | 1‐1‐1 | 9 | 0‐1‐1‐1 | 2 | 1‐1‐1 | 8 | |
| Knekt 1988 | 1‐1‐1‐1 | 2 | 1‐1‐1 | 9 | 0‐0‐1‐1 | 2 | 1‐1‐1 | 7 | |
| Knekt 1996 | 1‐1‐1‐1 | 1 | 1‐1‐1 | 8 | 0‐1‐1‐1 | 1 | 1‐1‐1 | 7 | |
| 1‐1‐1‐1 | 2 | 1‐1‐1 | 9 | 0‐1‐1‐1 | 2 | 1‐1‐1 | 8 | ||
| 1‐1‐1‐1 | 2 | 1‐1‐1 | 9 | 0‐1‐1‐1 | 2 | 1‐1‐1 | 8 | ||
| 1‐1‐1‐1 | 2 | 1‐1‐1 | 9 | 1‐0‐1‐1 | 2 | 1‐1‐1 | 8 | ||
| .‐.‐.‐. | . | .‐.‐. | . | .‐.‐.‐. | . | .‐.‐. | . | ||
| 1‐1‐1‐0 | 1 | 1‐1‐1 | 7 | 1‐1‐1‐1 | 1 | 1‐1‐1 | 8 | ||
| 1‐1‐1‐1 | 1 | 1‐1‐1 | 8 | 1‐1‐1‐1 | 1 | 1‐1‐1 | 8 | ||
| 1‐1‐1‐0 | 2 | 1‐1‐1 | 8 | .‐.‐.‐. | . | .‐.‐. | . | ||
| 0‐1‐1‐1 | 2 | 0‐1‐1 | 7 | 1‐1‐1‐1 | 2 | 1‐1‐1 | 9 | ||
| 1‐1‐1‐1 | 2 | 1‐1‐0 | 8 | .‐.‐.‐. | . | .‐.‐. | . | ||
| 1‐1‐1‐1 | 1 | 1‐1‐0 | 7 | 1‐1‐1‐1 | 1 | 1‐1‐1 | 8 | ||
| Heinen 2007 | 1‐1‐1‐1 | 2 | 1‐1‐1 | 9 | .‐.‐.‐. | . | .‐.‐. | . | |
| van der Pols 2009 | 1‐1‐1‐1 | 2 | 1‐1‐0 | 8 | .‐.‐.‐. | . | .‐.‐. | . | |
| 0‐1‐1‐1 | 2 | 1‐1‐0 | 7 | 1‐1‐1‐1 | 2 | 1‐1‐1 | 9 | ||
| Batieha 1993 | 0‐1‐1‐1 | 2 | 1‐1‐0 | 7 | 1‐1‐1‐1 | 2 | 1‐1‐1 | 9 | |
| Breslow 1995 | 0‐1‐1‐1 | 2 | 1‐1‐0 | 7 | 1‐0‐1‐1 | 2 | 1‐1‐1 | 8 | |
| Burney 1989 | 0‐1‐1‐1 | 2 | 1‐1‐0 | 7 | 0‐1‐1‐1 | 2 | 1‐1‐1 | 8 | |
| Helzlsouer 1996 | 0‐1‐1‐1 | 2 | 1‐1‐0 | 7 | 0‐1‐1‐1 | 2 | 1‐1‐1 | 8 | |
| Helzlsouer 1989 | 0‐1‐1‐1 | 2 | 1‐1‐0 | 7 | 1‐1‐1‐1 | 2 | 1‐1‐1 | 9 | |
| Ko 1994 | 0‐1‐1‐0 | 2 | 1‐1‐0 | 6 | 1‐1‐1‐1 | 2 | 1‐1‐1 | 9 | |
| .‐.‐.‐. | . | .‐.‐. | . | .‐.‐.‐. | . | .‐.‐. | . | ||
| Schober 1987 | 0‐1‐1‐1 | 1 | 1‐1‐0 | 6 | 0‐1‐1‐1 | 1 | 1‐1‐1 | 7 | |
| Schober 1986 | .‐.‐.‐. | . | .‐.‐. | . | .‐.‐.‐. | . | .‐.‐. | . | |
| Zheng 1993 | 0‐1‐1‐1 | 2 | 1‐1‐0 | 7 | 0‐1‐1‐1 | 2 | 1‐1‐1 | 8 | |
| 1‐1‐1‐1 | 2 | 1‐1‐0 | 8 | 0‐1‐1‐1 | 2 | 1‐1‐1 | 8 | ||
| 0‐1‐1‐1 | 2 | 0‐1‐0 | 6 | 1‐1‐1‐1 | 2 | 1‐1‐1 | 9 | ||
| 1‐1‐1‐1 | 2 | 1‐1‐1 | 9 | .‐.‐.‐. | . | .‐.‐. | . | ||
| 1‐1‐1‐1 | 2 | 1‐1‐1 | 9 | 1‐1‐1‐1 | 2 | 1‐1‐1 | 9 | ||
| 1‐1‐1‐1 | 2 | 1‐1‐1 | 9 | 1‐1‐1‐1 | 2 | 1‐1‐1 | 9 | ||
| 1‐1‐1‐1 | 2 | 1‐1‐1 | 9 | .‐.‐.‐. | . | .‐.‐. | . | ||
| 1‐1‐1‐1 | 2 | 1‐1‐1 | 9 | 1‐0‐1‐1 | 2 | 1‐1‐1 | 8 | ||
| 1‐1‐1‐0 | 1 | 1‐1‐0 | 6 | .‐.‐.‐. | . | .‐.‐. | . | ||
| 1‐1‐1‐1 | 2 | 1‐1‐1 | 9 | .‐.‐.‐. | . | .‐.‐. | . | ||
| 1‐1‐1‐1 | 2 | 1‐1‐1 | 9 | .‐.‐.‐. | . | .‐.‐. | . | ||
| 1‐1‐1‐1 | 1 | 1‐1‐0 | 7 | 1‐1‐1‐1 | 1 | 1‐1‐1 | 8 | ||
| 0‐1‐1‐1 | 2 | 1‐1‐0 | 7 | 1‐1‐1‐1 | 2 | 1‐1‐1 | 9 | ||
| 0‐1‐1‐1 | 1 | 1‐1‐1 | 7 | .‐.‐.‐. | . | .‐.‐. | . | ||
| Asgari 2009 | 0‐1‐1‐1 | 1 | 1‐1‐0 | 6 | .‐.‐.‐. | . | .‐.‐. | . | |
| 0‐1‐0‐1 | 0 | 1‐1‐1 | 5 | .‐.‐.‐. | . | .‐.‐. | . | ||
| 0‐1‐0‐1 | 2 | 1‐1‐1 | 7 | .‐.‐.‐. | . | .‐.‐. | . | ||
| 1‐1‐1‐1 | 2 | 1‐0‐0 | 7 | 0‐0‐1‐1 | 2 | 1‐1‐1 | 7 | ||
| 1‐1‐1‐1 | 2 | 1‐1‐0 | 8 | 1‐1‐1‐1 | 2 | 1‐1‐1 | 9 | ||
| 0‐1‐1‐1 | 2 | 0‐1‐0 | 6 | .‐.‐.‐. | . | .‐.‐. | . | ||
| 0‐1‐1‐0 | 1 | 1‐1‐0 | 5 | 1‐1‐1‐1 | 1 | 1‐1‐1 | 8 | ||
| 1‐1‐1‐1 | 2 | 1‐1‐1 | 9 | 0‐1‐1‐1 | 2 | 1‐1‐1 | 8 | ||
| 1‐1‐1‐1 | 2 | 1‐1‐1 | 9 | 1‐1‐1‐1 | 2 | 1‐1‐1 | 9 | ||
| 1‐1‐1‐1 | 2 | 0‐1‐0 | 7 | 1‐1‐1‐1 | 2 | 0‐1‐1 | 8 | ||
| 0‐1‐1‐1 | 2 | 1‐1‐1 | 8 | .‐.‐.‐. | . | .‐.‐. | . | ||
| 1‐1‐1‐1 | 2 | 1‐1‐0 | 8 | .‐.‐.‐. | . | .‐.‐. | . | ||
| 1‐1‐1‐1 | 2 | 1‐1‐1 | 9 | .‐.‐.‐. | . | .‐.‐. | . | ||
| van den Brandt 1994 | 1‐1‐1‐1 | 2 | 1‐1‐1 | 9 | .‐.‐.‐. | . | .‐.‐. | . | |
| 1‐1‐1‐1 | 2 | 1‐1‐1 | 9 | .‐.‐.‐. | . | .‐.‐. | . | ||
| van den Brandt 2003 | 1‐1‐1‐1 | 2 | 1‐1‐1 | 9 | .‐.‐.‐. | . | .‐.‐. | . | |
| Zeegers 2002 | 1‐1‐1‐1 | 2 | 1‐1‐1 | 9 | .‐.‐.‐. | . | .‐.‐. | . | |
| 1‐1‐1‐1 | 2 | 1‐1‐1 | 9 | 0‐1‐1‐1 | 2 | 1‐0 | 6 | ||
| 1‐1‐1‐0 | 1 | 1‐0‐1 | 6 | 1‐1‐1‐0 | 1 | 1‐1‐1 | 7 | ||
| 0‐1‐1‐1 | 2 | 1‐1‐1 | 8 | .‐.‐.‐. | . | .‐.‐. | . | ||
| 1‐1‐1‐1 | 1 | 1‐1‐1 | 8 | .‐.‐.‐. | . | .‐.‐. | . | ||
| Mark 2000 | 1‐1‐1‐1 | 1 | 1‐1‐1 | 8 | .‐.‐.‐. | . | .‐.‐. | . | |
| 1‐1‐1‐0 | 2 | 1‐1‐0 | 7 | 1‐1‐1‐1 | 2 | 1‐1‐1 | 9 | ||
| 0‐1‐1‐1 | 2 | 1‐1‐1 | 8 | 1‐0‐1‐1 | 2 | 1‐1‐1 | 8 | ||
| 0‐1‐1‐1 | 2 | 1‐1‐0 | 7 | 1‐1‐1‐1 | 2 | 1‐1‐1 | 9 | ||
All but one cohort study received five to nine stars on the NOS. The exception (two stars) was an early investigation that was available only in abstract form for assessment (Clark 1985). In the NOS cohort assessment, we considered representativeness of the cohort for the target population to be adequate in 59% of studies, which received a star; 79% of studies provided evidence that cancer was not present at study commencement; we considered completeness of follow‐up (≥ 95%) data to be adequate in 93% of studies. The representativeness of the cohort for the target population is a matter of external validity and generalisability of study results, but a systematic deviation of participants from the target population might also introduce bias into study results. The target population of included studies varied with study objectives and could have been the general population, as well as special occupational groups. We did not assign a star for this question to studies that did not identify their target population or to studies that recruited volunteers. Differential selection of study participants (e.g. volunteers) from the target population can lead to confounding by factors associated with selenium status and cancer incidence (e.g. nutritional behaviour, socioeconomic position). All included studies chose comparison groups (cases/controls or exposed/non‐exposed) from the same study population. This approach enhanced comparability between groups.
We considered follow‐up data as complete or as missing data unlikely to introduce bias to study results in 47% of included observational studies. In the other cohorts, losses to follow‐up were greater than 5% and trial authors did not provide a description of losses to follow‐up. A high attrition rate may alter the characteristics of the population under investigation and may impede the generalisability of study results to the intended target population (external validity). The presence of attrition does not necessarily mean that study results are biased. However, given the possibility that selenium status may be linked to sociodemographic variables and socioeconomic position, which may also influence participation in follow‐up procedures, a differential effect of attrition may introduce bias towards underestimation or overestimation of the true exposure effect.
Forty‐five included observational studies were nested case‐control studies; therefore we assessed them by using the NOS case‐control form. The number of stars in the NOS assessment of case‐control studies ranged from five to nine, with 87% of studies receiving eight or nine stars. Although we generally assessed included prospective case‐control studies as having low risk of bias, we had concerns regarding case definition and the question of the representativeness of cases in some studies.
We considered the definition of cases as inadequate in 24% of nested case‐control studies, as cases were identified by self‐reporting; investigators did not describe linkage to databases with unclear validity or procedures. The magnitude and direction of bias that might have been introduced to the study results remain unclear.
In 16% of studies, investigators did not include all identified cases (or an appropriate sample of them) in the trial analyses, or they did not report selection procedures for analysed cases. Some studies lost blood specimens as the result of technical problems (e.g. cooler breakdown at one study centre); other studies reported that material available for analysis was insufficient; and others selected cases for analysis in a non‐random manner. This might bias the estimates of association in either direction.
We noted no obvious asymmetry (as an indicator of publication bias) in the funnel plots of studies on total cancer risk (Figure 3) and selected cancer types (Figure 4; Figure 5; Figure 6).

Funnel plot of comparison: 1 Highest versus lowest selenium exposure, outcome: 2.1 Total cancer incidence and mortality.
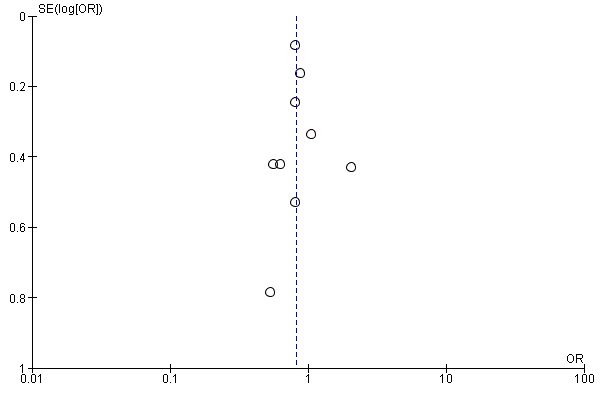
Funnel plot of comparison: 1 Observational studies: highest versus lowest selenium exposure, outcome: 2.8 Colorectal cancer risk.
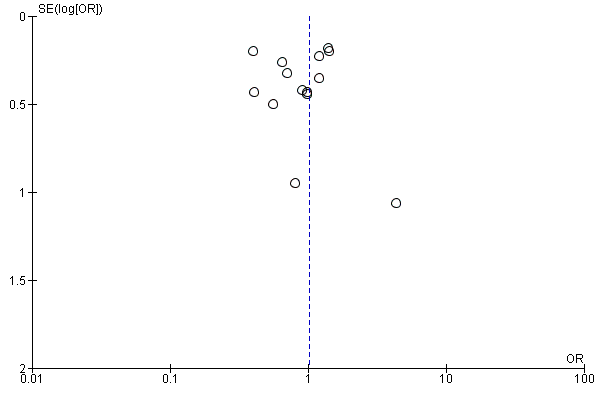
Funnel plot of comparison: 1 Observational studies: highest versus lowest selenium exposure, outcome: 2.12 Lung cancer risk incidence and mortality

Funnel plot of comparison: 1 Highest versus lowest selenium exposure, outcome: 2.19 Prostate cancer risk.
Ethical criteria
All trials fulfilled informed consent and ethics board approval criteria (Algotar 2013; Dreno 2007; Karp 2013; Marshall 2011; NPCT 2002; Reid 2008; SELECT 2009), except for Li 2000, Yu 1991, Yu 1997, and Lubinski 2011, which did not mention these criteria.
Effects of interventions
See: Summary of findings for the main comparison Highest compared with lowest selenium exposure for preventing cancer in randomised controlled studies with low risk of bias; Summary of findings 2 Highest compared with lowest selenium exposure for preventing cancer in observational studies
1. Randomised controlled trials
We reported results from Duffield‐Lillico 2002 for all outcomes evaluated in the NPCT study (NPCT 2002) (prostate cancer, lung cancer, bladder cancer, colorectal and breast cancer, any cancer, and death from cancer), except for prostate cancer, for which we also used Duffield‐Lillico 2003a, in: NPCT 2002, and for the primary outcome, non‐melanoma skin cancer, whose results were reported in Duffield‐Lillico 2003b, in: NPCT 2002. For the SELECT study (SELECT 2009), we included only results from Lippman 2009, in: SELECT 2009, which reported on the blinded period of follow‐up with continuing selenium supplementation ‐ not from Klein 2011, in: SELECT 2009, which reported a longer period of follow‐up, including a subsequent period without selenium supplementation, and was discontinued in 2008 in compliance with the recommendation of the trial's independent DSMC (Lippman 2009 and Klein 2011, in: SELECT 2009). This second report by Klein et al included an additional period of 32 months (23% person‐time increase), along with the first follow‐up period, and results were essentially similar to those of Lippman et al 2009. For bladder cancer risk in SELECT, we used data from Lotan 2012, in: SELECT 2009, which encompassed the same extended period of follow‐up as Klein 2011, in: SELECT 2009, but was the only report available from the SELECT trial on this cancer type. For prostate cancer in SELECT, we also evaluated three reports published in 2014 that addressed specific population subgroups and cancer subtypes (Albanes 2014; Kristal 2014; Martinez 2014). For the ECOG trial, we used the 2013 report for all cancer types (Karp 2013).
1.1. Preventive efficacy outcomes
1.1.1. Any cancer incidence and mortality
Five studies evaluated the outcome of any cancer incidence (Algotar 2013; Karp 2013; Lubinski 2011; NPCT 2002; SELECT 2009); we assessed three of these trials as having low risk of bias (Algotar 2013; Karp 2013; SELECT 2009). Risk ratios (RRs) were based on detection of 1043 cases among 10,026 participants receiving supplemental selenium and 942 cases among 9449 participants allocated to placebo. We found no evidence of reduced incident cancer risk in studies at low risk of bias (RR 1.01, 95% confidence interval (CI) 0.93 to 1.10), nor in the analysis including all studies (RR 0.99, 95% CI 0.86 to 1.14) (Analysis 1.1).
When we evaluated mortality from all cancers as an outcome, we could include only two studies in the analysis (NPCT 2002; SELECT 2009), one of which was at low risk of bias (SELECT 2009). When we considered only this latter trial, no difference in mortality rates between selenium and placebo arms emerged (RR 1.02, 95% CI 0.80 to 1.30). However, when we considered all studies, risk in the selenium group was lower than risk in the placebo group (RR 0.81, 95% CI 0.49 to 1.32) (Analysis 1.2).
1.1.2. Head and neck cancer
Two trials investigated effects of selenium supplementation on risk of head and neck cancer (Karp 2013; NPCT 2002), but only one was at low risk of bias (Karp 2013). In analysis restricted to the study having low risk of bias, no relation emerged for the risk of this cancer type, with a summary RR of 1.00 (95% CI 0.18 to 5.45), and analysis pooling both studies yielded statistically unstable risk estimates (RR 1.22, 95% CI 0.52 to 2.85), based on 13 cases in the selenium arms and 9 cases in the placebo arms (Analysis 1.3).
1.1.3. Esophageal cancer
Two RCTs investigated the risk of oesophageal cancer associated with selenium supplementation (Karp 2013; NPCT 2002), but only one was at low risk of bias (Karp 2013). The number of cases in these studies was very low (3 in the selenium arms and 5 in the placebo arms), thus yielding very imprecise RR estimates. The summary RR for oesophageal cancer was 1.50 (95% 0.06 to 36.86) in the only study with low risk of bias, and 0.53 (95% CI 0.12 to 2.28) in overall studies (Analysis 1.4).
1.1.4. Colorectal cancer
Three randomised controlled trials investigated the risk of colorectal cancer following selenium supplementation. These studies reported 76 cases in the selenium arms and 83 cases in the placebo arms (Karp 2013; NPCT 2002; SELECT 2009); two were at low risk of bias (Karp 2013; SELECT 2009). The summary RR of colorectal cancer was 0.99 (95% CI 0.69 to 1.43) in the two studies with low risk of bias, and 0.74 (95% CI 0.41 to 1.33) in all studies (Analysis 1.5).
1.1.5. Liver cancer
Four RCTs investigated the efficacy of selenium supplementation for liver cancer prevention, three of which were conducted in China with participants of different high‐risk groups in Qidong province, and one in the United States among individuals with resected non‐small‐cell lung cancer (Karp 2013; Li 2000; Yu 1991; Yu 1997). Yu 1991 reported on a trial with 2474 male and female first‐degree relatives of patients with liver cancer. During the study period of two years, investigators observed 10 participants in the selenium group, who received 200 µg selenium yeast/d, and 13 cases in the placebo group (RR 0.55, 95% CI 0.24 to 1.25). Yu 1997 investigated a four‐year supplementation period with 200 µg selenium yeast/d in 226 male and female hepatitis B‐surface antigen (HBs‐Ag) carriers. Investigators detected 11 cases (person‐time incidence rate: 1573.03/100,000) in the placebo group and four cases in the selenium group (RR 0.36, 95% CI 0.12 to 1.11) during the eight‐year follow‐up period. The mean blood selenium level during the intervention period was 152 µg/L in the intervention group and 107 µg/L in the control group. Li 2000 randomly assigned 2065 male HBs‐Ag carriers to receive 0.5 mg sodium selenite or placebo daily for three years. Thirty‐four cases of liver cancer occurred among 1112 participants receiving selenium, and 57 cases occurred among 953 placebo participants (RR 0.51, 95% CI 0.34 to 0.77).
Karp 2013 allocated 521 individuals with history of resected non‐small‐cell lung cancer to 200 µg/d selenium as selenised yeast or to placebo. During follow‐up, investigators diagnosed six new cases of liver cancer (actually coded as occurring to the ‘liver, gallbladder and bile duct’)‐ all in the selenium arm. We deemed this study to have low risk of bias.
The three Chinese studies had unclear risk of bias owing to lack of clear reporting of generation of allocation sequence or allocation concealment, and/or completeness of outcome data. Limiting analysis to the only study not downgraded owing to risk of bias yielded an RR of 6.52 (95% CI 0.37 to 115.49) (Analysis 1.6). The overall RR of the four studies was 0.52 (95% CI 0.35 to 0.79).
1.1.6. Melanoma
Three RCTs investigated the risk of melanoma following selenium supplementation (Algotar 2013; Karp 2013; NPCT 2002), but we judged only two of them to have low risk of bias (Algotar 2013; Karp 2013). For eight cases in the selenium arms and four cases in the placebo arms, the summary RR estimate was 1.35 (95% CI 0.41 to 4.52) in RCTs at low risk of bias. The RR estimate was slightly lower when all studies were considered (RR 1.28, 95% CI 0.63 to 2.59) (Analysis 1.7).
1.1.7. Non‐melanoma skin cancer
1.1.7.1. Total non‐melanoma skin cancer
Risk of non‐melanoma skin cancer was the primary outcome of the NPCT,which reported higher risk in the selenium‐supplemented group than in the placebo group (unadjusted RR 1.27, 95% CI 1.11 to 1.45) (Duffield‐Lillico 2003a, in: NPCT 2002). This increase was confirmed by multi‐variable analysis after adjustment for confounders (hazard ratio (HR) 1.17, 95% CI 1.02 to 1.34) and was concentrated among participants in the highest two tertiles of baseline plasma selenium (≥ 105.6 µg/L), although increased risk for total non‐melanoma skin cancer was seen in all tertiles of baseline plasma selenium levels (Reid 2008). No variation in this effect appeared to be induced by age, sex, or smoking habits, and eliminating cases that occurred during the first period of selenium supplementation (one to two years) induced a slight decline in RRs. The mean selenium plasma concentration for participants was 114 µg/L at the time of randomisation. In the arm of the NPCT that was carried out in a single location ‐ Macon, Georgia, USA ‐ and included both 200 and 400 µg/d selenium supplementation (Reid 2008), non‐melanoma skin cancer risk increased in the 200‐µg/d arm after adjustment for age, sex, and smoking (unadjusted RR 1.49, 95% CI 1.10 to 2.03; adjusted HR 1.50, 95% CI 1.13 to 2.04) but not in the 400‐µg/d arm (unadjusted RR 0.88, 95% CI 0.66 to 1.16; adjusted HR 0.91, 95% CI 0.69 to 1.20). At the remaining sites, where only 200 µg/d of supplemental selenium was given, the RR was 1.24 (95% CI 1.07 to 1.45) and the HR was 1.18 (95% CI 1.02 to 1.37). Distribution of baseline plasma selenium levels was similar in this substudy to that in the NPCT main study, and no evidence of effect modification according to baseline selenium exposure emerged. Overall, the NPCT did not support preventive efficacy of selenium yeast supplementation against non‐melanoma skin cancer in these populations; on the contrary, investigators reported a cancer‐promoting effect of selenium for this cancer type, which was the primary trial endpoint, raising concern about potentially harmful effects of such selenium supplementation (NPCT 2002).
SELECT, which is the largest selenium supplementation trial conducted to date (Lippman 2009 and Klein 2011, in: SELECT 2009), thus far has not investigated the incidence of non‐melanoma skin cancer. A small trial in a French population of 184 organ graft recipients who were considered to be at high risk of premalignant and malignant epithelial lesions (Dreno 2007) investigated non‐melanoma skin cancer. This trial detected a higher incidence of skin cancer among 91 selenium‐supplemented participants (six cases; 6.6%) compared with 93 placebo‐supplemented participants (two cases; 2.2%; P = 0.15) during a five‐year follow‐up, which in its first three years comprised daily supplementation with selenised yeast containing 200 µg selenium.
A small trial among participants at high risk for prostate cancer also investigated the effects of using selenium supplements of 200 and 400 µg/d on risk of non‐melanoma skin cancer, with a median follow‐up of three years (Algotar 2013). Results for non‐melanoma skin cancer from this study showed the occurrence of three cases among 232 placebo‐treated participants and 11 cases among 467 selenium‐supplemented participants (eight cases among 234 individuals receiving 200 µg/d of selenium, and three cases among 233 individuals receiving 400 µg/d), with increased risk after overall selenium supplementation (incidence rate ratio from our calculation 1.8, 95% CI 0.5 to 10.2) but no evidence of a dose‐response relation.
The ECOG trial investigated non‐melanoma skin cancer and found 19 cases during follow‐up of 521 placebo‐treated participants and 11 cases among 1040 selenium‐allocated participants (Karp 2013). The RR of non‐melanoma skin cancer in this study was computed as 0.66(95% CI 0.37 to 1.19).
Overall, the summary RR for non‐melanoma skin cancer in selenium‐supplemented participants could be computed by pooling RRs from the above trials, rather than by using numbers of participants and cases, because the number of skin cancer cases diagnosed in the NPCT was not reported in the relevant publication (Duffield‐Lillico 2003a, in: NPCT 2002). The estimated RR limited to the only two trials with low risk of bias indicated a statistically unstable increased risk of non‐melanoma skin cancer associated with selenium supplementation of 200 µg/d (RR 1.16, 95% CI 0.30 to 4.42), with similar risk results when analysis was performed on the four trials overall (RR 1.23, 95% CI 0.73 to 2.08) (Analysis 1.8) (Algotar 2013; Karp 2013).
1.1.7.2. Basal cell carcinoma (BCC)
Algotar 2013 found in the 200‐ and 400‐µg/d selenium groups an RR of 0.86 (95% CI 0.42 to 1.77) and 0.80 (95% CI 0.38 to 1.66), respectively; and an RR in both treatment groups combined of 0.83 (95% CI 0.45 to 1.54). ECOG 5597 found an RR of 0.54 (95% CI 0.26 to 1.14) (Karp 2013).
At the end of the blinded treatment period in NPCT 2002, the unadjusted RR for basal cell carcinoma in the 200‐µg/d selenium group was 1.17 (95% CI 1.02 to 1.35), and the adjusted HR was 1.09 (95% CI 0.94 to 1.26). Eliminating cases that occurred within the first two years of supplementation had no effect on the RR. Reid 2008 found a crude RR of 0.90 (95% CI 0.65 to 1.24) and an adjusted HR of 0.95 (95% CI 0.69 to 1.29) for this cancer type in the 400‐µg/d selenium substudy. In a small trial with no RR estimates (Dreno 2007), three cases of BCC occurred among 91 selenium‐supplemented participants, along with one case among 93 placebo‐receiving participants.
1.1.7.3. Squamous cell carcinoma (SCC)
Algotar 2013 found an RR of 0.58 (95% CI 0.27 to 1.25) and 0.12 (95% CI 0.03 to 0.50) in the 200‐ and 400‐µg/d trial populations, respectively, and for all participants, the RR was 0.35 (95% CI 0.17 to 0.72). ECOG 5597 found an RR of 0.92 (95% CI 0.34 to 2.47) (Karp 2013).
In NPCT 2002, selenium supplementation increased the risk of SCC (unadjusted RR 1.32, 95% CI 1.09 to 1.60; adjusted HR 1.25, 95% CI 1.03 to 1.51). Adverse effects of selenium supplementation on SCC risk appeared to increase with increasing plasma selenium levels at baseline, in that higher risk was seen only in participants at the highest two tertiles of baseline levels (≥ 105.6 µg/L), suggesting an interaction between supplementation and baseline exposure. In the 400‐µg/d selenium substudy (Reid 2008), investigators reported no change in SCC risk by selenium supplementation (crude RR 1.20, 95% CI 0.85 to 1.68; adjusted HR 1.05, 95% CI 0.71 to 1.56). Dreno 2007, the smaller trial, reported that two among 91 selenium‐supplemented individuals were given a diagnosis of SCC, whereas no cases were observed among placebo participants.
1.1.8. Lung cancer
Three RCTs have investigated lung cancer risk associated with selenium administration (Karp 2013; NPCT 2002; SELECT 2009), with two assessed as having low risk of bias (Karp 2013; SELECT 2009). Summary RR estimates were 1.16 (95% CI 0.89 to 1.50) when we limited the analysis to studies at low risk of bias, and 1.03 (95% CI 0.78 to 1.37) when we included all studies (Analysis 1.9).
1.1.9. Female breast cancer
Three studies evaluated breast cancer risk associated with selenium supplementation (Karp 2013; Lubinski 2011; NPCT 2002), one of which we judged as having low risk of bias (Karp 2013). The RR from the study with low risk of bias was 2.04 (95% CI 0.44 to 9.55), with statistical imprecision due to the small number of cases (eight in the selenium arm, two in the placebo arm). The pooled RR from all studies was 1.44 (95% CI 0.96 to 2.17) (Analysis 1.10).
1.1.10. Bladder cancer
Three studies evaluated bladder cancer outcomes (Karp 2013; NPCT 2002; SELECT 2009), two of which we judged as having low risk of bias (Karp 2013; SELECT 2009), The summary RR from the only studies at low risk of bias was 1.07 (95% CI 0.76 to 1.52). The corresponding RR for all studies, encompassing a total of 146 cases ‐ 79 in the selenium arms and 67 in the placebo arms ‐ was 1.10 (95% CI 0.79 to 1.52) (Analysis 1.11).
1.1.11. Prostate cancer
Five trials evaluated prostate cancer (Algotar 2013; Karp 2013; Marshall 2011; NPCT 2002; SELECT 2009), all of which we judged as having low risk of bias, except for NPCT 2002. Meta‐analysis for prostate cancer‐based trials at low risk of bias yielded an RR of 1.01 (95% CI 0.90 to 1.14) for the 9630 participants supplemented with selenium (520 cases) compared with the 9312 participants allocated to placebo (500 cases), indicating no effect of intervention (supplementation of organic selenium at 200 µg/d) on prostate cancer risk, with very consistent results and no heterogeneity across these studies (I² = 0.0%). The overall RR was 0.91 (95% CI 0.75 to 1.12) when all studies were considered; moderate heterogeneity (I² = 36%) emerged owing to the addition of the NPCT (Analysis 1.12) (NPCT 2002).
The trial that first investigated the relation between selenium exposure and prostate cancer risk (Duffield‐Lillico 2002 and Duffield‐Lillico 2003b, in: NPCT 2002) reported a reduction in prostate cancer incidence in the selenium‐treated group, which was particularly strong during the first period of follow‐up (1983 to 1993; adjusted HR 0.35, 95% CI 0.16 to 0.65) and was slightly higher but still much lower than unity during the entire period of follow‐up (1983 to 1996; HR 0.48, 95% CI 0.28 to 0.80). Analyses stratified by baseline plasma selenium category showed greatly reduced risk associated with active treatment among participants with baseline plasma selenium ≤ 106.4 µg/L (HR 0.14, 95% CI 0.03 to 0.61) in the intermediate category (106.8 to 123.2 µg/L; HR 0.33, 95% CI 0.13 to 0.82), while in the upper category (> 123.2 µg/L), the HR was 1.14 (95% CI 0.51 to 2.59). Selenium supplementation in participants with baseline PSA ≤ 4 ng/mL was associated with considerably reduced risk (HR 0.33, 95% CI 0.14 to 0.79) compared with risk in individuals with PSA > 4 ng/mL (HR 0.95, 95% CI 0.42 to 2.14). However, interpretation of these NPCT findings is complicated by a potentially serious source of bias. As reported in 2003 by the study authors, a considerably higher percentage of participants with elevated PSA levels in the placebo group underwent prostatic biopsy as compared with participants in the selenium group (35% vs 14%; P < 0.05; Duffield‐Lillico 2003b, in: NPCT 2002). Differences in biopsy rates were greatest among participants with the lowest baseline selenium concentrations ‐ the subgroup that appeared to derive the greatest beneficial effects of selenium administration. This may have contributed to substantial overestimation of the effects of selenium supplementation in the NPCT.
The SELECT trial found no evidence of benefit derived from selenium supplementation (compared with placebo) over a median of 5.5 years in terms of prostate cancer incidence (HR 1.03, 95% CI 0.90 to 1.18, 99% CI 0.87 to 1.24) (SELECT 2009). The adjusted HR for prostate cancer in the selenium plus vitamin E group compared with the placebo group was 1.05 (95% CI 0.91 to 1.20, 99% CI 0.88 to 1.25). The original report of the trial provided no specific RR estimate according to disease severity, but during an extended follow‐up of this cohort after selenium supplementation had ceased (Klein 2011, in: SELECT 2009), investigators found increased risk of Gleason 7 or greater disease (HR 1.21, 99% CI 0.90 to 1.63). It is interesting to note that the SELECT trial included only participants with PSA ≤ 4 ng/mL ‐ the group in the NPCT that showed greatest apparent benefit. During this further follow‐up of the SELECT cohort, risk of prostate cancer in the selenium arm also slightly increased compared with that described in the first report, which had included only the active supplementation period (Lippman 2009, in: SELECT 2009). In this longer follow‐up based on 575 prostate cancer cases in the selenium arm and 529 in the placebo arm, the RR of prostate cancer was 1.09 (99% CI 0.93 to 1.27).
Three further reports from SELECT on the relation between selenium administration and prostate cancer risk have been published (Albanes 2014; Kristal 2014; Martinez 2014); where investigators looked at more specific associations than were addressed in the two main publications from this trial (Lippman 2009 and Klein 2011, in: SELECT 2009). Kristal 2014 performed a case‐cohort study within the SELECT study by including 1739 total prostate cancer cases (of which 489 showed high‐grade (Gleason 7 to 10) disease) and 3117 randomly selected men composing the control subcohort (Kristal 2014). Administration of selenium (both selenium only and selenium combined with vitamin E) had no effect on prostate cancer risk among men with low baseline selenium status (< 60th percentile of toenail selenium), but among participants in the two upper quintiles of baseline selenium exposure, risk of prostate cancer was increased (HR 1.20, 95% CI 0.85 to 1.81), particularly high‐grade prostate cancer (HR 1.62, 95% CI 0.95 to 2.77). HRs were even higher when any selenium supplementation (alone or with vitamin E) was considered because such supplementation increased the risk of any prostate cancer (RR 1.27, 95% CI 0.92 to 1.74) and high‐grade disease (RR 1.91, 95% CI 1.20 to 3.05).
Martinez 2014 investigated the effect of selenium supplementation on prostate cancer risk among participants in SELECT who had genotypes associated with altered mRNA expression of the androgen‐regulated prostate tumour suppressor protein NKX3.1. The design was still of the case‐cohort type, encompassing 1866 prostate cancer cases and 3135 non‐prostate cancer cases. Trial authors found that selenium administration combined with the CC genotype at rs11781886 increased overall prostate cancer risk (HR 1.68, 95% CI 1.01 to 2.78) and low‐grade prostate cancer risk (HR 1.81, 95% CI 1.02 to 3.23), but they noted no such interaction for the other genotypes.
Finally, in a SELECT subpopulation composed of 1746 prostate cancer cases and a subcohort of 3211 men, Albanes 2014 investigated a possible association between baseline plasma α‐tocopherol and γ‐tocopherol and active supplementation with selenium (and vitamin E as α‐tocopherol) in terms of prostate cancer risk. Trial authors found a strong excess of risk among participants in the highest baseline α‐tocopherol category (fifth quintile) receiving selenium supplementation (HR 2.04, 95% CI, 1.29 to 3.22, P trend 0.005), which was higher with high‐grade (Gleason grade 7 to 10) disease among men receiving selenium (HR 2.12, 95% CI, 1.32 to 3.40, P‐trend 0.0002). These findings suggest a possible biological interaction between α‐tocopherol status and selenium supplementation in increasing high‐grade prostate cancer risk.
In Marshall 2011, prostate cancer incidence was 35.6% versus 36.6% in selenium‐supplemented compared with placebo‐treated participants after three years of follow‐up, respectively. The overall RR was 0.91, with a 95% CI of 0.55 to 1.52 (courtesy of James Marshall, unpublished data). Analysis of RRs according to baseline plasma selenium levels showed no dose‐response effect, with point estimates of 0.82 (95% CI 0.40 to 1.69), 1.38 (95% CI 0.68 to 2.78), 0.98 (95% CI 0.58 to 1.68), and 0.91 (95% CI 0.45 to 1.84), when the quartile of selenium status was increased at baseline.
The NBT reported an HR of prostate cancer of 0.94 (95% CI 0.52 to 1.70) for participants receiving 200 µg/d and 0.90 (95% CI 0.48 to 1.66) for those receiving 400 µg/d, compared with placebo (Algotar 2013). Although average baseline selenium status, as assessed through plasma selenium, was higher than in the NPCT (median value 126.1 vs 115.0 µg/L), the lowest tertile of plasma selenium levels had a median value (101.1 µg/L) well below the apparent threshold of around 120 µg/L, at which a beneficial effect of selenium seemed to occur in the NPCT. Furthermore, as noted by study authors, 45% of participants enrolled in this study had baseline plasma selenium levels < 123 µg/L, which is the upper threshold for a protective effect of selenium supplementation according to results of the NPCT. Trial authors also stated: "None of the baseline variables modified the effect of selenium on the primary endpoint", and plasma selenium concentration at baseline was among these variables (Algotar 2013).
Karp 2013, the ECOG trial, carried out in subjects with resected non‐small‐cell lung cancer, reported nine and 16 cases of newly diagnosed prostate cancer among 250 and 509 male participants in the placebo and selenium groups, respectively. This allowed us to compute an RR of 0.87 (95% CI 0.39 to 1.45) for prostate cancer in the selenium‐supplemented arm.
Following the NPCT, none of the subsequent, high‐quality RCTs provided evidence suggesting that baseline selenium status could modify the effect of selenium supplementation on subsequent prostate cancer occurrence. In the NBT, the bottom category (tertile) of baseline plasma selenium levels in this trial population was 101.1 µg/L, i.e. lower than the upper bound of the bottom category (106.4 µg/L) and the middle category (106.8 to 123.2 µg/L) in the NPCT, both of which had shown a strongly decreased subsequent prostate cancer occurrence (Algotar 2013). In the SWOG S9917 study, results of selenium supplementation were also made available for four categories (quartiles) of baseline plasma selenium and showed no effect of treatment in any categories (Marshall 2011). These categories were < 106, 106–132, 132–162, and > 162 µg/L, and corresponding RRs of prostate cancer in the selenium‐supplemented group were 0.82 (95% CI 0.40 to 1.69), 1.38 (95% CI 0.68 to 2.78), 0.98 (95% CI 0.58 to 1.68), and 0.91 (95% CI 0.45 to 1.84), respectively, versus an overall study RR of 0.97 (95% CI 0.68 to 1.39). Therefore, also in this high‐quality trial, the bottom category of baseline selenium exposure was entirely similar to the corresponding one in the NPCT, but in contrast to NPCT, no effect of selenium supplementation emerged and no evidence showed risk of bias. Finally, a case‐cohort study carried out within SELECT and published in 2014 provided data showing the relation between baseline selenium exposure and effects of selenium supplementation (Kristal 2014). In that study, whose average selenium exposure was higher than that characterising the NPCT and the NBT, investigators reported no effect of selenium supplementation on both overall prostate cancer and low‐grade and high‐grade prostate cancer in the three quintiles of baseline toenail selenium levels, but enhanced risk of high‐grade prostate cancer emerged for the two upper quintiles (alone and combined). Quintile cutoff points for these categories of the trial population were 0.758, 0.832, 0.901, and 1.003 µg/g. Overall, these results clearly indicate that even in subgroups with the lowest baseline selenium status in these Western populations, selenium provided no protective effect for prevention of prostate cancer, although this is the cancer type that once was thought to be most strongly associated with a beneficial effect of selenium supplementation.
1.1.12. Haematological cancers
Two trials evaluated the risk of haematological malignancies associated with selenium administration (Karp 2013; NPCT 2002) using 23 cases only ‐ 14 in the selenium arms and 9 in the placebo arms ‐ but we judged only one trial to be at low risk of bias (Karp 2013). The summary RR was 1.00 (95% CI 0.25 to 3.99) in the study at low risk of bias and 1.21 (95% CI 0.52 to 2.80) when all studies were considered (Analysis 1.13).
1.2. Adverse effects outcomes
The RCTs on selenium have provided unexpected information about the incidence of adverse effects of selenium supplementation and have unexpectedly become a key source of data for risk assessment of the upper safe level of selenium exposure in humans (Vinceti 2017a; Vinceti 2017b). Thirty‐five participants withdrew from the NPCT because of adverse effects, mainly gastrointestinal upset. The RR for adverse events in the selenium group was 1.51 (95% CI 0.74 to 3.11) (our calculation, based on the number of randomly assigned participants). Reports of increased risk of glaucoma in Marshall 2011 and NPCT 2002 prompted additional studies on this issue (Bruhn 2009), and likely led to inclusion of cataract and glaucoma among the several potential adverse events monitored during subsequent trials in which investigators administered selenium (Algotar 2013).
In the NPCT, a secondary analysis of participants who did not have diabetes at the start of the study unexpectedly revealed an excess risk of type 2 diabetes mellitus in the selenium group (adjusted HR 1.55, 95% CI 1.03 to 2.33) (Stranges 2007). That study found increased risk of developing type 2 diabetes associated with selenium supplementation across all tertiles of baseline plasma selenium levels, although the excess was much greater for the upper category of > 121.6 µg/L (RR 2.70, 95% CI 1.30 to 5.61) than for the lower (RR 1.13, 95% CI 0.58 to 2.18) and intermediate (RR 1.36, 95% CI 0.60 to 3.09) categories. Increased risk of diabetes associated with selenium supplementation was independent of baseline age, sex, smoking status, and body mass index (BMI), with the exception of participants in the top tertile of BMI. SELECT reported a slight increase in the incidence of type 2 diabetes in the selenium‐alone group (RR 1.07, 99% CI 0.94 to 1.22). Any such excess risk decreased over time after selenium supplementation ceased, as is shown by results of the Klein study (Klein 2011, in: SELECT 2009). In this study, the RR of diabetes was 1.04 (99% CI 0.93 to 1.17), thus supporting a short‐term effect of selenium supplementation on diabetes risk.
Although the three trials on liver cancer and Reid 2008 did not mention the occurrence of adverse effects, and Dreno 2007 and Marshall 2011 (the SWOG 2011 trial) apparently performed no assessment of diabetes incidence, three recent phase 3 RCTs have investigated the occurrence of diabetes after selenium supplementation for prevention of malignant and non‐malignant cancer. In the NBT, during five years of follow‐up of 699 participants at high risk for prostate cancer supplemented with 200 or 400 µg/d of selenium or placebo, Algotar 2013 reported the occurrence of diabetes in 12, 12, and 7 participants, respectively. This allowed us to compute an incidence rate ratio of 1.70 (95% CI 0.62 to 5.10) and 1.71 (95% CI 0.62 to 5.12) among 200‐ and 400‐µg/d selenium‐supplemented participants, respectively, compared with those given placebo. The ECOG trial, which was carried out in 1561 participants with resected stage I non–small‐cell lung cancer, trial authors did not explicitly report the RR of diabetes during follow‐up (Karp 2013). However, occurrence during four years of follow‐up (2007 to 2011) was stated as 26 new diagnoses of diabetes in the selenium arm (1040 participants at baseline, of whom 865 underwent toxicity assessment) and 12 new diagnoses among placebo‐treated participants (521/477). On the basis of these numbers, we could compute an RR of 1.09 (95% CI 0.55 to 2.13) or, for participants with toxicity assessment, 1.19 (95% CI 0.61 to 2.35) ‐ values comparable with those observed in the other trials, except for NPCT. Most recently, in an intervention study investigating the effect of selenium supplementation for prevention of colorectal adenoma recurrence compared with placebo (the SELCEL trial), 31 cases of diabetes occurred in the selenium‐treated group and 25 in the placebo group during follow‐up, with an RR of 1.25 (95% CI 0.74 to 2.11) (Thompson 2016). Therefore, an excess incidence of type 2 diabetes systematically emerged in all trials that investigated this adverse effect (Vinceti 2017b).
The SELECT study also looked at other side effects known to be associated with selenium overexposure (Vinceti 2001), finding an association for some of them. Selenium treatment increased the occurrence of alopecia (RR 1.28, 95% CI 1.07 to 1.53, based on 265/206 cases in selenium and placebo arms), dermatitis (RR 1.16, 95% CI 1.03 to 1.29, 619/524), nail changes (RR 1.04, 95% CI 0.96 to 1.13, 1087/1035), and halitosis (RR 1.17, 95% CI 0.99 to 1.38, 503/427).
2. Observational studies
When risks of cancer for higher and lower levels of selenium exposure are compared, a summary risk estimate of one suggests no association between selenium exposure and cancer, and summary risk estimates below and above one suggest a beneficial or harmful effect of higher selenium exposure, respectively. We evaluated the statistical precision of the point estimates by assessing the width of their 95% or 99% confidence intervals.
2.1. Aetiological association: results from meta‐analyses
2.1.1. Any cancer
We meta‐analysed results of 16 prospective observational studies on total cancer risk, including data on more than 276,000 participants. The cohorts of Salonen 1984 and Salonen 1985 overlapped. Hence, we included only data from Salonen 1985 in the meta‐analysis. We had to omit Fex 1987, as the CI value was not reported and could not be calculated from available data.
For participants in the highest category of pre diagnostic selenium exposure, the summary risk estimate was odds ratio (OR) 0.72 (95% CI 0.55 to 0.93) for cancer incidence and OR 0.76 (95% CI 0.59 to 0.97) for cancer mortality for both sexes combined (Analysis 2.1), when compared with participants in the lowest exposure category. We observed moderate to substantial heterogeneity for both incidence (I² = 45%) and mortality (I² = 67%).
Analyses by sex revealed lower point estimates for men (incidence: OR 0.72, 95% CI 0.46 to 1.14; mortality: OR 0.65, 95% CI 0.45 to 0.94) (Analysis 2.2) than for women (incidence: OR 0.90, 95% CI 0.45 to 1.77; mortality: OR 0.91, 95% CI 0.80 to 1.03) (Analysis 2.3).
All studies but one (Sun 2016) used a circulating biomarker (serum and plasma selenium levels) for assessment of selenium status. Analysis 2.4 shows the results in ascending order of baseline exposure for those studies that reported category borders. The graph does not reveal any systematic pattern of changes in the relation between selenium status and cancer risk according to increasing baseline selenium levels. Analysis 2.5 shows the results in ascending order for differences in selenium levels.
2.1.2. Stomach cancer
No additional cohort studies on stomach cancer and selenium exposure have been published since the last update of this review; therefore meta‐analysis for this cancer type was still based on five studies. The summary risk estimate for both sexes combined was OR 0.66 (95% CI 0.43 to 1.01) in the highest exposure category when compared with the lowest (I² = 51%) (Analysis 2.6). In this meta‐analysis, we included one cohort twice because trial authors reported results stratified according to cardia and non‐cardia gastric cancer (Mark 2000, in: Wei 2004).
Use of available sex‐stratified results for meta‐analysis yielded a risk estimate for men of OR 0.43 (95% CI 0.14 to 1.32) (I² = 56%), and for women of OR 0.73 (95% CI 0.12 to 4.35) (I² = 62%) (Analysis 2.7).
2.1.3. Colorectal/Colon cancer
Six observational studies reported data on the incidence of colorectal cancer. The summary risk estimate was OR 0.82 (95% CI 0.72 to 0.94) for both sexes combined (I² = 0.0%) (Analysis 2.8), with OR 0.86 (95% CI 0.65 to 1.16) for men and OR 0.96 (95% CI 0.61 to 1.50) for women (Analysis 2.9). Five studies reported data stratified or restricted to colon cancer. The summary estimate was OR 0.81 (95% CI 0.69 to 0.96) for both sexes combined (I² = 0.0%) (Analysis 2.10), with OR 0.84 (95% CI 0.56 to 1.25) for men and OR 0.68 (95% CI 0.44 to 1.04) for women (Analysis 2.11).
2.1.4. Lung cancer
We included 13 studies in this meta‐analysis. We did not meta‐analyse data from Menkes 1986 and Knekt 1990, as the study population of the former overlapped with that of Comstock 1997 (another meta‐analysed study) ‐ and results of the latter were presented in insufficient detail.
The summary risk estimate for lung cancer incidence for both sexes combined was 0.82 (95% CI 0.59 to 1.14) (Analysis 2.12). We noted substantial heterogeneity among study results (I² = 66%). We found little difference in summary estimates when results were disaggregated by sex (Analysis 2.13), by indicator of selenium exposure (intake, blood or toenail content) (Analysis 2.14), by baseline serum/plasma bottom exposure category (Analysis 2.15), and by ascending differences in selenium levels (Analysis 2.16). In the latter analyses, we noted no dose‐response relation between baseline selenium and risk.
2.1.5. Female breast cancer
We included eight studies in this meta‐analysis. Data show little association between baseline selenium levels and breast cancer risk, with a slightly but imprecisely higher risk for higher exposure (OR 1.09, 95% CI 0.87 to 1.37) (Analysis 2.17). The heterogeneity of results was low (I² = 14%).
2.1.6. Bladder cancer
Meta‐analysis of bladder cancer incidence in five observational studies revealed an inverse association, with an overall risk estimate of 0.67 (95% CI 0.46 to 0.97) (Analysis 2.18) (heterogeneity: I² = 30%). Sex‐disaggregated data were available only from Michaud 2005 and showed an inverse association between selenium exposure and risk in women, but not in men. Two studies included only male participants (Michaud 2002; Nomura 1987); both found a reduced but imprecisely estimated bladder cancer risk for higher selenium exposure (Analysis 2.18). Heterogeneity was not reduced by sex stratification (I² = 40% in study results for men). No further studies had been published since the last update of this review (Vinceti 2014).
2.1.7. Prostate cancer
We included 21 epidemiological studies on prostate cancer incidence in the meta‐analysis. The summary risk estimate for higher selenium exposure was OR 0.84 (95% CI 0.75 to 0.95) (heterogeneity: I² = 27%) (Analysis 2.19). Stratification of the analysis by method of selenium assessment revealed an inverse association between baseline selenium and risk when exposure was assessed through blood selenium levels (OR 0.86, 95% CI 0.75 to 0.99) or toenails (OR 0.60, 95% CI 0.44 to 0.82), but not when dietary assessment methods were used (OR 0.99, 95% CI 0.85 to 1.15) (Analysis 2.20). When we stratified analysis according to baseline (blood) selenium exposure or differences in selenium (blood) levels, no specific relation or pattern emerged between selenium and prostate cancer risk across the entire exposure spectrum (Analysis 2.21; Analysis 2.22).
2.2. Aetiological association: other results
For all other types of cancer, data were available from fewer than five epidemiological studies; thus we did not meta‐analyse the results. We have reported in Table 3 results of observational studies not included in meta‐analyses. None of these study results support an association between selenium exposure and gynaecological cancer risk, and results for cancers of the gastrointestinal, respiratory, or urological tract are inconsistent. For respiratory and urological cancers, studies reported either no association or increased risk for participants with higher selenium exposure. For gastrointestinal cancers including cancer of the liver and other sites not mentioned above, studies found either no association or reduced risk with higher selenium exposure.
| Organ system | Cancer | Case definition | Risk ratio estimate (highest vs lowest exposure category) | 95% CI | Selenium marker | Sex | Study |
| Gynaecological | Cervix | incidence | 0.89 | 0.40 to 2.00 | serum | women | Menkes 1986 (Batieha 1993) |
| 1.10 | n.r. | serum | |||||
| Gynaecological (without breast) | incidence | 0.96 | n.r. | serum | |||
| Ovary | incidence | 0.87 | 0.25 to 5.26 | serum | Knekt 1990 (Knekt 1996) | ||
| 1.22 | 0.44 to 3.38 | toenail | |||||
| 0.58 | 0.2 to 1.7 | serum | Menkes 1986 (Helzlsour 1996) | ||||
| 1.00 | 0.73 to 1.37 | suppl. intake | |||||
| Uterus | incidence | 1.38 | 0.62 to 3.08 | toenail | |||
| Gastrointestinal | Gastrointestinal tract (all) | incidence | 1.00 | n.r. | serum/plasma | both | |
| Oesophageal squamous cell carcinoma | incidence | 0.37 | 0.16 to 0.86 | toenail | both | ||
| 0.67 | 0.53 to 1.30 | intake | both | ||||
| Oesophageal adenocarcinoma | incidence | 0.76 | 0.41 to 1.40 | toenail | both | ||
| Oesophagus | incidence | 0.56 | 0.44 to 0.71 | serum | both | Wei 2004 (Mark 2000) | |
| mortality | 0.62 | 0.44 to 0.89 | serum | ||||
| mortality | 0.35 | 0.16 to 0.81 | serum | both | |||
| incidence | 0.27 | 0.03 to 2.21 | suppl. intake | both | |||
| Gastric cardio adenocarcinoma | incidence | 0.52 | 0.27 to 1.02 | toenail | both | ||
| Oesophagus and stomach | incidence | 0.45 | n.r. | serum | men | Knekt 1990 (Knekt 1988) | |
| incidence | 0.67 | n.r. | serum | women | |||
| Liver | incidence | 0.62 | 0.21 to 1.86 | plasma | men | ||
| 0.41 | 0.23 to 0.72 | serum | both | ||||
| 0.86 | 0.52 to to 1.43 | intake | both | ||||
| 0.95 | 0.51 to 1.76 | men | |||||
| 0.70 | 0.26 to 1.90 | women | |||||
| mortality | 0.50 | 0.28 to 0.90 | toenail | both | |||
| 0.57 | 0.31 to 1.05 | men | |||||
| 0.18 | 0.03 to 1.13 | women | |||||
| Pancreas | incidence | 0.08 | 0.01 to 0.56 | serum | men | Menkes 1986 (Burney 1989) | |
| 0.83 | 0.40 to 1.67 | women | |||||
| 0.58 | n.r. | serum | men | ||||
| 3.49 | n.r. | women | |||||
| 0.72 | 0.36 to 1.43 | intake | both | ||||
| 0.69 | 0.39 to 1.20 | supplemental intake | both | ||||
| Rectum | incidence | 0.625 | n.r. | serum | men | ||
| 1.05 | 0.54 to 2.03 | toenail | both |
| |||
| 0.91 | 0.41 to 2.00 | men | |||||
| 1.58 | 0.59 to 4.22 | women | |||||
| 0.80 | 0.68 to 0.95 | supplement use | both | ||||
| 1.09 | 0.63 to 1.89 | serum | both | ||||
| 1.32 | 0.55 to 3.19 | men | |||||
| 0.76 | 0.32 to 1.80 | women | |||||
| Urological cancers | Renal cancer | incidence | 0.40 | 0.17 to 0.98 | dietary intake | both | |
| Urinary tract (all) | incidence | 0.97 | 0.72 to 1.31 | serum | both | ||
| 0.81 | n.r. | serum | men | ||||
| 4.12 | n.r. | women | |||||
| Respiratory tract | Cavum oris/pharynx | incidence | 5.43 | n.r. | serum | both | Menkes 1986 (Zheng 1993) |
| Skin | Melanoma | incidence | 1.66 | 0.71 to 3.85 | toenail | women | |
| 0.90 | 0.30 to 2.50 | serum | both | Menkes 1986 (Breslow 1995) | |||
| 0.98 | 0.69 to 1.41 | suppl. intake | both | Peters 2008 (Asgari 2009) | |||
| Any non‐melanoma cancer | incidence | 0.77 | n.r. | plasma | both | ||
| Basal cell carcinoma | incidence | 0.54 | n.r. | serum | men | ||
| 1.55 | n.r. | women | |||||
| 0.80 | 0.10 to 4.5 | serum | both | Menkes 1986 (Breslow 1995) | |||
| 0.86 | 0.38 to 1.96 | serum | both | ||||
| 0.95 | 0.59 to 1.50 | intake | |||||
| Squamous cell carcinoma | incidence | 0.69 | 0.51 to 0.92 | plasma | both | ||
| 0.60 | 0.20 to 1.50 | serum | both | Menkes 1986 (Breslow 1995) | |||
| 0.86 | 0.47 to 1.58 | plasma | both | ||||
| 1.30 | 0.77 to 2.3 | intake | both | ||||
| 0.49 | 0.24 to 0.99 | serum | |||||
| Other | Haematological | incidence | 0.60 | n.r. | serum/plasma | both | |
| incidence | 0.95 | 0.75 to 1.20 | suppl. intake | both | |||
| Thyroid | incidence | 0.13 | 0.02 to 0.77 | serum | both | ||
| 0.15 | 0.0 to 5.0 | men | |||||
| 0.12 | 0.01 to 1.11 | women | |||||
| 1.35 | 0.99 to 1.84 | intake | both | ||||
| 1.23 | 0.71 to 2.12 | men | |||||
| 1.14 | 1.65 to 2.02 | women |
n.r. = not reported.
Discussion
Summary of main results
The aims of this review were to examine the efficacy of selenium supplementation in preventing cancer and, more generally, to analyse the association between selenium exposure and risk of cancer in men and women.
Randomised controlled trials (RCTs) and preventive efficacy
We aimed to identify all RCTs so far carried out, extending the standard search by using unconventional methods such as citation chasing and scanning of conference proceedings ‐ methods that have proved effective in yielding additional high‐quality evidence for systematic reviews and meta‐analyses for other topics (Greenhalgh 2005; Vinceti 2017c). Using this approach, we identified a total of 10 RCTs that investigated monoselenium supplements for prevention of non‐melanoma skin cancer, prostate cancer, any cancer, and other site‐specific cancers. Overall, clear and consistent evidence indicates that selenium supplementation did not reduce subsequent cancer incidence, whether this endpoint was considered a primary or secondary outcome. Most of these trials raised concerns about possible harmful effects of selenium supplements, including increased incidence of non‐melanoma skin cancer in the Nutritional Prevention of Cancer Trial (NPCT), dermatological effects in the Selenium and Vitamin E Cancer Prevention Trial (SELECT), and type 2 diabetes in all RCTs, although with generally limited and statistically imprecise risk ratios (RRs).
Of the three liver cancer prevention trials, one reported a strongly reduced risk of liver cancer for male carriers of the hepatitis B surface antigen (HBs‐Ag) taking inorganic selenium supplements (sodium selenite) for three years, and the other two studies reported little effect of organic selenium supplements (selenium yeast) for the same cancer site (Li 2000; Yu 1991; Yu 1997). Owing to several methodological concerns related to randomisation and completeness of outcome data, we judged the risk of bias as unclear for all three of these RCTs. Therefore, we could not conclude that we found strong support for selenium supplements as agents for prevention of liver cancer. Unfortunately, the other trials did not include liver cancer among their secondary outcomes, with the exception of ECOG 5597 (Karp 2013). In this RCT, investigators reported new cases of liver, gallbladder, and bile duct cancer only among selenium‐treated participants; however, trial authors observed a total of only six cases, making risk estimates highly statistically unstable. In addition, the population included in this trial, which comprised patients with a history of resected non‐small‐cell lung cancer, was rather different from the general population.
The NPCT (NPCT 2002) reported strongly decreased risk for all cancers (‐22%), and for oesophageal (‐59%), colorectal (‐52%), lung (‐28%), and prostate (‐46%) cancers, showing lesser decreases compared with the ad interim report (Clark 1996, in: NPCT 2002), but still indicative of a strong cancer preventive effect. In addition, when participants were categorised into tertiles according to baseline serum selenium, evidence suggested an inverse relationship between selenium status and effects of supplementation for all cancers and for prostate cancer in the lower two tertiles, and no effect in the upper tertile. However, interpretation of these results is difficult because in 2003, the trial authors acknowledged the occurrence of a detection bias, namely, a considerably higher rate of prostate biopsy in the placebo group, whose cause was not specified. It is unclear whether this detection bias applied only to prostate cancer or applied more generally to other outcomes (as would be the case if the bias was due to unblinding, for example). This major detection bias forced us to downgrade the reliability of this study. Data show an increase in the incidence of its primary outcome ‐ non‐melanoma skin cancer ‐ in selenium‐supplemented participants, as well as in the incidence of five other cancer types, including melanoma, bladder cancer, breast cancer, head and neck cancer, and lymphoma and leukaemia. Trial authors stated: "These results, although non‐significant and based on small case numbers, may indicate potential increased risk with selenium supplementation"; these authors also relied on previous observational studies to provide some support for these positive associations (Duffield‐Lillico 2002, in: NPCT 2002).
The turning point of research on selenium and cancer was the SELECT trial (SELECT 2009), a large, well‐conducted prostate cancer prevention trial carried out in the male general population of North America not at high risk of prostate cancer (≤ 4 ng/mL in serum prostate‐specific antigen (PSA) and digital rectal examination not suspicious for cancer). This trial, widely considered a milestone in cancer prevention and research, found no difference in prostate cancer incidence for selenium–supplemented participants as compared with placebo participants after a median follow‐up of 5.5 years (hazard ratio (HR) 1.04, 95% confidence interval (CI) 0.90 to 1.18), and no effect of selenium on risk of overall cancer or on risk of other cancers (as well as cardiovascular disease). Median selenium at baseline (135 µg/L in serum in the selenium arm vs 137.6 µg/L in the placebo arm) was higher than in the NPCT (average plasma selenium 114 µg/L). The intervention used in this trial was different from that used in the NPCT (selenomethionine in SELECT, and selenised yeast in the former), although this is unlikely to have been responsible for observed differences (Waters 2013); in both cases, the intervention comprised organic selenium species (Block 2004).
In a small study of organ transplant recipients (Dreno 2007), an unexpected increase in non‐melanoma skin cancer incidence emerged; this was a matter of concern in the light of results of the NPCT. In the Polish trial Lubinski 2011, which included 1135 women with high genetic susceptibility to breast cancer due to BRCA1 mutations, evidence was more consistent with increased risk of both all cancers and primary breast cancer than with decreased risk, although with statistically unstable HRs (1.4, 95% CI 0.9 to 2.0; and 1.3, 95% CI 0.7 to 2.5, respectively). In this trial, the intervention consisted of administration of 250 µg/d of inorganic tetravalent selenium (selenite).
More recently, results of three well‐conducted phase 3 trials in participants at higher risk for prostate cancer than the general male population indicated that 200 µg/d of selenium (as selenomethionine in one study ‐ Marshall 2011 ‐ and as selenised yeast in the other two ‐ Algotar 2013; Karp 2013) did not decrease subsequent cancer incidence compared with placebo. The baseline selenium status of populations included in these RCTs was comparable with that in SELECT for Southwest Oncology Group (SWOG) S9917 (135 to 138 µg/L in the two arms) (Marshall 2011), slightly lower in the Negative Biopsy Trial (NBT) (126.1 µg/L) (Algotar 2013), and unfortunately unspecified for Eastern Cooperative Oncology Group (ECOG) 5597 (Karp 2013). Results of these high‐quality RCTs, all characterised by low risk of bias and two of which were discontinued before their planned end for futility, were consistent and showed no beneficial effect of selenium treatment on cancer risk.
Although not eligible for our meta‐analyses because their outcome was non‐malignant neoplasms rather than cancer, two recently published RCTs on colorectal adenoma risk in participants receiving selenium are worth noting. One of these trials was embedded in SELECT (Lance 2017), and the other, the SELCEL trial (an intervention study investigating the effect of selenium supplementation or celecoxib for prevention of colorectal adenoma recurrence), allocated 1374 men and women who had undergone removal of colorectal adenomas to either 200 µg/d selenium as selenised yeast, or placebo (Thompson 2016). Both RCTs did not find a beneficial effect of selenium for prevention of colorectal adenoma.
The RCTs carried out on selenium have generated clear evidence of adverse effects associated with selenium exposure, showing both the health effects related to overexposure and the amount at which these effects become evident, thus providing much more reliable evidence than that generated by environmental studies such as Vinceti 2017a for use in risk assessments of the safe upper limit of selenium exposure in humans. The trial that provided the most evidence about selenium‐associated adverse effects was SELECT. These effects include an excess risk of dermatitis and alopecia, non‐melanoma skin cancer, high‐grade prostate cancer, and type 2 diabetes. The excess risk of dermatological effects was anticipated as a potential side effect based on previous knowledge of health consequences of human overexposure to this element (Vinceti 2001), although such effects had been predicted to occur at higher amounts of selenium exposure than those experienced by SELECT supplemented participants, thus calling for reassessment of the upper limit of selenium exposure. The increased incidence of non‐melanoma skin cancer in NPCT and of advanced prostate cancer in SELECT was extremely disappointing, as they were the primary endpoints in these studies, and the expectation was that they would be reduced. The excess risk of diabetes in selenium‐supplemented NPCT participants, which was also an unanticipated finding, was mostly limited to participants in the two highest tertiles of baseline plasma selenium (> 105.2 µg/L), raising concern about the safety of selenium amounts that thus far had been considered entirely safe (i.e. on the order of 200 µg/d) (Stranges 2007). Therefore, subsequent RCTs added this endpoint to monitored adverse effects that contributed to interruption of the SELECT trial, together with the null effect on cancer mortality and adverse effects of vitamin E on prostate cancer risk (Lippman 2009, in: SELECT 2009). So far, all RCTs that included diabetes among trial endpoints, including trials investigating risk of colorectal adenoma, have shown an increased incidence of type 2 diabetes among selenium‐allocated participants, with RRs ranging from 1.08 to 1.71, although most estimates were statistically imprecise (Vinceti 2017b). In addition, in SELECT, a slight decrease in excess risk of diabetes in the intervention arm followed completion of selenium supplementation, further suggesting a causal relation between selenium administration and the disease (Lippman 2009 and Klein 2011, in: SELECT 2009). Currently, an excess risk of type 2 diabetes appears to be one of the adverse effects of selenium of greatest concern, and its plausibility is supported by the results of observational human studies (cohort, case‐control, and cross‐sectional), as well as by some biological plausibility (Galan‐Chilet 2017; Su 2016; Thompson 2016; Vinceti 2015; Vinceti 2017b; Zhou 2013). These side effects, in addition to the null results of RCTs, particularly of those of the highest quality, make implementation of new trials very unlikely owing to ethical concerns.
Observational studies and aetiological association
From our meta‐analyses of 16 prospective observational studies on overall cancer risk, we found lower cancer risk associated with highest selenium exposure compared with lowest exposure. Risk of cancer was 28% (95% CI 7% to 45%) lower in the highest category of selenium exposure than in the lowest, and risk of death from cancer was 24% (95% CI 3% to 41%) lower. Subgroup analyses by sex yielded increased evidence of this inverse association between selenium exposure and cancer risk in men compared with women.
The inverse association between overall cancer risk and baseline selenium levels was mainly attributable to lower risks of gastrointestinal, lung, and bladder cancer, and for men also prostate cancer. No association was seen between selenium and risk of breast cancer in women. However, when the amount of baseline exposure was taken into consideration, no clear and consistent trend between baseline selenium exposure and risk emerged for any of the major outcomes investigated in observational studies. Lack of lower risk of cancer in the highest versus the lowest selenium category among participants with the lowest baseline exposure levels compared with those with intermediate or high levels, for overall cancer, lung cancer, and prostate cancer, argues against a causal association between selenium exposure and cancer risk. This is supported by lack of a relation between differences in the highest and lowest categories of selenium exposure and the corresponding RR, further suggesting that larger differences in exposure are not associated with large and consistent decreases in RR. Finally, further uncertainty of the evidence generated by observational studies arises from the inconsistent and sometimes sharply conflicting results on the same cancer type that emerged from different studies.
We saw little evidence of any effect of modification on the relation of selenium and cancer by geographical area of residence. It should however be noted that most of the observational cohort studies that we examined were conducted in Europe and in the USA, and none were conducted in Africa or South America. This regional distribution seems to reflect the under representation of non‐Western and resource‐poor countries in epidemiological research (Pearce 2004). Differential regional representation in epidemiological studies is of special interest for this review, as selenium levels in humans around the world vary significantly. Even if selenium levels measured in included cohorts reflect a broad range of naturally occurring selenium exposure, investigators have reported some of the lowest and highest levels of selenium exposure in populations from South America (Jaffé 1992), Africa (Hurst 2013b), China (Li 2012), and India (Chawla 2016) ‐ regions not investigated by any of the reviewed observational studies, with the exception of three Chinese trials. Concerning sex‐related effects, our meta‐analysis of longitudinal studies revealed an inverse association between RR of cancer and selenium status in some cases in men but not in women for the same cancer type. Unfortunately, although more than half of reviewed studies included mixed‐sex populations, most did not report sex‐disaggregated results. In available sex‐specific results, men are over represented ‐ a fact that may potentially hamper assessment of the relation between selenium exposure and cancer risk in women. Theoretically, factors such as variations in body composition between men and women, including lean body mass versus fat composition, or differences in metabolism or in nutritional requirements (e.g. higher antioxidant requirements, particularly for the urological system) between the two sexes might be associated with differential effects of selenium for prevention of cancer.
Concerning the indicator used to assess selenium exposure and its relation with cancer risk, we observed generally null associations when evaluating selenium status through assessment of dietary intake, although some inverse associations at specific cancer sites emerged when we used biomarkers such as blood or toenail selenium levels. We extensively reviewed in the previous version of this review the characteristics and limitations of indicators of selenium exposure, with particular reference to dietary assessment methods and biomarkers, and inconsistencies across studies assessing the validity of different indicators (Ashton 2009; Fairweather‐Tait 2011; Jablonska 2015a; Vinceti 2014). In particular, a large body of literature concerns the limitations of dietary assessment methods, mainly linked to large variations of selenium content in single food types, and the limitations of biomarkers of exposure. Concerning the latter, a major source of exposure misclassification consists of the different behaviours of inorganic and organic selenium species, whose tendency to be retained in the body and to accumulate in specific body tissues greatly varies, although this does not necessarily correlate with their biological activity (Behne 1996; Behne 2010; Kim 2001; Michalke 2017; Panter 1996; Slavik 2008; Solovyev 2013; Steen 2008; Tiwary 2006; Vinceti 2013c). Investigators have frequently proposed that selenoprotein activity may be an indicator of selenium status and may be tested in association with cancer risk (Vinceti 2017b), but this relation has been questioned because different sources of oxidative stress, paradoxically including pro‐oxidant selenium species themselves, may upregulate selenoprotein activity (Jablonska 2015a). Furthermore, intake of heavy metals and other dietary factors such as vitamins, metalloids, and amino acids (e.g. methionine) may modify the health effects of selenium, or the relations between selenium exposure and biomarkers (Jablonska 2015a; Vinceti 2000), owing to metabolic interactions or changes in tissue‐specific deposition and retention of selenium (Behne 1996; Zeng 2005; Zwolak 2012).
Overall, available evidence indicates the potential for exposure misclassification in observational studies on selenium, as well as the pitfalls associated with an approach based on assessment of total selenium content in peripheral biomarkers, suggesting that in some instances, measurements of nutritional intake might provide better exposure estimates than are provided by biomarkers, particularly in the light of relative exposure to inorganic and organic species of the element. In general, observational cohort studies on selenium and cancer are expected to have been characterised by random exposure misclassification, thus shifting RRs towards the unity and reducing the ability to detect real associations. However, some exposure misclassification may have been non‐random, such as that induced by smoking, which although it is a source of selenium exposure also induces lower body selenium levels, possibly owing to an effect of cadmium in increasing selenium excretion (Vinceti 2000). In such cases, exposure misclassification based on biomarkers (serum/plasma selenium levels) may have substantially biased risk estimates and may have been associated with some degree of confounding due to the well‐known effect of smoking on cancer risk, which could not have been adequately captured and controlled for. Inadequate control for smoking has been suggested to be a major confounder inducing spurious associations between low selenium levels and enhanced cancer risk in observational studies (Beane Freeman 2015).
In addition to exposure misclassification, and probably more important than this, a major issue affecting observational studies is unmeasured confounding (Vinceti 2016a). This potential bias is a matter of greater concern than exposure misclassification because it may have systematically biased RRs in one direction, particularly for some cancer types. Moreover, detection (and control) of this bias is extremely difficult and nearly impossible, given the hundreds of nutritional and non‐nutritional lifestyle variables that may be associated with both variations in selenium intake and cancer risk. Among these factors are smoking (Beane Freeman 2015; Vinceti 2013b), socioeconomic status ‐ which appears to be positively associated with socioeconomic position in both men and women (Gundacker 2006; Niskar 2003) ‐and most likely hundreds of nutritional and toxicological factors that may vary in the diet, together with selenium intake. An approach that would reduce the risk of unmeasured confounding in observational studies might include investigation of dietary patterns rather than single nutrients, but these investigations seem not to have made adjustments for diet quality. Finally, it should be noted that most studies did not take into account the role of genetic factors (related to selenoproteins or otherwise) in the relation between selenium exposure and cancer risk, although some studies have suggested the importance of such relations (Jablonska 2016; Meplan 2014); the true relevance of genetic factors has not yet been well defined. Some studies examining selenoprotein‐related single‐nucleotide polymorphisms have suggested a role for genetic variants among genes coding for selenoproteins in modifying cancer risk, or in determining the relation between selenium exposure and subsequent cancer risk, although results have not been consistent (Geybels 2013; Meplan 2012; Penney 2010; Penney 2013; Slattery 2012; Takata 2011).
With awareness of the fundamental limitations of observational studies, even of those of longitudinal design, which may avoid selection bias or reverse causality, investigators designed and carried out in the 1990s and the 2000s several experimental studies as RCTs investigating the effect of selenium supplements on cancer risk. The evidence base from these intervention studies has become so large and complete as to allow a comprehensive evaluation of cancer risk associated with selenium supplementation for some specific cancer types. It is interesting to note that major interest in the cancer preventive activity of selenium originated not just from observational studies (mainly of ecological and cohort design) (Vinceti 2013b), but from a randomised trial ‐ the ad interim analysis of the NPCT, which was published in 1996 and attracted great interest from both the scientific community and the general public because of the apparently large beneficial effect that it reported (Clark 1996, in: NPCT 2002). Null results of the most recent low‐bias RCTs ‐ Algotar 2013; Marshall 2011; SELECT 2009 ‐ also do not suggest a major or strong role of genetic factors in modifying selenium and cancer relations, given their generally null or troubling results. An exception can be seen in recent data from SELECT, which suggest that a genetic variant of the NKX3.1 androgen‐regulated prostate tumour suppressor protein may modify, or increase, the risk of prostate cancer associated with selenium supplementation (Martinez 2014).
From a methodological perspective, we acknowledge that comparison of risks between highest and lowest exposure categories in observational studies, as performed in the present meta‐analysis, is most suitable for identifying an effect when a consistent decrease or increase is seen across absolute exposure levels. Other associations (e.g. threshold effects, U‐shaped relations) may have been missed by this method of meta‐analysis, or their true effect might have been diminished.
Overall completeness and applicability of evidence
RCTs and preventive efficacy
This review investigated a diverse range of cancers, substantially extending the analysis compared with that performed in previous reviews. However, cancer is not a uniform condition, and malignant neoplasms show great differences in tumour biology. Only non‐melanoma skin cancer, liver cancer, and prostate cancer have been investigated as primary outcomes in the included prevention trials, and, regarding these main outcomes, specific characteristics of study populations may limit the generalisability of results. Participants in included RCTs on skin and liver cancer belonged to populations at high risk for the outcome under investigation, and participants in high‐quality prostate cancer trials were at average risk (Karp 2013; SELECT 2009), or at high risk (Algotar 2013; Marshall 2011), for this disease. Most participants in the NPCT were older and white, predominantly male inhabitants of the United States, and the most recent trials were limited to the USA male population.
Average baseline selenium exposure in the NPCT was less than that characterising subsequent trials carried out in the United States, although it was more similar to that seen in some European populations. Although the NPCT suggested that selenium supplementation was beneficial only at the lowest range of baseline selenium exposure, the most recent studies, carried out in populations generally characterised by higher average selenium exposure, did not confirm such an interaction. The NPCT also found an indication of strong effect modification for sex, as demonstrated, for example, by the HR for all cancers associated with selenium supplementation ‐ 0.67 (95% CI 0.50 to 0.89) in men and 1.20 (95% CI 0.66 to 2.20) in women (NPCT 2002).
Participants in the SELECT study on prostate cancer prevention were apparently healthy men over 50 years of age from the general population of North America (SELECT 2009). A large sample size and inclusion of non‐white participants from different socioeconomic backgrounds support the generalisability of study findings to other adequately nourished populations.
Selenium supplements generally contain organic or inorganic species of selenium, or a mixture of both (e.g. in the form of selenised yeast). Different species of selenium may exhibit different effects on human health and more specifically on proteomic endpoints, as also suggested by human controlled randomised trials though with inconsistent results (Ravn‐Haren 2008; Richie 2014). High‐quality RCTs using selenised yeast supplements, almost entirely comprising organic selenium forms (Block 2004; Waters 2013), found no effect of supplementation on the main study outcome and an indication of a harmful effect (i.e. an excess diabetes risk) (Vinceti 2017b). The SELECT trial used supplements of L‐selenomethionine, which is the major component of selenised yeast, and also found no preventive efficacy. The only two RCTs investigating sodium selenite supplements found a protective effect against liver cancer, and null or adverse effects on breast cancer risk, but we considered these trials to have unclear risk of bias. It is unclear how applicable these results are in other settings and in populations with a different nutritional status. Interpretation of the results of clinical trials using selenium supplements should consider the different chemical forms of selenium, as well as their potentially different health effects when used as supplements (Vinceti 2013c; Weekley 2013). Most studies used organic selenium as selenised yeast (Algotar 2013; NPCT 2002), or as selenomethionine (Marshall 2011; SELECT 2009). However, the chemical form used is unlikely to explain the differences in results between NPCT and the other trials (Waters 2013). With reference to this issue, of interest are the results of a 'natural experiment' that occurred in Northern Italy, wherein a small population unintentionally consumed for several years drinking water with an unusually high content of selenium in its inorganic hexavalent form ‐ selenate (Vinceti 2000). Follow‐up of that population revealed increased risk of neurodegenerative disease ‐ a not entirely unexpected finding owing to the potential neurotoxicity of inorganic selenium (Vinceti 2014a), along with a slightly increased risk of cancer, mainly due to excess risk of oropharyngeal cancer, melanoma, kidney cancer, and lymphoid malignancies (Vinceti 2016b).
An important issue is the possibility that participants with low baseline selenium status may experience an inverse association between selenium exposure and cancer risk, as suggested by some trial authors (Lu 2016; Rayman 2009). This has been suggested to explain the different results of SELECT and the NPCT, and could also hypothetically explain, at least in part, the different relations found in experimental as compared with observational studies. NPCT found a strong beneficial effect of selenium supplementation among participants at the lowest tertiles of baseline selenium levels; however, the risk of cancer changed abruptly from an apparently protective effect in the two lower tertiles (HR 0.51 and 0.70) to an excess risk in the highest tertile of plasma selenium (HR 1.20, 95% CI 0.77 to 1.86). This occurred despite a difference of only 16.4 µg/L between lowest and highest tertiles, corresponding to a change in dietary selenium intake as low as around 10 µg. This would imply that such a small a change in selenium dietary intake would change a strongly protective effect of the element on cancer risk into a possibly detrimental effect ‐ an implausible scenario given the wide range of selenium intake (from about 20 to several hundred micrograms) characterising Western populations. Moreover, the intermediate tertile of baseline plasma selenium in the NPCT (105.6 to 122.0 µg/L) appeared to be associated not only with reduced overall cancer risk but also with an excess risk of squamous cell skin carcinoma (HR 1.49, 95% CI 1.05 to 2.12) and overall non‐melanoma skin cancer (NPCT 2002), as well as diabetes (RR 1.36, 95% CI 0.60 to 3.09), whose risk also considerably increased at the highest tertile of baseline selenium (Stranges 2007). Overall, this occurrence of both adverse and beneficial effects is unlikely if the selenium supplementation was serving to remedy a selenium deficiency. In addition, the strongest effect of selenium on overall cancer risk at lower levels of baseline selenium status was due to a considerable decrease in prostate cancer, but this finding was subject to detection bias because of a decreased biopsy rate in selenium‐supplemented participants, particularly in those with lowest baseline selenium status, as recognised by investigators of the NPCT (NPCT 2002).
In addition, after NPCT, three of the four high‐quality RCTs on selenium supplementation for cancer prevention investigated the possible modifying effect of baseline selenium exposure and found no evidence of a beneficial effect of the intervention even in the lowest baseline exposure category. For instance, in NBT (Algotar 2013), the average baseline plasma selenium level at the lowest tertile of the study population was 101.1 µg/L ‐ much lower than the corresponding level at the middle tertile of NPCT (114.6 µg/L), in which the HR of prostate cancer had been as low as 0.33 (95% CI 0.13 to 0.82). However, in this ‘low’ NBT subgroup, investigators found no evidence of a beneficial effect of selenium supplementation on prostate cancer risk. In the SWOG S9917 trial (Marshall 2011), data show no change in the null effect of selenium in the two lowest categories (quartiles) of selenium intake, whose boundaries were < 106 and 106 to132 µg/L ‐ similar to cut points of the two bottom NPCT tertiles and of the bottom category of NBT. In these two subgroups of the SWOG population with the lowest baseline selenium status, the RR of prostate cancer was 0.82 (95% CI 0.40 to 1.69) and 1.38 (95% CI 0.68 to 2.78), and in the third upper quartile, the RR was 0.98 (95% CI 0.58 to 1.68), suggesting no consistent trend of an inverse relation between antecedent selenium exposure and effects of supplementation (as was also shown by analysis for trend in this study). Investigators in SELECT reported no reduction in cancer risk among selenium‐supplemented participants, although they did not provide specific RRs according to baseline selenium status. Calculation of blood selenium content distribution in SELECT, as well as in the three other RCTs (NPCT, NBT, SWOG), showed substantial overlap of plasma and serum selenium levels between this large trial population and the other study populations (Figure 7). In addition, a more recent case‐cohort study carried out within SELECT assessed the effect of selenium supplementation on prostate cancer risk, taking into consideration baseline selenium exposure, as assessed through toenail selenium levels. The study, which involved 1739 prostate cancer cases and 3117 controls, was unable to find a beneficial effect of selenium supplementation in the lowest categories (quintiles) of baseline toenail selenium (Kristal 2014). Actually, a dose‐response effect in that SELECT population emerged, but it favoured an increased risk of (high‐grade) prostate cancer induced by selenium supplementation among participants belonging to the two upper quintiles of baseline selenium exposure (Kristal 2014). Therefore, it seems reasonable to agree with this SELECT statement: “The analysis of our data using lower cut points for baseline toenail Se categories, in an attempt to replicate findings from the NPCT, also showed no evidence of benefit from supplementation among men with low baseline Se status (data given in Results). Given these findings, we believe it reasonable to conclude that Se supplementation of men at the low range of Se intake common in USA men will not reduce PCa risk” (Kristal 2014).
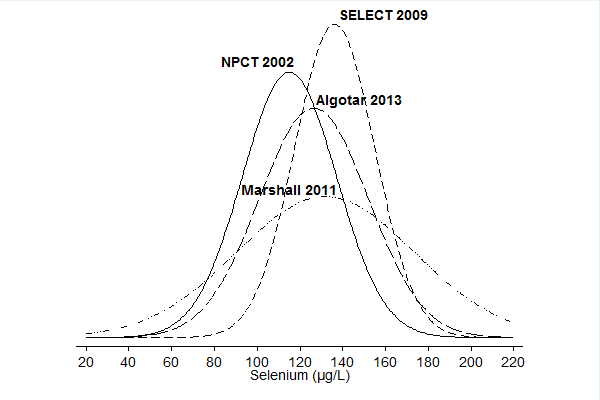
Baseline circulating selenium levels in the NPC trial (Duffield‐Lillico 2003b in: NPCT 2002), the NBT (Algotar 2013), SWOG trial (as plasma selenium) (Marshall 2011), and SELECT (as serum selenium) (Lippman 2009, in: SELECT 2009). When median and interquartile values were reported, we estimated mean and standard deviation according to Cochrane guidelines provided in Higgins 2011a.
Overall, results of recent high‐quality RCTs do not support the hypothesis that differing baseline selenium status may explain conflicting results between NPCT and SELECT (Lu 2016; Rayman 2009). Results of the most recent RCTs seem therefore to be applicable to populations with various degrees of background selenium exposure, with the exception of populations characterised by extremely low (< 20 µg) or high selenium intake.
Observational studies and aetiological association
We reviewed data from prospective observational studies in which investigators measured selenium exposure in populations without evidence of cancer, who were then followed up for a specified period of time. We limited our systematic review to cohort studies to avoid or decrease two major sources of bias in observational investigations, particularly in case‐control and cross‐sectional studies (i.e. selection bias and risk of reverse causality). Data continue to show important differences among included studies in terms of selenium exposure assessment, types of outcomes, and study populations, which may affect their interpretation. The small number of studies that examined most of the meta‐analysed types of cancers prevented a thorough investigation of sources of heterogeneity between study results. In particular, we had limited opportunity to explore the influence of specific sources of bias or the methodological quality of epidemiological studies on heterogeneity.
Participants examined in this review update include more than 2,300,000 individuals, predominantly from Europe and North America, and, to a much lesser extent, from Asia and Australia. We were able to identify no prospective observational studies on selenium and cancer risk from Africa or South America. This regional distribution reflects the under representation of non‐Western and resource‐poor countries in epidemiological research (Pearce 2004). Differential regional representation in epidemiological studies is of special interest for this review, as selenium levels in humans around the world vary significantly. Selenium levels measured in the included cohorts reflect a broad range of naturally occurring selenium exposure, as documented by several epidemiological studies worldwide. However, some of the lowest and highest selenium levels in humans have been reported in populations in South America (Jaffé 1992) ‐ a region not investigated by any of the reviewed observational studies.
More than half of the included studies enrolled mixed‐sex populations, but most did not report sex‐disaggregated results. In available sex‐specific results, men are over represented ‐ a fact that could hamper potential assessment of the relation between selenium exposure and cancer risk in women. Despite this sex imbalance, we systematically saw stronger (inverse) associations with cancer risk among men than among women, for whom such associations with antecedent selenium status was nearly absent. This was true for stomach, colorectal, and lung cancer, and, when added to the inverse association for prostate cancer, led to an impact on overall cancer risk that was clearly lacking in women that could be due to potential confounders (such as smoking, occupational exposures, or other dietary factors) or to a real change in the association between selenium exposure and cancer risk in the two sexes.
The range of selenium exposure experienced by members of cohorts investigated in the observational studies was generally lower than that experienced by participants in RCTs, who added supplemental selenium, generally 200 µg/d and in its organic forms, to their usual background intake, which ranged from about 70 to 90 µg/d as organic selenium, although some RCTs provided no estimate (Jablonska 2015a). It is theoretically possible that a preventive effect of selenium against cancer exists only at low (< 30 to 50 µg/d) intake of the element, and that it disappears at higher intakes, when ‘saturation’ or ‘maximisation’ of selenoprotein expression driven by selenium occurs. Investigations have frequently chosen this proteomic endpoint as a reference point for deriving dietary reference values for selenium (Jablonska 2015a; Vinceti 2017a). Selenium exposure in the range of around 50 to 200 µg of daily selenium intake has not been tested by intervention studies, which have used larger amounts of supplemental selenium, and is unlikely to be tested in RCTs in the future, given the termination of past trials for futility or safety concerns. This possibility must be considered, but within the context of the two fundamental limitations of observational studies ‐ exposure misclassification and unmeasured confounding, which limit the reliability of the evidence they generate and its applicability in terms of cancer prevention.
A few lines of evidence suggest that even at low levels of selenium exposure, it is unlikely that such an inverse association with cancer risk exists. First, inconsistencies in the results found in our meta‐analysis for most cancer sites and lack of a dose‐response relation between cancer risk and selenium at varying levels of background selenium exposure, or of a difference between highest and lowest exposure categories, argue against a real relation between selenium and cancer risk. Limited differences between highest and lowest categories of selenium intake, often amounting to a difference of only 20 to 30 µg per day, compared with large variations in selenium intake worldwide (from 10 to 15 µg in low‐selenium areas up to several hundred µg in seleniferous areas), also argue against a true relation. Finally, as previously described, some recent high‐quality RCTs investigated the effect of baseline selenium status on cancer risk associated with selenium supplementation and found no beneficial effect of selenium supplementation, even among participants with the lowest amounts of baseline exposure. Overall, these findings do not support an association between higher selenium status and lower cancer risk independently from factors such as sex, baseline selenium exposure, and cancer type. One additional observational cohort study, which could not be meta‐analysed in this review because it was released in PubMed in July 2017, appears to confirm these conclusions (Sandsveden 2017).
Quality of the evidence
RCTs and preventive efficacy
SELECT (SELECT 2009), SWOG S9917 (Marshall 2011), NBT (Algotar 2013), and ECOG 5597 (Karp 2013) were the only trials considered to have low risk of bias with adequate sequence generation, allocation concealment, blinding, and reporting of findings, and the consistency of their findings for prostate cancer, as well as for other cancer types for the two trials investigating them (SELECT and ECOG 5597), added to the statistical power of the major trial (SELECT), making their overall results highly reliable and suitable for yielding useful evidence to assess the relation between selenium supplementation and cancer prevention. These trials are also of major importance because (with one exception) they have provided information about baseline selenium exposure and its possible modifying role and about the effect of selenium supplementation on subsequent cancer incidence. Another important feature of these trials has been their ability to address the issue of selenium overexposure and related adverse effects owing to a systematic surveillance system for adverse effects, as well as their ability to extend the monitoring programme to additional effects, if suggested by new analyses targeting previously unplanned secondary endpoints, as was the case for diabetes (Stranges 2007). This is particularly relevant because all of these trials were planned under the hypothesis, later found to be erroneous but at that time endorsed by regulatory agencies, that the supplemental selenium dose administered to intervention arms (200 µg/d in almost all RCTs) was entirely safe and was well below the upper safe limit of the element, even with consideration of background selenium exposure.
These trials may continue to yield important results. Secondary analysis of additional endpoints, or based on genetic and non‐genetic biomarkers of exposure to selenium and other factors, is still possible. For example, major contributions were yielded by SELECT in 2017, concerning outcomes such as prevention of colorectal adenoma and of Alzheimer’s disease by selenium supplementation, in both cases with null results (Kryscio 2017; Lance 2017).
We assessed the certainty of evidence from high‐quality RCTs using the GRADE approach (http://gdt.guidelinedevelopment.org/app/handbook/handbook.html#h.svwngs6pm0f2) and reported the results of this assessment in the 'Summary of findings' table (summary of findings Table for the main comparison). From preliminary assignment to a high level of certainty due to the experimental study design, we did not identify reasons to downgrade trial quality according to standard GRADE guidelines for risk of all cancers, for risk of cancer mortality, or for risk of colorectal, lung, bladder, or prostate cancer. In contrast, meta‐analysis for breast cancer risk yielded a statistically imprecise result mainly reflecting the small number of cases, and meta‐analysis for non‐melanoma skin cancer showed high statistical heterogeneity across studies. When addressing factors possibly increasing the certainty of evidence assessment, we considered as non‐applicable the GRADE item “All plausible confounding would reduce the demonstrated effect or increase the effect if no effect was observed”, neither could we evaluate possible dose‐response gradients because unfortunately they were not tested in these RCTs. We therefore rated the certainty of evidence as ‘high’ if it indicates no effect of selenium supplementation on all cancers overall, on cancer mortality, nor on colorectal, lung, bladder, and prostate cancer, and we considered certainty of the evidence as ‘moderate’ if it indicates no effect on non‐melanoma skin cancer and breast cancer, with downgrades due to heterogeneity and imprecision, respectively. However, stating that the evidence supporting no effect of selenium on cancer prevention at these sites is of moderate rather than high certainty does not mean that the only alternative hypothesis is necessarily that selenium decreases risk of cancer at these sites. Actually, the overall results of high‐quality RCTs, when available, suggest a slight to moderate although statistically imprecise increase in the risk of some of these specific cancers following selenium supplementation.
Concerning the RCTs that we downgraded in our appraisal of risk of bias, we considered the quality of reporting to be an issue in the three trials on liver cancer prevention, thus leading to their classification as having unknown risk of bias. Several papers reported the individual trials, in some cases discrepantly, and essential questions regarding sequence generation, allocation concealment, handling of dropouts and withdrawals, and detection of outcomes remain unanswered. This might be due to inadequate reporting but might also hint at flaws in trial design and implementation. We were uncertain about whether the only trial that reported positive results for selenium supplements in liver cancer prevention randomly assigned participants individually. Cluster randomisation of participants who lived in the same area/village, which may have been the procedure used in this investigation, might have introduced additional bias to the study results (e.g. as the result of different environmental factors contributing to liver cancer development or detection) and might have led to an overestimation of the protective efficacy of selenium. Duplication of results of trials based on a rigorous study design would be necessary to assess the effects of sodium selenite on liver cancer incidence. With regard to the NPCT (NPCT 2002) and the trial of Dreno 2007, indications of serious detection bias for the USA study and of unclear methodological details (such as blinding) for the French investigation led us to consider these experimental studies to be at unclear risk of bias, as discussed in greater detail elsewhere in this review. As far as the trial on breast cancer is concerned (Lubinski 2011), our downgrade of evidence certainty was based on incomplete information provided in the only report that we could retrieve (an abstract), although we acknowledge the relevance of that trial ‐ the only trial specifically targeting breast cancer and a genetically specific population ‐ and the fact that complete reporting of trial procedures may lead to reassessment of trial quality and its upgrade.
Observational studies and aetiological association
The 70 observational studies were heterogeneous, not only in methodology, but also in the quality and level of detail of reporting and in their potential biases. We assessed our confidence in the evidence from these studies using the GRADE approach and reported our findings in summary of findings Table 2; we reported judgements only for those outcomes evaluated in the 'Summary of findings' table for RCTs with low risk of bias.
Confounding and other biases
Selenium measurement and exposure misclassification
All studies on total cancer risk identified cases by using registry links or a combination of several methods, and losses to follow‐up were generally very low. One study on cancer incidence and two studies on cancer mortality analysed less than 80% of all identified cases (incidence: Coates 1988: 79%; mortality: Kok 1987a: 71%; Kornitzer 2004: 57%). The main reason for this loss of sample was missing selenium measurements. Not all studies that assessed mortality as a measure of cancer risk excluded people with cancer at study inception. This might have led to overestimation of a protective effect if selenium levels were lowered by the presence of cancer. We therefore consider the results for cancer incidence to be more valid than the cancer mortality results.
Concerning the outcome most frequently investigated ‐ prostate cancer ‐ all but two of the included studies identified cases by using links to cancer registries or a combination of personal follow‐up interviews with PSA screening. Two studies with health professionals used self‐reporting for case identification, followed by confirmation through medical records. The number of people lost to follow‐up was low in all included studies. However, two studies included less than 80% of all identified cases in their analyses because samples were not available for selenium measurement, or diagnosis was not confirmed (Brooks 2001: 39%; van den Brandt 2003, in: van den Brandt 1993: 77%). In Brooks 2001, bias might have been introduced to the results to some extent, as demographic variables differed between identified and analysed cases.
Residual confounding and effect modification
Most of the included studies used controls for smoking and age by matching or using multi‐variate techniques. However, the control for self‐declared smoking habits may be inadequate, and this may occur particularly in people with a diagnosis of cancer (Connor Gorber 2009; Gerritsen 2015; Morales 2013). Control for smoking as a known risk factor for several types of cancer is an important issue in epidemiological studies on cancer risk, and inadequate control for this cancer risk factor has been recognised as a major methodological issue affecting observational research on selenium and cancer (Beane Freeman 2015). This possible bias may be particularly relevant for research on selenium biomarkers and cancer. Cigarette smokers tend to have lower selenium biomarker levels, although cigarette smoking in itself is a source of selenium exposure. In addition to this source of non‐random exposure misclassification, it is well recognised that smoking is a powerful cancer risk factor, thus qualifying it also as a major confounder when the selenium and cancer relation is investigated. Therefore, an inverse association between low baseline selenium status and lung cancer risk might be the result of residual confounding and effect modification by smoking, and this may also be true for other cancer types (Beane Freeman 2015). Exposure to environmental and household smoking, which has been shown to be associated with increased risk of cancer (Gorlova 2006; Nishino 2001), might be associated with selenium status due to differential nutritional behaviours or other mechanisms.
Several other factors may act as effect modifiers or confounders. Possible confounding factors could consist of another food nutrient or a certain behaviour that exhibits cancer protective effects and may be associated with higher intake of selenium‐rich foods. The number of candidates for such a role is so large that no observational study can measure all of these factors nor account for them. Furthermore, it is well known that intake of heavy metals (such as arsenic, cadmium, and mercury) and other dietary factors such as methionine may substantially modify selenium health effects or relations between selenium exposure and biomarkers (overview, in: Vinceti 2000; Zeng 2005; Zwolak 2012), and may potentially confound the association between selenium and cancer.
Some potential confounders cluster in population groups according to socioeconomic position (SEP), and this factor has been shown to vary together with selenium status in both men and women (Gundacker 2006; Niskar 2003). Only a few studies attempted to control for indicators of adult SEP as potential confounders (e.g. education, occupation, income). None used a composite index of indicators or considered childhood SEP. Some studies restricted their cohorts to certain subgroups of a population, such as occupational groups, and were likely to include only people of a similar adult socioeconomic background.
It has been claimed that associations between vitamins and diseases are the result of confounding by social and behavioural factors acting over the course of a lifetime (Lawlor 2004). Lawlor 2004 argued that divergent results from epidemiological and randomised controlled studies on prevention of cardiovascular disease can be explained by unmeasured confounding due to SEP. Risk of most cancers is known to decrease with higher SEP. Research also indicates a positive association between higher SEP and selenium biomarkers (Barany 2002; Niskar 2003). However, other investigations have not confirmed these findings: Kant 2007, for example, did not find an association between a measure of household poverty and selenium status.
The hypothesis of possible confounding due to SEP leading to an indirect association between selenium and cancer would be consistent with results of observational studies for all types of cancers in this review, with the exception of prostate cancer. Dalton 2008 found that prostate cancer has been diagnosed more often in men of a higher SEP, and we saw a protective association of higher selenium exposure with this cancer type. It remains unclear whether the more frequent diagnosis of prostate cancer in men with a higher SEP actually reflects an excess of prostate cancer incidence in this population. It might also result from differential health and screening behaviours leading to detection of otherwise symptom‐free cases, while men with a lower SEP tend to be over represented in diagnoses of the disease at advanced stages (Rapiti 2009). More information on screening and diagnostic behaviours of male cohort participants would be necessary to further elucidate these issues.
Another consideration is genetic factors, which may both confound and modify the role of selenium in cancer prevention and causation. Recent observational studies examining selenoprotein‐related single‐nucleotide polymorphisms have suggested a role for genetic variants in genes coding for selenoproteins or other proteins in modifying cancer risk, or even the relation itself between selenium and cancer risk, although results have not been consistent (Gerstenberger 2015; Geybels 2013; Jablonska 2015b; Meplan 2015). Null results of the most recent low‐bias RCTs do not suggest that at least the most frequent genotypes strongly influence the selenium and cancer relation (Algotar 2013; Marshall 2011; SELECT 2009), although such hypotheses cannot be ruled out for more rare genetic variants of selenoproteins or other proteins. Hypothetically, different genetic factors could increase and decrease the risk of cancer associated with selenium exposure, cancelling each other out and resulting in an overall null effect. Additional data from SELECT based on genotyping of study participants, if available, might be extremely useful for assessing hypotheses regarding genetic variants of selenoenzymes and their interaction with selenium status. So far, the only evidence derived from SELECT indicates that single‐nucleotide polymorphisms related to the prostate tumour suppressor protein NKX3.1 gene (CC genotype at rs11781886) may increase cancer risk following selenium supplementation (Martinez 2014). Recent observational evidence also suggests that polymorphisms of selenoproteins and other antioxidant proteins in men with non‐metastatic prostate cancer may be associated with increased risk of high‐grade disease and subsequent prostate cancer recurrence (Gerstenberger 2015).
Summary
In observational studies, factors that may have accounted for inter‐study heterogeneity and that may have biased study results include type of outcome measure, exposure assessment, sex, incomplete control for confounding (smoking and socioeconomic position), and unmeasured confounding, linked to both dietary and non‐dietary factors. Given the high risk of bias due to these factors, particularly to the unmeasured confounding inherent in observational studies, along with conflicting results of several studies and lack of any modification of the selenium and cancer relation by level of baseline selenium exposure and by the difference between highest and lowest selenium categories, we consider the evidence provided by observational studies to have very low certainty (summary of findings Table 2); therefore these results must be interpreted with great caution and do not allow firm conclusions about a possible cancer‐preventive effect of selenium intake. Meta‐analyses of spurious findings in observational studies enhance the precision of a summary risk estimate, which does not itself get nearer to the true value and may suggest a non‐existent association (Egger 1998).
Potential biases in the review process
RCTs and preventive efficacy and observational studies and aetiological association
The literature search included major international databases in the English and German languages, and we applied a broad search strategy supplemented by handsearching for references. We assume that we identified all randomised controlled studies and prospective observational studies relevant to our review questions. As we did not search databases in other languages (e.g. Chinese, Russian), we cannot rule out that we might have missed smaller studies that were not published in international journals. However, we consider it unlikely that we could have missed major sources of evidence through our approach. We also might have missed observational studies whose results on selenium exposure and cancer were reported in the body of a paper but were not mentioned in the paper's title or abstract, even if the paper is indexed in the searched databases. However, our systematic use of backward and forward citation chasing and our search for relevant abstracts in conference proceedings or related material should have substantially decreased the risk of missing literature that could have been relevant for our assessment.
When needed because of lack of complete or appropriate participant data (e.g. when cohorts including cancer and non‐cancer participants were mixed in data analysis), we contacted study investigators to ask for data missing from their studies. We also did this when we did not have enough data from published reports to adequately appraise study risk of bias. Sometimes we were unable to obtain answers to questions that we had regarding methods or outcomes, but frequently investigators kindly gave us the information we needed. We were sometimes unable to obtain answers, particularly for earlier epidemiological studies from which primary investigators may have relocated or died, or we found that data were not available in a current electronic format. Similarly, we could not make contact with primary investigators of Chinese RCTs.
We based our risk of bias assessment on information included in the original publications, unless the trial authors that we contacted gave us additional details. This means that in some instances, we may have overestimated the true risk of bias of studies that did not adequately describe their design in the original publications, such as Lubinski 2011.
Another concern, especially with epidemiological studies, is publication bias. Cohort and nested case‐control studies often are not exclusively designed to test for a specific exposure‐outcome association but enable investigators to investigate a range of questions. It is conceivable that unfavourable results were less likely to be published, although we could not find evidence supporting such a hypothesis. Our analysis of this issue through use of a funnel plot gave some support to publication bias for prostate cancer.
We systematically meta‐analysed RCTs even when only two studies were available (Karp 2013; NPCT 2002). Finally, we carried out two meta‐analyses of intervention studies ‐ one on all studies, and another on RCTs assessed through a standard appraisal tool as being at low risk of bias ‐ and we emphasised results of the latter, as derived from high‐quality experimental studies. For observational studies, we decided a priori to conduct meta‐analyses only when five or more studies were available for a study outcome, thus excluding from meta‐analysis the few endpoints for which up to four studies were available (Table 1). Our primary intention was to facilitate the investigation of heterogeneity between studies included in meta‐analyses, to avoid producing more precise, but still unexplainably biased, results. However, our emphasis was clearly given to experimental studies because this trial design is widely recognised as the only one that may provide convincing evidence of an association between a factor and disease risk, or more generally biological endpoints, and this may be particularly true in nutritional epidemiology (Vinceti 2016a).
Finally, the authors of this review, as already noted in the previous version of the review, came from different disciplines and have different areas of focus (e.g. epidemiology, biostatistics, clinical medicine, nutrition). We continue to consider such variety of expertise to be a strength of this review, and we made use of it by applying multiple checking procedures during the entire review process whenever possible.
Agreements and disagreements with other studies or reviews
Recent reviews that have investigated the relation between selenium and cancer prevention have generally concluded that this trace element has no clear beneficial effect(Bjelakovic 2012; Cortes‐Jofre 2012; Cui 2017a; Fortmann 2013; Kushi 2012; Moyer 2014; Posadzki 2013; Schwingshackl 2017), although updated systematic reviews and meta‐analyses on selenium encompassing all of the most recent intervention studies are lacking. These results are true for both all cancers and prostate cancer, and for other specific cancers, such as lung cancer. The turning point in the evaluation of the effect of selenium on cancer risk is generally acknowledged to have been SELECT, and the other trials, although their findings are consistent with SELECT, have received less attention, probably mainly because of their smaller size. It is understandable that most of the selenium trials under way during the 2000s and the 2010s and originally implemented mainly as the result of the promising results of the original NPCT, particularly its ad interim 1996 report, were eventually discontinued owing to the results of SELECT (which was discontinued too) and the null results of ad interim futility analyses (Vinceti 2017b). This seems also to be true for Brodin 2015, Chen 2013, and Vinceti 2017a ‐ planned RCTs on the possible utility of selenium for cancer therapy ‐ and is an issue of considerable interest that has been investigated so far in very few phase 2 and phase 3 trials (Goossens 2016; Karamali 2015; Muecke 2014; Stratton 2010) (although other trials appear to be under way such as Vinceti 2017b).
Concerning observational studies, very few recent reviews have investigated the selenium and cancer relation, and they have focused on only a few cancer sites. These reviews have generally yielded results consistent with ours. For prostate cancer, a recent review found no association between baseline serum selenium and risk in cohort studies (Cui 2017b), as was reported by Allen 2016, which conducted a pooled analysis using individual data from 15 cohort studies. However, in the latter review, baseline serum selenium status was determined to be inversely associated with high‐grade prostate cancer risk, as was toenail selenium and subsequent prostate cancer incidence. Gong 2016 also found reduced risk of gastric cancer among participants in the highest baseline selenium exposure category. Other reviews and meta‐analyses considered other cancer types such as liver, pancreatic, lung, and breast cancer, but these reviews generally incorporated case‐control and cross‐sectional studies in addition to cohort studies, further increasing the risk of bias due to heterogeneity of study designs. Most reviews on observational studies have acknowledged the key methodological issues noted in this type of study, namely, risk of unmeasured confounding and potential biases associated with this limitation.

Review authors’ judgements about each risk of bias item presented as percentages across all included RCTs and summary of review authors’ judgements about each risk of bias item for the included RCTs.
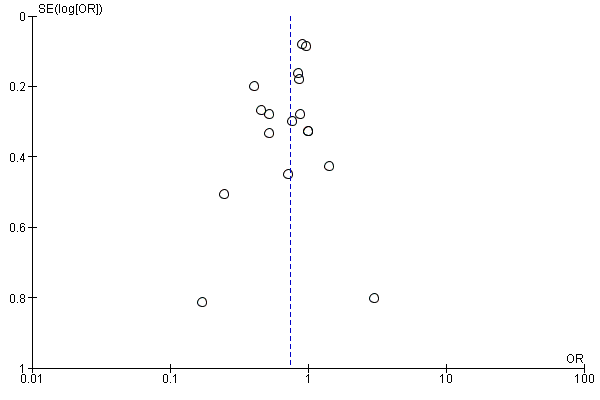
Funnel plot of comparison: 1 Highest versus lowest selenium exposure, outcome: 2.1 Total cancer incidence and mortality.

Funnel plot of comparison: 1 Observational studies: highest versus lowest selenium exposure, outcome: 2.8 Colorectal cancer risk.

Funnel plot of comparison: 1 Observational studies: highest versus lowest selenium exposure, outcome: 2.12 Lung cancer risk incidence and mortality
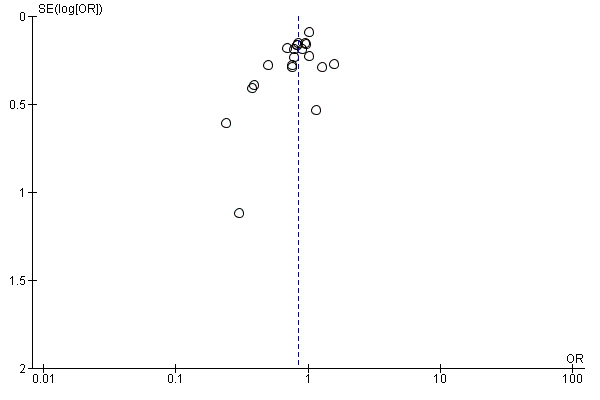
Funnel plot of comparison: 1 Highest versus lowest selenium exposure, outcome: 2.19 Prostate cancer risk.

Baseline circulating selenium levels in the NPC trial (Duffield‐Lillico 2003b in: NPCT 2002), the NBT (Algotar 2013), SWOG trial (as plasma selenium) (Marshall 2011), and SELECT (as serum selenium) (Lippman 2009, in: SELECT 2009). When median and interquartile values were reported, we estimated mean and standard deviation according to Cochrane guidelines provided in Higgins 2011a.

Comparison 1 Randomised controlled trials: highest versus lowest selenium exposure, Outcome 1 Any cancer risk.
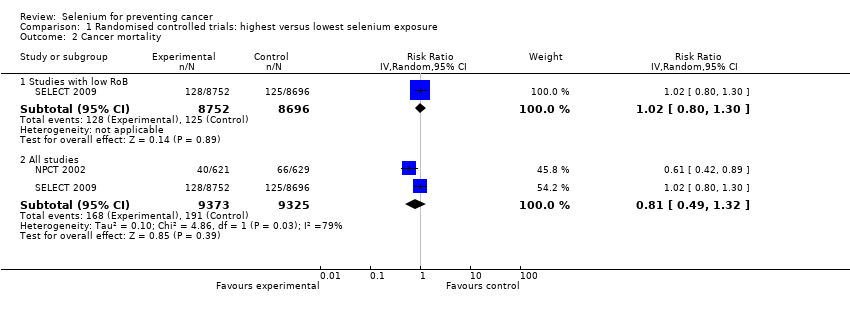
Comparison 1 Randomised controlled trials: highest versus lowest selenium exposure, Outcome 2 Cancer mortality.
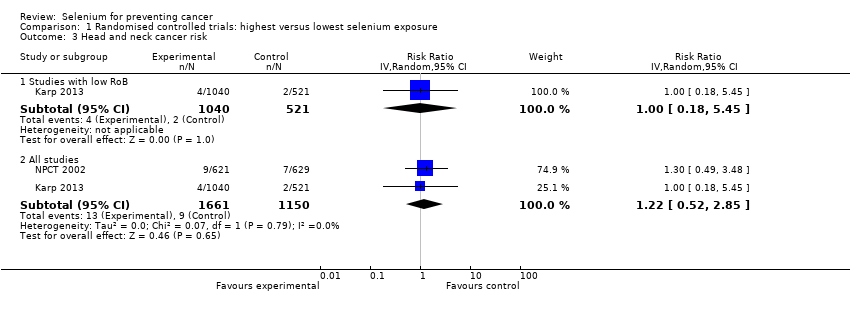
Comparison 1 Randomised controlled trials: highest versus lowest selenium exposure, Outcome 3 Head and neck cancer risk.
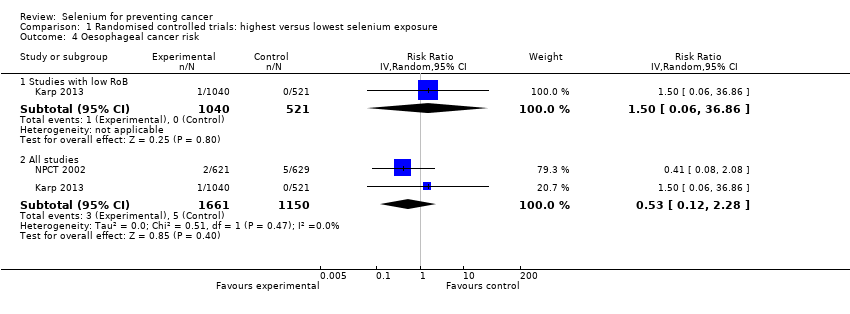
Comparison 1 Randomised controlled trials: highest versus lowest selenium exposure, Outcome 4 Oesophageal cancer risk.

Comparison 1 Randomised controlled trials: highest versus lowest selenium exposure, Outcome 5 Colorectal cancer risk.
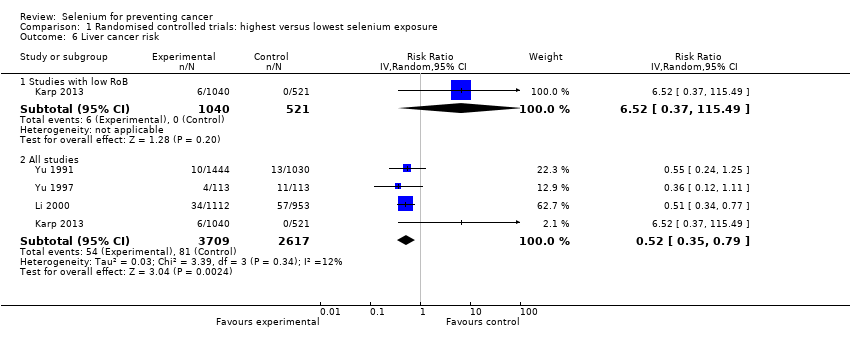
Comparison 1 Randomised controlled trials: highest versus lowest selenium exposure, Outcome 6 Liver cancer risk.

Comparison 1 Randomised controlled trials: highest versus lowest selenium exposure, Outcome 7 Melanoma risk.
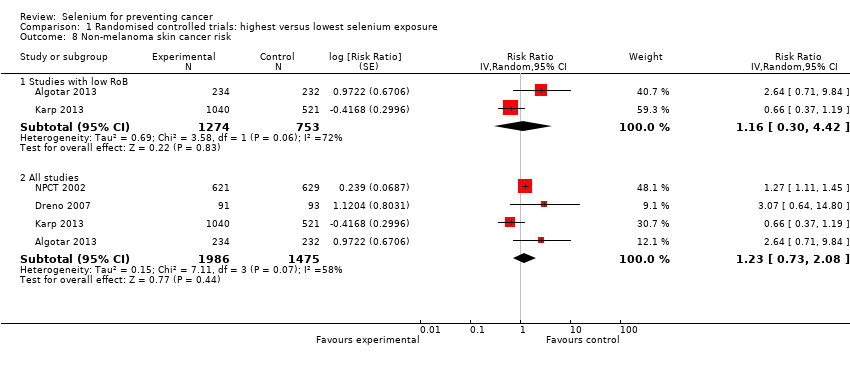
Comparison 1 Randomised controlled trials: highest versus lowest selenium exposure, Outcome 8 Non‐melanoma skin cancer risk.

Comparison 1 Randomised controlled trials: highest versus lowest selenium exposure, Outcome 9 Lung cancer risk.
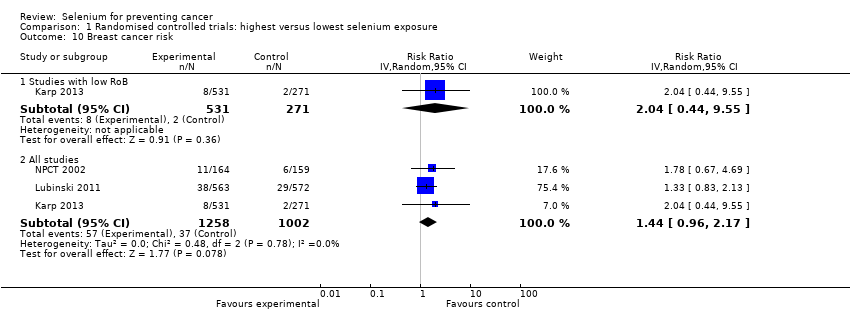
Comparison 1 Randomised controlled trials: highest versus lowest selenium exposure, Outcome 10 Breast cancer risk.

Comparison 1 Randomised controlled trials: highest versus lowest selenium exposure, Outcome 11 Bladder cancer risk.

Comparison 1 Randomised controlled trials: highest versus lowest selenium exposure, Outcome 12 Prostate cancer risk.

Comparison 1 Randomised controlled trials: highest versus lowest selenium exposure, Outcome 13 Leukaemia and lymphoma risk.
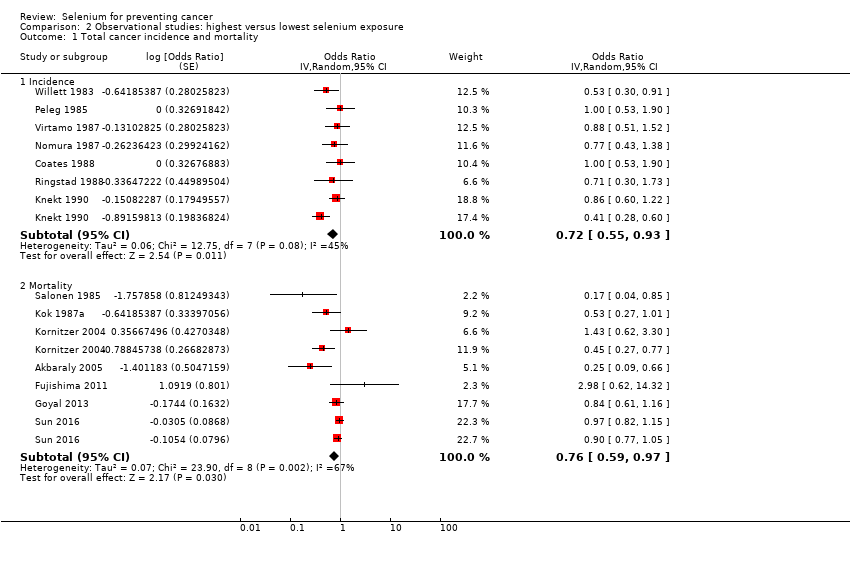
Comparison 2 Observational studies: highest versus lowest selenium exposure, Outcome 1 Total cancer incidence and mortality.

Comparison 2 Observational studies: highest versus lowest selenium exposure, Outcome 2 Total cancer incidence and mortality (men).

Comparison 2 Observational studies: highest versus lowest selenium exposure, Outcome 3 Total cancer incidence and mortality (women).

Comparison 2 Observational studies: highest versus lowest selenium exposure, Outcome 4 Total cancer incidence and mortality (ascending order of selenium levels).

Comparison 2 Observational studies: highest versus lowest selenium exposure, Outcome 5 Total cancer incidence and mortality (ascending order of differences in selenium levels).

Comparison 2 Observational studies: highest versus lowest selenium exposure, Outcome 6 Stomach cancer risk.
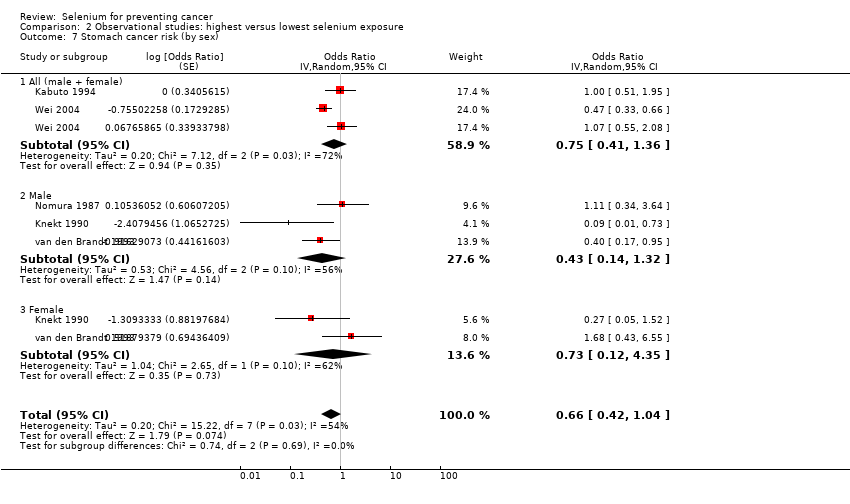
Comparison 2 Observational studies: highest versus lowest selenium exposure, Outcome 7 Stomach cancer risk (by sex).
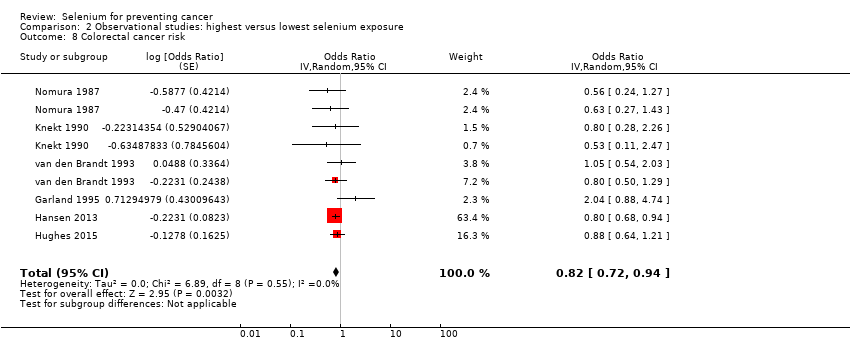
Comparison 2 Observational studies: highest versus lowest selenium exposure, Outcome 8 Colorectal cancer risk.
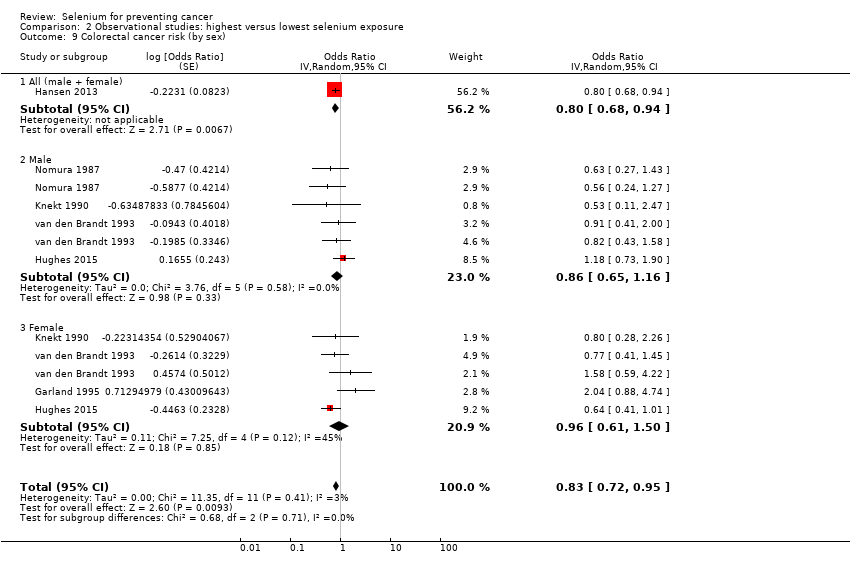
Comparison 2 Observational studies: highest versus lowest selenium exposure, Outcome 9 Colorectal cancer risk (by sex).

Comparison 2 Observational studies: highest versus lowest selenium exposure, Outcome 10 Colon cancer risk.

Comparison 2 Observational studies: highest versus lowest selenium exposure, Outcome 11 Colon cancer risk (by sex).

Comparison 2 Observational studies: highest versus lowest selenium exposure, Outcome 12 Lung cancer incidence and mortality.

Comparison 2 Observational studies: highest versus lowest selenium exposure, Outcome 13 Lung cancer risk (sex‐disaggregated data).
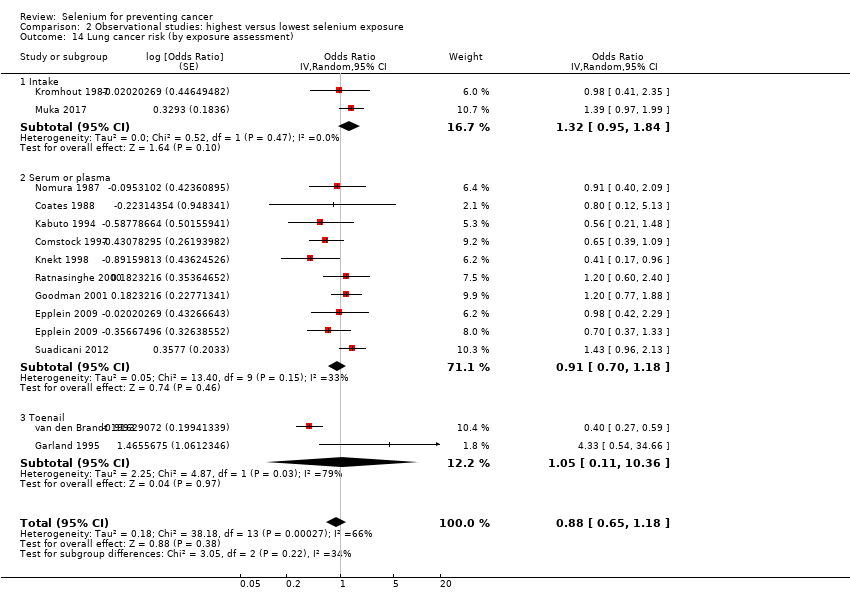
Comparison 2 Observational studies: highest versus lowest selenium exposure, Outcome 14 Lung cancer risk (by exposure assessment).

Comparison 2 Observational studies: highest versus lowest selenium exposure, Outcome 15 Lung cancer risk (ascending order of selenium levels).

Comparison 2 Observational studies: highest versus lowest selenium exposure, Outcome 16 Lung cancer risk (ascending order of differences in selenium levels).
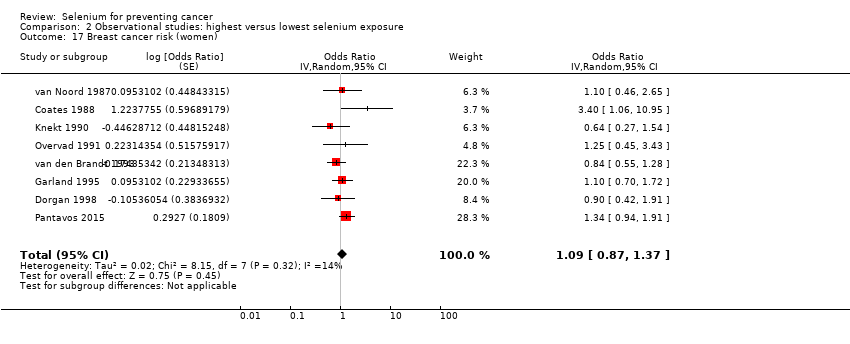
Comparison 2 Observational studies: highest versus lowest selenium exposure, Outcome 17 Breast cancer risk (women).

Comparison 2 Observational studies: highest versus lowest selenium exposure, Outcome 18 Bladder cancer risk.

Comparison 2 Observational studies: highest versus lowest selenium exposure, Outcome 19 Prostate cancer risk.
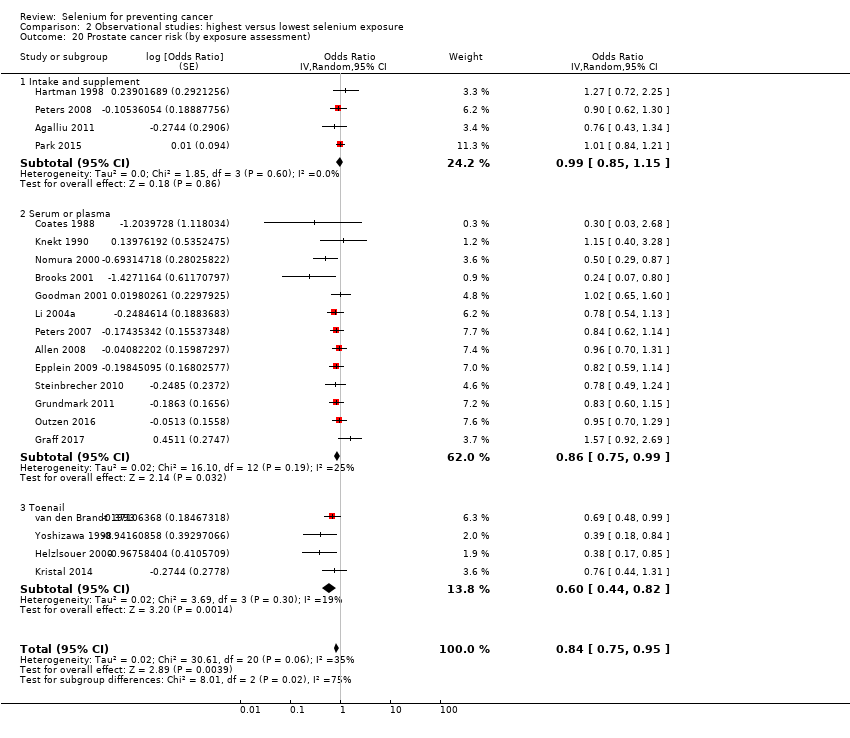
Comparison 2 Observational studies: highest versus lowest selenium exposure, Outcome 20 Prostate cancer risk (by exposure assessment).

Comparison 2 Observational studies: highest versus lowest selenium exposure, Outcome 21 Prostate cancer risk (ascending order of selenium levels).

Comparison 2 Observational studies: highest versus lowest selenium exposure, Outcome 22 Prostate cancer risk (ascending order of differences in selenium levels).
| Highest compared with lowest selenium exposure for preventing cancer in randomised controlled studies with low risk of bias | ||||||
| Patient or population: Participants in trials with low risk of bias | ||||||
| Outcomes | Relative effect | Anticipated absolute effects* (95% CI) | Quality of the evidence | Comments | ||
| Without highest | With highest | Difference | ||||
| Any cancer risk | RR 1.01 | Study population | ⊕⊕⊕⊕ | SELECT study had the strongest influence on the effect estimate. The RR in all RCTs is 0.99 (95% CI 0.86 to 1.14). | ||
| 10.0% | 10.1% | 0.1% more | ||||
| Cancer mortality risk | RR 1.02 | Study population | ⊕⊕⊕⊕ | The effect is led from the study SELECT. The RR in all RCTs is 0.81 (95% CI 0.49 to 1.32). | ||
| 1.4% | 1.5% | 0.0% more | ||||
| Colorectal cancer risk | RR 0.99 | Study population | ⊕⊕⊕⊕ | SELECT study had the strongest influence on the effect estimate. The RR in all RCTs is 0.74 (95% CI 0.41 to 1.33). | ||
| 0.7% | 0.7% | 0.0% fewer | ||||
| Non‐melanoma skin cancer risk | RR 1.16 | Study population | ⊕⊕⊕⊝ | Pooled estimate is imprecise owing to high heterogeneity. The RR in all RCTs is 1.23 (95% CI 0.73 to 2.08). | ||
| 2.9% | 3.4% | 0.5% more | ||||
| Lung cancer risk | RR 1.16 | Study population | ⊕⊕⊕⊕ | The RR in all RCTs is 1.03 (95% CI 0.78 to 1.37). | ||
| 1.0% | 1.2% | 0.2% more | ||||
| Breast cancer risk | RR 2.04 | Study population | ⊕⊕⊕⊝ | The RR in all RCTs is 1.44 (95% CI 0.96 to 2.17). | ||
| 0.7% | 1.5% | 0.8% more | ||||
| Bladder cancer risk | RR 1.07 | Study population | ⊕⊕⊕⊕ | SELECT study had the strongest influence on the effect estimate. The RR in all RCTs is 1.10 (95% CI 0.79 to 1.52). | ||
| 0.6% | 0.7% | 0.0% fewer | ||||
| Prostate cancer risk | RR 1.01 | Study population | ⊕⊕⊕⊕ | SELECT study had the strongest influence on the effect estimate. The RR in all RCTs is 0.91 (95% CI 0.75 to 1.12). | ||
| 5.4% | 5.4% | 0.1% more | ||||
| *The risk in the intervention group (and its 95% confidence interval) is based on the assumed risk in the comparison group and the relative effect of the intervention (and its 95% CI). | ||||||
| GRADE Working Group grades of evidence. | ||||||
| aDowngraded one level for moderate heterogeneity (tau² = 0.69, I² = 72%, P = 0.06) not explained. | ||||||
| Highest compared with lowest selenium exposure for preventing cancer in observational studies | ||
| Patient or population: Participants in non experimental cohort studies on selenium and cancer | ||
| Outcomes | Relative effect | Certainty of the evidence |
| Any cancer risk No. of participants: 76,239 | OR 0.72 | ⊕⊝⊝⊝ |
| Cancer mortality risk No. of participants: 183,863 | OR 0.76 (0.59 to 0.97) | ⊕⊝⊝⊝ |
| Colorectal cancer risk No. of participants: 712,746 | OR 0.82 | ⊕⊝⊝⊝ |
| Lung cancer risk No. of participants: 371,067 | OR 0.82 | ⊕⊝⊝⊝ |
| Breast cancer risk (women) No. of participants: 169,028 | OR 1.09 | ⊕⊝⊝⊝ |
| Bladder cancer risk No. of participants: 279,100 | OR 0.67 | ⊕⊝⊝⊝ |
| Prostate cancer risk No. of participants: 576,667 | OR 0.84 | ⊕⊝⊝⊝ |
| CI: confidence interval; OR: odds ratio. | ||
| GRADE Working Group grades of evidence. | ||
| aDowngraded one level owing to risk of bias, which we deemed as serious because of inability to rule out unmeasured confounding, particularly from lifestyle or nutritional factors that might covary with selenium exposure beyond those factors taken into account in the multi‐variable analyses. | ||
| Organ system | Outcome | Number of studies/case definitions | Meta‐ | Countries | Number of participants | Number of cases | Selenium assessment | Reporting study |
| Any cancer | Any cancer | total: 16 incidence: 7 | ✓ yes | USA China Japan | total: ˜ 276,000 | total: 6488 male: 3196 female: 1541 | serum: 12 plasma: 2 serum + plasma: 1 dietary intake: 1 | Salonen 1985 |
| Gynaecological cancer | Female breast cancer | total: 8 incidence: 8 | ✓ yes | USA | total/female: 169,028 | total/female: 1277 | serum: 2 plasma: 1 serum + plasma: 1 toenail: 3 intake: 1 | |
| Cervical cancer | total: 2 incidence: 2 | ✗ no | USA | total/female: > 15,161 (1 study did not report cohort size by sex) | total/female: 62 | serum: 2 | ||
| Uterine cancer | total: 1 incidence: 1 | ✗ no | USA | total/female: 62,641 | total/female: 91 | toenail: 1 | ||
| Ovarian cancer | total: 4 incidence: 4 | ✗ no | USA | total/female: ˜ 214,000 | total/female: 568 | serum: 2 toenail: 1 supplemental intake: 1 | ||
| Gynaecological cancer (without breast cancer) | total: 1 incidence: 1 | ✗ no | Finland | total/female: 18,096 | total/female: 86 | serum: 1 | ||
| Urological cancers | Renal cancer | total: 1 incidence: 1 | ✗ no | United Kindom | total: 23,658 | total: 65 | dietary intake: 1 | |
| Urinary bladder cancer | total: 6 incidence: 6 | ✓ yes | USA/Hawaii | total: 279,100 female: 130,786 male: 128,009 | total: 1295 female: 175 male 755 | serum: 3 toenail: 3 | ||
| Urinary tract cancer | total: 1 incidence: 1 | ✗ no | Netherlands | total: 38,500 | total: 47 male: 34 female: 13 | serum: 1 | ||
| Respiratory tract cancers | Lung cancer | total: 15 incidence: 13 | ✓ yes | China Denmark | total: 371,067 male: 125,341 female: 181,895 | total: 2223 male: 1384 female: 416 | serum: 9 serum + plasma: 2 toenail: 2 dietary intake: 2 (1 study reported both serum levels and food intake) | Menkes 1986 Knekt 1990 |
| Oral/pharyngeal cancer | total: 1 incidence: 1 | ✗ no | USA | total: 20,305 | total: 28 | serum: 1 | ||
| Andrological cancers | Prostate cancer | total: 21 incidence: 21 | ✓ yes | USA Canada Puerto Rico | total/male: 576,667 | total/male: 14,950 | serum: 8 plasma: 5 toenail: 4 dietary intake: 4 | Coates 1988 Brooks 2001 |
| Gastrointestinal cancers | Oesophageal cancer | total: 2 incidence: 2 | ✗ no | China | total: 29,923 | total: > 959 | serum: 1 supplemental intake: 1 | |
| Oesophageal squamous cell carcinoma | total:2 incidence: 2 | ✗ no | Netherlands Iran | total: 168,257 | total: 265 | toenail: 1 intake: 1 | ||
| Oesophageal adenocarcinoma | total:1 incidence:1 | ✗ no | Netherlands | total: 120,852 | total: 112 | toenail: 1 | ||
| Oesophageal/stomach cancer | total: 1 incidence: 1 | ✗ no | Netherlands | total: 36,265 | total: 86 male: 51 female: 35 | serum: 1 | ||
| Gastric cardia adenocarcinoma | total:1 incidence:1 | ✗ no | Netherlands | total: 120,852 | total:114 | toenail: 1 | ||
| Stomach cancer | total: 5 incidence: 5 | ✓ yes | China | total: ˜ 197,000 male: 86,311 female: 80,669 | total: 955 male: 626 female: 329 | serum: 4 toenail: 1 | ||
| Primary liver cancer | total: 4 incidence: 3 | ✗ no | China Europe Taiwan | total: 701,809 male: 61,470 female: 74,941 | total: 877 male: 567 female: 204 | plasma: 1 serum: 1 toenail: 1 intake: 1 | ||
| Pancreatic cancer | total: 4 incidence: 4 | ✗ no | USA UK | total: 159,062 | total: 311 male: 69 female: 84 | serum: 2 intake: 1 supplemental intake: 1 | ||
| Colorectal cancer | total: 6 incidence: 6 | ✓ yes | USA/Hawaii | total: 712,746 male: 216,272 female: 442,266 | total: 2627 male: 810 female: 797 | serum: 3 toenail: 2 supplement use: 1 | ||
| Colon cancer | total: 5 incidence: 5 | ✓ yes | USA/Hawaii Europe | total: 636,641 male: 195,100 female: 361,529 | total: 1677 male: 525 female: 510 | serum: 3 toenail: 1 supplement use: 1 | ||
| Rectal cancer | total: 4 incidence: 4 | ✗ no | USA/Hawaii | total: 610,837 male: 195,100 female: 361,529 | total: 861 male: 303 female: 210 | serum: 2 toenail: 1 supplement use:1 | ||
| All gastrointestinal cancers | total: 1 incidence: 1 | ✗ no | USA | total: 6,167 | total: 143 | plasma and serum: 1 | ||
| Skin cancer | Melanoma | total: 3 incidence: 3 | ✗ no | USA | total: ˜ 158,000 | total: 547 | serum: 1 toenail: 1 supplemental intake: 1 | |
| Basal cell carcinoma | total: 3 incidence: 3 | ✗ no | Australia | total: > 66,000 | total: 292 | serum: 3 dietary intake: 1 | ||
| Squamous cell carcinoma | total: 4 incidence: 4 | ✗ no | Australia | total: ˜ 30,000 | total: 488 | serum: 2 plasma: 1 dietary intake: 1 | ||
| Total non‐melanoma skin cancer | total: 1 incidence: 1 | ✗ no | USA | total: 117 | total: 19 | plasma: 1 | ||
| Rare and other cancers | Haematological cancers | total: 1 incidence: 1 | ✗ no | USA | total: 6167 | total: 12 | serum + plasma: 1 | |
| Thyroid cancer | total: 2 incidence: 2 | ✗ no | Norway | total: 582,807 male: 287,944 female: 194,863 | total: 635 male: 269 female: 366 | serum: 1 intake:1 | ||
| Other cancers | total: 4 incidence: 3 | ✗ no | China | total: 109,179 male: 21,172 female: 80,737 | total: 512 male: 169 female: 285 | serum: 2 serum + plasma: 1 toenail: 1 | ||
| Some studies did not report the sex of participants or cancer cases; consequently, figures for women and men do not always sum up to the total number of participants or cancer cases. | ||||||||
| Study | Publication | Newcastle‐Ottawa Scale (cohort) | Newcastle‐Ottawa Scale (case‐control) | ||||||
| Selection | Comparability | Outcome | Total | Selection | Comparability | Exposure | Total | ||
| 0‐1‐0‐1 | 1 | 1‐1‐0 | 5 | 0‐1‐0‐1 | 1 | 1‐1‐0 | 5 | ||
| 0‐1‐1‐1 | 2 | 0‐1‐0 | 6 | .‐.‐.‐. | . | .‐.‐. | . | ||
| 1‐1‐1‐1 | 2 | 1‐1‐0 | 8 | 1‐1‐1‐1 | 2 | 1‐1‐1 | 9 | ||
| 1‐1‐1‐1 | 2 | 1‐1‐1 | 9 | 1‐1‐1‐1 | 2 | 1‐1‐1 | 9 | ||
| Barrass 2013 | 1‐1‐1‐1 | 2 | 1‐1‐1 | 9 | 1‐1‐1‐1 | 2 | 1‐1‐1 | 9 | |
| 1‐1‐1‐1 | 2 | 1‐1‐1 | 9 | .‐.‐.‐. | . | .‐.‐. | . | ||
| 1‐1‐1‐1 | 2 | 1‐1‐1 | 9 | .‐.‐.‐. | . | .‐.‐. | . | ||
| 0‐1‐1‐0 | 2 | 1‐0‐0 | 5 | 1‐0‐1‐1 | 2 | 1‐1‐0 | 7 | ||
| 0‐1‐1‐0 | 0 | 0‐0‐0 | 2 | .‐.‐.‐. | . | .‐.‐. | . | ||
| 0‐1‐1‐0 | 1 | 1‐1‐0 | 5 | 1‐0‐1‐0 | 1 | 1‐1‐1 | 6 | ||
| Coates 1987 | .‐.‐.‐. | . | .‐.‐. | . | .‐.‐.‐. | . | .‐.‐. | . | |
| 0‐1‐1‐0 | 2 | 1‐0‐0 | 5 | .‐.‐.‐. | . | .‐.‐. | . | ||
| 0‐1‐1‐0 | 2 | 1‐1‐0 | 6 | 1‐1‐1‐1 | 2 | 1‐1‐1 | 9 | ||
| 1‐1‐1‐1 | 2 | 1‐1‐1 | 9 | .‐.‐.‐. | . | .‐.‐. | . | ||
| 0‐1‐1‐1 | 2 | 0‐1‐0 | 6 | 1‐1‐1‐1 | 2 | 1‐1‐1 | 9 | ||
| 0‐1‐1‐1 | 2 | 1‐1‐0 | 7 | 0‐1‐1‐1 | 2 | 1‐1‐1 | 8 | ||
| Gill 2009 | 0‐1‐1‐1 | 1 | 1‐1‐0 | 6 | 0‐1‐1‐1 | 1 | 1‐1‐1 | 7 | |
| 1‐1‐1‐0 | 2 | 1‐1‐1 | 8 | 1‐0‐1‐1 | 2 | 1‐1‐1 | 8 | ||
| 1‐1‐1‐1 | 2 | 1‐1‐1 | 9 | .‐.‐.‐. | . | .‐.‐. | . | ||
| 0‐1‐1‐1 | 2 | 1‐1‐1 | 8 | 1‐1‐1‐1 | 2 | 1‐1‐1 | 9 | ||
| 0‐1‐1‐1 | 2 | 1‐1‐1 | 8 | 1‐1‐1‐1 | 2 | 1‐1‐1 | 9 | ||
| 0‐1‐1‐0 | 1 | 1‐1‐1 | 6 | 1‐1‐1‐1 | 1 | 1‐1‐1 | 8 | ||
| 0‐1‐1‐0 | 2 | 1‐1‐0 | 6 | 1‐1‐1‐1 | 2 | 1‐1‐1 | 9 | ||
| 0‐1‐1‐1 | 2 | 1‐1‐0 | 7 | 1‐1‐1‐1 | 2 | 1‐1‐1 | 9 | ||
| 1‐1‐1‐1 | 2 | 1‐1‐1 | 9 | .‐.‐.‐. | . | .‐.‐. | . | ||
| 0‐1‐0‐1 | 2 | 1‐1‐0 | 7 | .‐.‐.‐. | . | .‐.‐. | . | ||
| 0‐1‐1‐1 | 1 | 1‐1‐1 | 7 | .‐.‐.‐. | . | .‐.‐. | . | ||
| 1‐1‐0‐1 | 2 | 1‐1‐0 | 7 | .‐.‐.‐. | . | .‐.‐. | . | ||
| 1‐1‐1‐1 | 2 | 1‐1‐1 | 9 | .‐.‐.‐. | . | .‐.‐. | . | ||
| 0‐1‐1‐1 | 1 | 1‐1‐0 | 6 | 1‐1‐1‐1 | 1 | 1‐1‐1 | 8 | ||
| 1‐1‐1‐1 | 2 | 0‐1‐0 | 7 | 0‐1‐1‐1 | 2 | 1‐1‐1 | 8 | ||
| 1‐1‐1‐1 | 2 | 0‐1‐1 | 8 | 0‐1‐1‐1 | 2 | 1‐1‐1 | 8 | ||
| 0‐1‐1‐1 | 2 | 1‐1‐0 | 7 | 0‐1‐1‐1 | 2 | 1‐1‐1 | 8 | ||
| 0‐1‐1‐1 | 2 | 1‐1‐1 | 8 | 1‐1‐1‐1 | 2 | 1‐1‐1 | 9 | ||
| 1‐1‐1‐1 | 2 | 1‐1‐1 | 9 | 0‐1‐1‐1 | 2 | 1‐1‐1 | 8 | ||
| Hakama 1990 | 1‐1‐1‐1 | 2 | 1‐1‐1 | 9 | 0‐1‐1‐1 | 2 | 1‐1‐1 | 8 | |
| Knekt 1988 | 1‐1‐1‐1 | 2 | 1‐1‐1 | 9 | 0‐0‐1‐1 | 2 | 1‐1‐1 | 7 | |
| Knekt 1996 | 1‐1‐1‐1 | 1 | 1‐1‐1 | 8 | 0‐1‐1‐1 | 1 | 1‐1‐1 | 7 | |
| 1‐1‐1‐1 | 2 | 1‐1‐1 | 9 | 0‐1‐1‐1 | 2 | 1‐1‐1 | 8 | ||
| 1‐1‐1‐1 | 2 | 1‐1‐1 | 9 | 0‐1‐1‐1 | 2 | 1‐1‐1 | 8 | ||
| 1‐1‐1‐1 | 2 | 1‐1‐1 | 9 | 1‐0‐1‐1 | 2 | 1‐1‐1 | 8 | ||
| .‐.‐.‐. | . | .‐.‐. | . | .‐.‐.‐. | . | .‐.‐. | . | ||
| 1‐1‐1‐0 | 1 | 1‐1‐1 | 7 | 1‐1‐1‐1 | 1 | 1‐1‐1 | 8 | ||
| 1‐1‐1‐1 | 1 | 1‐1‐1 | 8 | 1‐1‐1‐1 | 1 | 1‐1‐1 | 8 | ||
| 1‐1‐1‐0 | 2 | 1‐1‐1 | 8 | .‐.‐.‐. | . | .‐.‐. | . | ||
| 0‐1‐1‐1 | 2 | 0‐1‐1 | 7 | 1‐1‐1‐1 | 2 | 1‐1‐1 | 9 | ||
| 1‐1‐1‐1 | 2 | 1‐1‐0 | 8 | .‐.‐.‐. | . | .‐.‐. | . | ||
| 1‐1‐1‐1 | 1 | 1‐1‐0 | 7 | 1‐1‐1‐1 | 1 | 1‐1‐1 | 8 | ||
| Heinen 2007 | 1‐1‐1‐1 | 2 | 1‐1‐1 | 9 | .‐.‐.‐. | . | .‐.‐. | . | |
| van der Pols 2009 | 1‐1‐1‐1 | 2 | 1‐1‐0 | 8 | .‐.‐.‐. | . | .‐.‐. | . | |
| 0‐1‐1‐1 | 2 | 1‐1‐0 | 7 | 1‐1‐1‐1 | 2 | 1‐1‐1 | 9 | ||
| Batieha 1993 | 0‐1‐1‐1 | 2 | 1‐1‐0 | 7 | 1‐1‐1‐1 | 2 | 1‐1‐1 | 9 | |
| Breslow 1995 | 0‐1‐1‐1 | 2 | 1‐1‐0 | 7 | 1‐0‐1‐1 | 2 | 1‐1‐1 | 8 | |
| Burney 1989 | 0‐1‐1‐1 | 2 | 1‐1‐0 | 7 | 0‐1‐1‐1 | 2 | 1‐1‐1 | 8 | |
| Helzlsouer 1996 | 0‐1‐1‐1 | 2 | 1‐1‐0 | 7 | 0‐1‐1‐1 | 2 | 1‐1‐1 | 8 | |
| Helzlsouer 1989 | 0‐1‐1‐1 | 2 | 1‐1‐0 | 7 | 1‐1‐1‐1 | 2 | 1‐1‐1 | 9 | |
| Ko 1994 | 0‐1‐1‐0 | 2 | 1‐1‐0 | 6 | 1‐1‐1‐1 | 2 | 1‐1‐1 | 9 | |
| .‐.‐.‐. | . | .‐.‐. | . | .‐.‐.‐. | . | .‐.‐. | . | ||
| Schober 1987 | 0‐1‐1‐1 | 1 | 1‐1‐0 | 6 | 0‐1‐1‐1 | 1 | 1‐1‐1 | 7 | |
| Schober 1986 | .‐.‐.‐. | . | .‐.‐. | . | .‐.‐.‐. | . | .‐.‐. | . | |
| Zheng 1993 | 0‐1‐1‐1 | 2 | 1‐1‐0 | 7 | 0‐1‐1‐1 | 2 | 1‐1‐1 | 8 | |
| 1‐1‐1‐1 | 2 | 1‐1‐0 | 8 | 0‐1‐1‐1 | 2 | 1‐1‐1 | 8 | ||
| 0‐1‐1‐1 | 2 | 0‐1‐0 | 6 | 1‐1‐1‐1 | 2 | 1‐1‐1 | 9 | ||
| 1‐1‐1‐1 | 2 | 1‐1‐1 | 9 | .‐.‐.‐. | . | .‐.‐. | . | ||
| 1‐1‐1‐1 | 2 | 1‐1‐1 | 9 | 1‐1‐1‐1 | 2 | 1‐1‐1 | 9 | ||
| 1‐1‐1‐1 | 2 | 1‐1‐1 | 9 | 1‐1‐1‐1 | 2 | 1‐1‐1 | 9 | ||
| 1‐1‐1‐1 | 2 | 1‐1‐1 | 9 | .‐.‐.‐. | . | .‐.‐. | . | ||
| 1‐1‐1‐1 | 2 | 1‐1‐1 | 9 | 1‐0‐1‐1 | 2 | 1‐1‐1 | 8 | ||
| 1‐1‐1‐0 | 1 | 1‐1‐0 | 6 | .‐.‐.‐. | . | .‐.‐. | . | ||
| 1‐1‐1‐1 | 2 | 1‐1‐1 | 9 | .‐.‐.‐. | . | .‐.‐. | . | ||
| 1‐1‐1‐1 | 2 | 1‐1‐1 | 9 | .‐.‐.‐. | . | .‐.‐. | . | ||
| 1‐1‐1‐1 | 1 | 1‐1‐0 | 7 | 1‐1‐1‐1 | 1 | 1‐1‐1 | 8 | ||
| 0‐1‐1‐1 | 2 | 1‐1‐0 | 7 | 1‐1‐1‐1 | 2 | 1‐1‐1 | 9 | ||
| 0‐1‐1‐1 | 1 | 1‐1‐1 | 7 | .‐.‐.‐. | . | .‐.‐. | . | ||
| Asgari 2009 | 0‐1‐1‐1 | 1 | 1‐1‐0 | 6 | .‐.‐.‐. | . | .‐.‐. | . | |
| 0‐1‐0‐1 | 0 | 1‐1‐1 | 5 | .‐.‐.‐. | . | .‐.‐. | . | ||
| 0‐1‐0‐1 | 2 | 1‐1‐1 | 7 | .‐.‐.‐. | . | .‐.‐. | . | ||
| 1‐1‐1‐1 | 2 | 1‐0‐0 | 7 | 0‐0‐1‐1 | 2 | 1‐1‐1 | 7 | ||
| 1‐1‐1‐1 | 2 | 1‐1‐0 | 8 | 1‐1‐1‐1 | 2 | 1‐1‐1 | 9 | ||
| 0‐1‐1‐1 | 2 | 0‐1‐0 | 6 | .‐.‐.‐. | . | .‐.‐. | . | ||
| 0‐1‐1‐0 | 1 | 1‐1‐0 | 5 | 1‐1‐1‐1 | 1 | 1‐1‐1 | 8 | ||
| 1‐1‐1‐1 | 2 | 1‐1‐1 | 9 | 0‐1‐1‐1 | 2 | 1‐1‐1 | 8 | ||
| 1‐1‐1‐1 | 2 | 1‐1‐1 | 9 | 1‐1‐1‐1 | 2 | 1‐1‐1 | 9 | ||
| 1‐1‐1‐1 | 2 | 0‐1‐0 | 7 | 1‐1‐1‐1 | 2 | 0‐1‐1 | 8 | ||
| 0‐1‐1‐1 | 2 | 1‐1‐1 | 8 | .‐.‐.‐. | . | .‐.‐. | . | ||
| 1‐1‐1‐1 | 2 | 1‐1‐0 | 8 | .‐.‐.‐. | . | .‐.‐. | . | ||
| 1‐1‐1‐1 | 2 | 1‐1‐1 | 9 | .‐.‐.‐. | . | .‐.‐. | . | ||
| van den Brandt 1994 | 1‐1‐1‐1 | 2 | 1‐1‐1 | 9 | .‐.‐.‐. | . | .‐.‐. | . | |
| 1‐1‐1‐1 | 2 | 1‐1‐1 | 9 | .‐.‐.‐. | . | .‐.‐. | . | ||
| van den Brandt 2003 | 1‐1‐1‐1 | 2 | 1‐1‐1 | 9 | .‐.‐.‐. | . | .‐.‐. | . | |
| Zeegers 2002 | 1‐1‐1‐1 | 2 | 1‐1‐1 | 9 | .‐.‐.‐. | . | .‐.‐. | . | |
| 1‐1‐1‐1 | 2 | 1‐1‐1 | 9 | 0‐1‐1‐1 | 2 | 1‐0 | 6 | ||
| 1‐1‐1‐0 | 1 | 1‐0‐1 | 6 | 1‐1‐1‐0 | 1 | 1‐1‐1 | 7 | ||
| 0‐1‐1‐1 | 2 | 1‐1‐1 | 8 | .‐.‐.‐. | . | .‐.‐. | . | ||
| 1‐1‐1‐1 | 1 | 1‐1‐1 | 8 | .‐.‐.‐. | . | .‐.‐. | . | ||
| Mark 2000 | 1‐1‐1‐1 | 1 | 1‐1‐1 | 8 | .‐.‐.‐. | . | .‐.‐. | . | |
| 1‐1‐1‐0 | 2 | 1‐1‐0 | 7 | 1‐1‐1‐1 | 2 | 1‐1‐1 | 9 | ||
| 0‐1‐1‐1 | 2 | 1‐1‐1 | 8 | 1‐0‐1‐1 | 2 | 1‐1‐1 | 8 | ||
| 0‐1‐1‐1 | 2 | 1‐1‐0 | 7 | 1‐1‐1‐1 | 2 | 1‐1‐1 | 9 | ||
| Organ system | Cancer | Case definition | Risk ratio estimate (highest vs lowest exposure category) | 95% CI | Selenium marker | Sex | Study |
| Gynaecological | Cervix | incidence | 0.89 | 0.40 to 2.00 | serum | women | Menkes 1986 (Batieha 1993) |
| 1.10 | n.r. | serum | |||||
| Gynaecological (without breast) | incidence | 0.96 | n.r. | serum | |||
| Ovary | incidence | 0.87 | 0.25 to 5.26 | serum | Knekt 1990 (Knekt 1996) | ||
| 1.22 | 0.44 to 3.38 | toenail | |||||
| 0.58 | 0.2 to 1.7 | serum | Menkes 1986 (Helzlsour 1996) | ||||
| 1.00 | 0.73 to 1.37 | suppl. intake | |||||
| Uterus | incidence | 1.38 | 0.62 to 3.08 | toenail | |||
| Gastrointestinal | Gastrointestinal tract (all) | incidence | 1.00 | n.r. | serum/plasma | both | |
| Oesophageal squamous cell carcinoma | incidence | 0.37 | 0.16 to 0.86 | toenail | both | ||
| 0.67 | 0.53 to 1.30 | intake | both | ||||
| Oesophageal adenocarcinoma | incidence | 0.76 | 0.41 to 1.40 | toenail | both | ||
| Oesophagus | incidence | 0.56 | 0.44 to 0.71 | serum | both | Wei 2004 (Mark 2000) | |
| mortality | 0.62 | 0.44 to 0.89 | serum | ||||
| mortality | 0.35 | 0.16 to 0.81 | serum | both | |||
| incidence | 0.27 | 0.03 to 2.21 | suppl. intake | both | |||
| Gastric cardio adenocarcinoma | incidence | 0.52 | 0.27 to 1.02 | toenail | both | ||
| Oesophagus and stomach | incidence | 0.45 | n.r. | serum | men | Knekt 1990 (Knekt 1988) | |
| incidence | 0.67 | n.r. | serum | women | |||
| Liver | incidence | 0.62 | 0.21 to 1.86 | plasma | men | ||
| 0.41 | 0.23 to 0.72 | serum | both | ||||
| 0.86 | 0.52 to to 1.43 | intake | both | ||||
| 0.95 | 0.51 to 1.76 | men | |||||
| 0.70 | 0.26 to 1.90 | women | |||||
| mortality | 0.50 | 0.28 to 0.90 | toenail | both | |||
| 0.57 | 0.31 to 1.05 | men | |||||
| 0.18 | 0.03 to 1.13 | women | |||||
| Pancreas | incidence | 0.08 | 0.01 to 0.56 | serum | men | Menkes 1986 (Burney 1989) | |
| 0.83 | 0.40 to 1.67 | women | |||||
| 0.58 | n.r. | serum | men | ||||
| 3.49 | n.r. | women | |||||
| 0.72 | 0.36 to 1.43 | intake | both | ||||
| 0.69 | 0.39 to 1.20 | supplemental intake | both | ||||
| Rectum | incidence | 0.625 | n.r. | serum | men | ||
| 1.05 | 0.54 to 2.03 | toenail | both |
| |||
| 0.91 | 0.41 to 2.00 | men | |||||
| 1.58 | 0.59 to 4.22 | women | |||||
| 0.80 | 0.68 to 0.95 | supplement use | both | ||||
| 1.09 | 0.63 to 1.89 | serum | both | ||||
| 1.32 | 0.55 to 3.19 | men | |||||
| 0.76 | 0.32 to 1.80 | women | |||||
| Urological cancers | Renal cancer | incidence | 0.40 | 0.17 to 0.98 | dietary intake | both | |
| Urinary tract (all) | incidence | 0.97 | 0.72 to 1.31 | serum | both | ||
| 0.81 | n.r. | serum | men | ||||
| 4.12 | n.r. | women | |||||
| Respiratory tract | Cavum oris/pharynx | incidence | 5.43 | n.r. | serum | both | Menkes 1986 (Zheng 1993) |
| Skin | Melanoma | incidence | 1.66 | 0.71 to 3.85 | toenail | women | |
| 0.90 | 0.30 to 2.50 | serum | both | Menkes 1986 (Breslow 1995) | |||
| 0.98 | 0.69 to 1.41 | suppl. intake | both | Peters 2008 (Asgari 2009) | |||
| Any non‐melanoma cancer | incidence | 0.77 | n.r. | plasma | both | ||
| Basal cell carcinoma | incidence | 0.54 | n.r. | serum | men | ||
| 1.55 | n.r. | women | |||||
| 0.80 | 0.10 to 4.5 | serum | both | Menkes 1986 (Breslow 1995) | |||
| 0.86 | 0.38 to 1.96 | serum | both | ||||
| 0.95 | 0.59 to 1.50 | intake | |||||
| Squamous cell carcinoma | incidence | 0.69 | 0.51 to 0.92 | plasma | both | ||
| 0.60 | 0.20 to 1.50 | serum | both | Menkes 1986 (Breslow 1995) | |||
| 0.86 | 0.47 to 1.58 | plasma | both | ||||
| 1.30 | 0.77 to 2.3 | intake | both | ||||
| 0.49 | 0.24 to 0.99 | serum | |||||
| Other | Haematological | incidence | 0.60 | n.r. | serum/plasma | both | |
| incidence | 0.95 | 0.75 to 1.20 | suppl. intake | both | |||
| Thyroid | incidence | 0.13 | 0.02 to 0.77 | serum | both | ||
| 0.15 | 0.0 to 5.0 | men | |||||
| 0.12 | 0.01 to 1.11 | women | |||||
| 1.35 | 0.99 to 1.84 | intake | both | ||||
| 1.23 | 0.71 to 2.12 | men | |||||
| 1.14 | 1.65 to 2.02 | women | |||||
| n.r. = not reported. | |||||||
| Outcome or subgroup title | No. of studies | No. of participants | Statistical method | Effect size |
| 1 Any cancer risk Show forest plot | 5 | Risk Ratio (IV, Random, 95% CI) | Subtotals only | |
| 1.1 Studies with low RoB | 3 | 19475 | Risk Ratio (IV, Random, 95% CI) | 1.01 [0.93, 1.10] |
| 1.2 All studies | 5 | 21860 | Risk Ratio (IV, Random, 95% CI) | 0.99 [0.86, 1.14] |
| 2 Cancer mortality Show forest plot | 2 | Risk Ratio (IV, Random, 95% CI) | Subtotals only | |
| 2.1 Studies with low RoB | 1 | 17448 | Risk Ratio (IV, Random, 95% CI) | 1.02 [0.80, 1.30] |
| 2.2 All studies | 2 | 18698 | Risk Ratio (IV, Random, 95% CI) | 0.81 [0.49, 1.32] |
| 3 Head and neck cancer risk Show forest plot | 2 | Risk Ratio (IV, Random, 95% CI) | Subtotals only | |
| 3.1 Studies with low RoB | 1 | 1561 | Risk Ratio (IV, Random, 95% CI) | 1.00 [0.18, 5.45] |
| 3.2 All studies | 2 | 2811 | Risk Ratio (IV, Random, 95% CI) | 1.22 [0.52, 2.85] |
| 4 Oesophageal cancer risk Show forest plot | 2 | Risk Ratio (IV, Random, 95% CI) | Subtotals only | |
| 4.1 Studies with low RoB | 1 | 1561 | Risk Ratio (IV, Random, 95% CI) | 1.50 [0.06, 36.86] |
| 4.2 All studies | 2 | 2811 | Risk Ratio (IV, Random, 95% CI) | 0.53 [0.12, 2.28] |
| 5 Colorectal cancer risk Show forest plot | 3 | Risk Ratio (IV, Random, 95% CI) | Subtotals only | |
| 5.1 Studies with low RoB | 2 | 19009 | Risk Ratio (IV, Random, 95% CI) | 0.99 [0.69, 1.43] |
| 5.2 All studies | 3 | 20259 | Risk Ratio (IV, Random, 95% CI) | 0.74 [0.41, 1.33] |
| 6 Liver cancer risk Show forest plot | 4 | Risk Ratio (IV, Random, 95% CI) | Subtotals only | |
| 6.1 Studies with low RoB | 1 | 1561 | Risk Ratio (IV, Random, 95% CI) | 6.52 [0.37, 115.49] |
| 6.2 All studies | 4 | 6326 | Risk Ratio (IV, Random, 95% CI) | 0.52 [0.35, 0.79] |
| 7 Melanoma risk Show forest plot | 3 | Risk Ratio (IV, Random, 95% CI) | Subtotals only | |
| 7.1 Studies with low RoB | 2 | 2027 | Risk Ratio (IV, Random, 95% CI) | 1.35 [0.41, 4.52] |
| 7.2 All studies | 3 | 3277 | Risk Ratio (IV, Random, 95% CI) | 1.28 [0.63, 2.59] |
| 8 Non‐melanoma skin cancer risk Show forest plot | 4 | Risk Ratio (Random, 95% CI) | Subtotals only | |
| 8.1 Studies with low RoB | 2 | 2027 | Risk Ratio (Random, 95% CI) | 1.16 [0.30, 4.42] |
| 8.2 All studies | 4 | 3461 | Risk Ratio (Random, 95% CI) | 1.23 [0.73, 2.08] |
| 9 Lung cancer risk Show forest plot | 3 | Risk Ratio (IV, Random, 95% CI) | Subtotals only | |
| 9.1 Studies with low RoB | 2 | 19009 | Risk Ratio (IV, Random, 95% CI) | 1.16 [0.89, 1.50] |
| 9.2 All studies | 3 | 20259 | Risk Ratio (IV, Random, 95% CI) | 1.03 [0.78, 1.37] |
| 10 Breast cancer risk Show forest plot | 3 | Risk Ratio (IV, Random, 95% CI) | Subtotals only | |
| 10.1 Studies with low RoB | 1 | 802 | Risk Ratio (IV, Random, 95% CI) | 2.04 [0.44, 9.55] |
| 10.2 All studies | 3 | 2260 | Risk Ratio (IV, Random, 95% CI) | 1.44 [0.96, 2.17] |
| 11 Bladder cancer risk Show forest plot | 3 | Risk Ratio (IV, Random, 95% CI) | Subtotals only | |
| 11.1 Studies with low RoB | 2 | 19009 | Risk Ratio (IV, Random, 95% CI) | 1.07 [0.76, 1.52] |
| 11.2 All studies | 3 | 20259 | Risk Ratio (IV, Random, 95% CI) | 1.10 [0.79, 1.52] |
| 12 Prostate cancer risk Show forest plot | 5 | Risk Ratio (IV, Random, 95% CI) | Subtotals only | |
| 12.1 Studies with low RoB | 4 | 18942 | Risk Ratio (IV, Random, 95% CI) | 1.01 [0.90, 1.14] |
| 12.2 All studies | 5 | 19869 | Risk Ratio (IV, Random, 95% CI) | 0.91 [0.75, 1.12] |
| 13 Leukaemia and lymphoma risk Show forest plot | 2 | Risk Ratio (IV, Random, 95% CI) | Subtotals only | |
| 13.1 Studies with low RoB | 1 | 1561 | Risk Ratio (IV, Random, 95% CI) | 1.00 [0.25, 3.99] |
| 13.2 All studies | 2 | 2811 | Risk Ratio (IV, Random, 95% CI) | 1.21 [0.52, 2.80] |
| Outcome or subgroup title | No. of studies | No. of participants | Statistical method | Effect size |
| 1 Total cancer incidence and mortality Show forest plot | 14 | Odds Ratio (Random, 95% CI) | Subtotals only | |
| 1.1 Incidence | 7 | Odds Ratio (Random, 95% CI) | 0.72 [0.55, 0.93] | |
| 1.2 Mortality | 7 | Odds Ratio (Random, 95% CI) | 0.76 [0.59, 0.97] | |
| 2 Total cancer incidence and mortality (men) Show forest plot | 8 | Odds Ratio (Random, 95% CI) | Subtotals only | |
| 2.1 Incidence | 4 | Odds Ratio (Random, 95% CI) | 0.72 [0.46, 1.14] | |
| 2.2 Mortality | 4 | Odds Ratio (Random, 95% CI) | 0.65 [0.45, 0.94] | |
| 3 Total cancer incidence and mortality (women) Show forest plot | 6 | Odds Ratio (Random, 95% CI) | Subtotals only | |
| 3.1 Incidence | 2 | Odds Ratio (Random, 95% CI) | 0.90 [0.45, 1.77] | |
| 3.2 Mortality | 4 | Odds Ratio (Random, 95% CI) | 0.91 [0.80, 1.03] | |
| 4 Total cancer incidence and mortality (ascending order of selenium levels) Show forest plot | 13 | Odds Ratio (Random, 95% CI) | Subtotals only | |
| 4.1 Incidence | 7 | 1642 | Odds Ratio (Random, 95% CI) | 0.72 [0.55, 0.93] |
| 4.2 Mortality | 6 | 1230 | Odds Ratio (Random, 95% CI) | 0.63 [0.39, 1.01] |
| 5 Total cancer incidence and mortality (ascending order of differences in selenium levels) Show forest plot | 13 | Odds Ratio (Random, 95% CI) | Subtotals only | |
| 5.1 Incidence | 7 | 190 | Odds Ratio (Random, 95% CI) | 0.72 [0.55, 0.93] |
| 5.2 Mortality | 6 | 106 | Odds Ratio (Random, 95% CI) | 0.63 [0.39, 1.01] |
| 6 Stomach cancer risk Show forest plot | 5 | Odds Ratio (Random, 95% CI) | 0.66 [0.43, 1.01] | |
| 7 Stomach cancer risk (by sex) Show forest plot | 5 | Odds Ratio (Random, 95% CI) | 0.66 [0.42, 1.04] | |
| 7.1 All (male + female) | 2 | Odds Ratio (Random, 95% CI) | 0.75 [0.41, 1.36] | |
| 7.2 Male | 3 | Odds Ratio (Random, 95% CI) | 0.43 [0.14, 1.32] | |
| 7.3 Female | 2 | Odds Ratio (Random, 95% CI) | 0.73 [0.12, 4.35] | |
| 8 Colorectal cancer risk Show forest plot | 6 | Odds Ratio (Random, 95% CI) | 0.82 [0.72, 0.94] | |
| 9 Colorectal cancer risk (by sex) Show forest plot | 6 | Odds Ratio (Random, 95% CI) | 0.83 [0.72, 0.95] | |
| 9.1 All (male + female) | 1 | Odds Ratio (Random, 95% CI) | 0.80 [0.68, 0.94] | |
| 9.2 Male | 4 | Odds Ratio (Random, 95% CI) | 0.86 [0.65, 1.16] | |
| 9.3 Female | 4 | Odds Ratio (Random, 95% CI) | 0.96 [0.61, 1.50] | |
| 10 Colon cancer risk Show forest plot | 5 | Odds Ratio (Random, 95% CI) | 0.81 [0.69, 0.96] | |
| 11 Colon cancer risk (by sex) Show forest plot | 5 | Odds Ratio (Random, 95% CI) | 0.81 [0.69, 0.96] | |
| 11.1 All (male + female) | 2 | Odds Ratio (Random, 95% CI) | 0.84 [0.68, 1.03] | |
| 11.2 Male | 3 | Odds Ratio (Random, 95% CI) | 0.84 [0.56, 1.25] | |
| 11.3 Female | 2 | Odds Ratio (Random, 95% CI) | 0.68 [0.44, 1.04] | |
| 12 Lung cancer incidence and mortality Show forest plot | 13 | Odds Ratio (Random, 95% CI) | Subtotals only | |
| 12.1 Incidence | 11 | Odds Ratio (Random, 95% CI) | 0.82 [0.59, 1.14] | |
| 12.2 Mortality | 2 | Odds Ratio (Random, 95% CI) | 1.34 [0.93, 1.93] | |
| 13 Lung cancer risk (sex‐disaggregated data) Show forest plot | 13 | Odds Ratio (Random, 95% CI) | 0.89 [0.69, 1.14] | |
| 13.1 All (male + female) | 5 | Odds Ratio (Random, 95% CI) | 0.74 [0.43, 1.28] | |
| 13.2 Male | 7 | Odds Ratio (Random, 95% CI) | 0.98 [0.68, 1.39] | |
| 13.3 Female | 4 | Odds Ratio (Random, 95% CI) | 0.83 [0.43, 1.61] | |
| 14 Lung cancer risk (by exposure assessment) Show forest plot | 13 | Odds Ratio (Random, 95% CI) | 0.88 [0.65, 1.18] | |
| 14.1 Intake | 2 | Odds Ratio (Random, 95% CI) | 1.32 [0.95, 1.84] | |
| 14.2 Serum or plasma | 9 | Odds Ratio (Random, 95% CI) | 0.91 [0.70, 1.18] | |
| 14.3 Toenail | 2 | Odds Ratio (Random, 95% CI) | 1.05 [0.11, 10.36] | |
| 15 Lung cancer risk (ascending order of selenium levels) Show forest plot | 8 | 1938 | Odds Ratio (Random, 95% CI) | 0.97 [0.74, 1.27] |
| 16 Lung cancer risk (ascending order of differences in selenium levels) Show forest plot | 8 | 188 | Odds Ratio (Random, 95% CI) | 0.97 [0.74, 1.27] |
| 17 Breast cancer risk (women) Show forest plot | 8 | Odds Ratio (Random, 95% CI) | 1.09 [0.87, 1.37] | |
| 18 Bladder cancer risk Show forest plot | 5 | Odds Ratio (Random, 95% CI) | 0.67 [0.46, 0.97] | |
| 18.1 All (male + female) | 2 | Odds Ratio (Random, 95% CI) | 0.65 [0.46, 0.92] | |
| 18.2 Male | 3 | Odds Ratio (Random, 95% CI) | 0.82 [0.41, 1.62] | |
| 18.3 Female | 1 | Odds Ratio (Random, 95% CI) | 0.36 [0.14, 0.92] | |
| 19 Prostate cancer risk Show forest plot | 21 | Odds Ratio (Random, 95% CI) | 0.84 [0.75, 0.95] | |
| 20 Prostate cancer risk (by exposure assessment) Show forest plot | 21 | Odds Ratio (Random, 95% CI) | 0.84 [0.75, 0.95] | |
| 20.1 Intake and supplement | 4 | Odds Ratio (Random, 95% CI) | 0.99 [0.85, 1.15] | |
| 20.2 Serum or plasma | 13 | Odds Ratio (Random, 95% CI) | 0.86 [0.75, 0.99] | |
| 20.3 Toenail | 4 | Odds Ratio (Random, 95% CI) | 0.60 [0.44, 0.82] | |
| 21 Prostate cancer risk (ascending order of selenium levels) Show forest plot | 13 | 2816 | Odds Ratio (Random, 95% CI) | 0.86 [0.75, 0.99] |
| 22 Prostate cancer risk (ascending order of differences in selenium levels) Show forest plot | 13 | 345 | Odds Ratio (Random, 95% CI) | 0.86 [0.75, 0.99] |