| 1 Mean alcohol consumption in grams per week: smaller values indicate better outcome Show forest plot | 8 | | Mean Difference (IV, Fixed, 95% CI) | Subtotals only |
|
| 1.1 4 month follow up | 1 | 511 | Mean Difference (IV, Fixed, 95% CI) | ‐16.32 [‐180.89, 148.25] |
| 1.2 6 month follow up | 4 | 453 | Mean Difference (IV, Fixed, 95% CI) | ‐69.43 [‐128.14, ‐10.72] |
| 1.3 9 month follow up | 1 | 479 | Mean Difference (IV, Fixed, 95% CI) | ‐182.88 [‐360.00, ‐5.76] |
| 1.4 1 year follow up | 4 | 1073 | Mean Difference (IV, Fixed, 95% CI) | ‐33.62 [‐82.27, 15.03] |
| 2 Sensitivity analysis: Mean alcohol consumption in grams per week: smaller values indicate better outcome Show forest plot | 7 | | Mean Difference (IV, Random, 95% CI) | Subtotals only |
|
| 2.1 6 month follow up | 3 | 364 | Mean Difference (IV, Random, 95% CI) | ‐55.49 [‐115.33, 4.35] |
| 2.2 1 year follow up | 4 | 997 | Mean Difference (IV, Random, 95% CI) | ‐36.31 [‐86.64, 14.01] |
| 3 Mean alcohol consumption (change scores from baseline): smaller values indicate better outcome Show forest plot | 3 | | Std. Mean Difference (IV, Random, 95% CI) | Subtotals only |
|
| 3.1 6 month follow up | 2 | 687 | Std. Mean Difference (IV, Random, 95% CI) | ‐0.26 [‐0.73, 0.21] |
| 3.2 1 year follow up | 2 | 696 | Std. Mean Difference (IV, Random, 95% CI) | ‐0.08 [‐0.41, 0.24] |
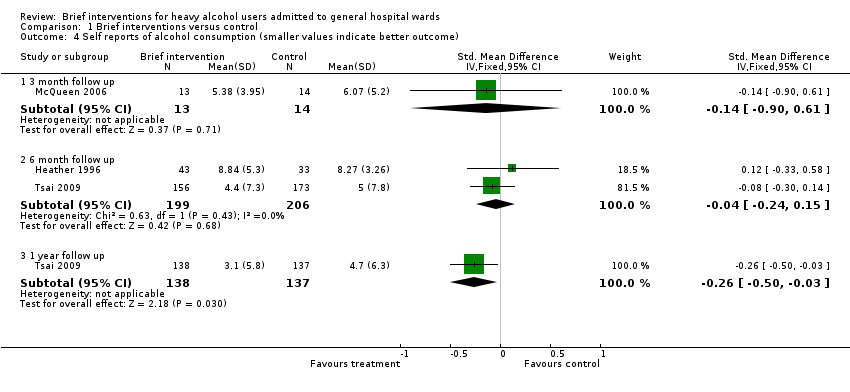
| 4 Self reports of alcohol consumption (smaller values indicate better outcome) Show forest plot | 3 | | Std. Mean Difference (IV, Fixed, 95% CI) | Subtotals only |
|
| 4.1 3 month follow up | 1 | 27 | Std. Mean Difference (IV, Fixed, 95% CI) | ‐0.14 [‐0.90, 0.61] |
| 4.2 6 month follow up | 2 | 405 | Std. Mean Difference (IV, Fixed, 95% CI) | ‐0.04 [‐0.24, 0.15] |
| 4.3 1 year follow up | 1 | 275 | Std. Mean Difference (IV, Fixed, 95% CI) | ‐0.26 [‐0.50, ‐0.03] |
| 5 Laboratory markers (GammaGT): smaller values indicate better outcome Show forest plot | 3 | | Mean Difference (IV, Fixed, 95% CI) | Subtotals only |
|
| 5.1 6 month follow up | 1 | 89 | Mean Difference (IV, Fixed, 95% CI) | 7.0 [‐33.77, 47.77] |
| 5.2 1 year follow up | 2 | 160 | Mean Difference (IV, Fixed, 95% CI) | ‐5.05 [‐36.82, 26.73] |
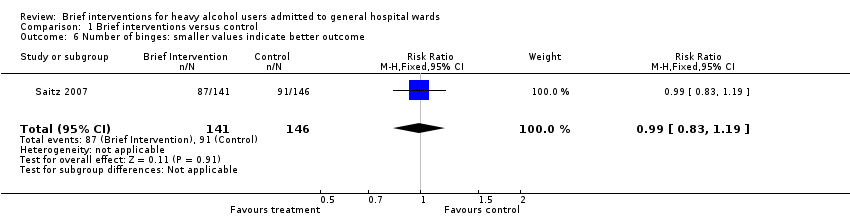
| 6 Number of binges: smaller values indicate better outcome Show forest plot | 1 | 287 | Risk Ratio (M‐H, Fixed, 95% CI) | 0.99 [0.83, 1.19] |
|
| 7 Heavy drinking episodes (days per week): smaller values indicate better outcome Show forest plot | 1 | | Mean Difference (IV, Fixed, 95% CI) | Subtotals only |
|
| 7.1 4 months follow up | 1 | 511 | Mean Difference (IV, Fixed, 95% CI) | ‐0.56 [‐1.02, ‐0.10] |
| 7.2 9 months follow up | 1 | 479 | Mean Difference (IV, Fixed, 95% CI) | ‐0.78 [‐1.32, ‐0.24] |
| 7.3 12 months follow up | 1 | 473 | Mean Difference (IV, Fixed, 95% CI) | ‐0.71 [‐1.26, ‐0.16] |
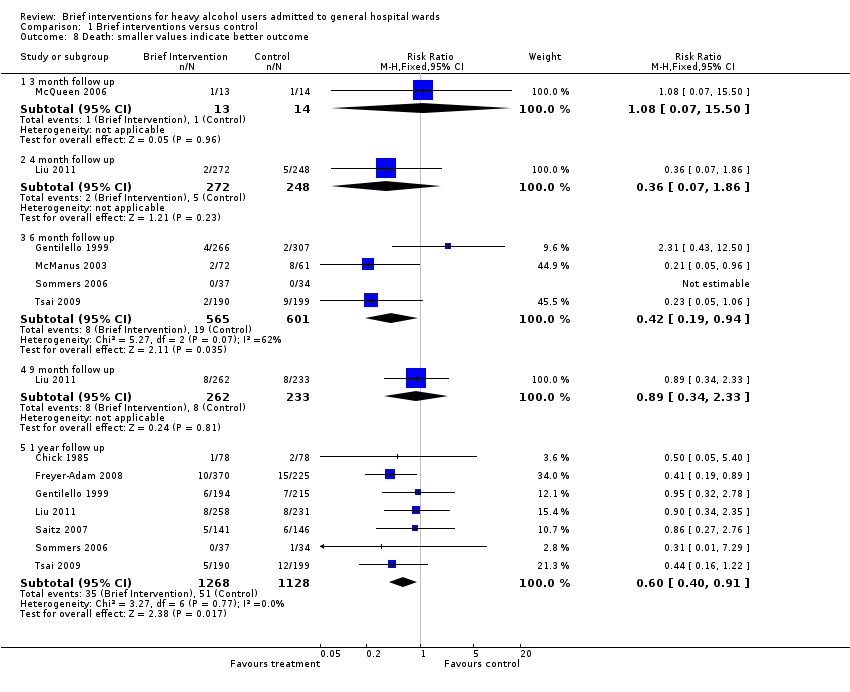
| 8 Death: smaller values indicate better outcome Show forest plot | 9 | | Risk Ratio (M‐H, Fixed, 95% CI) | Subtotals only |
|
| 8.1 3 month follow up | 1 | 27 | Risk Ratio (M‐H, Fixed, 95% CI) | 1.08 [0.07, 15.50] |
| 8.2 4 month follow up | 1 | 520 | Risk Ratio (M‐H, Fixed, 95% CI) | 0.36 [0.07, 1.86] |
| 8.3 6 month follow up | 4 | 1166 | Risk Ratio (M‐H, Fixed, 95% CI) | 0.42 [0.19, 0.94] |
| 8.4 9 month follow up | 1 | 495 | Risk Ratio (M‐H, Fixed, 95% CI) | 0.89 [0.34, 2.33] |
| 8.5 1 year follow up | 7 | 2396 | Risk Ratio (M‐H, Fixed, 95% CI) | 0.60 [0.40, 0.91] |
| 9 Sensitivity analysis: Death: smaller values indicate better outcome Show forest plot | 7 | | Risk Ratio (M‐H, Random, 95% CI) | Subtotals only |
|
| 9.1 1 year follow up | 7 | 2275 | Risk Ratio (M‐H, Random, 95% CI) | 0.61 [0.39, 0.96] |
| 10 Mean alcohol consumption in grams per week restricted to studies including only men: smaller values indicate better outcome Show forest plot | 4 | | Mean Difference (IV, Random, 95% CI) | Subtotals only |
|
| 10.1 4 month follow up | 1 | 511 | Mean Difference (IV, Random, 95% CI) | ‐16.32 [‐180.89, 148.25] |
| 10.2 6 month follow up | 2 | 169 | Mean Difference (IV, Random, 95% CI) | ‐201.73 [‐586.96, 183.50] |
| 10.3 9 month follow up | 1 | 479 | Mean Difference (IV, Random, 95% CI) | ‐182.88 [‐360.00, ‐5.76] |
| 10.4 1 year follow up | 2 | 606 | Mean Difference (IV, Random, 95% CI) | ‐51.52 [‐144.25, 41.20] |
| 11 Driving offences within 3 years: smaller values indicate better outcome Show forest plot | 1 | 126 | Risk Ratio (M‐H, Fixed, 95% CI) | 0.52 [0.22, 1.19] |
|
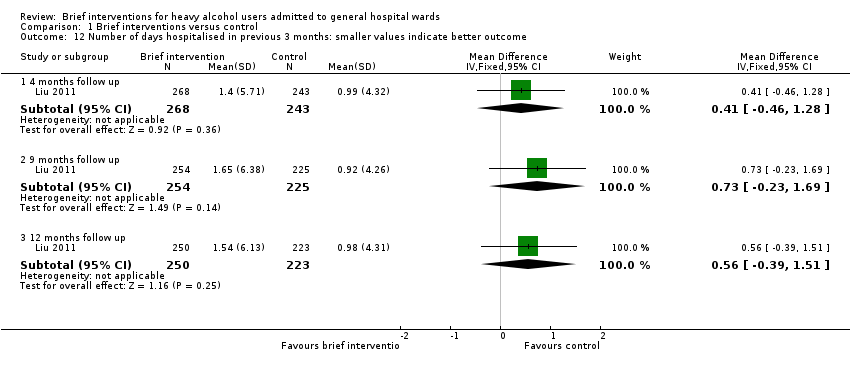
| 12 Number of days hospitalised in previous 3 months: smaller values indicate better outcome Show forest plot | 1 | | Mean Difference (IV, Fixed, 95% CI) | Subtotals only |
|
| 12.1 4 months follow up | 1 | 511 | Mean Difference (IV, Fixed, 95% CI) | 0.41 [‐0.46, 1.28] |
| 12.2 9 months follow up | 1 | 479 | Mean Difference (IV, Fixed, 95% CI) | 0.73 [‐0.23, 1.69] |
| 12.3 12 months follow up | 1 | 473 | Mean Difference (IV, Fixed, 95% CI) | 0.56 [‐0.39, 1.51] |
| 13 A&E visits in previous 3 months: smaller values indicate better outcome Show forest plot | 1 | | Mean Difference (IV, Fixed, 95% CI) | Subtotals only |
|
| 13.1 4 months follow up | 1 | 511 | Mean Difference (IV, Fixed, 95% CI) | 0.03 [‐0.03, 0.09] |
| 13.2 9 months follow up | 1 | 479 | Mean Difference (IV, Fixed, 95% CI) | 0.06 [‐0.00, 0.12] |
| 13.3 12 months follow up | 1 | 473 | Mean Difference (IV, Fixed, 95% CI) | 0.05 [‐0.01, 0.11] |