特利加压素与安慰剂或无干预治疗肝硬化和肝肾综合征患者的疗效比较
摘要
研究背景
肝肾综合征是一种与严重肝脏疾病相关的潜在可逆性肾衰竭。这种疾病在失代偿性肝硬化患者中相对常见。特利加压素是一种通过收缩血管来增加肾脏血流量的药物。本系统综述的前一版本发现,特利加压素对肝硬化和肝肾综合征患者的死亡率和肾功能有潜在的有益作用。
研究目的
评估特利加压素与安慰剂/无干预对肝硬化和肝肾综合征患者的有益和有害影响。
检索策略
我们通过检索Cochrane肝胆组对照试验注册库(Cochrane Hepato‐Biliary Group Controlled Trials Register)、Cochrane图书馆的Cochrane对照试验中心注册库(Cochrane Central Register of Controlled Trials, CENTRAL)、MEDLINE、Embase和Science Citation Index Expanded以及手动检索(截至2016年11月21日)来确定符合条件的试验。
纳入排除标准
随机临床试验(randomised clinical trials, RCTs)纳入肝硬化和1型或2型肝肾综合征受试者,并分配给特利加压素组和安慰剂/无干预对照组。我们允许两个对照组同时使用白蛋白。
资料收集与分析
两位综述作者独立地从试验报告中提取资料并与作者进行联系。主要结局是死亡率、肝肾综合征和严重不良事件。我们对受试者接受白蛋白治疗的RCT进行了敏感性分析,对患有1型或2型肝肾综合征患者进行了亚组分析,并进行了试验序贯分析以对照随机误差。我们报告了具有风险比(risk ratio, RR)和95%置信区间(confidence interval, CI)的随机效应meta分析。我们根据Cochrane肝胆组领域评估了偏倚风险。我们使用了GRADE评价法评价了证据质量。
主要结果
我们纳入了9项RCT,共涉及534名患有肝硬化和腹水的受试者。有1项RCT对死亡率的偏倚风险低,对其余结局的偏倚风险高。所有纳入的试验对非死亡率结局的偏倚风险都高。共有473名受试者患有1型肝肾综合征。有7项RCT专门评价了特利加压素和白蛋白。当纳入所有RCT后发现,特利加压素与死亡率的有益影响相关(RR=0.85, 95% CI [0.73, 0.98];涉及534名受试者;额外获益需治疗数(number needed to treat for an additional beneficial outcome, NNTB)=10.3人;低质量证据)。试验序贯分析(包括所有的RCT)也发现特利加压素的有益作用。其他分析显示,特利加压素和白蛋白对逆转肝肾综合征产生有益的作用(RR=0.63, 95% CI [0.48, 0.82];涉及510名受试者;8项RCT;NNTB=4人;低质量证据)。特利加压素会增加严重心血管不良事件的风险率(RR=7.26, 95% CI [1.70, 31.05];涉及234名受试者;4项RCT),但当作为综合结局分析时,它对严重不良事件的风险率没有影响(RR=0.91, 95% CI [0.68, 1.21];涉及534名受试者;9项RCT;NNTB=24.5人;低质量证据)。非严重不良事件主要是胃肠道问题,包括腹泻(RR=5.76, 95% CI [2.19, 15.15];涉及240名受试者;低质量证据)和腹痛(RR=1.54, 95% CI [0.97, 2.43];涉及294名受试者;低质量证据)。
我们发现了一项正在进行的针对肝硬化、腹水和1型肝肾综合征受试者的特利加压素与安慰剂的对照试验。
三项RCT报告受到了一家制药公司的资助。其余的试验没有报告资助情况,也没有得到制药公司的资助。
作者结论
本综述表明,特利加压素可能对肝硬化和1型肝肾综合征患者的死亡率和肾功能产生有益的影响,但也与严重的不良反应有关。由于偏倚对照、临床异质性和不精确性等方法学问题,我们降低了证据的质量评价。因此,需要额外的证据。
PICO
简语概要
特利加压素与安慰剂/无干预治疗肝硬化和肝肾综合征患者的疗效对比
研究背景
肝硬化是一种慢性肝脏疾病,其中疤痕组织取代了正常肝脏。肝硬化患者可能会患上一种被称为肝肾综合征的肾脏疾病。当肾脏供血不足时,该疾病病情会恶化。因此,增加肾脏的血流量可能对肝肾综合征患者有益。肝肾综合征有两种类型:1型发生迅速,2型发病较慢。特利加压素是一种通过收缩血管来增加肾脏血流量的药物。因此,该药可能有助于肝硬化和肝肾综合征患者。
系统综述问题
特利加压素对肝肾综合征患者是否优于非阳性安慰剂/无干预治疗?
文献检索日期
2016年11月。
研究特征
本综述纳入了9项RCT,共涉及534名受试者。这些试验来自六个国家。有7项试验仅纳入1型肝肾综合征患者。两项试验共纳入96名1型或2型肝肾综合征患者。
研究资金来源
三项RCT报告受到了一家制药公司的资助。其余的试验没有报告资助情况,也没有得到制药公司的资助。
主要研究结果
接受特利加压素治疗的患者比接受非阳性安慰剂或不接受治疗的患者死亡风险更低。特立加压素对肾功能也有有益作用。特利加压素增加了严重循环和心脏问题(所谓的心血管事件)的风险。其他不良事件包括腹泻和腹痛。
分析主要涉及1型肝肾综合征患者。在分析2型肝肾综合征的受试者时,没有发现特利加压素的有益或有害影响(可能是由于受试者人数少)。
证据质量
我们认为当前证据质量低。
Authors' conclusions
Summary of findings
| Terlipressin versus placebo or no intervention for hepatorenal syndrome. Administration of albumin allowed if administered to both the intervention and comparison group | ||||||
| Patient or population: people with hepatorenal syndrome Comparison: placebo or no intervention or albumin | ||||||
| Outcomes | Anticipated absolute effects* (95% CI) | Relative effect | № of participants | Quality of the evidence | Comments | |
| Risk with placebo or no intervention | Risk with terlipressin | |||||
| Mortality | Study population | RR 0.85 (0.73 to 0.98) | 534 | ⊕⊕⊝⊝ | Downgraded because of i) clinical heterogeneity and ii) the results of the Trial Sequential Analysis | |
| 688 per 1000 | 536 per 1000 | |||||
| Moderate | ||||||
| 625 per 1000 | 488 per 1000 | |||||
| Hepatorenal syndrome | Study population | RR 0.63 (0.48 to 0.82) | 510 | ⊕⊕⊝⊝ | Downgraded because of i) clinical heterogeneity and ii) all trials are judged as 'high risk of bias'. | |
| 879 per 1000 | 510 per 1000 | |||||
| Moderate | ||||||
| 875 per 1000 | 507 per 1000 | |||||
| Serious adverse events | Study population | RR 0.91 (0.68 to 1.21) | 534 (9 RCTs) | ⊕⊕⊝⊝ | Downgraded because of i) clinical heterogeneity and ii) all RCTs are judged as high risk of bias. | |
| 85 per 1000 | 212 per 1000 | |||||
| Serious cardiovascular adverse events | Study population | RR 7.26 (1.70 to 31.05) | 234 | ⊕⊕⊝⊝ | Downgraded because of i) clinical heterogeneity and ii) all RCTs are judged as high risk of bias | |
| 16 per 1000 | 111 per 1000 | |||||
| Abdominal pain | Study population | RR 1.54 (0.97 to 2.43) | 294 (4 RCTs) | ⊕⊕⊝⊝ | Downgraded because of i) clinical heterogeneity and ii) all RCTs are judged as high risk of bias | |
| 149 per 1000 | 229 per 1000 | |||||
| Diarrhoea | Study population | RR 5.76 (2.19 to 15.15) | 240 (2 RCTs) | ⊕⊕⊝⊝ | Downgraded because of i) clinical heterogeneity and ii) all RCTs are judged as high risk of bias | |
| 33 per 1000 | 190 per 1000 | |||||
| *The risk in the intervention group (and its 95% confidence interval) is based on the assumed risk in the comparison group and the relative effect of the intervention (and its 95% CI). | ||||||
| GRADE Working Group grades of evidence | ||||||
| 1Not confirmed in analyses of randomised clinical trials (RCTs) with a low risk of bias. | ||||||
Background
Description of the condition
Hepatorenal syndrome is a potentially reversible renal failure associated with severe liver disease (Arroyo 1996). The disease is relatively common among people with decompensated cirrhosis. Over 20% of people with decompensated cirrhosis become hospitalised with renal failure, among whom up to 20% have hepatorenal syndrome (Gines 1993; Garcia‐Tsao 2008; Israelsen 2015b). The diagnosis includes cirrhosis and ascites plus impaired renal function after exclusion of parenchymal renal disease and factors that may precipitate renal dysfunction in cirrhosis (Salerno 2007). Hepatorenal syndrome is divided into two types, with type 1 having the most rapid course of development. Without treatment, type 1 has a median survival of about two weeks and type 2 a median survival of about six months (Arroyo 1996; Gines 2003; Salerno 2007).
Description of the intervention
The development of hepatorenal syndrome is associated with the circulatory changes seen in cirrhosis of the liver subsequent to portal hypertension and vasodilation of the splanchnic vasculature (Cardenas 2003). This vasodilation results in effective underfilling of the renal arteries and activation of the renin‐angiotensin‐aldosterone, the arginine‐vasopressin, and the sympathetic nervous systems (Pasqualetti 1998; Moller 2004; Ruiz del Arbol 2005). Activation of these systems may in turn lead to severe vasoconstriction of the renal arteries and hepatorenal syndrome (Cardenas 2003). Current treatments focus on improvement of renal blood flow and effective arterial circulation. This is done with volume expanders (such as intravenous albumin) or with vasoactive drugs that preferentially constrict the splanchnic circulation, such as terlipressin.
How the intervention might work
Vasoactive drugs that increase the splanchnic arterial tone may reverse hepatorenal syndrome. Vasopressin is a potential candidate, but may lead to severe ischaemia of the mesenteric mucosa, skin, and myocardium (Obritsch 2004). A controlled trial found that the vasopressin analogue terlipressin may be a safer alternative (Freeman 1982). Terlipressin is administered intravenously either by bolus or continuous infusion. It is commonly titrated based on desired change in mean arterial pressure. It has both systemic and splanchnic constrictive effects, so adverse events include sequelae of vasoconstriction, such as mild gastrointestinal symptoms (e.g. diarrhoea and abdominal pain) or more severe evidence of ischaemia.
Why it is important to do this review
Two initial randomised clinical trials (RCTs) evaluated terlipressin for participants with hepatorenal syndrome; however, they were small and had short‐term follow‐up (Hadengue 1998; Solanki 2003). Three subsequent larger RCTs found no convincing effects on mortality (Martín‐Llahí 2008; Neri 2008; Sanyal 2008). Three meta‐analyses of RCTs and observational studies reached equivocal findings (Fabrizi 2009; Dobre 2010; Sagi 2010). In the previous version of this systematic review, we found a potential beneficial effect of terlipressin on mortality and reversal of hepatorenal syndrome (Gluud 2006), but we also identified potential methodological concerns. We updated the review to include the currently available evidence.
Objectives
To assess the beneficial and harmful effects of terlipressin versus placebo or no intervention for people with cirrhosis and hepatorenal syndrome.
Methods
Criteria for considering studies for this review
Types of studies
We included RCTs irrespective of blinding, publication status, or language. We included the first period from cross‐over RCTs. In addition, we planned to include quasi‐randomised studies and observational studies in our assessment of serious adverse events (Higgins 2011), although this is a known limitation making us focus more on benefits than on harms (Gluud 2017).
Types of participants
We included people with cirrhosis and type 1 or type 2 hepatorenal syndrome (defined as an increase in creatinine in people with ascites and no other causes of renal disease).
Types of interventions
We included RCTs comparing terlipressin (any dose or duration) versus placebo or no intervention. We allowed co‐administration of albumin given to both comparison groups.
Types of outcome measures
We assessed all outcomes at the maximum duration of follow‐up.
Primary outcomes
-
Mortality.
-
Hepatorenal syndrome (number of participants who did not achieve reversal of hepatorenal syndrome).
-
Serious adverse events: any untoward medical occurrence that led to death, was life‐threatening, or required hospitalisation or prolongation of hospitalisation (ICH‐GCP 1997). We analysed serious adverse events as a composite outcome (Gluud 2017).
Secondary outcomes
-
Health‐related quality of life: the overall score based on the quality of life questionnaires used in individual trials.
-
Non‐serious adverse events: all adverse events that did not fulfil the criteria for serious adverse events.
Search methods for identification of studies
Electronic searches
We performed electronic searches in the Cochrane Hepato‐Biliary Group Controlled Trials Register, the Cochrane Central Register of Controlled Trials (CENTRAL) in the Cochrane Library, MEDLINE (OvidSP), Embase (OvidSP), and Science Citation Index Expanded (Web of Science) (Royle 2003). The search strategies with the timespan of the searches are given in Appendix 1. We updated searches as of 21 November 2016.
Searching other resources
Manual searches included scanning of reference lists in relevant articles and conference proceedings. We also searched trial registers through the World Health Organization International Clinical Trials Registry Platform (WHO ICTRP) search portal (www.who.int/ictrp/search/en/) (21 November, 2016).
Data collection and analysis
Selection of studies
Two review authors (AA and MI) independently selected trials eligible for inclusion from the updated literature searches and listed excluded with the reasons for exclusion.
Data extraction and management
Two review authors (AA and MI) independently extracted data. All disagreements were resolved through discussion before analyses. In case of disagreements, a third review author (LG) acted as ombudsman. We wrote to authors of the included trials to obtain additional information not described in the published reports, including missing data.
Assessment of risk of bias in included studies
We assessed the risk of bias using the domains described in the Cochrane Hepato‐Biliary Group Module (Gluud 2017).
Allocation sequence generation
-
Low risk of bias: the study authors performed sequence generation using computer random number generation or a random number table. Drawing lots, tossing a coin, shuffling cards, and throwing dice were adequate if an independent person not otherwise involved in the study performed them.
-
Unclear risk of bias: not specified.
-
High risk of bias: the sequence generation was not random. We planned to include such studies for assessment of harms.
Allocation concealment
-
Low risk of bias: the participant allocations could not have been foreseen in advance of, or during, enrolment. Allocation was controlled by a central and independent randomisation unit. The allocation sequence was unknown to the investigators (e.g. if the allocation sequence was hidden in sequentially numbered, opaque, and sealed envelopes).
-
Unclear risk of bias: the method used to conceal the allocation was not described so that intervention allocations may have been foreseen in advance of, or during, enrolment.
-
High risk of bias: the allocation sequence was likely to be known to the investigators who assigned the participants.
Blinding of participants and personnel
-
Low risk of bias: i) the outcome was mortality, which according to previous empirical evidence is not likely to be influenced by lack of blinding (Hróbjartsson 2001; Savović 2012); or ii) blinding of participants and key study personnel ensured, and it is unlikely that the blinding could have been broken.
-
Unclear risk of bias: insufficient information to permit judgement of ‘low risk’ or ‘high risk’.
-
High risk of bias: no blinding or incomplete blinding, and the outcome is likely to be influenced by lack of blinding (non‐mortality outcomes).
Blinding of outcome assessors
-
Low risk of bias: i) the outcome was mortality, which according to previous empirical evidence is not likely to be influenced by lack of blinding (Hróbjartsson 2001; Savović 2012); or ii) blinding of outcome assessment ensured, and it is unlikely that the blinding could have been broken.
-
Unclear risk of bias: insufficient information to permit judgement of ‘low risk’ or ‘high risk’.
-
High risk of bias: no blinding or inadequate blinding (e.g. intravenous versus orally administered drugs), and the outcome is likely to be influenced by lack of blinding (non‐mortality outcomes).
Incomplete outcome data
-
Low risk of bias: missing data were unlikely to make treatment effects depart from plausible values. The investigators used sufficient methods, such as intention‐to‐treat analyses with multiple imputations or carry‐forward analyses, to handle missing data.
-
Unclear risk of bias: there was insufficient information to assess whether missing data in combination with the method used to handle missing data induced bias on the results.
-
High risk of bias: the results were likely to be biased due to missing data.
Selective outcome reporting
-
Low risk of bias: the trial reported clinically relevant outcomes (mortality, hepatic encephalopathy, and serious adverse events). If we had access to the original trial protocol, the outcomes should have been those called for in that protocol. If we obtained information from a trial registry (such as www.clinicaltrials.gov), we only used the information if the investigators registered the trial before inclusion of the first participant.
-
Unclear risk of bias: predefined outcomes were not reported fully.
-
High risk of bias: one or more predefined outcomes were not reported.
For‐profit bias
-
Low risk of bias: the trial appears to be free of industry sponsorship or other type of for‐profit support.
-
Unclear risk of bias: no information on clinical trial support or sponsorship was available.
-
High risk of bias: the trial was sponsored by industry, received support in the form of terlipressin or placebo, or received any other type of support.
Other bias
-
Low risk of bias: the trial appeared to be free of other biases including medicinal dosing problems or follow‐up (as defined below).
-
Unclear risk of bias: the trial may or may not have been free of other factors that could put it at risk of bias.
-
High risk of bias: there were other factors in the trial that could put it at risk of bias, such as the administration of inappropriate treatments to the controls (e.g. an inappropriate dose) or follow‐up (e.g. the trial included different follow‐up schedules for participants in the allocation groups), or premature discontinuation of the trial.
Overall bias assessment
-
Low risk of bias: all domains were classified as low risk of bias using the definitions described above.
-
High risk of bias: one or more of the bias domains were classified as unclear or high risk of bias.
Measures of treatment effect
We expressed outcomes using risk ratios (RR) with 95% confidence intervals (CI). For primary outcomes, we calculated the number needed to treat (NNT) using the inverse of the risk difference (RD). Based on the control group event rate, we repeated the analyses using odds ratios (OR) and RD. The analyses using OR and RD had no influence on the results of the review.
Unit of analysis issues
We included data from the first treatment period of cross‐over trials.
Dealing with missing data
We planned to evaluate the importance of missing data in a worst‐case scenario analysis (with inclusion of missing outcomes as treatment failures) and an extreme worst‐case scenario analysis (including missing outcomes as failures in the experimental group and successes in the control group). However, we did not identify participants with missing outcome data and were therefore unable to conduct these analyses.
Assessment of heterogeneity
We expressed heterogeneity as I2 values using the following thresholds: 0% to 40% (unimportant), 40 to 60% (moderate), 60 to 80% (substantial), and > 80% (considerable). We have included this information in the 'Summary of findings' tables (GRADEpro).
Assessment of reporting biases
For meta‐analyses with at least 10 RCTs, we planned to assess reporting biases through regression analyses.
Data synthesis
We performed the analyses in Review Manager 5 (RevMan 2014), STATA (STATA), and Trial Sequential Analysis (TSA 2011), and used GRADEpro softwareto prepare 'Summary of findings' tables (GRADEpro).
Meta‐analysis
We initially conducted fixed‐effect and random‐effects meta‐analyses (Higgins 2011). If the estimates of the fixed‐effect and random‐effects meta‐analyses were similar, then we assumed that any small‐study effects had little effect on the intervention effect estimate. If the random‐effects estimate was more beneficial, we planned to re‐evaluate whether it was reasonable to conclude that the intervention was more effective in the smaller studies. We originally planned to evaluate if the larger RCTs tended to be conducted with greater methodological rigour, or conducted in circumstances more typical of the use of terlipressin in clinical practice. Had we found this scenario, we planned to report the results of meta‐analyses restricted to the larger, more rigorous studies. However, this scenario did not occur.
Based on the expected clinical heterogeneity, we expected that a number of analyses would display statistical heterogeneity (I2 > 0%). For random‐effects models, precision will decrease with increasing heterogeneity and confidence intervals will widen correspondingly. We therefore expected that the random‐effects model would give the most conservative (and a more correct) estimate of the intervention effect. Accordingly, we have reported the results of our analyses based on random‐effects meta‐analyses.
Trial Sequential Analysis
We performed Trial Sequential Analysis to control the risks of type 1 and type 2 errors and to evaluate futility in the assessment of our primary outcomes (TSA 2011; Gluud 2017). We defined the required information size (also known as the diversity‐adjusted required information size) as the number of participants needed to detect or reject an intervention effect based on the relative risk reduction (RRR) and control group risk (CGR). Firm evidence was established if the Z‐curve crossed the monitoring boundary (also known as the trial sequential monitoring boundary) before reaching the required information size. Based on previous evidence (Krag 2008), we performed the analyses with alpha set to 3%, power to 90%, and the RRR, CGR, and heterogeneity correction to 25%, 61.5%, and 30% for mortality; 25%, 87.5%, and 70% for hepatorenal syndrome; and 25%, 15%, and 20% for serious cardiovascular adverse events. We repeated the analyses with the RRR reduced to 20% for mortality, hepatorenal syndrome, and serious cardiovascular adverse events. In the analyses of serious cardiovascular events, we also reduced the CGR to 5%.
Subgroup analysis and investigation of heterogeneity
We conducted subgroup analyses to investigate heterogeneity associated with the type of hepatorenal syndrome and use of albumin.
Sensitivity analysis
We did not evaluate the influence of bias because only one RCT was at low risk of bias for mortality and no randomised clinical trials were at low risk of bias for the remaining outcomes.
Summary of findings tables
We used GRADEpro to generate a 'Summary of findings' table with information about outcomes, risk of bias, and the results of the meta‐analyses (GRADEpro). We used the GRADE system to evaluate the quality of the evidence for outcomes reported in the review considering the within‐study risk of bias (methodological quality), indirectness of evidence, heterogeneity, imprecision of effect estimate, and risk of publication bias.
Results
Description of studies
We included nine randomised clinical trials in the quantitative and qualitative analyses (see Characteristics of included studies). We also identified one ongoing trial (NCT01143246).
Results of the search
The electronic searches revealed 619 potentially eligible references and the manual searches three additional references (Figure 1). After scanning the titles and abstracts, we retrieved and listed 25 records. We had to exclude 10 of these that referred to randomised clinical trials on participants with hepatorenal syndrome because they did not evaluate the interventions assessed in the present review (Chelarescu 2003; Pomier 2003; Alessandria 2007; Angeli 2008; Sharma 2008; Silawat 2011; Cavallin 2012; Indrabi 2013; Wan 2014; Cavallin 2015; Nguyen‐Tat 2015). The remaining references referred to nine RCTs that fulfilled our inclusion criteria (Hadengue 1998; Yang 2001; Solanki 2003; Martín‐Llahí 2008; Neri 2008; Pulvirenti 2008; Sanyal 2008; Boyer 2016). One trial used a cross‐over design (Hadengue 1998), and the remaining a parallel‐group design (Hadengue 1998; Solanki 2003; Martín‐Llahí 2008; Neri 2008; Pulvirenti 2008; Sanyal 2008; Zafar 2012; Boyer 2016).

Study flow diagram.
Included studies
Trial characteristics
One RCT was published in abstract form (Zafar 2012) and the remaining RCTs as full‐paper articles (Characteristics of included studies). The language of trial publications was Chinese (Yang 2001), Italian (Pulvirenti 2008), or English (Hadengue 1998; Solanki 2003; Martín‐Llahí 2008; Neri 2008; Sanyal 2008; Zafar 2012; Boyer 2016). The trials were conducted in the United States, Italy, Spain, Canada, India, China, Germany, and Russia. The trial investigators performed the trials in specialised units in an intensive or semi‐intensive setting. Three trials were multicenter trials (Neri 2008; Sanyal 2008; Boyer 2016), and the remaining trials were single‐centre trials (Hadengue 1998; Yang 2001; Solanki 2003; Martín‐Llahí 2008; Pulvirenti 2008; Zafar 2012).
The duration of follow‐up was six months in two trials (Pulvirenti 2008; Sanyal 2008), three months in one RCT (Boyer 2016), and end of treatment in the remaining trials (Hadengue 1998; Yang 2001; Solanki 2003; Martín‐Llahí 2008; Neri 2008; Zafar 2012).
Participant characteristics
The total number of participants was 534 participants. Included participants had cirrhosis, ascites, and hepatorenal syndrome with serum creatinine > 133 µmol/L (1.5 mg/dL) after diuretic withdrawal and volume expansion. None of the participants had evidence of shock, parenchymal renal disease, treatment with nephrotoxic drugs, or other potential causes of kidney disease. In total, 473 participants had type 1 hepatorenal syndrome. One RCT included 11 participants with type 2 hepatorenal syndrome (Martín‐Llahí 2008). One RCT with 50 participants did not describe if participants had type 1 or type 2 hepatorenal syndrome (Zafar 2012). The mean age in the terlipressin and control groups ranged from 51 to 59 years and 52 to 60 years. The proportion of men ranged from 40% to 71%, and the proportion with alcoholic liver disease from 13% to 72%.
Intervention characteristics
The median initial dose of terlipressin was 1 mg four times daily. The RCTs used a fixed dose of terlipressin (Hadengue 1998; Yang 2001; Solanki 2003; Pulvirenti 2008), or increased the dose after three days in non‐responders to a maximum of 2 mg four to six times daily (Martín‐Llahí 2008; Neri 2008; Sanyal 2008; Zafar 2012; Boyer 2016). One trial used continuous administration of terlipressin for the first day before switching to bolus dosing (Pulvirenti 2008). The duration of terlipressin administration ranged from two days, in Hadengue 1998, to 19 days, in Neri 2008, with a median treatment duration of 15 days. Two trials did not use albumin (Hadengue 1998; Yang 2001). All participants in the experimental and control groups of the remaining trials received comparable albumin (Solanki 2003; Martín‐Llahí 2008; Neri 2008; Pulvirenti 2008; Sanyal 2008; Zafar 2012; Boyer 2016).
Excluded studies
The excluded RCTs compared terlipressin and albumin versus other vasoactive drugs for hepatorenal syndrome (see Characteristics of excluded studies).
Risk of bias in included studies
We identified several sources of bias (Figure 2). For the outcome mortality, we classified one trial as at 'low risk of bias' Martín‐Llahí 2008, and the remaining trials as at 'high risk of bias' (Hadengue 1998; Yang 2001; Solanki 2003; Neri 2008; Pulvirenti 2008; Sanyal 2008; Zafar 2012; Boyer 2016). For non‐mortality outcomes, we classified all RCTs as at 'high risk of bias'. No single study lacked bias across all assessed domains, including randomisation/sequence allocation, blinding, and for‐profit funding sources. We deemed Martín‐Llahí 2008 as at 'low risk of bias' for mortality because its sources of bias were only around blinding, which was less likely to have an influence on a purely objective outcome like mortality.

Methodological quality summary: review authors' judgments about each methodological quality item for each included study.
Figure 3 presents review authors' judgements about each risk of bias item presented as percentages across all included studies.

Risk of bias graph: review authors' judgements about each risk of bias item presented as percentages across all included studies.
Allocation
Three RCTs did not describe the allocation sequence generation (Hadengue 1998; Yang 2001; Zafar 2012), and two RCTs did not describe the allocation concealment (Yang 2001; Zafar 2012). Accordingly, we classified six RCTs as 'low risk' of selection bias (Solanki 2003; Martín‐Llahí 2008; Neri 2008; Pulvirenti 2008; Sanyal 2008; Boyer 2016).
Blinding
We considered tree RCTs that were double‐blind as as 'low risk' of performance and detection bias (Hadengue 1998; Sanyal 2008; Boyer 2016). We assessed the remaining RCTsas 'unclear', Solanki 2003, or 'high risk' of performance and detection bias (Yang 2001; Martín‐Llahí 2008; Neri 2008; Pulvirenti 2008; Zafar 2012).
Incomplete outcome data
Six RCTs had no missing outcome data and included all participants in the analyses (Solanki 2003; Martín‐Llahí 2008; Neri 2008; Pulvirenti 2008; Sanyal 2008; Boyer 2016). We classified these RCTs as low risk of attrition bias and the remaining three RCTs as 'unclear risk', Yang 2001, Zafar 2012, or 'high risk' of attrition bias (Hadengue 1998).
Selective reporting
All RCTs reported clinically relevant outcomes (Hadengue 1998; Yang 2001; Solanki 2003; Martín‐Llahí 2008; Neri 2008; Pulvirenti 2008; Sanyal 2008; Zafar 2012; Boyer 2016). We identified no discrepancies between registered protocols (for those available) and trial publications.
For‐profit funding
One RCT did not receive external funding (Martín‐Llahí 2008). Three RCTs received funding from a pharmaceutical company (Hadengue 1998; Sanyal 2008; Boyer 2016). The remaining RCTs did not report funding (Yang 2001; Solanki 2003; Neri 2008; Pulvirenti 2008; Zafar 2012).
Other potential sources of bias
One study was stopped early due to low event rates (Martín‐Llahí 2008).
Effects of interventions
Primary outcomes
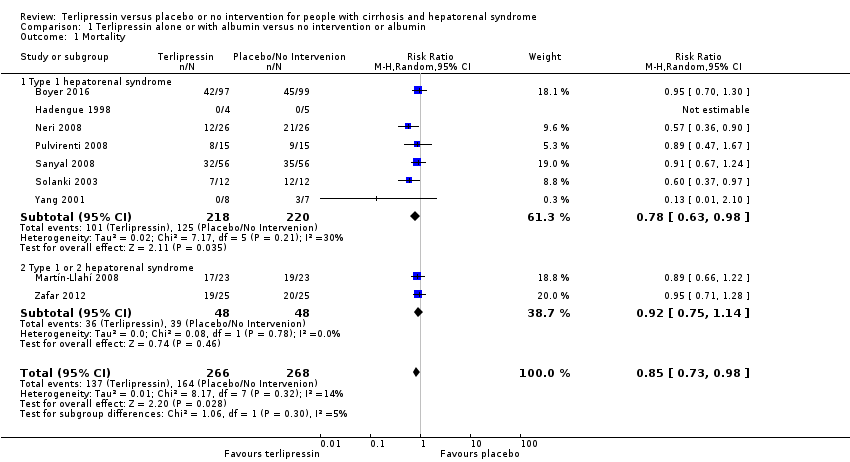
We were able to gather mortality data from all RCTs (Analysis 1.1). Terlipressin was associated with reduced mortality compared with placebo/no intervention when including all RCTs (risk ratio (RR) 0.85, 95% confidence interval (CI) 0.73 to 0.98; 534 participants; 9 RCTs; I2 = 14%; number needed to treat for an additional beneficial outcome (NNTB) to prevent one death was 10; low‐quality evidence). In Trial Sequential Analysis including all RCTs (Figure 4), the cumulative Z‐curve did not cross the monitoring boundary for benefit. We planned to conduct worst‐case scenario analyses. However, as six of the included RCTs did not have missing outcome data (Solanki 2003; Martín‐Llahí 2008; Neri 2008; Pulvirenti 2008; Sanyal 2008; Boyer 2016), and we were unable to extract the number of participants with missing outcomes from the remaining three RCTs (Hadengue 1998; Yang 2001; Zafar 2012), we were therefore unable to conduct the analysis. Subgroup analyses found an effect of terlipressin in the RCTs evaluating type 1 hepatorenal syndrome (RR 0.78, 95% CI 0.63 to 0.98; 438 participants; 7 RCT; I2 = 30%; Analysis 1.1). We were unable to gather separate outcome data on participants with type 1 or type 2 hepatorenal syndrome from two RCTs (RR 0.92, 95% CI 0.75 to 1.14; 96 participants; I2 = 0%). An additional subgroup analysis found no beneficial or harmful effect of the terlipressin and albumin (RR 0.82, 95% CI 0.67 to 1.01; 510 participants; I2 = 22%; Analysis 1.2).

Trial Sequential Analysis of eight randomised clinical trials (525 participants) evaluating terlipressin versus placebo or no intervention for people with hepatorenal syndrome on mortality. Data from Hadengue 1998 is not included due to lack of events. The analysis is made with power 90%, alpha 3%, a relative risk reduction (RRR) of 25%, a control group risk (CGR) of mortality of 61.5%, and a model variance ‐based heterogeneity correction of 30%. The risk ratio is 0.85 (95% confidence interval 0.70 to 1.02). The cumulative Z‐curve (blue line) does not cross the diversity‐adjusted trial monitoring boundary for benefit.
Two RCTs did not report the number of participants without reversal of hepatorenal syndrome (Hadengue 1998; Yang 2001). Analysis of the remaining seven RCTs showed a beneficial effect of terlipressin on this outcome measure (RR 0.63, 95% CI 0.48 to 0.82; 510 participants; I2 = 75%; low‐quality evidence; Analysis 1.3). In Trial Sequential Analysis including these seven RCTs (Figure 5), the cumulative Z score crossed the monitoring boundary for benefit.The NNTB to reverse one case of hepatorenal syndrome was 4. All RCTs included in this analysis evaluated terlipressin and albumin. In Trial Sequential Analysis including all RCTs regardless of bias control (Figure 6), the cumulative Z‐curve crossed the monitoring boundary for benefit. Subgroup analyses showed a beneficial effect of terlipressin on type 1 hepatorenal syndrome based on six RCTs (RR 0.64, 95% CI 0.47 to 0.87; 449 participants; I2 = 80%), but not in participants with type 2 hepatorenal syndrome (RR 0.39, 95% CI 0.14 to 1.08; 11 participants; 1 RCT) or the trial including participants with type 1 or type 2 hepatorenal syndrome (RR 0.65, 95% CI 0.46 to 0.92; 50 participants).

Trial Sequential Analysis of seven randomised clinical trials (510 participants) evaluating terlipressin versus placebo/no intervention for people with hepatorenal syndrome on lack of reversal of hepatorenal syndrome. The analysis is made with power 90%, alpha 3%, a relative risk reduction (RRR) of 25%, a control group risk (CGR) of lack of reversal of hepatorenal syndrome of 88%, and a heterogeneity correction of 70%. The risk ratio is 0.64 (95% confidence interval 0.46 to 0.89). The cumulative Z‐curve (blue line) crosses the diversity‐adjusted trial monitoring boundary for benefit during the fourth trial.

Trial Sequential Analysis of four randomised clinical trials (234 participants) evaluating terlipressin versus placebo or no intervention for people with hepatorenal syndrome on cardiovascular adverse events. The analysis is made with power 90%, alpha 3%, a relative risk reduction (RRR) of 25%, a control group risk (CGR) of cardiovascular adverse events of 15%, and a heterogeneity correction of 20%. The risk ratio is 7.26 (95% confidence interval 1.70 to 31.05). The diversity‐adjusted trial monitoring boundary for harm is not included in the figure due to insufficient information. The estimated required information size is 4831 participants. Accordingly, with an accrued number of participants of 234, only 4.8% of the required number of participants has been achieved.
Overall, terlipressin did not influence the risk of serious adverse events when analysed as a composite outcome (RR 0.91, 95% CI 0.68 to 1.21; participants = 534; 9 RCTs; I2 = 71%; Analysis 1.4). The number needed to treat for an additional harmful outcome to cause one serious adverse event was 24.5. A Trial Sequential Analysis also found a detrimental effect of terlipressin on this outcome (Figure 6). As expected, the most common serious adverse events were cardiovascular (RR 7.26, 95% CI 1.70 to 31.05; Analysis 1.5). Other serious adverse events included circulatory overload, gastrointestinal bleeding, hepatic encephalopathy, respiratory distress/acidosis, and bacterial infections.
We repeated the Trial Sequential Analyses with power increased to 90% and the relative risk reduction reduced to 10% for mortality and 20% for hepatorenal syndrome and serious cardiovascular adverse events. In the analyses of serious cardiovascular events, we also reduced the control group risk to 15%. All analyses found insufficient evidence to support or refute beneficial or harmful effects of terlipressin versus placebo/no intervention.
Secondary outcomes
None of the included trials assessed health‐related quality of life. Non‐serious adverse events were similar when comparing terlipressin with placebo or no intervention (RR 1.25, 95% CI 0.58 to 2.68; 406 participants; 5 RCTs; I2 = 17%; Analysis 1.6). The most frequent adverse events were gastrointestinal, including abdominal pain and diarrhoea.
Quality of the evidence
We downgraded the quality of the evidence for all outcomes due to risk of bias, clinical heterogeneity, and imprecision according to the Trial Sequential Analyses (summary of findings Table for the main comparison).
Discussion
Summary of main results
This review found that terlipressin may reduce mortality and have a beneficial effect on renal function in type 1 hepatorenal syndrome, but an increased risk of serious cardiovascular adverse events was also noted. Other studies also show that terlipressin may be associated with severe adverse effects (Shawcross 2004; Krag 2008), therefore the intervention should be closely monitored. In addition, only one RCT had a low risk of bias in the overall assessment and most of the included RCTs only followed participants to the end of treatment. Accordingly, the quality of the evidence was low and additional RCTs may be needed.
The evidence on the use of terlipressin alone and intervention benefits in type 2 hepatorenal syndrome was scarce. Only two of the included trials assessed terlipressin alone (Hadengue 1998; Yang 2001); the trials were small and the findings were inconclusive. Likewise, only two RCTs on terlipressin included participants with type 2 hepatorenal syndrome (Martín‐Llahí 2008; Zafar 2012), and the number of participants with type 2 hepatorenal syndrome was relatively small. Accordingly, we identified no clear intervention effects for this patient group.
Overall completeness and applicability of evidence
We found little evidence of clinical intertrial heterogeneity. The mean control group Child‐Pugh scores were remarkably similar (11 in three trials) (Martín‐Llahí 2008; Neri 2008; Sanyal 2008). Likewise, the included trials used similar criteria to diagnose hepatorenal syndrome, based on previous recommendations (Arroyo 1996). Diagnostic criteria included presence of cirrhosis, ascites, elevated serum creatinine after at least 48 hours of diuretic withdrawal and volume expansion combined with absence of shock, treatment with nephrotoxic drugs, and parenchymal renal disease (Salerno 2007). Updated criteria in 2015 now use a lower threshold of increased creatinine to diagnose hepatorenal syndrome (Angeli 2015). Less emphasis is placed on the labels of type 1 hepatorenal syndrome (defined as serum creatinine increasing to 226 µmol/L (2.5 mg/dL) within two weeks) and type 2 hepatorenal syndrome (defined as a moderate to slowly progressive renal failure with serum creatinine between 133 and 226 µmol/L (1.5 to 2.5 mg/dL)). Although the included trials used previously established criteria, the evidence is likely to be applicable today. However, it may be argued that there is still room for trials on terlipressin using the current diagnostic criteria, as the current criteria are more sensitive to detection of less severe acute kidney injury. Future trials would likely benefit from adoption of a standardised treatment algorithm of terlipressin dosing and sample‐sized calculations based on mortality rates, rather than rates of reversal of hepatorenal syndrome. Notably, dosing of intravenous terlipressin varied widely among studies, ranging from 1 mg twice daily, in Yang 2001, to up to 2 mg six times per day for non‐responders in Boyer 2016, thus making direct comparisons between trials more challenging.
The duration of the effect of terlipressin on mortality should be considered when deciding whether or not to treat a patient with hepatorenal syndrome (Gluud 2010). Some participants may die in spite of a clear improvement in renal function (Martín‐Llahí 2008; Sanyal 2008). The duration of treatment varied among the included trials, ranging from two days, in Hadengue 1998, to 19 days, in Neri 2008, with a median duration of 15 days. This may affect the intervention effect estimates. After an initial complete normalisation of renal function, hepatorenal syndrome may reappear. We attempted to perform a post hoc analysis to determine the effect of treatment on recurrence of hepatorenal syndrome but were unable to extract the necessary data.
Quality of the evidence
The present review identified a number of methodological concerns, including lack of sample size calculations, unclear randomisation, and lack of blinding. We downgraded evidence due to high risk of bias within individual trials, heterogeneity across trials, and imprecision (wide confidence intervals) of outcomes. As a result, the evidence for each of the primary and secondary analyses received a low quality rating. One of the included trials reporting sample size calculations was terminated prematurely due to unexpectedly low event rates (Martín‐Llahí 2008). The trial assessed terlipressin plus albumin versus albumin and was terminated after an interim analysis suggested that 2000 participants would be required to achieve sufficient statistical power. Whether the interim results reflect a true (low) intervention effect, a random error, or the inclusion criteria is difficult to assess. One possible explanation could be that a number of the included participants had type 2 hepatorenal syndrome; overall, there is little evidence on this patient group.
Potential biases in the review process
One of the main limitations of the present review concerns the relatively low overall sample size. Identification of participants who clearly fulfil the diagnostic criteria for hepatorenal syndrome may be difficult, as is the recruitment of critically ill people in clinical trials. Accordingly, the largest trials were multicentred and multinational (Sanyal 2008). This involvement of several clinical sites in more than one geographical region increases the clinical heterogeneity. On the other hand, the heterogeneity also increases the external validity, making it possible to extrapolate the results to larger patient populations in similar specialised centres. The heterogeneity increases the need for additional subgroup and sensitivity analyses. Analysis of individual patient data would have increased the possibilities of performing such analyses. Unfortunately, the available data did not allow detailed analyses of potential sources of heterogeneity. In addition, we have reversed the definition of an event in Analysis 1.3 compared to prior versions of this review, which resulted in a high event rate, potentially introducing bias through the use of risk ratios as our effect measure. We felt the analysis of 'reversal of hepatorenal syndrome' was easier to interpret clinically than 'non‐reversal'. This also obviated the need to perform a separate analysis for 'improvement in renal function'.
We did not search specifically for harms reported in quasi‐randomised and observational studies, which is a weakness of this review that may bias our assessments of the balance between benefits and harms.
We did not search databases of regulatory authorities, and so may have overlooked unpublished trials. This could also have hampered our assessments of the balance between benefits and harms.
Agreements and disagreements with other studies or reviews
Three of the included trials found that baseline serum creatinine was an independent predictor of survival (Martín‐Llahí 2008; Neri 2008; Sanyal 2008). In our analyses, the baseline creatinine in the control groups of the trials on terlipressin plus albumin ranged from 194 to 362 µmol/L (2.2 to 4.1 mg/dL). All trials found similar baseline values for the treatment and control groups. In agreement with previous findings, our analyses suggest that the treatment effect was the largest in the trial with the lowest baseline serum creatinine (Solanki 2003). This may suggest that treatment should be administered early and that a protracted deterioration in renal function impedes recovery. Inclusion of non‐randomised, observational studies would have increased our ability to detect rare adverse events. However, we found no observational studies that reported adverse events to include in these analyses.
A number of meta‐analyses have assessed the effect of terlipressin for hepatorenal syndrome (Fabrizi 2009; Dobre 2010; Sagi 2010). The results concerning mortality are equivocal. One meta‐analysis found that terlipressin increases survival among participants with type 1 hepatorenal syndrome (Sagi 2010). The two remaining meta‐analyses found no clear effect of terlipressin on survival, although only one performed a meta‐analysis addressing this question (Fabrizi 2009). In agreement with our findings, all reviews found that terlipressin seems to improve renal function but also increases the risk of cardiovascular and ischaemic adverse events. The differences between the conclusions in the different reviews are mainly related to the inclusion criteria. For example, one review only included placebo‐controlled trials (Fabrizi 2009). This decision is not clearly supported by previous evidence on the importance of bias control in RCTs (Gluud 2006; Wood 2008). Although lack of blinding may affect the risk of bias, there is no clear or consistent evidence to support the exclusion of open trials from meta‐analyses since the effect of blinding is inconsistent across trials. The extent, as well as the effect, of bias associated with lack of blinding is unpredictable and does not support the a priori exclusion of trials based on this component alone.

Study flow diagram.

Methodological quality summary: review authors' judgments about each methodological quality item for each included study.

Risk of bias graph: review authors' judgements about each risk of bias item presented as percentages across all included studies.

Trial Sequential Analysis of eight randomised clinical trials (525 participants) evaluating terlipressin versus placebo or no intervention for people with hepatorenal syndrome on mortality. Data from Hadengue 1998 is not included due to lack of events. The analysis is made with power 90%, alpha 3%, a relative risk reduction (RRR) of 25%, a control group risk (CGR) of mortality of 61.5%, and a model variance ‐based heterogeneity correction of 30%. The risk ratio is 0.85 (95% confidence interval 0.70 to 1.02). The cumulative Z‐curve (blue line) does not cross the diversity‐adjusted trial monitoring boundary for benefit.

Trial Sequential Analysis of seven randomised clinical trials (510 participants) evaluating terlipressin versus placebo/no intervention for people with hepatorenal syndrome on lack of reversal of hepatorenal syndrome. The analysis is made with power 90%, alpha 3%, a relative risk reduction (RRR) of 25%, a control group risk (CGR) of lack of reversal of hepatorenal syndrome of 88%, and a heterogeneity correction of 70%. The risk ratio is 0.64 (95% confidence interval 0.46 to 0.89). The cumulative Z‐curve (blue line) crosses the diversity‐adjusted trial monitoring boundary for benefit during the fourth trial.

Trial Sequential Analysis of four randomised clinical trials (234 participants) evaluating terlipressin versus placebo or no intervention for people with hepatorenal syndrome on cardiovascular adverse events. The analysis is made with power 90%, alpha 3%, a relative risk reduction (RRR) of 25%, a control group risk (CGR) of cardiovascular adverse events of 15%, and a heterogeneity correction of 20%. The risk ratio is 7.26 (95% confidence interval 1.70 to 31.05). The diversity‐adjusted trial monitoring boundary for harm is not included in the figure due to insufficient information. The estimated required information size is 4831 participants. Accordingly, with an accrued number of participants of 234, only 4.8% of the required number of participants has been achieved.
Comparison 1 Terlipressin alone or with albumin versus no intervention or albumin, Outcome 1 Mortality.

Comparison 1 Terlipressin alone or with albumin versus no intervention or albumin, Outcome 2 Mortality in randomised clinical trials evaluating terlipressin and albumin.

Comparison 1 Terlipressin alone or with albumin versus no intervention or albumin, Outcome 3 Hepatorenal syndrome.

Comparison 1 Terlipressin alone or with albumin versus no intervention or albumin, Outcome 4 Serious adverse events, total number.

Comparison 1 Terlipressin alone or with albumin versus no intervention or albumin, Outcome 5 Serious adverse events, types.

Comparison 1 Terlipressin alone or with albumin versus no intervention or albumin, Outcome 6 Non‐serious adverse events.
| Terlipressin versus placebo or no intervention for hepatorenal syndrome. Administration of albumin allowed if administered to both the intervention and comparison group | ||||||
| Patient or population: people with hepatorenal syndrome Comparison: placebo or no intervention or albumin | ||||||
| Outcomes | Anticipated absolute effects* (95% CI) | Relative effect | № of participants | Quality of the evidence | Comments | |
| Risk with placebo or no intervention | Risk with terlipressin | |||||
| Mortality | Study population | RR 0.85 (0.73 to 0.98) | 534 | ⊕⊕⊝⊝ | Downgraded because of i) clinical heterogeneity and ii) the results of the Trial Sequential Analysis | |
| 688 per 1000 | 536 per 1000 | |||||
| Moderate | ||||||
| 625 per 1000 | 488 per 1000 | |||||
| Hepatorenal syndrome | Study population | RR 0.63 (0.48 to 0.82) | 510 | ⊕⊕⊝⊝ | Downgraded because of i) clinical heterogeneity and ii) all trials are judged as 'high risk of bias'. | |
| 879 per 1000 | 510 per 1000 | |||||
| Moderate | ||||||
| 875 per 1000 | 507 per 1000 | |||||
| Serious adverse events | Study population | RR 0.91 (0.68 to 1.21) | 534 (9 RCTs) | ⊕⊕⊝⊝ | Downgraded because of i) clinical heterogeneity and ii) all RCTs are judged as high risk of bias. | |
| 85 per 1000 | 212 per 1000 | |||||
| Serious cardiovascular adverse events | Study population | RR 7.26 (1.70 to 31.05) | 234 | ⊕⊕⊝⊝ | Downgraded because of i) clinical heterogeneity and ii) all RCTs are judged as high risk of bias | |
| 16 per 1000 | 111 per 1000 | |||||
| Abdominal pain | Study population | RR 1.54 (0.97 to 2.43) | 294 (4 RCTs) | ⊕⊕⊝⊝ | Downgraded because of i) clinical heterogeneity and ii) all RCTs are judged as high risk of bias | |
| 149 per 1000 | 229 per 1000 | |||||
| Diarrhoea | Study population | RR 5.76 (2.19 to 15.15) | 240 (2 RCTs) | ⊕⊕⊝⊝ | Downgraded because of i) clinical heterogeneity and ii) all RCTs are judged as high risk of bias | |
| 33 per 1000 | 190 per 1000 | |||||
| *The risk in the intervention group (and its 95% confidence interval) is based on the assumed risk in the comparison group and the relative effect of the intervention (and its 95% CI). | ||||||
| GRADE Working Group grades of evidence | ||||||
| 1Not confirmed in analyses of randomised clinical trials (RCTs) with a low risk of bias. | ||||||
| Outcome or subgroup title | No. of studies | No. of participants | Statistical method | Effect size |
| 1 Mortality Show forest plot | 9 | 534 | Risk Ratio (M‐H, Random, 95% CI) | 0.85 [0.73, 0.98] |
| 1.1 Type 1 hepatorenal syndrome | 7 | 438 | Risk Ratio (M‐H, Random, 95% CI) | 0.78 [0.63, 0.98] |
| 1.2 Type 1 or 2 hepatorenal syndrome | 2 | 96 | Risk Ratio (M‐H, Random, 95% CI) | 0.92 [0.75, 1.14] |
| 2 Mortality in randomised clinical trials evaluating terlipressin and albumin Show forest plot | 7 | 510 | Risk Ratio (M‐H, Random, 95% CI) | 0.82 [0.67, 1.01] |
| 3 Hepatorenal syndrome Show forest plot | 7 | 510 | Risk Ratio (M‐H, Random, 95% CI) | 0.63 [0.48, 0.82] |
| 3.1 Type 1 hepatorenal syndrome | 6 | 449 | Risk Ratio (M‐H, Random, 95% CI) | 0.64 [0.47, 0.87] |
| 3.2 Type 2 hepatorenal syndrome | 1 | 11 | Risk Ratio (M‐H, Random, 95% CI) | 0.39 [0.14, 1.08] |
| 3.3 Type 1 or 2 hepatorenal syndrome | 1 | 50 | Risk Ratio (M‐H, Random, 95% CI) | 0.65 [0.46, 0.92] |
| 4 Serious adverse events, total number Show forest plot | 9 | 534 | Risk Ratio (M‐H, Random, 95% CI) | 0.91 [0.68, 1.21] |
| 5 Serious adverse events, types Show forest plot | 5 | Risk Ratio (M‐H, Random, 95% CI) | Subtotals only | |
| 5.1 Cardovascular adverse events | 4 | 234 | Risk Ratio (M‐H, Random, 95% CI) | 7.26 [1.70, 31.05] |
| 5.2 Circulatory overload | 1 | 46 | Risk Ratio (M‐H, Random, 95% CI) | 1.75 [0.59, 5.17] |
| 5.3 Gastrointestinal bleeding | 1 | 46 | Risk Ratio (M‐H, Random, 95% CI) | 0.67 [0.22, 2.05] |
| 5.4 Hepatic encephalopathy | 1 | 46 | Risk Ratio (M‐H, Random, 95% CI) | 1.0 [0.68, 1.47] |
| 5.5 Respiratory distress/acidosis | 2 | 300 | Risk Ratio (M‐H, Random, 95% CI) | 1.97 [0.84, 4.60] |
| 5.6 Bacterial inflections | 1 | 46 | Risk Ratio (M‐H, Random, 95% CI) | 0.75 [0.39, 1.43] |
| 6 Non‐serious adverse events Show forest plot | 5 | Risk Ratio (M‐H, Random, 95% CI) | Subtotals only | |
| 6.1 Total number | 5 | 406 | Risk Ratio (M‐H, Random, 95% CI) | 1.25 [0.58, 2.68] |
| 6.2 Abdominal pain | 4 | 294 | Risk Ratio (M‐H, Random, 95% CI) | 1.54 [0.97, 2.43] |
| 6.3 Chest pain | 1 | 52 | Risk Ratio (M‐H, Random, 95% CI) | 5.00 [0.25, 99.34] |
| 6.4 Livedo reticularis | 1 | 112 | Risk Ratio (M‐H, Random, 95% CI) | 3.00 [0.12, 72.10] |
| 6.5 Diarrhoea | 2 | 240 | Risk Ratio (M‐H, Random, 95% CI) | 5.76 [2.19, 15.15] |