統合失調症の再発の初期兆候を認識するためのトレーニング
Abstract
Background
Schizophrenia has a lifetime prevalence of less than one per cent. Studies have indicated that early symptoms that are idiosyncratic to the person with schizophrenia (early warning signs) often precede acute psychotic relapse. Early warning signs interventions propose that learning to detect and manage early warning signs of impending relapse might prevent or delay acute psychotic relapse.
Objectives
To compare the effectiveness of early warning signs interventions plus treatment as usual involving and not involving a psychological therapy on time to relapse, hospitalisation, functioning, negative and positive symptomatology.
Search methods
Search databases included the Cochrane Schizophrenia Group Trials Register (July 2007 and May 2012) which is based on regular searches of BIOSIS, CENTRAL, CINAHL, EMBASE, MEDLINE and PsycINFO. References of all identified studies were reviewed for inclusion. We inspected the UK National Research Registe and contacted relevant pharmaceutical companies and authors of trials for additional information.
Selection criteria
We included all randomised clinical trials (RCTs) comparing early warning signs interventions plus treatment as usual to treatment as usual for people with schizophrenia or other non‐affective psychosis
Data collection and analysis
We assessed included studies for quality and extracted data. If more than 50% of participants were lost to follow‐up, the study was excluded. For binary outcomes, we calculated standard estimates of risk ratio (RR) and the corresponding 95% confidence intervals (CI), for continuous outcomes, we calculated mean differences (MD) with standard errors estimated, and for time to event outcomes we calculated Cox proportional hazards ratios (HRs) and associated 95 % CI. We assessed risk of bias for included studies and assessed overall study quality using the GRADE approach.
Main results
Thirty‐two RCTs and two cluster‐RCTs that randomised 3554 people satisfied criteria for inclusion. Only one study examined the effects of early warning signs interventions without additional psychological interventions, and many of the outcomes for this review were not reported or poorly‐reported. Significantly fewer people relapsed with early warning signs interventions than with usual care (23% versus 43%; RR 0.53, 95% CI 0.36 to 0.79; 15 RCTs, 1502 participants; very low quality evidence). Time to relapse did not significantly differ between intervention groups (6 RCTs, 550 participants; very low quality evidence). Risk of re‐hospitalisation was significantly lower with early warning signs interventions compared to usual care (19% versus 39%; RR 0.48, 95% CI 0.35 to 0.66; 15 RCTS, 1457 participants; very low quality evidence). Time to re‐hospitalisation did not significantly differ between intervention groups (6 RCTs; 1149 participants; very low quality evidence). Participants' satisfaction with care and economic costs were inconclusive because of a lack of evidence.
Authors' conclusions
This review indicates that early warning signs interventions may have a positive effect on the proportions of people re‐hospitalised and on rates of relapse, but not on time to recurrence. However, the overall quality of the evidence was very low, indicating that we do not know if early warning signs interventions will have similar effects outside trials and that it is very likely that further research will alter these estimates. Moreover, the early warning signs interventions were used along side other psychological interventions, and we do not know if they would be effective on their own. They may be cost‐effective due to reduced hospitalisation and relapse rates, but before mental health services consider routinely providing psychological interventions involving the early recognition and prompt management of early warning signs to adults with schizophrenia, further research is required to provide evidence of high or moderate quality regarding the efficacy of early warning signs interventions added to usual care without additional psychological interventions, or to clarify the kinds of additional psychological interventions that might aid its efficacy. Future RCTs should be adequately‐powered, and designed to minimise the risk of bias and be transparently reported. They should also systematically evaluate resource costs and resource use, alongside efficacy outcomes and other outcomes that are important to people with serious mental illness and their carers.
一般語訳
統合失調症の再発の初期兆候を認識するためのトレーニング
統合失調症を持つ人々の多くは、体調が悪い期間に続き、比較的安定した期間を経験する(ただし、幻聴や幻視などの症状はしばしば目立たない程度に残る)。これは、統合失調症を持つ人々の多くが再び体調を崩し、病院に戻ることが必要になる可能性があることを意味する。早期警告サインに関する技法のトレーニングは、人々が次の病状悪化の早期の警告サインについて学び、発見・認識できるよう促す。研究によると、統合失調症の兆候や症状の小さな変化に気づくことで、2~10週間後の体調悪化や再発を予測できることが多い。早期警告トレーニングは再発を予防したり遅らせたりすることで、入院の可能性を減らすのに役立つかもしれない。早期警告サインを認識するためには詳しい病歴の聴き取りが必要で、時には日記を付けたり、アンケートに回答したり、予想される早期警告サインに基づいて行動計画を立てたりといった技法も加えて必要になる。トレーニングは個人で行うことも、医療従事者や家族、介護者を含むグループで行うこともできる。トレーニングを成功させるには、高い技量を持つセラピストがついた約12回のセッションが必要と考えられている。
このレビューには合計34件の研究が組み入れられた。これにより、早期警告サインのトレーニングは有益であることが分かった。トレーニングは再発率および再入院率を減らす(ただし再発までの時間には影響しない)。早期警告サインのトレーニングは主に他の心理的セラピーと共に用いられたため、好ましい効果のうちどのくらいの割合が早期警告サインのトレーニングによるものかは、完全に明らかになっていないことに注意すべきである。さらに、これらの研究から得られたエビデンスの全体的な質は、非常に低いと判断された。これは早期警告サインを用いた介入が、追加の心理的治療の有無に関わらず、臨床試験以外でも同等の有益な効果を持つかどうか分からないことを意味する。
早期警告サインのトレーニングが単独でも効果的かどうかを判断するには、さらなる研究が必要である。生活の質、ケアに対する満足度、かかった費用、介護者のケアの負担に対する影響は不明であるため、トレーニングプログラムがより広く用いられる前にこれらが明らかにされることが望ましい。現時点では、早期警告サインのトレーニングのみの実施を支持する十分なエビデンスは無い。
この平易な要約はRETHINKのサービス利用者Ben Grayによるものである。
Authors' conclusions
Summary of findings
| Early warning signs training and treatment as usual compared to treatment as usual for schizophrenia | ||||||
| Patient or population: patients with schizophrenia | ||||||
| Outcomes | Illustrative comparative risks* (95% CI) | Relative effect | No of Participants | Quality of the evidence | Comments | |
| Assumed risk | Corresponding risk | |||||
| Treatment as usual | Early warning signs training and treatment as usual | |||||
| Relapse: Rate of relapse | 432 per 1000 | 229 per 1000 | RR 0.53 | 1502 | ⊕⊝⊝⊝ | |
| Relapse: Time to relapse | See comment | See comment | HR 0.53 | 550 | ⊕⊝⊝⊝ very low2, 3, 4 | The data were added to the meta‐analysis as generic inverse variance. |
| Service use: Rate of re‐hospitalisation | 385 per 1000 | 185 per 1000 | RR 0.48 | 1457 | ⊕⊝⊝⊝ | |
| Service use: Time to re‐hospitalisation | See comment | See comment | HR 0.58 | 1149 | ⊕⊝⊝⊝ | The data were added to the meta‐analysis as generic inverse variance. |
| Satisfaction with care | See comment | See comment | Not estimable | See comment | ⊕⊝⊝⊝ | 2 RCTs (92 participants) and 1 cluster RCT (56 clusters) report on satisfaction with care.10 |
| Adverse events: Lost to follow‐up | 105 per 1000 | 101 per 1000 | RR 0.96 | 1495 | ⊕⊝⊝⊝ | |
| Economic burden (cost of care) | See comment | See comment | Not estimable | 129 | ⊕⊝⊝⊝ | Two studies report on costs of care, but data could not be pooled.15 |
| *The basis for the assumed risk (e.g. the median control group risk across studies) is provided in footnotes. The corresponding risk (and its 95% confidence interval) is based on the assumed risk in the comparison group and the relative effect of the intervention (and its 95% CI). | ||||||
| GRADE Working Group grades of evidence | ||||||
| 1Eight studies had an unclear risk of bias for sequence generation and 13 for allocation concealment. One study did not use assessors that were blinded and in seven it was unclear. Eight studies had an unclear risk of bias for attrition and two studies had received funding from industry. 2There was high heterogeneity in the pooled results. 3The 95% confidence intervals are wide and include both significant benefit and harm of the intervention. 4The data were not provided for most studies and had to be imputed. Three studies had an unclear risk of bias for random sequence generation and all studies had an unclear risk for allocation concealment. In one study the assessors were not blinded and in another the risk of bias for blinding was unclear. In three studies there was an unclear risk of bias for attrition. 5The data were not provided for most studies and had to be imputed. Two studies had an unclear risk of bias for random sequence generation and two were unclear for allocation concealment. One study did not have assessors that were blinded and in another it was unclear. Three studies had an unclear risk of attrition bias. One study was funded by industry. 6Nine studies had an unclear risk of bias for sequence generation and 12 for allocation concealment. One study did not use assessors that were blinded and in seven it was unclear. One study had a high risk of attrition bias and eight studies had an unclear risk of bias for attrition. One study had received funding from industry. 7The funnel plot indicates that there may be the equivalent number of ’negative’ trials that have not been included in this analysis. 8Two studies had an unclear risk of bias for sequence generation and three for allocation concealment. One study did not use blind assessors and one study had an unclear risk of bias for attrition. Two studies were part funded by industry. 9Only three studies reported this outcome. 10The two RCTs found no significant difference in satisfaction with care between early warning signs training and treatment as usual, although the data may be skewed for one trial. The cluster RCT did find a significant difference in favour of early warning signs training. 11Ten studies had an unclear risk of bias for sequence generation and fifteen for allocation concealment. One study did not use assessors that were blinded and in seven it was unclear. One study had a high risk of attrition bias and eight studies had an unclear risk of bias for attrition. Two studies had received funding from industry. 12One study had skewed data and the other did not report SDs. 13The two studies found very different results. 14This outcome included relatively few participants. 15Kuipers 1997 showed no significant difference between the mean cost of care for the early warning signs training group and standard care group, but the data was skewed. McDonell 2006 found that the mean costs of care were less in the early warning signs group ($1641) than the standard psychiatric group ($5199), no SDs were reported. 16 Some indication of publication bias from funnel plot. | ||||||
Background
The lifetime prevalence of schizophrenia is just less than one per cent with onset usually occurring during adolescence or early adulthood. Diagnosis is predictive of an increased risk of suicide, impaired occupational and social functioning, and a heightened risk of physical illness. Most people with schizophrenia experience a cyclical pattern of illness with periods of acute psychotic episodes followed by stable periods of full or partial remission, although these are often accompanied by the presence of residual symptoms (APA 1997).
The use of secondary prevention strategies, in which patients are encouraged to recognise signs of impending exacerbations of illness, are common in the treatment of several chronic physical illnesses such as diabetes and heart disease and may be equally beneficial to those suffering from severe mental illness (Bustillo 1995).
Both retrospective (Bechdolf 1998; Herz 1980) and prospective (Birchwood 1989; Marder 1994) observational studies indicate that relatively small changes in signs and symptoms of schizophrenia can reliably predict acute episodes of psychosis two to 10 weeks later. The symptoms (observed and reported by the patient) and signs (mostly behaviours observed and reported by carers or mental health professionals) are idiosyncratic to the patient, but consistently predict recurrence of psychosis in those who have a relapsing and remitting course of schizophrenia (Birchwood 1989; Bustillo 1995; Herz 2000; Marder 1994).
Early warning interventions are based on the hypothesis that learning to detect and manage early warning signs (EWS) of impending relapse might prevent the onset of acute episodes (Fitzgerald 2001; Lam 1997). The term prodrome has been used to delineate early warning signs, but this term will be avoided here because prodrome is now commonly used to delineate a period immediately before the first onset of psychotic symptoms in schizophrenia (Bustillo 1995).
Originally the recognition of early warning signs was combined with intermittent medication strategies. It was hoped that this would help prevent the long‐term side‐effects of medication such as tardive dyskinesia, by reducing overall exposure to neuroleptic medication (Herz 1980; Jolley 1990). However, early randomised controlled trials suggested that over a two‐year period, those randomised to early warning signs interventions and intermittent antipsychotic medication strategy experienced more acute episodes of schizophrenia than those randomised to a continuous use of maintenance antipsychotic medication only (Gaebel 1993; Jolley 1990).
More recently, however, added clinical benefit has been demonstrated in patients on maintenance antipsychotics when early warning signs interventions are combined with short‐term additional treatment such as diazepam (Carpenter 1999), additional oral antipsychotic (Marder 1994), cognitive therapy (Gumley 2003) and multifaceted psycho‐educational and family interventions (Herz 2000). If such interventions were effective in reducing recurrences they would offer significant benefits to sufferers and their caregivers. Some practice guidelines for schizophrenia (APA 1997) recommend working with patients and their families to address EWS of recurrence.
Monitoring for early warning signs in schizophrenia has often been included as a component of psychological interventions, for example, in combination with other cognitive strategies or as one aspect of family intervention. There is a need to identify which components of therapy have a positive influence on outcomes (Haddock 1998). Two narrative reviews have specifically evaluated studies in schizophrenia seeking to reduce relapse through interventions based on early warning signs (Birchwood 2001; Herz 1995) and conclusions to date have been promising. These reviews did not systematically search for studies, however, and did not attempt meta‐analysis so conclusions are open to bias. Furthermore, they did not consider the full range of possible outcomes in schizophrenia such as the individual's well being and functioning and resulting difficulties incurred by friends and relatives.
It is also possible that early warning signs interventions in schizophrenia might be associated with adverse outcomes, for example increased depression due to increased self‐focus required by symptom monitoring. For people with a diagnosis of schizophrenia, those identified as less aware of their symptoms were less likely to report being depressed (Dixon 1998). Symptom awareness has also been linked to recurrent suicidal thoughts (Amador 1996). Another effect might be increased medication due to the possible effect of increased symptom reporting without reducing relapse (Gaebel 1993).
Finally, the effectiveness of early warning signs interventions in schizophrenia might vary according to features of the intervention such as the frequency of monitoring, use of standardised checklists of early warning signs or early warning signs interventions tailored to the individual from previous relapses in that individual, participation of caregivers and health professionals in the monitoring, group‐ versus individually‐delivered early warning signs intervention, severity of illness and the presence or absence of an acute episode of schizophrenia at the time of the intervention, or the existence of co‐morbid conditions. Demographic factors such as age and gender should also be taken into account. There is evidence that patients with first episode schizophrenia can benefit from EWS interventions coupled with intermittent medication, but multi‐episode cases of schizophrenia must have maintenance medication (Gaebel 2002).
Description of the condition
Most people with schizophrenia experience a cyclical pattern of illness with periods of acute psychotic episodes followed by stable periods of full or partial remission, although these are often accompanied by the presence of residual symptoms (APA 1997).
Description of the intervention
Recognition of early warning signs requires detailed history taking, with or without additional techniques such as diary keeping, completion of questionnaires and card sorting techniques, and a plan of action based on the early warning signs. The interventions may be individually‐based or group‐based and can involve family members or carers. They can be carried out in any treatment setting.
How the intervention might work
Early warning interventions are based on the hypothesis that learning to detect and manage EWS of impending relapse might allow treatment or coping strategies to reduce symptoms or reduce the risk of harm thereby preventing or delaying relapse and/or hospitalisations (Fitzgerald 2001, Lam 1997).
Why it is important to do this review
Early warning signs interventions are carried out in routine clinical care for people with schizophrenia but their availability and delivery vary considerably from one clinical service to another even in the same locality.
Objectives
The primary objective was to compare the effectiveness of early warning signs intervention plus treatment as usual versus treatment as usual for those with schizophrenia. Treatment as usual could involve medication plus psychological therapy which did not incorporate early warning signs principles or only medication as part of its care plan.
Another objective was to compare the effectiveness of intermittent medication used on recognition of early warning signs in people not taking maintenance neuroleptic medication with treatment as usual involving maintenance neuroleptic medication.
Other areas of interest were early warning signs as the primary focus of the intervention or as part of another intervention; early warning signs intervention delivered to patient only or patient and carer or health professional; early warning signs intervention delivered to carer only versus carer and patient; early warning signs intervention delivered individually versus group intervention.
Methods
Criteria for considering studies for this review
Types of studies
All relevant randomised controlled trials were included. Where a trial was described as 'double‐blind' but it implied that the study was randomised and the demographic details of each group were similar, it was included. We excluded quasi‐randomised studies, such as those allocated by using alternate days of the week.
Types of participants
Adults over the age of 16 with a diagnosis of schizophrenia or a non‐affective, non‐organic serious or chronic mental illness based on standardised psychiatric criteria (including Research Diagnostic Criteria, DSM IV, ICD‐10), at any stage of the disorder and in any treatment setting, or carers/health professionals of people with this diagnosis.
We excluded studies where
-
the primary diagnosis was another disorder (for example, eating disorders);
-
participants were selected on the basis of a non‐psychiatric medical condition (for example, cancer, human immune deficiency syndrome);
-
samples selected for co‐morbidity, i.e. addictions and mental illness;
-
'at risk' populations who had not yet received a definite diagnosis of schizophrenia;
-
early onset samples, with no established diagnosis of schizophrenia.
Types of interventions
1. Early warning signs intervention plus treatment as usual
Interventions designed to systematically train people with a diagnosis of schizophrenia to recognise early warning signs of recurrence of episodes. The essential elements of early warning signs monitoring were defined as: i) education to increase awareness of early warning signs and identification of these early warning signs; ii) person with schizophrenia learning to self‐monitor for early warning signs (e.g. paranoia), or carers and/or health professionals learning to monitor on behalf of the person with schizophrenia; iii) early action to prevent development of recurrence (e.g. seeking early help or self‐coping methods).
Each person in the study must have received at least one hour of training specifically in recognising and managing early warning signs. Therefore, early warning signs interventions require at least one hour of face‐to‐face clinical contact. Any intervention that included early warning signs interventions either as a major focus or as one component of an intervention package were included. The interventions could have been individually‐based or group‐based, encompassed self‐help approaches, involved family members or carers, and carried out in community, primary care or secondary care settings.
2. Treatment as usual not involving a psychological therapy
3.Treatment as usual plus another psychological therapy
Studies where both groups simultaneously received the same psychological intervention involving early warning signs interventions were excluded (for example, psychological therapy versus psychological therapy in addition to medication).
Types of outcome measures
Primary outcomes
1. Relapse
1.1 Rate of relapse
1.2 Time to relapse
2. Service utilisation
2.1 Rate of re‐hospitalisation
2.2 Time to re‐hospitalisation
Secondary outcomes
1. Mental State
1.1 No clinically important change in general mental state (as defined by individual studies)
1.2 Mean endpoint general mental state score
1.3 Mean change in general mental state scores
1.4 No clinically important change in specific symptoms
1.5 Mean endpoint specific symptom score
1.6 Mean change in specific symptom scores
2. Social functioning
2.1 Average endpoint general social functioning score
2.2 Average change in general social functioning scores
2.3 No clinically important change in specific social functioning
2.4 Average endpoint specific social functioning score
2.5 Average change in specific social functioning scores
3. Quality of life
3.1 No clinically important change in quality of life
3.2 Average endpoint quality of life score
3.3 Average change in quality of life scores
3.4 No clinically important change in specific aspects of quality of life
3.5 Average endpoint specific aspects of quality of life
3.6 Average change in specific aspects of quality of life
4. Satisfaction with care
4.1 Recipient of care
4.2 Informal care givers
4.3 Professional carers
6. Adverse events
6.1 Incidence of adverse effects, general or specific
6.2 Leaving the study early
6.3 Measured acceptance of treatment
6.4 Use of antiparkinsonian treatment
6.5 Sudden and unexpected death
7. Economic burden (cost of care)
8. Knowledge
9. Burden of care
10. Medication compliance
Search methods for identification of studies
Electronic searches
1. Cochrane Schizophrenia Group Trials Register (July 2007)
The register was searched using the phrase:
[((sign* OR early sign* OR signs of earl* OR intervention* OR detect*) OR ((relaps* OR recurren*) AND (prevent* OR predict* OR reduc* OR control*))) AND (((monitor* OR help* OR evaluat* OR) and (self* OR family*)) OR symptom manag* OR manage symptom* OR aware* OR prodrom* OR re‐occur* OR reoccur*) in REFERENCE title, abstract and index fields] OR [(training* OR relapse* OR consumer* OR self* OR early*) in STUDY intervention field]
This register is compiled by systematic searches of major databases, handsearches and conference proceedings (see group module).
2. Cochrane Schizophrenia Group Trials Register (May 2012)
We ran another search in 2012. The Trials Search Co‐ordinator searched the Cochrane Schizophrenia Group’s Trials Register (3 May 2012).
[((sign* OR early sign* OR signs of earl* OR intervention* OR detect*) OR ((relaps* OR recurren*) AND (prevent* OR predict* OR reduc* OR control*))) AND (((monitor* OR help* OR evaluat* OR) and (self* OR family*)) OR symptom manag* OR manage symptom* OR aware* OR prodrom* OR re‐occur* OR reoccur*) in REFERENCE title, abstract and index fields] OR [(training* OR relapse* OR consumer* OR self* OR early*) in STUDY intervention field]
The Cochrane Schizophrenia Group’s Trials Register is compiled by systematic searches of major databases, handsearches of journals and conference proceedings (see Group Module). Incoming trials are assigned to relevant existing or new review titles.
Searching other resources
1. Reference lists
We searched all references of articles selected for inclusion for further relevant trials.
2. Personal contact
We contacted the first author of each included study for information regarding unpublished trials.
3. NHS National Research Register (NRR):
Using abstracts identified from searching the Cochrane Schizophrenia Group Register, the NRR was inspected for information regarding ongoing research trials, and we contacted the corresponding authors regarding unpublished data.
Data collection and analysis
Selection of studies
Review author IV inspected all abstracts of studies identified as above and identified potentially relevant reports. In addition, to ensure reliability, review authors MAF and RM inspected a random sample of these abstracts, comprising 30% of the total. Where disagreement occurred, it was resolved by discussion, or where there was still doubt, the full article was acquired for further inspection. The full articles of relevant reports were acquired for reassessment and carefully inspected by IV and MAF for a final decision on inclusion (see Criteria for considering studies for this review). IV and MAF were not blinded to the names of the authors, institutions or journal of publication. Where difficulties or disputes arose, we asked review author RM for help and where it was impossible to decide, these studies were added to those awaiting assessment and the authors of the papers contacted for clarification.
For the May 2012 search two members of the Enhance Review inspected full reports of trials selected by the original team of authors.
Data extraction and management
1. Extraction
Review authors IV and MF extracted data from all included studies found in the July 2007 search. To ensure reliability, RM independently extracted data from a random sample of these studies, comprising 30% of the total. Again, any disagreement was discussed, decisions documented and, if necessary, authors of studies contacted for clarification. With remaining problems RM helped clarify issues and those final decisions documented. Data presented only in graphs and figures were extracted whenever possible, but only included if two review authors independently had the same result. Where possible, we extracted data relevant to each component centre of multi‐centre studies separately.
For the May 2012 search two members of the Enhance Reviews team extracted data, using above methods, for the included studies.
2. Management
2.1 Forms
A form for data collection was created, piloted in three trials independently by two review authors, and revised after author discussion. We extracted data onto these forms.
2.2 Scale‐derived data
We included continuous data from rating scales only if: a) the psychometric properties of the measuring instrument have been described in a peer‐reviewed journal (Marshall 2000); and b) the measuring instrument was not written or modified by one of the trialists for that particular trial.
Ideally, the measuring instrument should either be i. a self‐report or ii. completed by an independent rater or relative (not the therapist). We realise that this is not often reported clearly but in the Description of studies section, we noted if this is the case or not.
2.3 Endpoint versus change data
There are advantages of both endpoint and change data. Change data can remove a component of between‐person variability from the analysis. On the other hand, calculation of change needs two assessments (baseline and endpoint) which can be difficult in unstable and difficult to measure conditions such as schizophrenia. We decided primarily to use endpoint data and only use change data if the former were not available. Endpoint and change data were combined in the analysis as we used mean differences rather than standardised mean differences throughout (Higgins 2011, chapter 9.4.5.2 ). All data in the analyses are endpoint data unless marked in a footnote as change data.
2.4 Skewed data
Continuous data on clinical and social outcomes are often not normally distributed. To avoid the pitfall of applying parametric tests to non‐parametric data, we aimed to apply the following standards to all data before inclusion:
a) standard deviations (SDs) and means are reported in the paper or obtainable from the authors;
b) when a scale starts from the finite number zero, the SD, when multiplied by two, is less than the mean (as otherwise the mean is unlikely to be an appropriate measure of the centre of the distribution, (Altman 1996);
c) if a scale starts from a positive value (such as the Positive and Negative Syndrome Scale (PANSS) (Kay 1986) which can have values from 30 to 210), the calculation described above was modified to take the scale starting point into account. In these cases skew is present if 2 SD > (S‐S min), where S is the mean score and S min is the minimum score. Endpoint scores on scales often have a finite start and end point and these rules can be applied. When continuous data are presented on a scale that includes a possibility of negative values (such as change data), it is difficult to tell whether data are skewed or not. Skewed data from studies of less than 200 participants were entered in additional tables (Table 1) rather than into an analysis. Skewed data pose less of a problem when looking at means if the sample size is large and was entered into the syntheses.
| Outcome | Study | Results |
| Mental state: average score in positive symptoms (PAS positive, high = bad) | The early warning signs group (N = 20) had a mean of 2.06 (SD 2.57) and the control group (N = 20) had a mean of 4.59 (SD 2.72). | |
| Mental state: average score in positive symptoms (PAS negative, high = bad) | The early warning signs group (N = 20) had a mean of 1.33 (SD 1.8) and the control group (N = 20) had a mean of 1.71 (SD 2.2). | |
| Social functioning: average score (REHAB scale, high = bad) | The early warning signs group (N = 14) had a mean of 18.2 (SD 13) and the control group (N = 15) had a mean of 32.5 (SD 22.7). | |
| Social functioning: average score (HoNOS scale, high = bad) | The early warning signs group (N = 25) had a mean of 9.26 (SD 4.63) and the control group (N = 24) had a mean of 7.66 (SD 4.85). | |
| Social functioning: average score (SDSS, high = bad) | The early warning signs group (N = 31) had a mean of 4.04 (SD 3.89) and the control group (N = 31) had a mean of 7.63 (SD 4.27). | |
| Social functioning: average score (SDSS, high = bad) | The early warning signs group (N = 54) had a mean of 4.8 (SD 3) and the control group (N = 50) had a mean of 9.8 (SD 3.9). | |
| Social functioning: average months of employment | The early warning signs group (N = 30) had a mean of 7.83 (SD 3) and the control group (N = 28) had a mean of 4.64 (SD 7.39). | |
| Burden of care: average score (FBIS, high = bad) | The early warning signs group (N= 24) had a mean of 18.95 (SD 15.39) and the control group (N = 22) had a mean of 9.38 (SD 8.1). | |
| Burden of care: average score (FAS, high = good) | The early warning signs group (N = 46) had a mean of 21 (SD 14.54) and the control group (N = 55) had a mean of 25.15 (SD 20). | |
| Mean number of missed doses | The early warning signs group had a mean of 0.2 missed doses (SD 0.6) and the control group had a mean of 4.7 missed doses (SD 2.2). | |
| Economic burden (cost of care) | The early warning signs training group had a mean care package cost of £1220 (SD 736) and the standard treatment group had a mean care package cost of £1403 (SD 887) after 18 months follow‐up. There was no significant difference between the costs. | |
| Economic burden (cost of care) | The mean cost of inpatient service utilisation was $5199 for the standard psychiatric care group and $1641 for the early warning signs training group at 3 years post‐randomisation. |
FAS: Family Attitude Scale
FIBS: Family Burden Interview Schedule
HoNOS: Health of the Nation Outcome Scale
PAS: Psychiatric Assessment Scale
REHAB: Rehabilitation Evaluation Hall and Baker
SD: standard deviation
SDSS: Social disability screening scale
2.5 Common measure
To facilitate comparison between trials, we converted variables that can be reported in different metrics, such as days in hospital (mean days per year, per week or per month) to a common metric (e.g. mean days per month).
2.6 Conversion of continuous to binary
Where possible, efforts were made to convert outcome measures to dichotomous data. This can be done by identifying cut‐off points on rating scales and dividing participants accordingly into 'clinically improved' or 'not clinically improved'. It is generally assumed that if there is a 50% reduction in a scale‐derived score such as the Brief Psychiatric Rating Scale (BPRS, Overall 1962) or the PANSS (Kay 1986), this can be considered as a clinically significant response (Leucht 2005a; Leucht 2005). If data based on these thresholds were not available, we used the primary cut‐off presented by the original authors.
2.7 Direction of graphs
Where possible, we entered data in such a way that the area to the left of the line of no effect indicates a favourable outcome for treatment with antipsychotic combinations.
2.8 'Summary of findings' table
We used the GRADE approach to interpret findings (Schünemann 2008) and used GRADE profiler (GRADE 2004) to import data from RevMan 5 (Review Manager 2011) to create 'Summary of findings' tables. These tables provide outcome‐specific information concerning the overall quality of evidence from each included study in the comparison, the magnitude of effect of the interventions examined, and the sum of available data on all outcomes we rate as important to patient‐care and decision making. If possible, we anticipated selecting the following main outcomes for inclusion in the 'Summary of findings' table.
-
Relapse: time to relapse
-
Relapse: rate of relapse
-
Service use: time to re‐hospitalisation
-
Service use: rate of re‐hospitalisation
-
Satisfaction with care
-
Adverse events: lost to follow‐up
-
Economic burden (cost of care)
Assessment of risk of bias in included studies
Review authors IV and MF independently assessed the risk of bias of each trial using The Cochrane Collaboration's 'Risk of bias' tool (Higgins 2011). This set of criteria is based on evidence of associations between overestimate of effect and high risk of bias of the article such as sequence generation, allocation concealment, blinding, incomplete outcome data and selective reporting. Due to the nature of the intervention, it was not possible to blind participants or personnel and we marked this as low risk of bias for all studies. If the raters disagreed, the final rating was made by consensus, with the involvement of another member of the review group. Where inadequate details of randomisation and other characteristics of trials were provided, we contacted authors of the studies in order to obtain further information. Non‐concurrence in quality assessment was reported, but if disputes arose as to which category a trial is to be allocated, again, resolution was made by discussion with RM. The level of risk of bias was noted in both the text of the review and in the summary of findings Table for the main comparison. Two members of the Enhance Review team performed the risk of bias for the included studies from the May 2012 search.
Measures of treatment effect
1. Binary data
For binary outcomes we calculated a standard estimation of the risk ratio (RR) and its 95% confidence interval (CI). It has been shown that RR is more intuitive (Boissel 1999) than odds ratios and that odds ratios tend to be interpreted as RR by clinicians (Deeks 2000). For binary data presented in the 'Summary of findings' table, where possible, we calculated illustrative comparative risks as the Number Needed to Treat/Harm (NNT/H) statistic with its confidence intervals is intuitively attractive to clinicians but is problematic both in its accurate calculation in meta‐analyses and interpretation (Hutton 2009).
2. Continuous data
For continuous outcomes we estimated mean difference (MD) between groups. We preferred not to calculate effect size measures (standardised mean difference (SMD)). However, if scales of very considerable similarity were used, we presumed there was a small difference in measurement, and we calculated effect size and transformed the effect back to the units of one or more of the specific instruments.
3. Time to event data
The outcomes “time to relapse” and "time to re‐hospitalisation" were analysed using the Cox proportional hazard ratio (HR) and associated 95 % CI which takes into account the number and timing of events, and the time until last follow‐up for each patient who has not experienced the event (Borenstein 2009; Tierney 2007).
Unit of analysis issues
1. Cluster trials
Studies increasingly employ 'cluster randomisation' (such as randomisation by clinician or practice) but analysis and pooling of clustered data poses problems. Firstly, authors often fail to account for intra‐class correlation in clustered studies, leading to a 'unit of analysis' error (Divine 1992) whereby P values are spuriously low, confidence intervals unduly narrow and statistical significance overestimated. This causes type I errors (Bland 1997; Gulliford 1999). If clustering had not been accounted for in primary studies, we planned to present data in a table, with a (*) symbol to indicate the presence of a probable unit of analysis error. In subsequent versions of this review we will seek to contact first authors of studies to obtain intra‐class correlation coefficients (ICCs) for their clustered data and to adjust for this by using accepted methods (Gulliford 1999). Where clustering has been incorporated into the analysis of primary studies, we presented these data as if from a non‐cluster randomised study, but adjusted for the clustering effect. We have sought statistical advice and have been advised that the binary data as presented in a report should be divided by a 'design effect'. This is calculated using the mean number of participants per cluster (m) and ICC [Design effect = 1+(m‐1)*ICC] (Donner 2002). If the ICC was not reported it was assumed to be 0.1 (Ukoumunne 1999). If cluster studies had appropriately analysed taking into account ICCs and relevant data documented in the report, synthesis with other studies was possible using the generic inverse variance technique.
2. Cross‐over trials
A major concern of cross‐over trials is the carry‐over effect. It occurs if an effect (e.g. pharmacological, physiological or psychological) of the treatment in the first phase is carried over to the second phase. As a consequence, on entry to the second phase the participants can differ systematically from their initial state despite a wash‐out phase. For the same reason cross‐over trials are not appropriate if the condition of interest is unstable (Elbourne 2002). As both effects are very likely in severe mental illness, we only used data of the first phase of cross‐over studies.
3. Studies with multiple treatment groups
Where a study involved more than two treatment arms, if relevant, the additional treatment arms were presented in comparisons. If data were binary we planned to simply add and combine within the two‐by‐two table. If data were continuous we planned to combine data following the formula in section 7.7.3.8 (Combining groups) of the Cochrane Handbook for Systematic Reviews of Interventions. For studies where each pair‐wise comparison was relevant, we planned to include separately, with the shared intervention groups divided out approximately evenly among the comparisons: only the total number of participants were divided up and the means and standard deviations left unchanged, according to section 16.5.4 (How to include multiple groups from one study) of the Cochrane Handbook for Systematic Reviews of Interventions. This differs from the original protocol (see Differences between protocol and review). Where the additional treatment arms were not relevant, these data were not reproduced.
Dealing with missing data
1. Overall loss of credibility
If loss of data at follow‐up becomes too great, then the study itself runs the risk of losing credibility (Xia 2009). We chose that, for any particular outcome, had more than 50% of data be unaccounted for, we did not reproduce these data or use them within analyses. Where, however, more than 50% of those in one arm of a study were lost, but the total loss was less than 50%, we marked such data with (*) to indicate that such a result may well be prone to bias.
2. Binary
In the case where attrition for a binary outcome was between 0% and 50% and where these data were not clearly described, data were presented on a 'once‐randomised‐always‐analyse' basis (an intention‐to‐treat analysis). Those leaving the study early were all assumed to have the same rates of negative outcome as those who completed, with the exception of the outcome of death and adverse effects. For these outcomes the rate of those who stayed in the study ‐ in that particular arm of the trial ‐ were used for those who did not. A sensitivity analysis was undertaken to test how prone the primary outcomes were to change when 'completer' data only were compared to the intention‐to‐treat analysis using the above assumptions.
3. Continuous
3.1 Attrition
In the case where attrition for a continuous outcome was between 0% and 50% and completer‐only data were reported, we reproduced these.
3.2 Standard deviations
If standard deviations (SDs) were not reported, we first tried to obtain the missing values from the authors. If not available, where there were missing measures of variance for continuous data, but an exact standard error (SE) and confidence intervals (CIs) were available for group means, and either 'P' value or 't' values were available for differences in mean, we calculated them according to the rules described in the Cochrane Handbook for Systematic Reviews of Interventions (Higgins 2011): When only the SE is reported, SDs are calculated by the formula SD = SE * square root (n). Chapters 7.7.3 and 16.1.3 of the Cochrane Handbook for Systematic Reviews of Interventions (Higgins 2011) present detailed formula for estimating SDs from P values, t or F values, CIs, ranges or other statistics. Where these formulae do not apply, we calculated the SDs according to a validated imputation method which is based on the SDs of the other included studies (Furukawa 2006). Although some of these imputation strategies can introduce error, the alternative would have been to exclude a given study’s outcome and thus to lose information. We nevertheless examined the validity of the imputations in a sensitivity analysis excluding imputed values.
3.3 Last observation carried forward
We anticipated that in some studies the method of last observation carried forward (LOCF) will be employed within the study report. As with all methods of imputation to deal with missing data, LOCF introduces uncertainty about the reliability of the results (Leucht 2007). Therefore, where LOCF data have been used in the trial, if less than 50% of the data have been assumed, we reproduced these data and indicated that they are the product of LOCF assumptions.
Assessment of heterogeneity
1. Clinical heterogeneity
We considered all included studies initially, without seeing comparison data, to judge clinical heterogeneity. We simply inspected all studies for clearly outlying people or situations which we had not predicted would arise. When such situations or participant groups arose, these were fully discussed.
2. Methodological heterogeneity
We considered all included studies initially, without seeing comparison data, to judge methodological heterogeneity. We simply inspected all studies for clearly outlying methods which we had not predicted would arise. When such methodological outliers arose these were fully discussed.
3. Statistical heterogeneity
3.1 Visual inspection
We visually inspected graphs to investigate the possibility of statistical heterogeneity.
3.2 Employing the I2 statistic
Heterogeneity between studies was investigated by considering the I2 method alongside the Chi2 'P' value. The I2 provides an estimate of the percentage of inconsistency thought to be due to chance (Higgins 2011). The importance of the observed value of I2 depends on i. the magnitude and direction of effects and ii. the strength of evidence for heterogeneity (e.g. 'P' value from Chi2 test, or a confidence interval for I2). An I2 estimate greater than or equal to around 50% accompanied by a statistically significant Chi2 statistic was interpreted as evidence of substantial levels of heterogeneity (Section 9.5.2 ‐ Higgins 2011). When substantial levels of heterogeneity were found in the primary outcome, we explored reasons for heterogeneity (Subgroup analysis and investigation of heterogeneity).
Assessment of reporting biases
Reporting biases arise when the dissemination of research findings is influenced by the nature and direction of results (Egger 1997). These are described in Section 10 of the Cochrane Handbook for Systematic Reviews of Interventions (Higgins 2011). We are aware that funnel plots may be useful in investigating reporting biases but are of limited power to detect small‐study effects. We did not use funnel plots for outcomes where there were 10 or fewer studies, or where all studies were of similar sizes. In other cases, where funnel plots were possible, we sought statistical advice in their interpretation.
Data synthesis
We understand that there is no closed argument for preference for use of fixed‐effect or random‐effects models. The random‐effects method incorporates an assumption that the different studies are estimating different, yet related, intervention effects. This often seems to be true to us and the random‐effects model takes into account differences between studies even if there is no statistically significant heterogeneity. There is, however, a disadvantage to the random‐effects model. It puts added weight onto small studies which often are the most biased ones. Depending on the direction of effect, these studies can either inflate or deflate the effect size. A fixed‐effect model was used, unless we demonstrated statistically significant heterogeneity (P < 0.10) for a specific outcome, in which case the random‐effects models was preferred. The reader is, however, able to choose to inspect the data using the random‐effects model.
Subgroup analysis and investigation of heterogeneity
1. Subgroup analyses
We conducted subgroup analyses for the primary outcomes comparing:
-
early warning signs training as the main focus of the intervention versus early warning signs training not the main focus of the intervention
-
patients only versus patients and carers/health workers
-
carers/health workers only versus patients and carers/health workers
-
group training versus individual training.
2. Investigation of heterogeneity
If inconsistency was high (I2 > 75%), this was reported. First, we investigated whether data had been entered correctly. Second, if data were correct, the graph was visually inspected and outlying studies were successively removed to see if heterogeneity was restored.
When unanticipated clinical or methodological heterogeneity were obvious, we simply stated hypotheses regarding these for future reviews or versions of this review. We did not anticipate undertaking analyses relating to these.
Sensitivity analysis
1. Implication of randomisation
We aimed to include trials in a sensitivity analysis if they were described in a way that implied randomisation. For the primary outcomes, we included these studies and if there was no substantive difference when the implied randomised studies were added to those with better description of randomisation, then all data were employed from these studies.
2. Assumptions for lost data
Where assumptions had to be made regarding missing SDs data (see Dealing with missing data), we compared the findings on primary outcomes when we used our assumption compared with complete data only. We undertook a sensitivity analysis to test how prone results were to change when 'completer' data only were compared to the imputed data using the above assumption. If there was a substantial difference, we reported results and discussed them but continued to employ our assumption.
3. Imputed data
Where time to event data had to be imputed, we compared the imputed data with data that did not have to be imputed and reported any differences in results.
Results
Description of studies
Please see Characteristics of included studies, Characteristics of excluded studies, and Characteristics of ongoing studies.
In Additional Tables (Table 2 and Table 3) we categorised all studies by:
| Study ID | EWS as primary focus | EWS delivered to patient only | EWS delivered to patient and carer/ health worker | EWS delivered to carer/ health worker only | EWS delivered individually | EWS delivered in groups | EWS promoting only help seeking from others | EWS promoting additional self‐directed coping |
| ✗ | ✓ | ✗ | ✗ | ✗ | ✓ | ✗ | ✓ | |
| ✗ | ✗ | ✓ | ✗ | ✗ | ✓ | ✗ | ✓ | |
| ✗ | ✗ | ✓ | ✗ | ✗ | ✓ | ✗ | ✓ | |
| ✗ | ✓ | ✗ | ✗ | ✗ | ✓ | ✗ | ✓ | |
| ✗ | ✓ | ✗ | ✗ | not reported | not reported | ✗ | ✓ | |
| ✗ | ✓ | ✗ | ✗ | not reported | not reported | ✗ | ✓ | |
| ✗ | ✗ | ✓ | ✗ | ✗ | ✓ | ✗ | ✓ | |
|
✗ | ✗ | not reported | ✗ | ✓ | ✓ | ✗ | ✓ | |
| ✓ | ✓ (CBT) | ✗ | ✓ (family intervention) | ✓ (CBT) | ✓ (family intervention) | no (CBT) yes (family intervention) | ✓ (CBT) no (family intervention) | |
| ✗ | ✓ | ✗ | ✗ | ✗ | ✓ | ✗ | ✓ | |
| ✗ | ✓ | ✗ | ✗ | ✓ | ✗ | ✗ | ✓ | |
| ✗ | ✗ | ✗ | ✓ | ✓ | ✗ | ✗ | ✓ | |
| ✓ | ✗ | ✓ | ✗ | ✗ | ✓ | ✗ | ✓ | |
| ✗ | ✗ | ✓ | ✗ | ✗ | ✓ | ✗ | ✓ | |
| ✗ | ✓ | ✗ | ✗ | ✗ | ✓ | ✗ | ✓ | |
| ✗ | ✓ | ✗ | ✗ | ✗ | ✓ | ✗ | ✓ | |
| ✗ | ✗ | ✓ | ✗ | ✗ | ✓ | ✗ | ✓ | |
| ✗ | ✓ | ✗ | ✗ | ✓ | ✗ | ✗ | ✓ | |
| ✗ | ✗ | ✗ | ✓ | ✓ | optional | ✗ | ✗ | |
| ✗ | ✓ | ✗ | ✗ | ✓ | ✓ | ✗ | ✓ | |
| ✗ | ✗ | ✓ | ✗ | ✗ | ✓ | ✗ | ✓ | |
| ✗ | ✗ | ✓ | ✗ | ✗ | ✓ | ✗ | ✓ | |
| ✗ | ✓ | ✗ | ✗ | ✓ | ✓ | ✗ | ✓ | |
| ✗ | ✓ | optional | ✗ | ✓ | ✓ | ✗ | ✓ | |
| ✓ | ✓ | ✗ | ✗ | unclear | ✓ | ✗ | ✓ | |
| ✓ includes cognitive therapy | ✓ | ✗ | ✗ | ✓ | ✗ | ✓ | ✗ | |
| ✗ | ✗ | ✓ | ✗ | ✓ | ✗ | ✗ | ✓ | |
| ✓ | ✓ | ✗ | ✗ | ✓ | ✗ | ✗ | ✓ | |
| ✗ | ✓ | ✗ | ✗ | ✗ | ✓ | ✗ | ✓ | |
| ✗ | ✓ | ✗ | ✗ | ✗ | ✓ | ✗ | ✓ | |
| ✗ | ✓ | ✗ | ✗ | ✗ | ✓ | ✗ | ✓ | |
| ✗ | ✗ | ✓ | ✗ | ✓ | ✓ | ✗ | ✓ | |
| ✗ | ✓ | ✗ | ✗ | not reported | not reported | ✗ | ✓ | |
| ✗ | ✗ | ✓ | ✗ | ✓ | ✓ | ✗ | ✓ |
CBT: cognitive behavioural therapy
EWS: early warning signs
| Study ID | Focus of intervention | At least one hour/ session focus on EWS | EWS intervention delivered by | No. of sessions | Control group |
| Community re‐entry program | yes | Ward Nurses | 18 one‐hour sessions | Occupational rehabilitation | |
| Psychoeducation of patients and relatives (reduce re‐hospitalisation and improve compliance) | yes | Psychiatrist or clinical psychologist | 8 one‐hour groups, 4 sessions weekly and 4 monthly 8 bi‐weekly 90‐minute sessions for relatives | Outpatient treatment, antipsychotic medication | |
| Multiple family group treatment | yes | Psychoeducation:Psychiatrist, psychologists, social workers, occupational therapists Family groups: Therapists | 3 single family joining sessions. 2 half‐day psychoeducation sessions. Multiple family group fortnightly for 12 months | Appointments with case manager and doctor for medication and individual psychosocial rehabilitation. Family contact as required | |
| Psychoeducational medication training and key person counselling | yes | Project staff | 10 sessions, first 5 at weekly intervals and 5 at fortnightly intervals | 1.Cognitive psychotherapy: 7 sessions weekly and 8 sessions fortnightly 2. Leisure time group activities led by students of psychology or educational sociology | |
| Psychoeducation & relapse prevention | no | Occupational therapist | Ten 50‐minute sessions over two weeks for patients | Traditional ward occupational therapy including work, rest, leisure activities | |
| Medication & symptom management training programme | not reported | Not reported | Not reported | Antipsychotic therapy | |
| Psychoeducation | yes | Trained psychiatric nurses | 12 bi‐weekly 2‐hour sessions over 6 months for patients and families together | 1. Mutual support group for families only 2. Standard outpatient care | |
| Cognitive Therapy | No | Not reported | 8 hours a week – four individual and four group sessions, 2 sessions with family engagement | Recreation therapy, leisure and social activities outside the ward | |
| CBT or family intervention | No | Each session with 2 therapists ‐ mix of doctoral clinical psychologists and nurses all trained in CBT | 9 months (intended minimum 12 months, max 20 months) – 1‐hour sessions with a mean number of 14.3 session | TAU‐ standard of care delivered according to national and local service protocols including antipsychotic medication. | |
| Cognitive behavioural skills training | Yes | Each session led by 2 therapists ‐ mix of doctoral or senior graduate level psychologists | 24 two‐hour weekly group sessions | TAU – continuation of prior treatment | |
| Targeted CBT for relapse | yes | Clinical psychologist | 5 session engagement phase between 0‐12 weeks; intensive targeted phase (2‐3 sessions per week) after for 12 months | Ongoing medication, regular psychiatric review, follow‐up from a key worker, access to multidisciplinary community mental health team | |
| Medication management training programme | yes | Not reported | Community mental health professionals (CMHPs; nurses, occupational therapists, social workers) received a 10‐day programme: 3 days assessment training, followed by seven fortnightly study days. These were followed by 1‐hour individual supervision sessions, at the CMHP’s workplace, every month for 6 months, giving a total educational input of 9 months. | Waiting list | |
| Relapse prevention | yes | Master's level nurse clinician or certified social worker | One‐hour weekly supportive group therapy OR 30‐45‐minute individual supportive therapy 90‐minute multifamily psychoeducation groups bi‐weekly for 6 months and monthly after | Individual supportive therapy and medication management biweekly for 15‐30 minutes | |
| Personal therapy (relapse prevention) and/or family therapy (psychoeducation/ management) | yes | Personal and family therapy: master's level psychiatric nurse clinical specialists and doctoral‐ level clinical psychologists | 30‐45‐minute weekly for about 3 years 1.9 additional monthly medication management sessions | Supportive therapy | |
| Symptom management | yes | Not reported | 12 one‐hour groups that met twice weekly | Social cognitive intervention | |
| Community re‐entry program | yes | 2 trainers per session – from a multi‐disciplinary staff of 10 | Eight 45‐minute group sessions, twice a day for 4 days in a week. | Occupational therapy | |
| Family assisted skills training program | yes | Nurses, psychologists and social workers | 90‐minute sessions four times per week for 3 months. Weekly group sessions with families included | Case management by social workers and monthly 20‐minute psychiatric visits to see a psychiatrist | |
| CBT | Yes | Therapist | Weekly sessions that become fortnightly‐ up to one hour and up to nine months | Standard care‐ case management and medication | |
| Comprehensive patient/ family education guide (CP/FEG) | yes | Ward Nurses | In hospital‐ Patient 8 hours; family member 36 hours. Post‐discharge‐ patient and family member 2 hours per month for 3 months. | Not reported | |
| Social and Independent Living Skills Program consisting of basic conversation, recreation for leisure, medication management, and symptom management | yes | Occupational therapist and paraprofessionals | 6 months of intensive, clinic‐based treatment 3 hours a day, 4 days per week. | Psychosocial occupational therapy | |
| Multiple family group treatment | yes | clinicians | 24 sessions in year 1 and 12 sessions in year 2 | Outpatient services: medication management, case management, phone consultation, crisis services, group psychotherapy, occupational therapy, individual psychotherapy | |
| Patient and relative psychoeducation | yes | not stated | 8 weekly sessions separately for patients and relatives | Psychopharmacological treatment, psychosocial rehabilitation efforts, some supportive psychotherapy | |
| Stress management program | yes | Nurse case managers | 12 weeks of group sessions, and 12 individual sessions | Social activities program similar in frequency and length to treatment group | |
| Psychoeducational group program with individual supportive therapy | yes | Group sessions – psychiatric social worker Individual sessions – Master’s degree student | 10 weekly group sessions (90 minutes each) & individual sessions (45 minutes each) | Individual supportive therapy | |
| Self management educational group | Yes | 2 psychiatric nurses & 2 social workers | 12 group sessions (70 minutes each) | Non‐equivalent control group ‐ undefined | |
| EWS recognition and targeted cognitive therapy | yes | Therapist | 5 one‐hour sessions on initial engagement and formulation Early signs monitoring questionnaire dispatched fortnightly for an average of 10 months Targeted cognitive therapy, intensive for a brief period, about 2‐3 sessions per week | Routine appointments with psychiatrist and key worker (community psychiatric worker, social worker or occupational therapist) | |
| Modify patient's condition and family approach | yes | Trained Community Psychiatric Nurse | up to 6 hour‐long sessions of CBT and/or 3 sessions with carer | Care of community mental health teams | |
| Relapse prevention plan using EWS monitoring | yes | Trained nurses | Therapy for a total of mean (SD) 155 (94) days | Care as usual | |
| Psychiatric rehabilitation | yes | Interdisciplinary teams | 2 months, possibly weekly sessions | Standard inpatient services and activities | |
| Medication & symptom management training programme | yes | Psychiatrist and a psychologist | 90 to 120‐minute sessions, 3 sessions per week for 20 weeks | Antipsychotic medication and standard psychological intervention | |
| Family based intervention | yes | Clinicians | 1. Introduction‐ two to three 45‐minute sessions‐ family +/‐ patient 2. Monthly 45‐minute counselling with patient (average 8.1 contacts per year) and family and 90 minute family group 3. Maintenance‐ families seen once in 2‐3 months and monthly group meetings up to 18 months | 2‐3 months of medication post discharge +/‐ out patient follow‐up | |
| Medication & symptom management training programme | yes | Psychiatrist and a psychologist | 60 to 90 minutes per session, 1 session per week for 12 weeks | Pharmacotherapy and standard psychological intervention | |
| Life skills, medication & symptom management training programme | yes | Psychiatrist and psychiatric nurse | Group training for 90 to 120 minutes, 2 times a week. Then community follow‐up by nurses, number of sessions not reported | Conventional rehabilitation service (outpatient follow‐up every 3 months, or telephone counselling as needed) |
1. Target of intervention
1.1 Intervention targeted at patient's own recognition of early warning symptoms;
1.2 Interventions targeted at recognition of early warning symptoms by carers or health professionals;
1.3 Interventions that are targeted at both patient and carers.
2. Individual or group treatment
3. Focus of intervention: early warning signs is primary focus of intervention or one component of a multifaceted intervention.
4. Intervention as an addition or replacement for treatment as usual
4.1 Intervention targeting early warning symptoms plus treatment as usual (TAU) versus treatment as usual not including psychological treatment;
4.2 Early warning signs intervention plus treatment as usual versus another psychological treatment not involving early warning signs intervention plus treatment as usual;
4.3 Early warning signs intervention with intermittent medication use in presence of early warning signs without continued medication versus treatment as usual using continued medication;
4.4 Early warning signs intervention involves only help seeking from others or early warning signs intervention involves other self‐directed coping.
Results of the search
The search of electronic databases retrieved a total of 1784 citations. Agreement about which reports may have been randomised was 100% and 205 of the original reports were selected and ordered. Thirty‐four trials met all the criteria for study selection for this review (see 'Characteristics of included studies').
Included studies
The current review includes 41 reports describing 34 studies (Anzai 2002; Bauml 2007; Bradley 2006; Buchkremer 1997; Chan 2007; Chen 2003; Chien 2004; Drury 1996; Garety 2008; Granholm 2005; Gumley 2003; Harris 2009; Herz 2000; Hogarty 1997a; Horan 2009; Kopelowicz 1998a; Kopelowicz 2003; Kuipers 1997; Li 2003; Liberman 1998; McDonell 2006; Merinder 1999; Norman 2002; Shin 2002; Shon 2002; Tait 2002; Turkington 2006; Van Meijel 2006; Vreeland 2006; Weng 2005; Xiang 2001; Xiong 1994; Zhan 2003; Zhang 2004). This review includes data on 3554 randomised people from within these 34 separate trials.
Details of contact with authors can be found in Appendix 1.
1. Methods
All studies were stated to be randomised. Thirty‐two studies were randomised controlled trials (RCTs) and two were cluster‐RCTS (Harris 2009; Li 2003). Due to the nature of the intervention, none of the studies were double‐blind, 16 studies were single‐blind, stating that the assessors were blinded to the participant's treatment allocation (Bauml 2007; Bradley 2006; Chen 2003; Chien 2004; Garety 2008; Granholm 2005; Herz 2000; Kopelowicz 2003; Liberman 1998; Merinder 1999; Norman 2002; Turkington 2006; Vreeland 2006; Xiang 2001; Zhan 2003; Zhang 2004), four studies were not blinded or had inadequate blinding (Buchkremer 1997; Gumley 2003; Harris 2009; Kuipers 1997) and blinding was unclear in the remaining 14 trials. For further details please see sections below on Allocation (selection bias) and Blinding (performance bias and detection bias).
2. Duration
Most trials were undertaken between nine months and two years (Bauml 2007; Bradley 2006; Buchkremer 1997; Chan 2007; Chen 2003; Chien 2004; Drury 1996; Gumley 2003; Harris 2009; Herz 2000; Kopelowicz 1998a; Kopelowicz 2003; Kuipers 1997; Li 2003; Liberman 1998; Merinder 1999; Norman 2002; Tait 2002; Turkington 2006; Van Meijel 2006; Xiang 2001; Xiong 1994; Zhan 2003; Zhang 2004), six studies were less than six months (Anzai 2002; Granholm 2005; Horan 2009; Shin 2002; Vreeland 2006; Weng 2005) and two studies had three years follow‐up (Hogarty 1997a; McDonell 2006).
3. Participants
All participants were people with a chronic mental illness, mostly with schizophrenia and schizophrenia‐like disorders. All studies except five included both sexes; Anzai 2002, Weng 2005 and Zhan 2003 did not report the sex of the participants, Chan 2007 and Liberman 1998 included only male participants. The mean age for studies that reported this ranged from 28 years to 54 years.
4. Setting
All studies were in a secondary care setting. Eleven studies took place in North America, 11 in Europe, 11 in East Asia and one in Australia.
5. Interventions
For full details of the interventions please see Characteristics of included studies, Table 2 and Table 3.
Thirty‐two studies include early warning signs recognition as part of other psychological interventions. Six studies had recognition of early warning signs as a primary focus (Garety 2008; Herz 2000; Liberman 1998; Shon 2002; Tait 2002; Van Meijel 2006). In all studies early warning signs interventions provided education to the patient about the nature of schizophrenia as well as early warning sign recognition and management in addition to treatment as usual. Twenty‐three studies had the control group with only treatment as usual, three studies had a control group including treatment as usual and another psychological therapy, in four studies the control groups included treatment as usual and occupational therapy (Anzai 2002; Chan 2007; Kopelowicz 1998a; Liberman 1998), three also included social and recreational activities (Drury 1996; Norman 2002; Vreeland 2006), and in one study, the control group received social skills training (Horan 2009). Six studies delivered the intervention to individuals, 16 delivered it in groups, five to both groups and individually, and in the remaining studies it was either unclear or not reported.
In 20 studies the early warning signs training was delivered to the patients only. In 11 studies the families or carers of the participants were included in the early warning signs programme, and in one study family involvement was optional (Shin 2002). In two of these studies, treatment as usual also included family support services (Bradley 2006; Chien 2004). Gumley 2003 and Garety 2008 used cognitive behavioural therapy (CBT) as part of the early warning signs intervention and in Buchkremer 1997, one of the early warning signs interventions was cognitive psychotherapy.
In three studies the intervention was delivered to the carer/health professional only. In Li 2003, a cluster‐RCT, although the study included interventions for both the patients and their families, only families received early warning signs training. In Garety 2008, there were two treatment pathways: one for patients who had a carer and one for patients without carers. In the no‐carer pathway patients were randomised to CBT with early warning signs training or treatment as usual. In the carer pathway, patients were randomised to CBT with early warning signs training, treatment as usual or family intervention in which only the family members received early warning signs training. Harris 2009 was a cluster‐RCT in which community health professionals were trained in an experimental medication management training programme that included early warning signs work and relapse prevention.
6. Outcomes scales
Scales that provided useable data are described below.
6.1 Mental state
i) Positive and Negative Syndromes Scale ‐ PANSS (Kay 1986) in Chen 2003, Garety 2008, Gumley 2003, Kopelowicz 2003 and Vreeland 2006.
This scale is used for measuring symptom reduction of patients with schizophrenia and was conceived as an operationalised, drug‐sensitive instrument that provides balanced representation of positive and negative symptoms and gauges their relationship to one another and to global psychopathology. It consists of four scales measuring positive and negative syndromes, their differential and general severity of illness. The name refers to the two types of symptoms in schizophrenia as defined by the American Psychiatric Association: positive symptoms, which refer to an excess or distortion of normal functions, and negative symptoms, which represent a diminution or loss of normal functions. High scores suggest greater psychopathology.
PANSS positive syndrome range from seven to 48
PANSS negative syndrome range from seven to 48
PANSS general psychopathology range from 16‐96
ii) Brief Psychopathology Rating Scale – BPRS (Overall 1962) in Bauml 2007, Bradley 2006, Buchkremer 1997, Chien 2004, Kuipers 1997, Li 2003, Liberman 1998; Merinder 1999, Shin 2002, Weng 2005, Xiang 2001 and Zhan 2003.
A brief rating scale used to assess the severity of a range of psychiatric symptoms, including psychotic symptoms. The scale has 16 items, and each item can be defined on a seven‐point scale varying from 'not present' (0) to 'extremely severe' (6). High scores suggest greater psychopathology.
iii) Scale for the Assessment of Negative Symptoms ‐ SANS (Andreasen 1983) in Bradley 2006, McDonell 2006 and Zhang 2004.
This scale allows a global rating of the following negative symptoms: alogia (impoverished thinking), affective blunting, avolition‐apathy, anhedonia‐asociality, and attention impairment. Assessments are made on a six‐point scale from zero (not at all) to five (severe). Higher scores indicate more symptoms.
iv) Scale for the Assessment of Positive Symptoms ‐ SAPS (Andreasen 1983) in Zhang 2004.
This scale is designed to assess positive symptoms that occur in schizophrenia. On a zero to five‐point system, the scale measures four domains including hallucinations, delusions, bizarre behaviour and positive formal thought disorder. Higher scores indicate more symptoms.
v) Psychiatric Assessment Scale – PAS (Krawiecka 1977) in Drury 1996.
This is a simple, five‐point scale that measures the symptomatology of chronic psychotic patients. It consists of eight categories of symptoms: depression, anxiety, hallucinations, delusions, flattened incongruous affect, psychomotor retardation, incoherence and irrelevance of speech, and poverty of speech. High scores indicate greater psychopathology.
vi) Krawiecka‐Goldberg‐Vaughan scale ‐ KGV (Krawiecka 1977) in Harris 2009.
This scale measures symptoms of psychotic illnesses such as schizophrenia and bipolar affective disorder. The measure comprises 14 symptoms and each symptom is rated on a scale from zero to three. Higher scores indicate more symptoms.
6.2 Social Functioning
i) Rehabilitation Evaluation Hall and Baker ‐ REHAB (Baker 1988) in Anzai 2002.
This is a 23‐item behaviour rating scale for use with people with chronic psychiatric disability. It measures personal, social and life skills that are important in reintegrating into the community. Scores range from five to 115. Higher scores indicate worse functioning.
ii) Health of the Nation Outcome Scale – HoNOS (Wing 1998) in Bradley 2006.
This scale combines 12 outcomes scales, each measured on a five‐point scale, which covers physical, personal and social problems associated with mental illness. High score indicate worse functioning.
iii) Global Assessment of Functioning ‐ GAF (APA 1987) in Bauml 2007 and Merinder 1999.
This scale measures the level of psychological, social, and occupational functioning of psychiatric patients. Possible scores range from one to 90. High scores indicate better functioning.
iv) Global Assessment of Functioning GAF‐DIS (Goldman 1992) in Vreeland 2006.
This version of the GAF focuses on functioning, and does not combine this with symptoms. Scores also range from one to 90. High scores indicate better functioning.
v) GAS Global Assessment Scale ‐ GAS (Endicott 1976) in Buchkremer 1997, Li 2003 and Liberman 1998.
This is an observer‐rated scale for evaluating the overall functioning of an individual during a specified time period on a continuum from psychological or psychiatric sickness to health. Score ranges from zero to 100, where a higher score indicates better functioning.
vi) Independent Living Skills Survey – ILSS (Wallace 2000) in Kopelowicz 2003.
This survey measures the functional living skills of individuals with severe and persistent mental illness. It includes 103 items covering basic community living skills and is completed by a key relative on an 11‐point Likert scale. A high score indicates better functioning.
vii) Specific Level of Functioning assessment scale ‐ SLOF (Schneider 1983) in Chien 2004.
This scale includes 43 behavioural items measured on a five‐point Likert scale. There are six domains that are measured: physical functioning, personal care skills, interpersonal relationships, social acceptability, activities of community living, and work skills. A high score indicates better functioning.
viii) Time budget interview (Jolley 2006) in Garety 2008.
The time budget interview is a measure of social functioning that records activity. It is an interview with participants, in which a week‐long diary is retrospectively completed in four time periods for each day. It covers domestic activities, social contacts, work and leisure. The activities are then scored, higher scores represent more complex activities, and better functioning.
ix) Social and Occupational Functioning Assessment Scale ‐ SOFAS (APA 1994) in Garety 2008.
This scale measures social and occupational functioning. It is rated from zero to100, high scores indicate better functioning.
x) SDSS (WHO 1998) in Chen 2003 and Zhang 2004.
This scale measures 10 aspects of social activities and roles. It is a Chinese simplified version of the WHO's Disability Assessment Schedule. Higher scores indicate worse functioning.
xi) Social Functioning Scale ‐ SFS (Birchwood 1990) in Harris 2009.
This is a clinician rated scale that measures the level of social functioning seven areas. Higher scores indicate higher functioning.
xii) Nurses' Observation Scale for Inpatient Evaluation ‐ NOSIE (Honigfeld 1965) in Chen 2003, Li 2003 and Zhan 2003.
This is a 30‐item scale designed to assess the behaviour of patients on an inpatient unit. It is simple to administer, and may be used to assess patients that may be too ill to participate in more interactive rating scales. High scores indicate better functioning.
6.3 Satisfaction with care
i) International Association of Psychosocial Rehabilitation Services toolkit – IAPSRS (Arns 2001) in Vreeland 2006.
This is self‐reported measure of 20‐items on four sub scales: empowerment, mastery, life satisfaction and programme satisfaction. A high score indicates more satisfaction.
ii) Versona Service Satisfaction Scale – VSSS (Ruggeri 1993) in Merinder 1999.
This scale is a method for measuring service satisfaction of patients with mental health services. It consists of 82 items, measured on a five‐point Likert scale. High scores indicate more satisfaction.
iii) California Psychotherapy Alliance Scale ‐ CALPAS (Gaston 1993) in Harris 2009.
This is a 24‐item scale that measures participants' perception of involvement in treatment. Higher scores indicate higher perception of involvement.
6.4 Knowledge
i) Knowledge about Schizophrenia Questionnaire – KASQ (Ascher‐Svanum 1999) in Vreeland 2006.
This scale assess schizophrenic patients’ knowledge about their illness and its management, including the diagnosis of schizophrenia and its prevalence, aetiology, course and prognosis, knowledge about medication and its side‐effects, psychological treatments, stress factors and legal issues. It is a 25‐item multiple‐choice test. High scores indicate greater knowledge.
ii) Insight scale – IS (Birchwood 1994) in Merinder 1999.
This is an eight‐item questionnaire, which measures on a three‐point scale insight in psychosis across three factors: awareness of illness, need for treatment, and attribution of symptoms. Higher scores indicate better insight.
ii) Scale of Unawareness of Mental Disorder ‐ SUMD (Amador 1993) in Chan 2007.
This is a 20‐item scale measuring the past and present awareness of having a mental disorder, the effect of medications, the consequences of mental illness, and the awareness and attribution of the symptom items. It is measured on a five‐point scale. Higher scores indicate worse insight.
iii) Insight and Treatment Attitude Questionnaire ‐ ITAQ (McEvoy 1989) in Chen 2003 and Zhang 2004.
The ITAQ is a semi‐structured interview of 11 items that measures awareness of illness (first five items) and attitude to medication/hospitalisation and follow‐up evaluation (six items). Scores range from zero (no insight) to 22 (full insight).
iv) Drug Attitude Inventory ‐ DAI (Hogan 1983) in Harris 2009.
This is a self‐rating scale that measures attitude to treatment. It consists of 30 statements about attitudes to psychotropic medication. Total scores can range from +30 to ‐30, with positive scores predicting adherence to medication.
v) Knowledge About Schizophrenia Interview ‐ KASI (Tarrier 1990) in Li 2003.
This interview measures families and carers' knowledge about schizophrenia, including six areas: diagnosis, symptomology, aetiology, medication, prognosis and management. Higher scores indicate more knowledge.
6.5 Quality of Life
i) Quality of Life Scale ‐ QLS (Heinrich 1984) in Bradley 2006.
This six‐point quality of life scale has been designed as an outcome instrument for schizophrenic deficit syndrome as well as to measure impaired functioning in studies of chronic schizophrenia, to assess the deficit syndrome's impact on the patient's life. There are seven severity steps (zero to six, six being adequately functioning and zero being deficient). The time frame is one month. Four item categories have been identified by factor analysis 1) interpersonal relationships (seven items), 2) instrumental role (four items), 3) intrapsychic function (seven items) and 4) commonplace objects and activities. Higher scores indicate greater quality of life.
ii) Lancashire Quality of Life Profile ‐ LQLP (Priebe 1998) in Bauml 2007.
This scale includes both objective and subjective measures of quality of life. The 27‐item subjective measures cover nine domains: work and education, leisure and participation, religion, finance, living situation, legal and safety, family relations, social relations and health. it is scored on a seven‐point scale. High scores indicate greater quality of life.
iii) EuroQoL (Brazier 1993) in Garety 2008.
The EuroQol is a self‐reported questionnaire, measuring health‐related quality of life. Higher scores indicate greater quality of life.
iv) Lehman Quality of Life Scale ‐ LQoLS (Lehman 1988) in Liberman 1998.
This is a structured, 45‐minute qualify of life Interview for the chronically mentally ill. Higher scores indicate greater quality of life.
6.6 Burden of care
i) Family Burden Interview Schedule – FBIS (Pai 1981) in Bradley 2006 and Chien 2004.
This scale consists of six measures of burden, with each item rated on a three‐point scale. It includes financial burden, effects on family routine, effects on family leisure, effects on family interaction, effects on physical health of family members and effects on mental health of other family members. High scores indicate greater caregiver burden.
ii) Family Attitude Scale ‐ FAS (Kavanagh 1997) in Li 2003.
This is a 30‐item self‐report questionnaire with brief measures of anger, burden or ‘stress’ of relatives towards a patient. Respondents identify how often each statement is true, on a five‐point scale from “never” to “everyday”, and responses are summed to give a zero to 120 score.
Excluded studies
We excluded 86 studies that did not meet the criteria for the review, mainly because they either did not include education to increase awareness of early signs of recurrence or the early warning signs intervention was used for both control and experimental groups (see Characteristics of excluded studies).
Studies awaiting assessment
No studies are awaiting assessment.
Ongoing studies
We found seven ongoing studies (see Characteristics of ongoing studies).
Risk of bias in included studies
We prepared a 'Risk of bias' assessment for each trial. Our judgments regarding the overall risk of bias in individual studies is illustrated in Figure 1 and Figure 2. Overall, we felt the risk of bias in the included studies to be moderate.
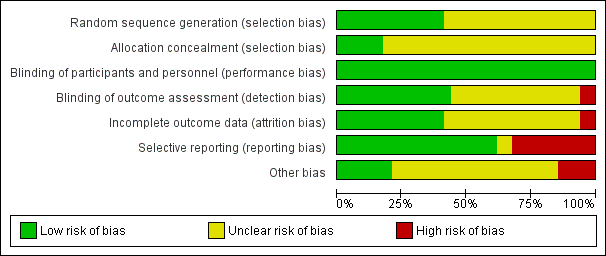
'Risk of bias' graph: review authors' judgements about each risk of bias item presented as percentages across all included studies.

'Risk of bias' summary: review authors' judgements about each risk of bias item for each included study.
Allocation
All studies were reported as randomly assigned. However, 19 studies did not clearly describe how generation of randomisation sequence was undertaken and had an unclear risk of bias. Only six of the studies had a low risk of bias for allocation concealment, the risk of bias was unclear in the remaining studies.
Blinding
None of the studies were double‐blind due to the nature of the intervention, therefore, all studies were rated as low risk of bias. Fourteen studies used assessors that were blinded and were rated as low risk of bias; in 17 studies the risk of bias was unclear and two studies used assessors that were not blind to allocation of treatment condition and these were rated as high risk of bias.
Incomplete outcome data
Fourteen of the studies had a low risk of bias for incomplete outcomes data, 17 trials had an unclear risk of bias and risk of bias was high in two studies.
Selective reporting
Twenty studies were rated as low risk of bias for selective outcome reporting, 11 studies had a high risk of bias for selective outcome reporting, and it was unclear in two studies.
Other potential sources of bias
Seven studies were of low risk of bias for other potential sources of bias, five studies were subject to other biases as they were either partly or fully funded by the pharmaceutical industry, and the remainder had an unclear risk of bias.
Effects of interventions
Comparison 1: Early warning signs training + treatment as usual (TAU) versus TAU
Primary outcomes
For the primary outcomes, we have presented the data in subgroups according to who received the training, but the outcomes were measured in the patients. See subgroup analyses for details.
1. Relapse
1.1 Relapse: 1. Relapse
Fifteen trials with a follow‐up duration of two to 36 months provided data on the rate of relapse of participants (Analysis 1.1). Early warning signs intervention was found to be superior to treatment as usual in preventing relapses (15 RCTs, n = 1502, risk ratio (RR) 0.53 95% confidence interval (CI) 0.36 to 0.79). This data however showed a very high heterogeneity (I2 n = 81%), mostly due to the heterogeneity observed in studies where the intervention was delivered only to the patients (I2 n = 89%). See subgroup analyses below for more details.
1.2 Relapse: 2. Time to first relapse
In six trials with a follow‐up duration of 12 to 18 months, time taken to relapse after treatment was no longer when early warning signs intervention was delivered, compared to treatment as usual (6 RCTs, n = 550, hazard ratio (HR) 0.53, 95% CI 0.27 to 1.06; Analysis 1.2). The pooled results showed high heterogeneity (I2 = 72%).
2. Service use
2.1 Service use: 1 Re‐hospitalisation
Fifteen trials with a follow‐up duration of two months to three years provided data regarding the outcome rate of re‐hospitalisation. Early warning signs intervention was found to be superior to treatment as usual in preventing re‐hospitalisation of participants (15 RCTs, n = 1457, RR 0.48, 95% CI 0.35 to 0.66; Analysis 1.3). The pooled data showed moderately high heterogeneity (I2 = 62%).
In addition, Buchkremer 1997 and Bauml 2007 report a rate of re‐hospitalisation for available participants at a follow‐up of five years and seven years respectively (Analysis 1.4). No significant difference was found in favour of early warning signs intervention over treatment as usual (2 RCTs, n = 156, RR 0.82 95% CI 0.49 to 1.36).
2.2 Service use: 2 Time to re‐hospitalisation
In six trials with a follow‐up duration of one to two years, time to re‐hospitalisation was no longer when early warning signs intervention was delivered, compared to treatment as usual (6 RCTs, n = 1149, HR 0.58, 95% CI 0.33 to 1.04; Analysis 1.5). This data however showed a very high heterogeneity (I2 = 83%), mostly due to the heterogeneity observed in studies where the intervention was delivered only to the patients (I2 = 89%). See subgroup analyses below for more details.
Secondary outcomes
For the outcomes mental state, social functioning, burden of care, medication compliance and economic outcomes, some studies reported skewed data, which were not entered into the analysis. These are reported in Table 1.
1. Mental state
1.1 Mental state: general 1a. Average score (BPRS, high = bad)
Ten trials with a follow‐up duration of 10 weeks to two years provided data regarding the outcome mental state on the BPRS. Early warning signs intervention was found to be superior to treatment as usual in improving the mental state of participants (9 RCTs, n = 685, 1 cluster RCT, n = 8 clusters, mean difference (MD) ‐4.55, 95% CI ‐8.21 to ‐0.90; Analysis 1.6). The pooled results show very high heterogeneity (I2 = 93%).
When the outlying studies Xiang 2001 and Zhan 2003 are removed from the analysis, there is still a significant difference in favour of early warning signs training, although the magnitude of the effect is less (8 RCTS, n = 339, 1 cluster RCT, n = 8 clusters, MD ‐2.64 95% CI ‐4.62 to ‐0.67) much of the heterogeneity is reduced (I2 = 38%).
Weng 2005 also reported data for mean change in mental state on the BPRS but we could not pool this data because they measured the mean change from discharge to follow‐up, rather than pre‐intervention to follow‐up.
1.2 Mental state: general 1b. Avergae score (PANSS, high = bad)
Three trials with a follow‐up duration of nine months to two years provided data regarding the outcome mental state on the PANSS. Early warning signs intervention was not found to be superior to treatment as usual in improving the mental state of participants (3 RCTs, n = 385, MD ‐5.89, 95% CI ‐15.86 to 4.09; Analysis 1.7). The pooled results show very high heterogeneity (I2 = 91%).
When the outlier Chen 2003 is removed, there is no heterogeneity (I2 = 0%), and the early warning signs training is not found to be superior to treatment as usual in improving mental state on the PANSS (2 RCTS, n = 322, MD ‐1.45 95% CI ‐4.70 to 1.79).
1.3 Mental state: general 1c. Average score (KGV, high = bad)
One cluster randomised trial with a follow‐up duration of nine months measured mental state on the KGV scale in patients whose community mental health professional had received early warning signs training. A significant difference was found in mental state in favour of early warning signs training (1 cluster RCT, n = 50 clusters, MD ‐2.60 95% CI ‐4.07 to ‐1.13; Analysis 1.8).
1.4 Mental state: specific 2. Average score in positive symptoms (various scales)
1.4.1 BPRS (high = bad)
One trial with a follow‐up duration of 18 months provided data on mean endpoint score on positive symptoms on the BPRS scale. Early warning signs intervention was not superior to treatment as usual in improving positive symptoms (1 RCT, n = 64, MD ‐0.90, 95% CI ‐3.52 to 1.72)
1.4.2 PANSS positive (high = bad)
Four trials with a follow‐up duration of 24 weeks to two years provided data on mean endpoint score on positive symptoms on the PANSS positive scale. Early warning signs intervention was not found to be superior to treatment as usual in improving the mental state of participants (4 RCTs, n = 508, MD ‐0.41, 95% CI ‐2.70 to 1.87). The pooled results show high heterogeneity (I2 = 86%).
When Chen 2003, which is an outlier, is removed from the analysis, early warning signs intervention remains not superior to treatment as usual (3 RCTS, n = 445, MD 0.42 95% CI ‐1.09 to 1.92), but the level of heterogeneity is moderate (I2 = 50%).
1.4.3 SAPS (high = bad)
One trial with a follow‐up duration of one year provided data on positive symptoms on the PAS positive scale. Early warning signs intervention was found to be superior to treatment as usual in improving positive symptoms (1 RCT, n = 104, MD ‐2.04, 95% CI ‐3.22 to ‐0.86).
1.5 Mental state: specific 3. Average score in negative symptoms (various scales)
1.5.1 PANSS negative (high = bad)
Four trials with a follow‐up duration of 24 weeks to two years provided data on negative symptoms on the PANSS negative scale. Early warning signs intervention was not found to be superior to treatment as usual in improving the mental state of participants (4 RCTs, n = 508, MD ‐0.74, 95% CI ‐3.13 to 1.64). The pooled results show high heterogeneity (I2 = 86%).
When Chen 2003, which is an outlier, is removed from the analysis, early warning signs intervention remains not superior to treatment as usual (3 RCTS, n = 445, MD 0.10 95% CI ‐1.48 to 1.69), the level of heterogeneity is moderate (I2 = 54%).
1.5.2 SANS (high = bad)
Three trials with a follow‐up duration of one year to three years provided data on negative symptoms on the SANS scale. Early warning signs intervention was not found to be superior to treatment as usual in improving the mental state of participants (3 RCTs, n = 194, MD ‐3.95, 95% CI ‐15.25 to 7.35). The pooled results show extremely high heterogeneity (I2 = 99%).
When the study Zhang 2004, which is an outlier, is removed from the analysis, early warning signs intervention remains not superior to treatment as usual (2 RCTs, n = 90, MD ‐0.95, 95% CI ‐5.41 to 7.30), the level of heterogeneity is moderate (I2 = 58%).
2. Social functioning
2.1 Social functioning: 1. Not employed
Two trials with a follow‐up duration of two months to one year provided data on the number of participants not in employment at the end of the study (Analysis 1.11). Early warning signs intervention was found to be superior to treatment as usual (2 RCTs, n = 185, RR 0.68, 95% CI 0.57 to 0.82). The pooled results showed no heterogeneity (I2 = 0%).Xiong 1994 also reported on the mean number of months of employment of participants at 18 months follow‐up. They found a significant difference in favour of early warning signs intervention (1 RCT, n = 58, MD ‐4.86, 95% CI ‐8.78 to ‐0.94).
2.2 Social functioning: 2. Average scores (various scales)
(Analysis 1.12; Analysis 1.13)
Social functioning was measured on 11 different scales, with one to three studies providing data for each scale. On nine of these scales early warning signs training was not found to be superior to treatment as usual in improving social functioning, and on two of the scales used a significant difference was found in favour of the intervention.
2.2.1 GAF (high = good)
Two trials with a follow‐up duration of one to two years provided data on social functioning on the GAF scale. Early warning signs intervention was not found to be superior to treatment as usual in improving social functioning (2 RCTs , n = 88, MD 2.51 95% CI ‐3.84 to 8.85). Pooled data showed no heterogeneity (I2 = 0%).
2.2.2 GAF‐DIS (high = good)
One trial with a follow‐up duration of 24 weeks provided data on social functioning on the GAF‐DIS scale. Early warning signs intervention was not found to be superior to treatment as usual in improving social functioning (1 RCT, n = 61, MD ‐6.10, 95% CI ‐12.34 to 0.14).
2.2.3 ILSS (high = good)
One trial with a follow‐up duration of nine months provided data social functioning on the ILSS scale. Early warning signs intervention was not found to be superior to treatment as usual in improving social functioning (1 RCT, n = 84, MD 0.35, 95% CI ‐0.70 to 1.40).
2.2.4 Time budget interview (high = good)
One trial with a follow‐up duration of two years provided data on social functioning using the time budget interview. Early warning signs intervention was not found to be superior to treatment as usual in improving social functioning (1 RCT, n = 224, MD 1.61 95% CI ‐4.04 to 7.25).
2.2.5 SOFAS (high = good)
One trial with a follow‐up duration of two years provided data on social functioning on the SOFAS scale. Early warning signs intervention was not found to be superior to treatment as usual in improving social functioning (1 RCT, n = 236, MD 1.21 95% CI ‐2.71 to 5.13).
2.2.6 SLOF (high = good)
One trial with a follow‐up duration of 18 months provided data on social functioning on the SLOF scale. In contrast to the results on the other scales, early warning signs intervention was found to be superior to treatment as usual in improving social functioning (1 RCT, n = 64, MD 27.50, 95% CI 17.03 to 37.97).
2.2.7 SAS (high = good)
One trial with a follow‐up duration of two years provided data on social functioning on the SOFAS scale. Early warning signs intervention was not found to be superior to treatment as usual in improving social functioning (1 RCT, n = 80, MD ‐0.43 95% CI ‐2.20 to 1.34).
2.2.8 SFS (high = good)
One trial with a follow‐up duration of nine months provided data on social functioning on the SFS scale. Early warning signs intervention was not found to be superior to treatment as usual in improving social functioning (1cluster RCT, n = 56 clusters, MD 4.40, 95% CI ‐3.16 to 11.96).
2.2.9 GAS (high = good)
Three trials with a follow‐up duration of nine months to two years provided data on social functioning on the GAS scale. Early warning signs intervention was not found to be superior to treatment as usual in improving social functioning (2 RCTs, n = 178, and 1 cluster RCT, n = 8 clusters, MD 1.92 95% CI ‐0.54 to 4.38). The pooled results showed no heterogeneity (I2 = 0%).
2.2.10 NOSIE (high = good)
Three trials with a follow‐up duration of nine months to one year provided data on social functioning on the NOSIE scale. Early warning signs intervention was found to be superior to treatment as usual in improving social functioning (2 RCTs, n = 208, 1 cluster RCT, n = 8 clusters, MD 25.12, 95% CI 5.75 to 44.48). The pooled results showed very high heterogeneity (I2 = 96%).
3. Quality of life
3.1 Quality of life: Average scores (various scales)
3.1.2 QLS (high = good)
One trial with a follow‐up duration of one year provided data on mean endpoint score in quality of life on the QLS scale. Early warning signs intervention was not found to be superior to treatment as usual in improving quality of life (1 RCT, n = 46, MD ‐5.05, 95% CI ‐16.12 to 6.02).
3.1.2 LQLP (high = good)
One trial with a follow‐up duration of two years provided data on mean endpoint score in quality of life on the LQLP scale. Early warning signs intervention was not found to be superior to treatment as usual in improving quality of life (1 RCT, n = 48, MD ‐0.40, 95% CI ‐1.30 to 0.50).
3.1.3 EuroQoL (high = good)
One trial with a follow‐up duration of two years provided data on mean endpoint score in quality of life on the EuroQoL scale. Early warning signs intervention was not found to be superior to treatment as usual in improving quality of life (1 RCT, n = 206, MD ‐4.80, 95% CI ‐10.79 to 1.19).
3.1.4 LQoLS (high = good)
One trial with a follow‐up duration of two years provided data on mean endpoint score in quality of life on the EuroQoL scale. Early warning signs intervention was not found to be superior to treatment as usual in improving quality of life (1 RCT, n = 80, MD 0.09 95% CI ‐0.24 to 0.42).
4. Satisfaction with care
4.1 Satisfaction with care: Average scores (various scales)
(Analysis 1.15; Analysis 1.16)
4.1.1 CALPAS (high = good)
One trial with a follow‐up duration of nine months provided data on mean change in satisfaction with care on the CALPAS scale. Early warning signs intervention was found to be superior to treatment as usual in improving satisfaction with care (1 cluster RCT, n = 56 clusters, MD 0.30, 95% CI 0.12 to 0.48).
4.1.2 IAPSRS (high = good)
One trial with a follow‐up duration of 24 weeks provided data on mean endpoint score in satisfaction with care on the IAPSRS scale. Early warning signs intervention was not found to be superior to treatment as usual in satisfaction with care (1 RCT, n = 60, MD 0.10, 95% CI ‐0.11 to 0.31).
4.1.3 VSSS (high = good)
One trial with a follow‐up duration of one year provided data on mean change in satisfaction with care on the VSSS scale. Early warning signs intervention was not found to be superior to treatment as usual in improving satisfaction with care, although the data may be skewed (1 RCT, n = 32, MD 2.15, 95% CI ‐9.66 to 13.96).
5. Adverse events
5.1 Adverse events: 1. Lost to follow‐up
Seventeen trials with follow‐up duration of 10 weeks to two years provided data on the outcome lost to follow‐up (Analysis 1.17). No significant difference was found between early warning signs intervention and treatment as usual in the number of participants lost to follow‐up (17 RCTs, n = 1495, RR 0.96 95% CI 0.72 to 1.28). The pooled data showed no heterogeneity (I2 = 0%).
Shon 2002 also reported data on losses to follow‐up but the length of follow‐up is not stated in the report and so we have not pooled these data. Two participants in the early warning signs intervention group were lost to follow‐up and none in the treatment as usual group.
5.2 Adverse events: 2. Death
Four trials with a follow‐up duration of one to two years provided data on the number of deaths (Analysis 1.18). No significant difference was found between early warning signs intervention and treatment as usual in the number of deaths during the trials (4 RCTs, n = 462, RR 0.91, 95% CI 0.29 to 2.89). The pooled data showed low heterogeneity (I2 = 4%).
6. Knowledge
6.1 Knowledge: 1. Average scores (various scales)
(Analysis 1.19; Analysis 1.20; Analysis 1.21)
6.1.1 KASQ (patients, high = good)
One trial with a follow‐up duration of 24 weeks provided data for this outcome. Early warning signs intervention was not found to be superior to treatment as usual in increasing participants' knowledge about their illness (1 RCT, n = 61, MD 1.60, 95% CI ‐0.84 to 4.04).
6.1.2 IS (patients, high = good)
One trial with a follow‐up duration of 24 weeks provided data for this outcome. Early warning signs intervention was not found to be superior to treatment as usual in increasing participants' knowledge about their illness (1 RCT, n = 40, MD 0.96, 95% CI ‐0.48 to 2.40).
6.1.3 ITAQ (patients, high = good)
Two trials with a follow‐up duration of one year provided data for this outcome. Early warning signs intervention was found to be superior to treatment as usual in increasing participants' knowledge about their illness (2 RCTs, n = 166, MD 7.21, 95% CI 0.94 to 13.48). The pooled data showed very high heterogeneity (I2 = 93%).
6.1.4 SUMD (patients, high = bad)
One trial with a follow‐up duration of one year provided data for this outcome. Early warning signs intervention was not found to be superior to treatment as usual in increasing participants' knowledge about their illness (1 RCT, n = 81, MD ‐1.18, 95% CI ‐2.46 to 0.10).
6.1.5 DAI (patients, high = good)
One trial with a follow‐up duration of one year provided data for this outcome. Early warning signs intervention was not found to be superior to treatment as usual in increasing participants' knowledge about their illness (1 cluster RCT, n = 56 clusters, MD 1.40, 95% CI ‐0.97 to 3.77).
6.1.6 KASI (relatives, high = good)
One trial with a follow‐up duration of one year provided data for this outcome. Early warning signs intervention was found to be superior to treatment as usual in increasing families' knowledge about the illness of their family member (1 cluster RCT, n = 8 clusters, MD 2.83, 95% CI 0.93 to 4.73).
7. Burden of care
7.1 Burden of care: 1. Average scores (FBIS, high = bad)
Two trials with a follow‐up duration of one year and 18 months provided data for the outcome burden of care (Analysis 1.22). Early warning signs intervention was not found to be superior to treatment as usual in reducing the burden of care (2 RCTs, n = 110, MD 3.29, 95% CI ‐8.43 to 15.00). The pooled data showed high heterogeneity (I2 = 87%).
8. Medication compliance
8.1 Medication compliance: Not compliant to medication
Three trials with a follow‐up duration of nine months to one year provided data for the outcome medication compliance, although Kopelowicz 2003 only reports data post‐intervention and not at nine months (Analysis 1.23). Early warning signs training was found to be superior to treatment as usual in improving medication compliance (4 RCTs, n = 374, MD 0.57 95% CI 0.42 to 0.77). The pooled data showed no heterogeneity (I2 = 0%). Xiang 2001 also reported data on mean number of missed doses, but the data were skewed (see Table 1).
9. Economic burden (cost of care)
Two studies presented data on cost of care. Kuipers 1997 showed no significant difference between the mean cost of care for the early warning signs training group and standard care group. McDonell 2006 found that the mean costs of care were less in the early warning signs group than the standard psychiatric group, but the data could not be analysed as no standard deviations were reported. See Table 1 for details.
10. Subgroup analysis
10.1 Relaspe: Time to first relapse
Time taken to relapse after treatment was longer when early warning signs intervention compared to treatment as usual was delivered to patients only (3 RCTs, n = 372, HR 0.26, 95% CI 0.13 to 0.53). In contrast, there was no difference in the time taken to relapse when early warning signs intervention was delivered to both the patients and their carer/health professional (3 RCTs, n = 178, HR 1.00 95% CI 0.59 to 1.68). The pooled results showed low heterogeneity (I2 = 35% and 15%, respectively).
10.2 Relapse: Rate of relapse
Early warning signs intervention was found to be superior to treatment as usual in preventing relapses when the intervention was delivered only to the patients (8 RCTs, n = 933, RR 0.43, 95% CI 0.20 to 0.92), but showed high heterogeneity (I2 = 89%). In contrast, there was no significant difference where the training was delivered to both the patients and their carer/health professional (6 RCTs, n = 491, RR 0.68 95% CI 0.46 to 1.02), or to only the family or the health professionals caring for the patients (2 RCTs, n = 78, RR 0.58 95% CI 0.24 to 1.37). These results showed moderate or no heterogeneity (I2 = 0% and 63%, respectively).
10.3 Service use: Time to re‐hospitalisation
Time to re‐hospitalisation after treatment was longer when early warning signs intervention was delivered to both the patients and their carer/health professional compared to treatment as usual (3 RCTs, n = 740, HR 0.62, 95% CI 0.46 to 0.83), but showed high heterogeneity (I2 = 89%). In contract, there was no difference in the time taken to relapse when early warning signs intervention was delivered to patients only (3 RCTs, n = 409, HR 0.37 95% CI 0.07 to 1.95). These results showed no heterogeneity (I2 = 0%).
10.4 Service use: Rate of re‐hospitalisation
Early warning signs intervention was found to be superior to treatment as usual in preventing re‐hospitalisation when the intervention was delivered only to the patients (7 RCTs, n = 791, RR 0.30, 95% CI 0.14 to 0.66), but showed high heterogeneity (I2 = 80%); or when early warning signs training was delivered to both the patients and their carer/health professional (7 RCTs, n = 625, RR 0.64 95% CI 0.51 to 0.79), these results showed no heterogeneity (I2 = 0%). In contrast, there was no significant difference where the training was delivered to only the family or the health professionals caring for the patients (1 RCT, n = 41, RR 0.53 95% CI 0.15 to 1.82).
11. Sensitivity analysis
All studies were described as randomised and we did not have to make assumptions regarding missing SDs data so sensitivity analyses were not undertaken for these reasons.
11.1 Imputed data
11.1.1 Relapse: Time to relapse
When the data that was imputed were removed from the analysis there remains no significant difference in the length of time taken to relapse between early warning signs training and treatment as usual (2 RCTs, n = 226, HR 0.60 95% CI 0.14 to 2.59).
11.1.2 Service use: Time to re‐hospitalisation
When the data that was imputed were removed from the analysis there remains no significant difference in the length of time taken to re‐hospitalisation between early warning signs training and treatment as usual (3 RCTs, n = 258, HR 0.87 95% CI 0.41 to 1.83).
Discussion
Summary of main results
The summary below reflects the outcomes chosen for the summary of findings Table for the main comparison, and considered the main findings of this review that can support evidence‐based decision making. Nine studies reported an improvement in general mental state suggesting that early warning signs intervention is not associated with an increase in depressive symptoms (Dixon 1998) as we had postulated before undertaking the review. For all outcomes included in the 'Summary of findings' tables, the quality of evidence was found to be very low. Overall, 32 randomised controlled trials and two cluster randomised trials were identified that met our criteria for an early warning signs intervention in schizophrenia. The studies were conducted over varying time periods with differing periods of follow‐up and the actual interventions themselves were of varying lengths, from two weeks to three years. This made comparing the data difficult.
Rate of relapse and rate of re‐hospitalisation: We found significant differences in favour of early warning signs interventions in the number of participants relapsing and the number of participants being re‐hospitalised. The results are highly heterogeneous, which is not explained by differences in the populations, although the heterogeneity is higher for studies where the intervention was delivered only to patients. Weng 2005 had a much shorter duration of follow‐up than the other included trials of two months, but removing this study does not explain the heterogeneity. The heterogeneity may be related to the differences in the nature of the interventions and the length of time over which they were delivered.
Time to relapse and time to re‐hospitalisation: Much of the data for these outcomes needed to be imputed as it was not reported in the studies in a way that could be added to the meta‐analysis. No significant differences were found in the length of time taken to for participants to relapse or to be re‐hospitalised. There was high heterogeneity in the results. For time to relapse, this is probably due to differences in the populations, as subgroup analyses show that when the early warning sign interventions are delivered to patients only, the intervention does significantly increase the length of time before relapsing.
Only three studies reported on satisfaction with care. Two randomised controlled trials (RCTs) found no significant difference in satisfaction with care between early warning signs training and treatment as usual (although one may have skewed data), and one cluster RCT did find a significant difference in favour of early warning signs training. We found no evidence of a difference in losses to follow‐up between the treatment groups. Two studies report on costs of care, but not in a form that could be added to the meta‐analysis. One showed no significant difference between the mean cost of care for the early warning signs training group and standard care group, although the data were skewed. In contrast, another found that the mean costs of care were less in the early warning signs group ($1641) than the standard psychiatric group ($5199).
Nine studies reported an improvement in general mental state suggesting that early warning signs intervention is not associated with an increase in depressive symptoms (Dixon 1998) as we had postulated before undertaking the review.
Overall completeness and applicability of evidence
1. Completeness
Most studies reported at least one primary outcome. Many of the trials did not present usable data, such as means or SDs, or the data was from un‐validated scales. The results for time to relapse and time to re‐hospitalisation have to be treated with some caution as we had to impute data from 58% of the studies because of incomplete reporting of these outcomes. The studies often used different assessment scales and there is no agreement currently on how comparisons can be made between these scales for people suffering from schizophrenia. Therefore, we were unable to pool some of the data, which reduces the possibility of detecting a treatment effect. Very few studies reported data for satisfaction with care, quality of life, medication compliance and economic burden.
2. Applicability
Included studies of early warning signs interventions have international applicability because they have been conducted in many European countries (including United Kingdom), Asia (China, Japan, Korea), Australia and North America. All studies have been carried out in both genders and in the age range 16 to 65 years so the results cannot be generalised to children, adolescents or the elderly. It is unclear to what extent the results can be generalised to people with schizophrenia with comorbid personality disorder, axis 1 disorder, substance use disorders or medical comorbidity because most studies did not report if people with these conditions were included or not.
One limitation of the applicability of the results of the review is that only one study examined the effectiveness of early warning signs interventions alone without any other psychological intervention being applied at the same time. This study (Van Meijel 2006) found a positive benefit of early warning signs intervention on rate of relapse of the similar effect size as the overall review but did not report outcomes such as hospitalisation, social functioning and mental state. Therefore, the only conclusions that can be drawn from the review are on the overall effectiveness of psychological interventions incorporating early warning signs interventions and it is currently unclear how many of the benefits of these interventions can be attributed to training to recognise and manage early warning signs as opposed to other psychological intervention techniques. We also had no data to draw any conclusions concerning the effectiveness of early warning signs interventions coupled with intermittent medication alongside lower dose maintenance antipsychotic medication.
Six studies (Chen 2003; Shon 2002; Weng 2005; Xiang 2001; Zhan 2003; Zhang 2004) examined the medication management and symptom management skills training modules, based on Liberman’s Social Skills training for schizophrenic patients (Liberman 1998), which includes early warning signs training. These showed positive results for time to relapse, rate of relapse, time to hospitalisation, and rate of re‐hospitalisation, some of which were outliers in the data. These studies were conducted mostly in China. Liberman 1998, which was conducted in the USA, did not report these outcomes.
Quality of the evidence
The quality of the current evidence is very low based on GRADE. Most studies did not address incomplete data adequately. Only 14 of the 34 included studies described an adequate sequence generation, and only six described the methods used to conceal allocation. Although it is not possible with this type of intervention to blind participants, only 15 studies used assessors that were blind to treatment allocation.
A matter of concern in relation to the robustness of our findings is that much of the provided primary outcome data for time to relapse and time to hospitalisation could not be directly used in the meta‐analysis and needed to be imputed. One could argue that this may be due to selective reporting of outcome measures and thereby introducing bias. Furthermore, the results are limited to the extent of follow‐up from the trials (Tierney 2007), which was no more than two years for these outcomes, and therefore there is only limited information about the long‐term effects of early warning signs interventions. Rates of relapse and re‐hospitalisation are also reported at varying time lengths depending on duration of the study, hence compromising comparability.
Potential biases in the review process
A thorough search strategy was used in this review. There may still be gaps in the search strategy such as unpublished data (grey literature), which are difficult to get hold of. We included studies where we were confident that an early warning signs intervention had been attempted. Some trials did not give precise descriptions of the nature of the psychological intervention tested and we did not get a response when we wrote to some authors for clarification.
For most outcomes we are not able to tell if there was publication bias, as no more than 11 trials reported data for these, and a funnel plot could not be performed. For rate of relapse, there does not appear to be publication bias, although for rate of re‐hospitalisation and losses to follow‐up there appears to be publication bias as the funnel plot indicates that there may be the equivalent number of 'negative' trials that have not been included in this analysis.
Agreements and disagreements with other studies or reviews
We do not know of any other systematic reviews on this topic.

'Risk of bias' graph: review authors' judgements about each risk of bias item presented as percentages across all included studies.

'Risk of bias' summary: review authors' judgements about each risk of bias item for each included study.

Comparison 1 EARLY WARNING SIGNS TRAINING + TAU versus TREATMENT AS USUAL (TAU), Outcome 1 Relapse: 1. Relapse.
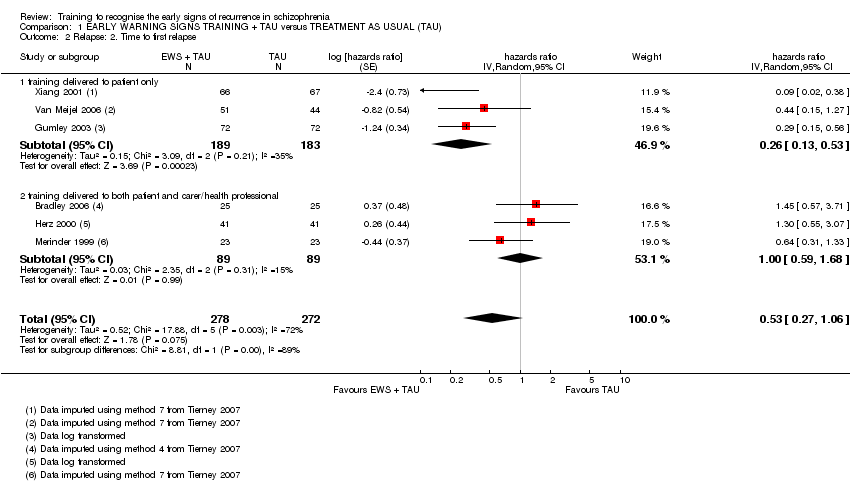
Comparison 1 EARLY WARNING SIGNS TRAINING + TAU versus TREATMENT AS USUAL (TAU), Outcome 2 Relapse: 2. Time to first relapse.

Comparison 1 EARLY WARNING SIGNS TRAINING + TAU versus TREATMENT AS USUAL (TAU), Outcome 3 Service use: 1a. Re‐hospitalisation.
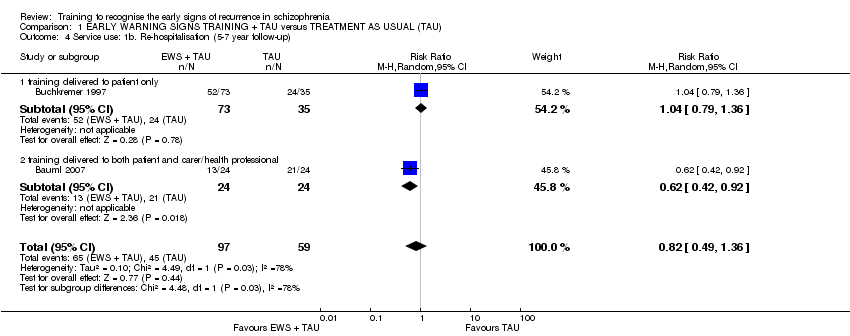
Comparison 1 EARLY WARNING SIGNS TRAINING + TAU versus TREATMENT AS USUAL (TAU), Outcome 4 Service use: 1b. Re‐hospitalisation (5‐7 year follow‐up).

Comparison 1 EARLY WARNING SIGNS TRAINING + TAU versus TREATMENT AS USUAL (TAU), Outcome 5 Service use: 2. Time to re‐hospitalisation.
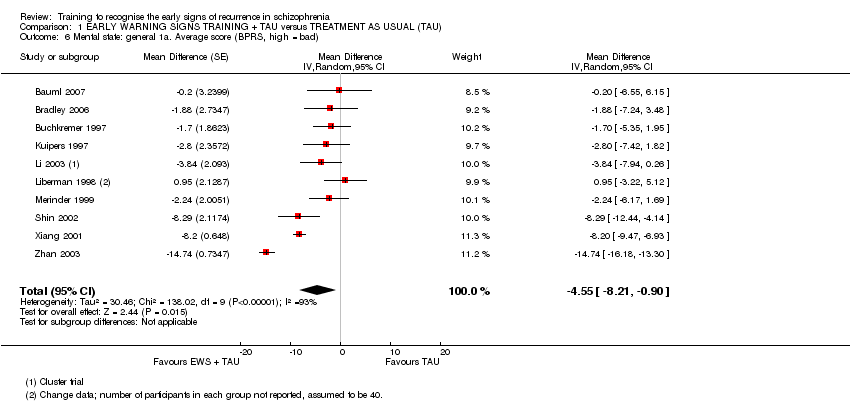
Comparison 1 EARLY WARNING SIGNS TRAINING + TAU versus TREATMENT AS USUAL (TAU), Outcome 6 Mental state: general 1a. Average score (BPRS, high = bad).

Comparison 1 EARLY WARNING SIGNS TRAINING + TAU versus TREATMENT AS USUAL (TAU), Outcome 7 Mental state: general 1b. Average score (PANSS, high = bad).

Comparison 1 EARLY WARNING SIGNS TRAINING + TAU versus TREATMENT AS USUAL (TAU), Outcome 8 Mental state: general 1c. Average score (KGV, high = bad).
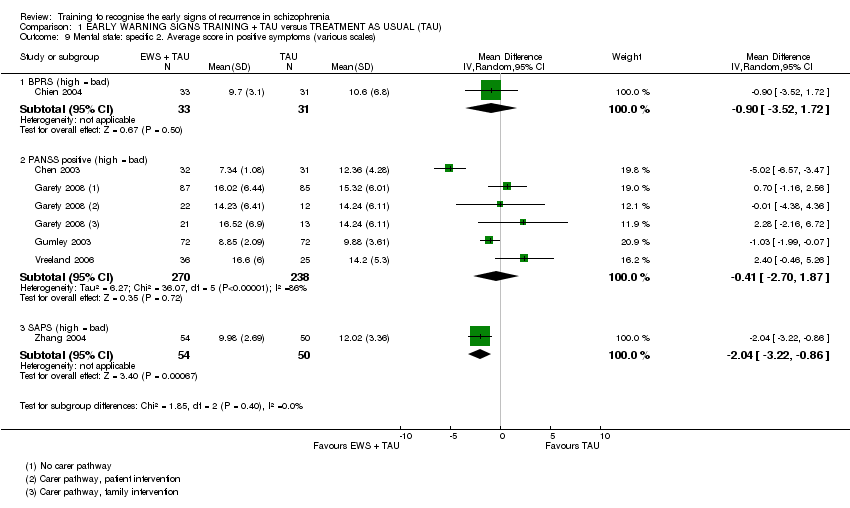
Comparison 1 EARLY WARNING SIGNS TRAINING + TAU versus TREATMENT AS USUAL (TAU), Outcome 9 Mental state: specific 2. Average score in positive symptoms (various scales).

Comparison 1 EARLY WARNING SIGNS TRAINING + TAU versus TREATMENT AS USUAL (TAU), Outcome 10 Mental state: specific 3. Average score in negative symptoms (various scales).

Comparison 1 EARLY WARNING SIGNS TRAINING + TAU versus TREATMENT AS USUAL (TAU), Outcome 11 Social functioning: 1a. Not employed.
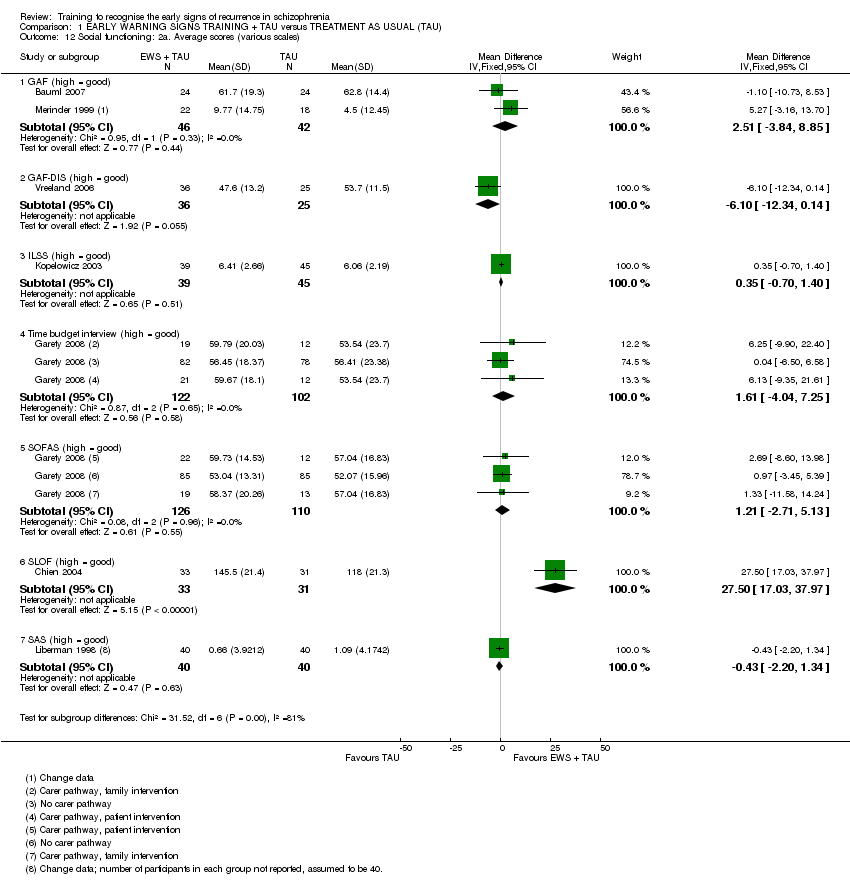
Comparison 1 EARLY WARNING SIGNS TRAINING + TAU versus TREATMENT AS USUAL (TAU), Outcome 12 Social functioning: 2a. Average scores (various scales).
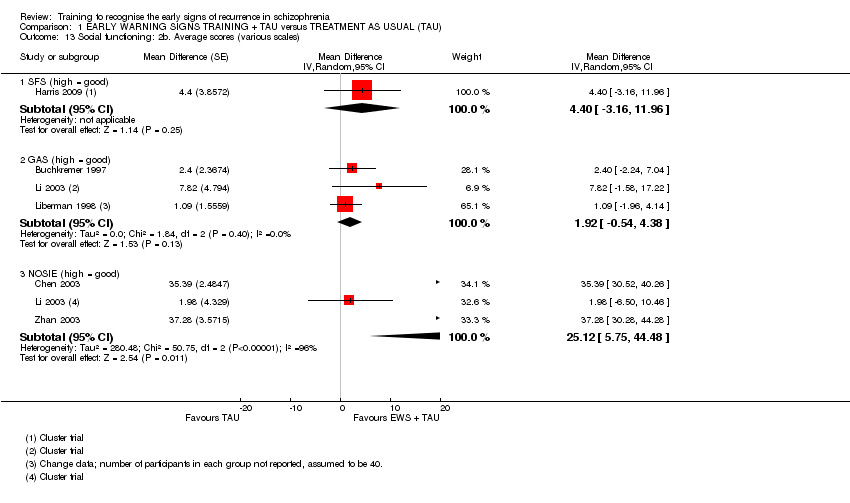
Comparison 1 EARLY WARNING SIGNS TRAINING + TAU versus TREATMENT AS USUAL (TAU), Outcome 13 Social functioning: 2b. Average scores (various scales).
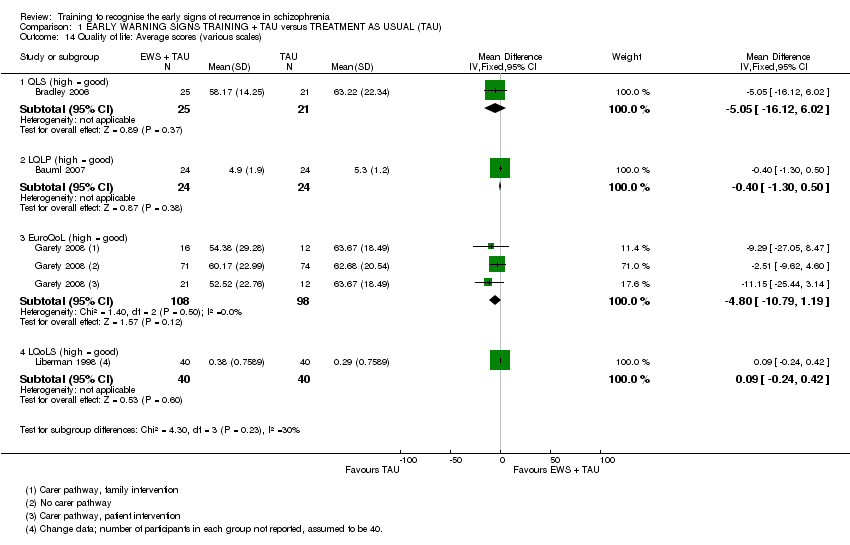
Comparison 1 EARLY WARNING SIGNS TRAINING + TAU versus TREATMENT AS USUAL (TAU), Outcome 14 Quality of life: Average scores (various scales).

Comparison 1 EARLY WARNING SIGNS TRAINING + TAU versus TREATMENT AS USUAL (TAU), Outcome 15 Satisfaction with care: 1a. Average endpoint scores (various scales).

Comparison 1 EARLY WARNING SIGNS TRAINING + TAU versus TREATMENT AS USUAL (TAU), Outcome 16 Satisfaction with care: 1b. Average change scores (various scales).
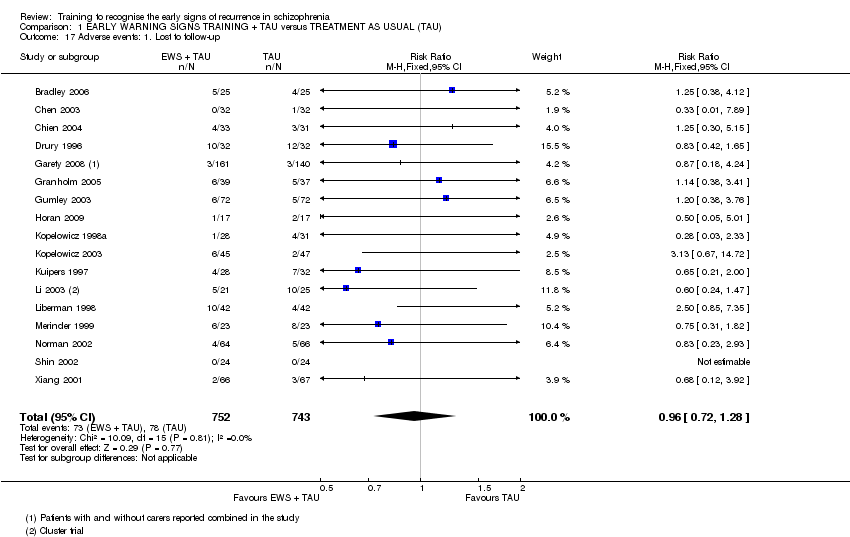
Comparison 1 EARLY WARNING SIGNS TRAINING + TAU versus TREATMENT AS USUAL (TAU), Outcome 17 Adverse events: 1. Lost to follow‐up.

Comparison 1 EARLY WARNING SIGNS TRAINING + TAU versus TREATMENT AS USUAL (TAU), Outcome 18 Adverse events: 2. Death.

Comparison 1 EARLY WARNING SIGNS TRAINING + TAU versus TREATMENT AS USUAL (TAU), Outcome 19 Knowledge: 1a. Average scores (various scales).
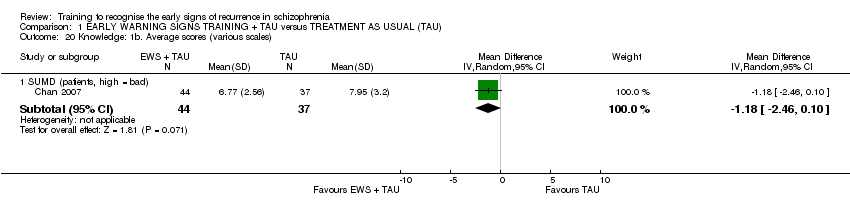
Comparison 1 EARLY WARNING SIGNS TRAINING + TAU versus TREATMENT AS USUAL (TAU), Outcome 20 Knowledge: 1b. Average scores (various scales).
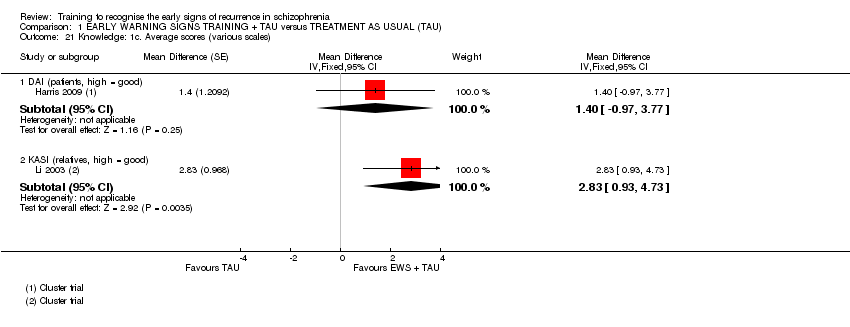
Comparison 1 EARLY WARNING SIGNS TRAINING + TAU versus TREATMENT AS USUAL (TAU), Outcome 21 Knowledge: 1c. Average scores (various scales).

Comparison 1 EARLY WARNING SIGNS TRAINING + TAU versus TREATMENT AS USUAL (TAU), Outcome 22 Burden of care: 1. Average scores (FBIS, high = bad).

Comparison 1 EARLY WARNING SIGNS TRAINING + TAU versus TREATMENT AS USUAL (TAU), Outcome 23 Medication compliance: Not compliant to medication.
| Early warning signs training and treatment as usual compared to treatment as usual for schizophrenia | ||||||
| Patient or population: patients with schizophrenia | ||||||
| Outcomes | Illustrative comparative risks* (95% CI) | Relative effect | No of Participants | Quality of the evidence | Comments | |
| Assumed risk | Corresponding risk | |||||
| Treatment as usual | Early warning signs training and treatment as usual | |||||
| Relapse: Rate of relapse | 432 per 1000 | 229 per 1000 | RR 0.53 | 1502 | ⊕⊝⊝⊝ | |
| Relapse: Time to relapse | See comment | See comment | HR 0.53 | 550 | ⊕⊝⊝⊝ very low2, 3, 4 | The data were added to the meta‐analysis as generic inverse variance. |
| Service use: Rate of re‐hospitalisation | 385 per 1000 | 185 per 1000 | RR 0.48 | 1457 | ⊕⊝⊝⊝ | |
| Service use: Time to re‐hospitalisation | See comment | See comment | HR 0.58 | 1149 | ⊕⊝⊝⊝ | The data were added to the meta‐analysis as generic inverse variance. |
| Satisfaction with care | See comment | See comment | Not estimable | See comment | ⊕⊝⊝⊝ | 2 RCTs (92 participants) and 1 cluster RCT (56 clusters) report on satisfaction with care.10 |
| Adverse events: Lost to follow‐up | 105 per 1000 | 101 per 1000 | RR 0.96 | 1495 | ⊕⊝⊝⊝ | |
| Economic burden (cost of care) | See comment | See comment | Not estimable | 129 | ⊕⊝⊝⊝ | Two studies report on costs of care, but data could not be pooled.15 |
| *The basis for the assumed risk (e.g. the median control group risk across studies) is provided in footnotes. The corresponding risk (and its 95% confidence interval) is based on the assumed risk in the comparison group and the relative effect of the intervention (and its 95% CI). | ||||||
| GRADE Working Group grades of evidence | ||||||
| 1Eight studies had an unclear risk of bias for sequence generation and 13 for allocation concealment. One study did not use assessors that were blinded and in seven it was unclear. Eight studies had an unclear risk of bias for attrition and two studies had received funding from industry. 2There was high heterogeneity in the pooled results. 3The 95% confidence intervals are wide and include both significant benefit and harm of the intervention. 4The data were not provided for most studies and had to be imputed. Three studies had an unclear risk of bias for random sequence generation and all studies had an unclear risk for allocation concealment. In one study the assessors were not blinded and in another the risk of bias for blinding was unclear. In three studies there was an unclear risk of bias for attrition. 5The data were not provided for most studies and had to be imputed. Two studies had an unclear risk of bias for random sequence generation and two were unclear for allocation concealment. One study did not have assessors that were blinded and in another it was unclear. Three studies had an unclear risk of attrition bias. One study was funded by industry. 6Nine studies had an unclear risk of bias for sequence generation and 12 for allocation concealment. One study did not use assessors that were blinded and in seven it was unclear. One study had a high risk of attrition bias and eight studies had an unclear risk of bias for attrition. One study had received funding from industry. 7The funnel plot indicates that there may be the equivalent number of ’negative’ trials that have not been included in this analysis. 8Two studies had an unclear risk of bias for sequence generation and three for allocation concealment. One study did not use blind assessors and one study had an unclear risk of bias for attrition. Two studies were part funded by industry. 9Only three studies reported this outcome. 10The two RCTs found no significant difference in satisfaction with care between early warning signs training and treatment as usual, although the data may be skewed for one trial. The cluster RCT did find a significant difference in favour of early warning signs training. 11Ten studies had an unclear risk of bias for sequence generation and fifteen for allocation concealment. One study did not use assessors that were blinded and in seven it was unclear. One study had a high risk of attrition bias and eight studies had an unclear risk of bias for attrition. Two studies had received funding from industry. 12One study had skewed data and the other did not report SDs. 13The two studies found very different results. 14This outcome included relatively few participants. 15Kuipers 1997 showed no significant difference between the mean cost of care for the early warning signs training group and standard care group, but the data was skewed. McDonell 2006 found that the mean costs of care were less in the early warning signs group ($1641) than the standard psychiatric group ($5199), no SDs were reported. 16 Some indication of publication bias from funnel plot. | ||||||
| Outcome | Study | Results |
| Mental state: average score in positive symptoms (PAS positive, high = bad) | The early warning signs group (N = 20) had a mean of 2.06 (SD 2.57) and the control group (N = 20) had a mean of 4.59 (SD 2.72). | |
| Mental state: average score in positive symptoms (PAS negative, high = bad) | The early warning signs group (N = 20) had a mean of 1.33 (SD 1.8) and the control group (N = 20) had a mean of 1.71 (SD 2.2). | |
| Social functioning: average score (REHAB scale, high = bad) | The early warning signs group (N = 14) had a mean of 18.2 (SD 13) and the control group (N = 15) had a mean of 32.5 (SD 22.7). | |
| Social functioning: average score (HoNOS scale, high = bad) | The early warning signs group (N = 25) had a mean of 9.26 (SD 4.63) and the control group (N = 24) had a mean of 7.66 (SD 4.85). | |
| Social functioning: average score (SDSS, high = bad) | The early warning signs group (N = 31) had a mean of 4.04 (SD 3.89) and the control group (N = 31) had a mean of 7.63 (SD 4.27). | |
| Social functioning: average score (SDSS, high = bad) | The early warning signs group (N = 54) had a mean of 4.8 (SD 3) and the control group (N = 50) had a mean of 9.8 (SD 3.9). | |
| Social functioning: average months of employment | The early warning signs group (N = 30) had a mean of 7.83 (SD 3) and the control group (N = 28) had a mean of 4.64 (SD 7.39). | |
| Burden of care: average score (FBIS, high = bad) | The early warning signs group (N= 24) had a mean of 18.95 (SD 15.39) and the control group (N = 22) had a mean of 9.38 (SD 8.1). | |
| Burden of care: average score (FAS, high = good) | The early warning signs group (N = 46) had a mean of 21 (SD 14.54) and the control group (N = 55) had a mean of 25.15 (SD 20). | |
| Mean number of missed doses | The early warning signs group had a mean of 0.2 missed doses (SD 0.6) and the control group had a mean of 4.7 missed doses (SD 2.2). | |
| Economic burden (cost of care) | The early warning signs training group had a mean care package cost of £1220 (SD 736) and the standard treatment group had a mean care package cost of £1403 (SD 887) after 18 months follow‐up. There was no significant difference between the costs. | |
| Economic burden (cost of care) | The mean cost of inpatient service utilisation was $5199 for the standard psychiatric care group and $1641 for the early warning signs training group at 3 years post‐randomisation. | |
| FAS: Family Attitude Scale | ||
| Study ID | EWS as primary focus | EWS delivered to patient only | EWS delivered to patient and carer/ health worker | EWS delivered to carer/ health worker only | EWS delivered individually | EWS delivered in groups | EWS promoting only help seeking from others | EWS promoting additional self‐directed coping |
| ✗ | ✓ | ✗ | ✗ | ✗ | ✓ | ✗ | ✓ | |
| ✗ | ✗ | ✓ | ✗ | ✗ | ✓ | ✗ | ✓ | |
| ✗ | ✗ | ✓ | ✗ | ✗ | ✓ | ✗ | ✓ | |
| ✗ | ✓ | ✗ | ✗ | ✗ | ✓ | ✗ | ✓ | |
| ✗ | ✓ | ✗ | ✗ | not reported | not reported | ✗ | ✓ | |
| ✗ | ✓ | ✗ | ✗ | not reported | not reported | ✗ | ✓ | |
| ✗ | ✗ | ✓ | ✗ | ✗ | ✓ | ✗ | ✓ | |
|
✗ | ✗ | not reported | ✗ | ✓ | ✓ | ✗ | ✓ | |
| ✓ | ✓ (CBT) | ✗ | ✓ (family intervention) | ✓ (CBT) | ✓ (family intervention) | no (CBT) yes (family intervention) | ✓ (CBT) no (family intervention) | |
| ✗ | ✓ | ✗ | ✗ | ✗ | ✓ | ✗ | ✓ | |
| ✗ | ✓ | ✗ | ✗ | ✓ | ✗ | ✗ | ✓ | |
| ✗ | ✗ | ✗ | ✓ | ✓ | ✗ | ✗ | ✓ | |
| ✓ | ✗ | ✓ | ✗ | ✗ | ✓ | ✗ | ✓ | |
| ✗ | ✗ | ✓ | ✗ | ✗ | ✓ | ✗ | ✓ | |
| ✗ | ✓ | ✗ | ✗ | ✗ | ✓ | ✗ | ✓ | |
| ✗ | ✓ | ✗ | ✗ | ✗ | ✓ | ✗ | ✓ | |
| ✗ | ✗ | ✓ | ✗ | ✗ | ✓ | ✗ | ✓ | |
| ✗ | ✓ | ✗ | ✗ | ✓ | ✗ | ✗ | ✓ | |
| ✗ | ✗ | ✗ | ✓ | ✓ | optional | ✗ | ✗ | |
| ✗ | ✓ | ✗ | ✗ | ✓ | ✓ | ✗ | ✓ | |
| ✗ | ✗ | ✓ | ✗ | ✗ | ✓ | ✗ | ✓ | |
| ✗ | ✗ | ✓ | ✗ | ✗ | ✓ | ✗ | ✓ | |
| ✗ | ✓ | ✗ | ✗ | ✓ | ✓ | ✗ | ✓ | |
| ✗ | ✓ | optional | ✗ | ✓ | ✓ | ✗ | ✓ | |
| ✓ | ✓ | ✗ | ✗ | unclear | ✓ | ✗ | ✓ | |
| ✓ includes cognitive therapy | ✓ | ✗ | ✗ | ✓ | ✗ | ✓ | ✗ | |
| ✗ | ✗ | ✓ | ✗ | ✓ | ✗ | ✗ | ✓ | |
| ✓ | ✓ | ✗ | ✗ | ✓ | ✗ | ✗ | ✓ | |
| ✗ | ✓ | ✗ | ✗ | ✗ | ✓ | ✗ | ✓ | |
| ✗ | ✓ | ✗ | ✗ | ✗ | ✓ | ✗ | ✓ | |
| ✗ | ✓ | ✗ | ✗ | ✗ | ✓ | ✗ | ✓ | |
| ✗ | ✗ | ✓ | ✗ | ✓ | ✓ | ✗ | ✓ | |
| ✗ | ✓ | ✗ | ✗ | not reported | not reported | ✗ | ✓ | |
| ✗ | ✗ | ✓ | ✗ | ✓ | ✓ | ✗ | ✓ | |
| CBT: cognitive behavioural therapy | ||||||||
| Study ID | Focus of intervention | At least one hour/ session focus on EWS | EWS intervention delivered by | No. of sessions | Control group |
| Community re‐entry program | yes | Ward Nurses | 18 one‐hour sessions | Occupational rehabilitation | |
| Psychoeducation of patients and relatives (reduce re‐hospitalisation and improve compliance) | yes | Psychiatrist or clinical psychologist | 8 one‐hour groups, 4 sessions weekly and 4 monthly 8 bi‐weekly 90‐minute sessions for relatives | Outpatient treatment, antipsychotic medication | |
| Multiple family group treatment | yes | Psychoeducation:Psychiatrist, psychologists, social workers, occupational therapists Family groups: Therapists | 3 single family joining sessions. 2 half‐day psychoeducation sessions. Multiple family group fortnightly for 12 months | Appointments with case manager and doctor for medication and individual psychosocial rehabilitation. Family contact as required | |
| Psychoeducational medication training and key person counselling | yes | Project staff | 10 sessions, first 5 at weekly intervals and 5 at fortnightly intervals | 1.Cognitive psychotherapy: 7 sessions weekly and 8 sessions fortnightly 2. Leisure time group activities led by students of psychology or educational sociology | |
| Psychoeducation & relapse prevention | no | Occupational therapist | Ten 50‐minute sessions over two weeks for patients | Traditional ward occupational therapy including work, rest, leisure activities | |
| Medication & symptom management training programme | not reported | Not reported | Not reported | Antipsychotic therapy | |
| Psychoeducation | yes | Trained psychiatric nurses | 12 bi‐weekly 2‐hour sessions over 6 months for patients and families together | 1. Mutual support group for families only 2. Standard outpatient care | |
| Cognitive Therapy | No | Not reported | 8 hours a week – four individual and four group sessions, 2 sessions with family engagement | Recreation therapy, leisure and social activities outside the ward | |
| CBT or family intervention | No | Each session with 2 therapists ‐ mix of doctoral clinical psychologists and nurses all trained in CBT | 9 months (intended minimum 12 months, max 20 months) – 1‐hour sessions with a mean number of 14.3 session | TAU‐ standard of care delivered according to national and local service protocols including antipsychotic medication. | |
| Cognitive behavioural skills training | Yes | Each session led by 2 therapists ‐ mix of doctoral or senior graduate level psychologists | 24 two‐hour weekly group sessions | TAU – continuation of prior treatment | |
| Targeted CBT for relapse | yes | Clinical psychologist | 5 session engagement phase between 0‐12 weeks; intensive targeted phase (2‐3 sessions per week) after for 12 months | Ongoing medication, regular psychiatric review, follow‐up from a key worker, access to multidisciplinary community mental health team | |
| Medication management training programme | yes | Not reported | Community mental health professionals (CMHPs; nurses, occupational therapists, social workers) received a 10‐day programme: 3 days assessment training, followed by seven fortnightly study days. These were followed by 1‐hour individual supervision sessions, at the CMHP’s workplace, every month for 6 months, giving a total educational input of 9 months. | Waiting list | |
| Relapse prevention | yes | Master's level nurse clinician or certified social worker | One‐hour weekly supportive group therapy OR 30‐45‐minute individual supportive therapy 90‐minute multifamily psychoeducation groups bi‐weekly for 6 months and monthly after | Individual supportive therapy and medication management biweekly for 15‐30 minutes | |
| Personal therapy (relapse prevention) and/or family therapy (psychoeducation/ management) | yes | Personal and family therapy: master's level psychiatric nurse clinical specialists and doctoral‐ level clinical psychologists | 30‐45‐minute weekly for about 3 years 1.9 additional monthly medication management sessions | Supportive therapy | |
| Symptom management | yes | Not reported | 12 one‐hour groups that met twice weekly | Social cognitive intervention | |
| Community re‐entry program | yes | 2 trainers per session – from a multi‐disciplinary staff of 10 | Eight 45‐minute group sessions, twice a day for 4 days in a week. | Occupational therapy | |
| Family assisted skills training program | yes | Nurses, psychologists and social workers | 90‐minute sessions four times per week for 3 months. Weekly group sessions with families included | Case management by social workers and monthly 20‐minute psychiatric visits to see a psychiatrist | |
| CBT | Yes | Therapist | Weekly sessions that become fortnightly‐ up to one hour and up to nine months | Standard care‐ case management and medication | |
| Comprehensive patient/ family education guide (CP/FEG) | yes | Ward Nurses | In hospital‐ Patient 8 hours; family member 36 hours. Post‐discharge‐ patient and family member 2 hours per month for 3 months. | Not reported | |
| Social and Independent Living Skills Program consisting of basic conversation, recreation for leisure, medication management, and symptom management | yes | Occupational therapist and paraprofessionals | 6 months of intensive, clinic‐based treatment 3 hours a day, 4 days per week. | Psychosocial occupational therapy | |
| Multiple family group treatment | yes | clinicians | 24 sessions in year 1 and 12 sessions in year 2 | Outpatient services: medication management, case management, phone consultation, crisis services, group psychotherapy, occupational therapy, individual psychotherapy | |
| Patient and relative psychoeducation | yes | not stated | 8 weekly sessions separately for patients and relatives | Psychopharmacological treatment, psychosocial rehabilitation efforts, some supportive psychotherapy | |
| Stress management program | yes | Nurse case managers | 12 weeks of group sessions, and 12 individual sessions | Social activities program similar in frequency and length to treatment group | |
| Psychoeducational group program with individual supportive therapy | yes | Group sessions – psychiatric social worker Individual sessions – Master’s degree student | 10 weekly group sessions (90 minutes each) & individual sessions (45 minutes each) | Individual supportive therapy | |
| Self management educational group | Yes | 2 psychiatric nurses & 2 social workers | 12 group sessions (70 minutes each) | Non‐equivalent control group ‐ undefined | |
| EWS recognition and targeted cognitive therapy | yes | Therapist | 5 one‐hour sessions on initial engagement and formulation Early signs monitoring questionnaire dispatched fortnightly for an average of 10 months Targeted cognitive therapy, intensive for a brief period, about 2‐3 sessions per week | Routine appointments with psychiatrist and key worker (community psychiatric worker, social worker or occupational therapist) | |
| Modify patient's condition and family approach | yes | Trained Community Psychiatric Nurse | up to 6 hour‐long sessions of CBT and/or 3 sessions with carer | Care of community mental health teams | |
| Relapse prevention plan using EWS monitoring | yes | Trained nurses | Therapy for a total of mean (SD) 155 (94) days | Care as usual | |
| Psychiatric rehabilitation | yes | Interdisciplinary teams | 2 months, possibly weekly sessions | Standard inpatient services and activities | |
| Medication & symptom management training programme | yes | Psychiatrist and a psychologist | 90 to 120‐minute sessions, 3 sessions per week for 20 weeks | Antipsychotic medication and standard psychological intervention | |
| Family based intervention | yes | Clinicians | 1. Introduction‐ two to three 45‐minute sessions‐ family +/‐ patient 2. Monthly 45‐minute counselling with patient (average 8.1 contacts per year) and family and 90 minute family group 3. Maintenance‐ families seen once in 2‐3 months and monthly group meetings up to 18 months | 2‐3 months of medication post discharge +/‐ out patient follow‐up | |
| Medication & symptom management training programme | yes | Psychiatrist and a psychologist | 60 to 90 minutes per session, 1 session per week for 12 weeks | Pharmacotherapy and standard psychological intervention | |
| Life skills, medication & symptom management training programme | yes | Psychiatrist and psychiatric nurse | Group training for 90 to 120 minutes, 2 times a week. Then community follow‐up by nurses, number of sessions not reported | Conventional rehabilitation service (outpatient follow‐up every 3 months, or telephone counselling as needed) |
| Outcome or subgroup title | No. of studies | No. of participants | Statistical method | Effect size |
| 1 Relapse: 1. Relapse Show forest plot | 15 | 1502 | Risk Ratio (M‐H, Random, 95% CI) | 0.53 [0.36, 0.79] |
| 1.1 training delivered to patient only | 8 | 933 | Risk Ratio (M‐H, Random, 95% CI) | 0.43 [0.20, 0.92] |
| 1.2 training delivered to carer/health professional only | 2 | 78 | Risk Ratio (M‐H, Random, 95% CI) | 0.58 [0.24, 1.37] |
| 1.3 training delivered to both patient and carer/health professional | 6 | 491 | Risk Ratio (M‐H, Random, 95% CI) | 0.68 [0.46, 1.02] |
| 2 Relapse: 2. Time to first relapse Show forest plot | 6 | 550 | hazards ratio (Random, 95% CI) | 0.53 [0.27, 1.06] |
| 2.1 training delivered to patient only | 3 | 372 | hazards ratio (Random, 95% CI) | 0.26 [0.13, 0.53] |
| 2.2 training delivered to both patient and carer/health professional | 3 | 178 | hazards ratio (Random, 95% CI) | 1.00 [0.59, 1.68] |
| 3 Service use: 1a. Re‐hospitalisation Show forest plot | 15 | 1457 | Risk Ratio (M‐H, Random, 95% CI) | 0.48 [0.35, 0.66] |
| 3.1 training delivered to patient only | 7 | 791 | Risk Ratio (M‐H, Random, 95% CI) | 0.30 [0.14, 0.66] |
| 3.2 training delivered to carer/health professional only | 1 | 41 | Risk Ratio (M‐H, Random, 95% CI) | 0.53 [0.15, 1.82] |
| 3.3 training delivered to both patient and carer/health professional | 7 | 625 | Risk Ratio (M‐H, Random, 95% CI) | 0.64 [0.51, 0.79] |
| 4 Service use: 1b. Re‐hospitalisation (5‐7 year follow‐up) Show forest plot | 2 | 156 | Risk Ratio (M‐H, Random, 95% CI) | 0.82 [0.49, 1.36] |
| 4.1 training delivered to patient only | 1 | 108 | Risk Ratio (M‐H, Random, 95% CI) | 1.04 [0.79, 1.36] |
| 4.2 training delivered to both patient and carer/health professional | 1 | 48 | Risk Ratio (M‐H, Random, 95% CI) | 0.62 [0.42, 0.92] |
| 5 Service use: 2. Time to re‐hospitalisation Show forest plot | 6 | 1149 | hazards ratio (Random, 95% CI) | 0.58 [0.33, 1.04] |
| 5.1 training delivered to patient only | 3 | 409 | hazards ratio (Random, 95% CI) | 0.37 [0.07, 1.95] |
| 5.2 training delivered to both patient and carer/health professional | 3 | 740 | hazards ratio (Random, 95% CI) | 0.62 [0.46, 0.83] |
| 6 Mental state: general 1a. Average score (BPRS, high = bad) Show forest plot | 10 | Mean Difference (Random, 95% CI) | ‐4.55 [‐8.21, ‐0.90] | |
| 7 Mental state: general 1b. Average score (PANSS, high = bad) Show forest plot | 3 | 385 | Mean Difference (IV, Random, 95% CI) | ‐5.89 [‐15.86, 4.09] |
| 8 Mental state: general 1c. Average score (KGV, high = bad) Show forest plot | 1 | Mean Difference (Fixed, 95% CI) | ‐2.6 [‐4.07, ‐1.13] | |
| 9 Mental state: specific 2. Average score in positive symptoms (various scales) Show forest plot | 6 | Mean Difference (IV, Random, 95% CI) | Subtotals only | |
| 9.1 BPRS (high = bad) | 1 | 64 | Mean Difference (IV, Random, 95% CI) | ‐0.90 [‐3.52, 1.72] |
| 9.2 PANSS positive (high = bad) | 4 | 508 | Mean Difference (IV, Random, 95% CI) | ‐0.41 [‐2.70, 1.87] |
| 9.3 SAPS (high = bad) | 1 | 104 | Mean Difference (IV, Random, 95% CI) | ‐2.04 [‐3.22, ‐0.86] |
| 10 Mental state: specific 3. Average score in negative symptoms (various scales) Show forest plot | 7 | Mean Difference (IV, Random, 95% CI) | Subtotals only | |
| 10.1 PANSS negative (high = bad) | 4 | 508 | Mean Difference (IV, Random, 95% CI) | ‐0.74 [‐3.13, 1.64] |
| 10.2 SANS (high = bad) | 3 | 194 | Mean Difference (IV, Random, 95% CI) | ‐3.95 [‐15.25, 7.35] |
| 11 Social functioning: 1a. Not employed Show forest plot | 2 | 185 | Risk Ratio (M‐H, Fixed, 95% CI) | 0.68 [0.57, 0.82] |
| 12 Social functioning: 2a. Average scores (various scales) Show forest plot | 7 | Mean Difference (IV, Fixed, 95% CI) | Subtotals only | |
| 12.1 GAF (high = good) | 2 | 88 | Mean Difference (IV, Fixed, 95% CI) | 2.51 [‐3.84, 8.85] |
| 12.2 GAF‐DIS (high = good) | 1 | 61 | Mean Difference (IV, Fixed, 95% CI) | ‐6.10 [‐12.34, 0.14] |
| 12.3 ILSS (high = good) | 1 | 84 | Mean Difference (IV, Fixed, 95% CI) | 0.35 [‐0.70, 1.40] |
| 12.4 Time budget interview (high = good) | 1 | 224 | Mean Difference (IV, Fixed, 95% CI) | 1.61 [‐4.04, 7.25] |
| 12.5 SOFAS (high = good) | 1 | 236 | Mean Difference (IV, Fixed, 95% CI) | 1.21 [‐2.71, 5.13] |
| 12.6 SLOF (high = good) | 1 | 64 | Mean Difference (IV, Fixed, 95% CI) | 27.5 [17.03, 37.97] |
| 12.7 SAS (high = good) | 1 | 80 | Mean Difference (IV, Fixed, 95% CI) | ‐0.43 [‐2.20, 1.34] |
| 13 Social functioning: 2b. Average scores (various scales) Show forest plot | 6 | Mean Difference (Random, 95% CI) | Subtotals only | |
| 13.1 SFS (high = good) | 1 | Mean Difference (Random, 95% CI) | 4.4 [‐3.16, 11.96] | |
| 13.2 GAS (high = good) | 3 | Mean Difference (Random, 95% CI) | 1.92 [‐0.54, 4.38] | |
| 13.3 NOSIE (high = good) | 3 | Mean Difference (Random, 95% CI) | 25.12 [5.75, 44.48] | |
| 14 Quality of life: Average scores (various scales) Show forest plot | 4 | Mean Difference (IV, Fixed, 95% CI) | Subtotals only | |
| 14.1 QLS (high = good) | 1 | 46 | Mean Difference (IV, Fixed, 95% CI) | ‐5.05 [‐16.12, 6.02] |
| 14.2 LQLP (high = good) | 1 | 48 | Mean Difference (IV, Fixed, 95% CI) | ‐0.40 [‐1.30, 0.50] |
| 14.3 EuroQoL (high = good) | 1 | 206 | Mean Difference (IV, Fixed, 95% CI) | ‐4.80 [‐10.79, 1.19] |
| 14.4 LQoLS (high = good) | 1 | 80 | Mean Difference (IV, Fixed, 95% CI) | 0.09 [‐0.24, 0.42] |
| 15 Satisfaction with care: 1a. Average endpoint scores (various scales) Show forest plot | 2 | Mean Difference (Fixed, 95% CI) | Subtotals only | |
| 15.1 CALPAS (high = good) | 1 | Mean Difference (Fixed, 95% CI) | 0.3 [0.12, 0.48] | |
| 15.2 IAPSRS (high = good) | 1 | Mean Difference (Fixed, 95% CI) | 0.1 [‐0.11, 0.31] | |
| 16 Satisfaction with care: 1b. Average change scores (various scales) Show forest plot | 1 | Mean Difference (Fixed, 95% CI) | 2.15 [‐9.66, 13.96] | |
| 16.1 VSSS (high = good) | 1 | Mean Difference (Fixed, 95% CI) | 2.15 [‐9.66, 13.96] | |
| 17 Adverse events: 1. Lost to follow‐up Show forest plot | 17 | 1495 | Risk Ratio (M‐H, Fixed, 95% CI) | 0.96 [0.72, 1.28] |
| 18 Adverse events: 2. Death Show forest plot | 4 | 462 | Risk Ratio (M‐H, Fixed, 95% CI) | 0.91 [0.29, 2.89] |
| 19 Knowledge: 1a. Average scores (various scales) Show forest plot | 4 | Mean Difference (IV, Random, 95% CI) | Subtotals only | |
| 19.1 KASQ (patients, high = good) | 1 | 61 | Mean Difference (IV, Random, 95% CI) | 1.60 [‐0.84, 4.04] |
| 19.2 IS (patients, high = good) | 1 | 40 | Mean Difference (IV, Random, 95% CI) | 0.96 [‐0.48, 2.40] |
| 19.3 ITAQ (patients, high = good) | 2 | 166 | Mean Difference (IV, Random, 95% CI) | 7.21 [0.94, 13.48] |
| 20 Knowledge: 1b. Average scores (various scales) Show forest plot | 1 | Mean Difference (IV, Random, 95% CI) | Subtotals only | |
| 20.1 SUMD (patients, high = bad) | 1 | 81 | Mean Difference (IV, Random, 95% CI) | ‐1.18 [‐2.46, 0.10] |
| 21 Knowledge: 1c. Average scores (various scales) Show forest plot | 2 | Mean Difference (Fixed, 95% CI) | Subtotals only | |
| 21.1 DAI (patients, high = good) | 1 | Mean Difference (Fixed, 95% CI) | 1.4 [‐0.97, 3.77] | |
| 21.2 KASI (relatives, high = good) | 1 | Mean Difference (Fixed, 95% CI) | 2.83 [0.93, 4.73] | |
| 22 Burden of care: 1. Average scores (FBIS, high = bad) Show forest plot | 1 | 64 | Mean Difference (IV, Random, 95% CI) | ‐2.40 [‐7.10, 2.30] |
| 23 Medication compliance: Not compliant to medication Show forest plot | 4 | 374 | Risk Ratio (M‐H, Fixed, 95% CI) | 0.57 [0.42, 0.77] |