| 1 Relapse: 1. Relapse Show forest plot | 15 | 1502 | Risk Ratio (M‐H, Random, 95% CI) | 0.53 [0.36, 0.79] |
|
| 1.1 training delivered to patient only | 8 | 933 | Risk Ratio (M‐H, Random, 95% CI) | 0.43 [0.20, 0.92] |
| 1.2 training delivered to carer/health professional only | 2 | 78 | Risk Ratio (M‐H, Random, 95% CI) | 0.58 [0.24, 1.37] |
| 1.3 training delivered to both patient and carer/health professional | 6 | 491 | Risk Ratio (M‐H, Random, 95% CI) | 0.68 [0.46, 1.02] |
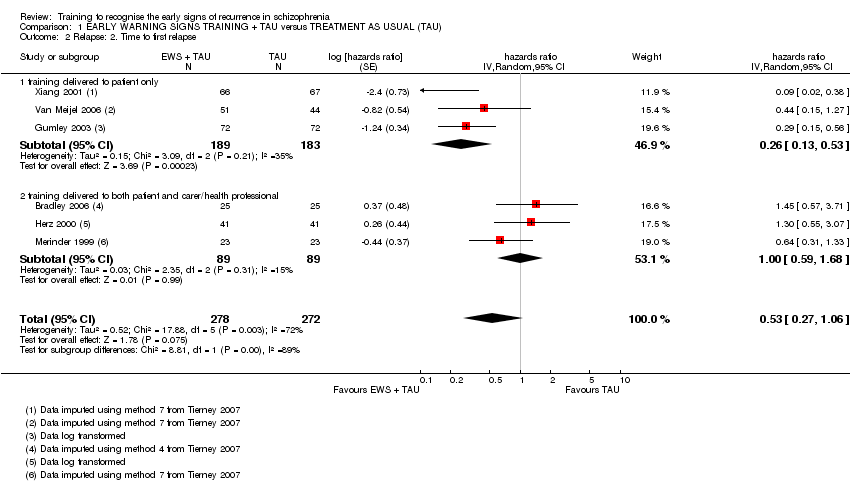
| 2 Relapse: 2. Time to first relapse Show forest plot | 6 | 550 | hazards ratio (Random, 95% CI) | 0.53 [0.27, 1.06] |
|
| 2.1 training delivered to patient only | 3 | 372 | hazards ratio (Random, 95% CI) | 0.26 [0.13, 0.53] |
| 2.2 training delivered to both patient and carer/health professional | 3 | 178 | hazards ratio (Random, 95% CI) | 1.00 [0.59, 1.68] |
| 3 Service use: 1a. Re‐hospitalisation Show forest plot | 15 | 1457 | Risk Ratio (M‐H, Random, 95% CI) | 0.48 [0.35, 0.66] |
|
| 3.1 training delivered to patient only | 7 | 791 | Risk Ratio (M‐H, Random, 95% CI) | 0.30 [0.14, 0.66] |
| 3.2 training delivered to carer/health professional only | 1 | 41 | Risk Ratio (M‐H, Random, 95% CI) | 0.53 [0.15, 1.82] |
| 3.3 training delivered to both patient and carer/health professional | 7 | 625 | Risk Ratio (M‐H, Random, 95% CI) | 0.64 [0.51, 0.79] |
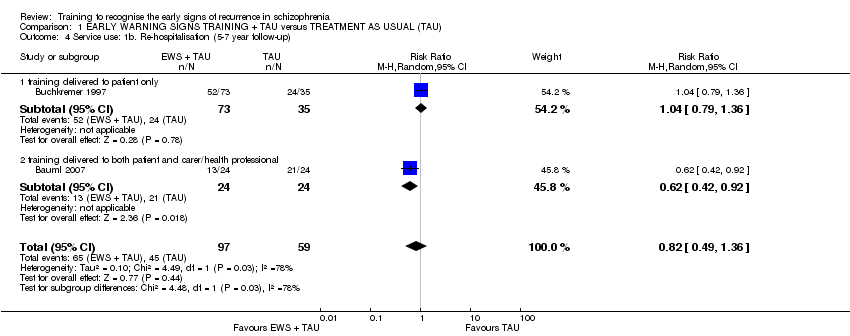
| 4 Service use: 1b. Re‐hospitalisation (5‐7 year follow‐up) Show forest plot | 2 | 156 | Risk Ratio (M‐H, Random, 95% CI) | 0.82 [0.49, 1.36] |
|
| 4.1 training delivered to patient only | 1 | 108 | Risk Ratio (M‐H, Random, 95% CI) | 1.04 [0.79, 1.36] |
| 4.2 training delivered to both patient and carer/health professional | 1 | 48 | Risk Ratio (M‐H, Random, 95% CI) | 0.62 [0.42, 0.92] |
| 5 Service use: 2. Time to re‐hospitalisation Show forest plot | 6 | 1149 | hazards ratio (Random, 95% CI) | 0.58 [0.33, 1.04] |
|
| 5.1 training delivered to patient only | 3 | 409 | hazards ratio (Random, 95% CI) | 0.37 [0.07, 1.95] |
| 5.2 training delivered to both patient and carer/health professional | 3 | 740 | hazards ratio (Random, 95% CI) | 0.62 [0.46, 0.83] |
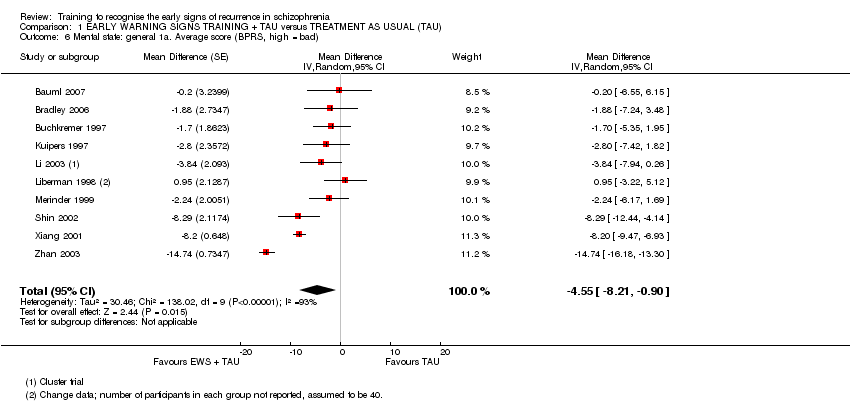
| 6 Mental state: general 1a. Average score (BPRS, high = bad) Show forest plot | 10 | | Mean Difference (Random, 95% CI) | ‐4.55 [‐8.21, ‐0.90] |
|
| 7 Mental state: general 1b. Average score (PANSS, high = bad) Show forest plot | 3 | 385 | Mean Difference (IV, Random, 95% CI) | ‐5.89 [‐15.86, 4.09] |
|
| 8 Mental state: general 1c. Average score (KGV, high = bad) Show forest plot | 1 | | Mean Difference (Fixed, 95% CI) | ‐2.6 [‐4.07, ‐1.13] |
|
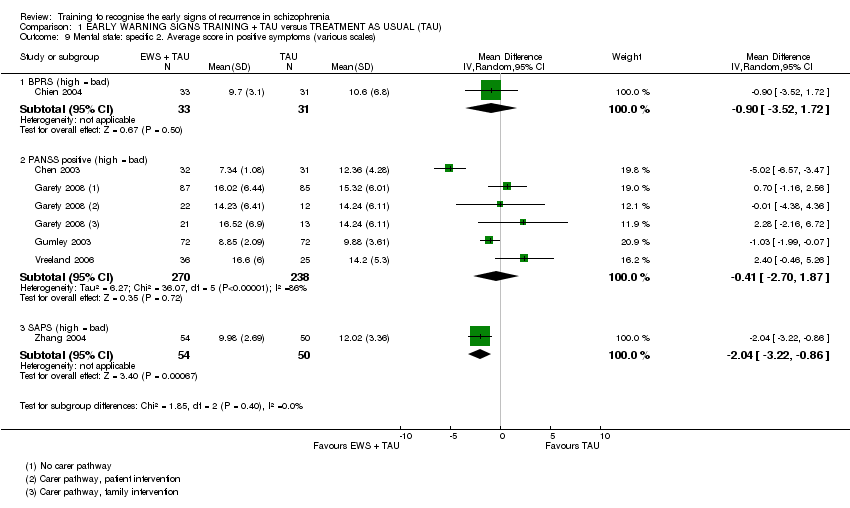
| 9 Mental state: specific 2. Average score in positive symptoms (various scales) Show forest plot | 6 | | Mean Difference (IV, Random, 95% CI) | Subtotals only |
|
| 9.1 BPRS (high = bad) | 1 | 64 | Mean Difference (IV, Random, 95% CI) | ‐0.90 [‐3.52, 1.72] |
| 9.2 PANSS positive (high = bad) | 4 | 508 | Mean Difference (IV, Random, 95% CI) | ‐0.41 [‐2.70, 1.87] |
| 9.3 SAPS (high = bad) | 1 | 104 | Mean Difference (IV, Random, 95% CI) | ‐2.04 [‐3.22, ‐0.86] |
| 10 Mental state: specific 3. Average score in negative symptoms (various scales) Show forest plot | 7 | | Mean Difference (IV, Random, 95% CI) | Subtotals only |
|
| 10.1 PANSS negative (high = bad) | 4 | 508 | Mean Difference (IV, Random, 95% CI) | ‐0.74 [‐3.13, 1.64] |
| 10.2 SANS (high = bad) | 3 | 194 | Mean Difference (IV, Random, 95% CI) | ‐3.95 [‐15.25, 7.35] |
| 11 Social functioning: 1a. Not employed Show forest plot | 2 | 185 | Risk Ratio (M‐H, Fixed, 95% CI) | 0.68 [0.57, 0.82] |
|
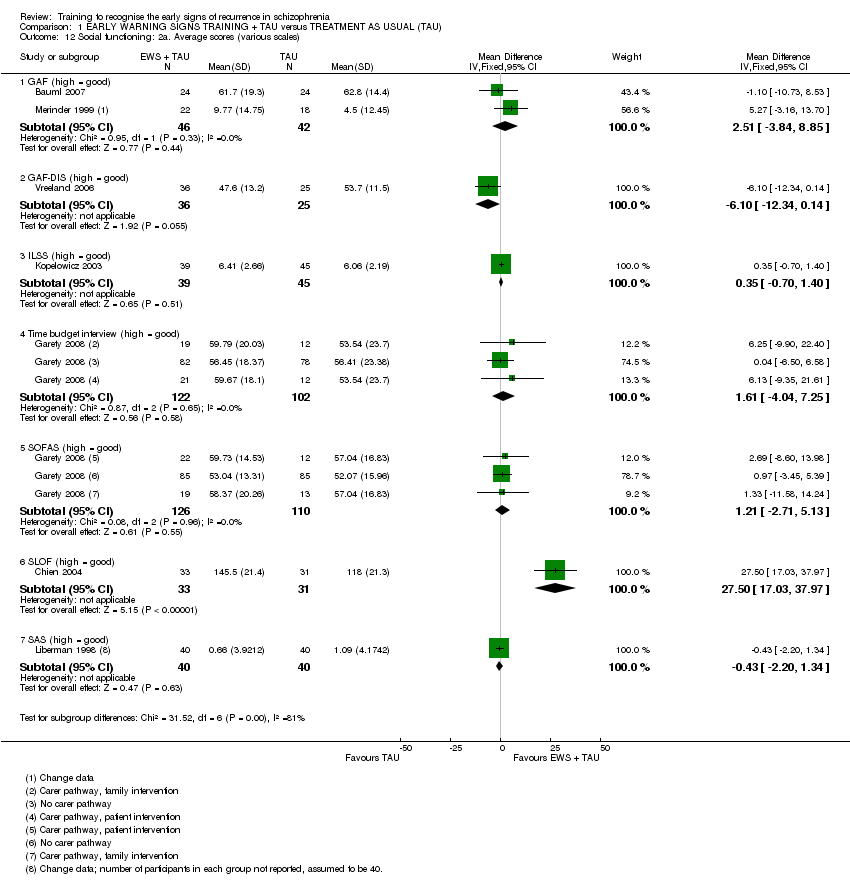
| 12 Social functioning: 2a. Average scores (various scales) Show forest plot | 7 | | Mean Difference (IV, Fixed, 95% CI) | Subtotals only |
|
| 12.1 GAF (high = good) | 2 | 88 | Mean Difference (IV, Fixed, 95% CI) | 2.51 [‐3.84, 8.85] |
| 12.2 GAF‐DIS (high = good) | 1 | 61 | Mean Difference (IV, Fixed, 95% CI) | ‐6.10 [‐12.34, 0.14] |
| 12.3 ILSS (high = good) | 1 | 84 | Mean Difference (IV, Fixed, 95% CI) | 0.35 [‐0.70, 1.40] |
| 12.4 Time budget interview (high = good) | 1 | 224 | Mean Difference (IV, Fixed, 95% CI) | 1.61 [‐4.04, 7.25] |
| 12.5 SOFAS (high = good) | 1 | 236 | Mean Difference (IV, Fixed, 95% CI) | 1.21 [‐2.71, 5.13] |
| 12.6 SLOF (high = good) | 1 | 64 | Mean Difference (IV, Fixed, 95% CI) | 27.5 [17.03, 37.97] |
| 12.7 SAS (high = good) | 1 | 80 | Mean Difference (IV, Fixed, 95% CI) | ‐0.43 [‐2.20, 1.34] |
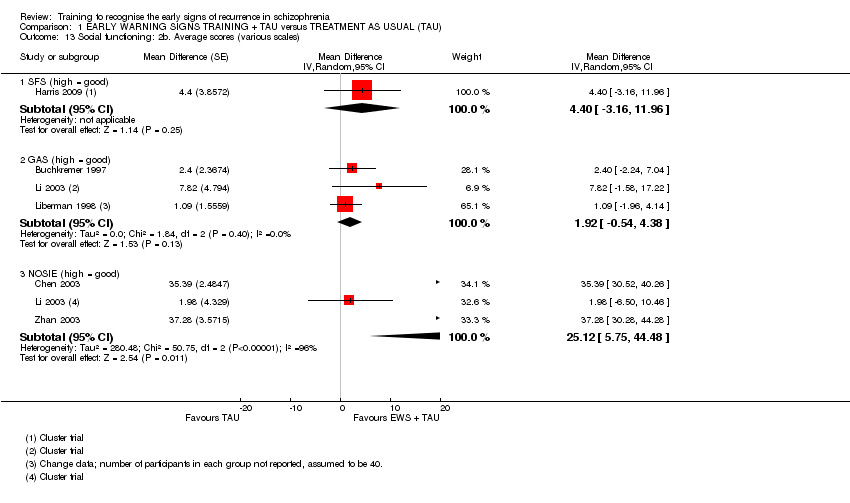
| 13 Social functioning: 2b. Average scores (various scales) Show forest plot | 6 | | Mean Difference (Random, 95% CI) | Subtotals only |
|
| 13.1 SFS (high = good) | 1 | | Mean Difference (Random, 95% CI) | 4.4 [‐3.16, 11.96] |
| 13.2 GAS (high = good) | 3 | | Mean Difference (Random, 95% CI) | 1.92 [‐0.54, 4.38] |
| 13.3 NOSIE (high = good) | 3 | | Mean Difference (Random, 95% CI) | 25.12 [5.75, 44.48] |
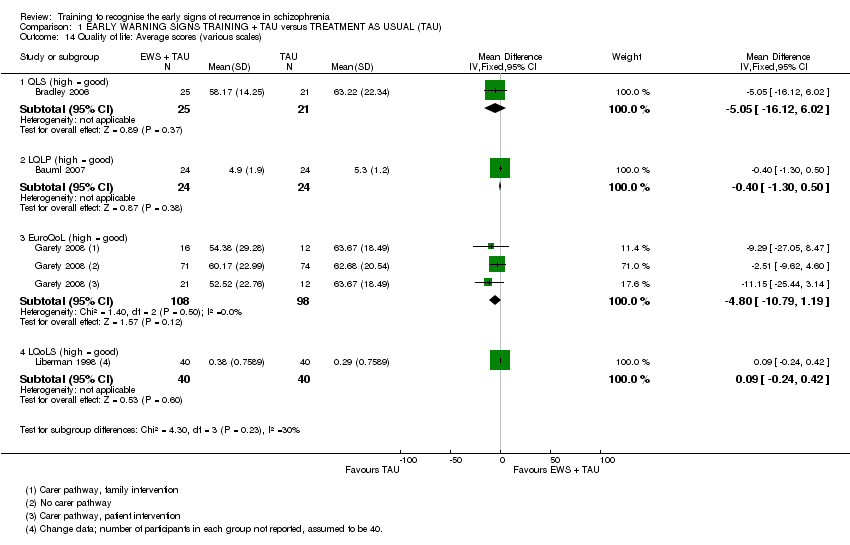
| 14 Quality of life: Average scores (various scales) Show forest plot | 4 | | Mean Difference (IV, Fixed, 95% CI) | Subtotals only |
|
| 14.1 QLS (high = good) | 1 | 46 | Mean Difference (IV, Fixed, 95% CI) | ‐5.05 [‐16.12, 6.02] |
| 14.2 LQLP (high = good) | 1 | 48 | Mean Difference (IV, Fixed, 95% CI) | ‐0.40 [‐1.30, 0.50] |
| 14.3 EuroQoL (high = good) | 1 | 206 | Mean Difference (IV, Fixed, 95% CI) | ‐4.80 [‐10.79, 1.19] |
| 14.4 LQoLS (high = good) | 1 | 80 | Mean Difference (IV, Fixed, 95% CI) | 0.09 [‐0.24, 0.42] |
| 15 Satisfaction with care: 1a. Average endpoint scores (various scales) Show forest plot | 2 | | Mean Difference (Fixed, 95% CI) | Subtotals only |
|
| 15.1 CALPAS (high = good) | 1 | | Mean Difference (Fixed, 95% CI) | 0.3 [0.12, 0.48] |
| 15.2 IAPSRS (high = good) | 1 | | Mean Difference (Fixed, 95% CI) | 0.1 [‐0.11, 0.31] |
| 16 Satisfaction with care: 1b. Average change scores (various scales) Show forest plot | 1 | | Mean Difference (Fixed, 95% CI) | 2.15 [‐9.66, 13.96] |
|
| 16.1 VSSS (high = good) | 1 | | Mean Difference (Fixed, 95% CI) | 2.15 [‐9.66, 13.96] |
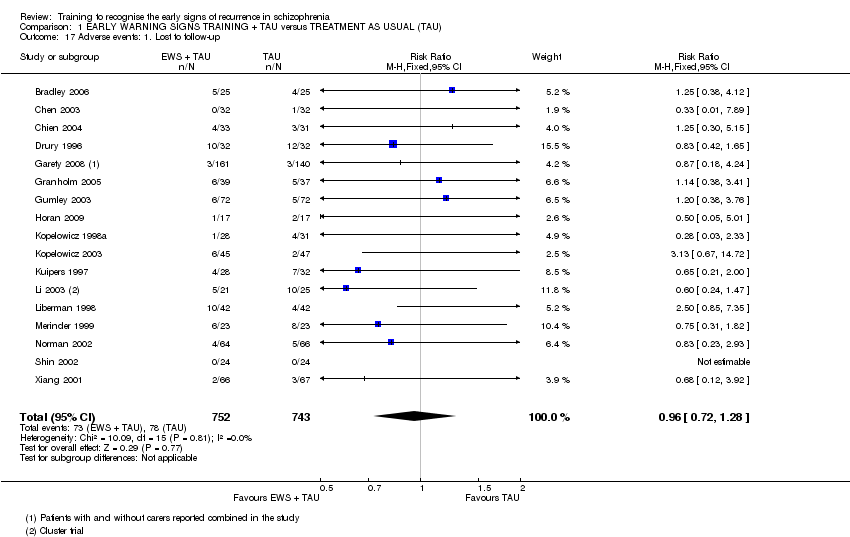
| 17 Adverse events: 1. Lost to follow‐up Show forest plot | 17 | 1495 | Risk Ratio (M‐H, Fixed, 95% CI) | 0.96 [0.72, 1.28] |
|
| 18 Adverse events: 2. Death Show forest plot | 4 | 462 | Risk Ratio (M‐H, Fixed, 95% CI) | 0.91 [0.29, 2.89] |
|
| 19 Knowledge: 1a. Average scores (various scales) Show forest plot | 4 | | Mean Difference (IV, Random, 95% CI) | Subtotals only |
|
| 19.1 KASQ (patients, high = good) | 1 | 61 | Mean Difference (IV, Random, 95% CI) | 1.60 [‐0.84, 4.04] |
| 19.2 IS (patients, high = good) | 1 | 40 | Mean Difference (IV, Random, 95% CI) | 0.96 [‐0.48, 2.40] |
| 19.3 ITAQ (patients, high = good) | 2 | 166 | Mean Difference (IV, Random, 95% CI) | 7.21 [0.94, 13.48] |
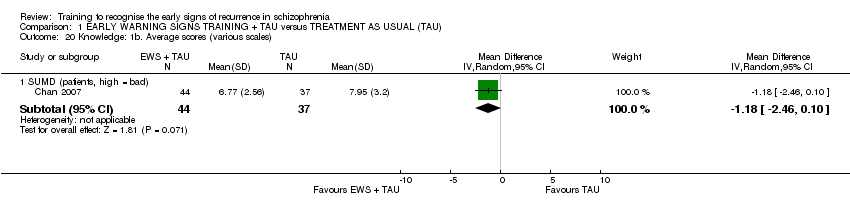
| 20 Knowledge: 1b. Average scores (various scales) Show forest plot | 1 | | Mean Difference (IV, Random, 95% CI) | Subtotals only |
|
| 20.1 SUMD (patients, high = bad) | 1 | 81 | Mean Difference (IV, Random, 95% CI) | ‐1.18 [‐2.46, 0.10] |
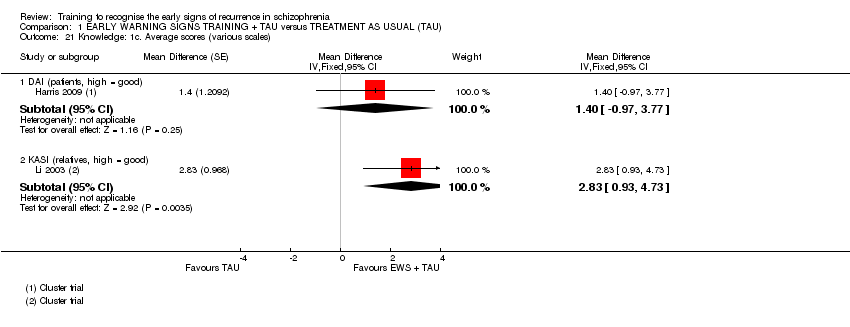
| 21 Knowledge: 1c. Average scores (various scales) Show forest plot | 2 | | Mean Difference (Fixed, 95% CI) | Subtotals only |
|
| 21.1 DAI (patients, high = good) | 1 | | Mean Difference (Fixed, 95% CI) | 1.4 [‐0.97, 3.77] |
| 21.2 KASI (relatives, high = good) | 1 | | Mean Difference (Fixed, 95% CI) | 2.83 [0.93, 4.73] |
| 22 Burden of care: 1. Average scores (FBIS, high = bad) Show forest plot | 1 | 64 | Mean Difference (IV, Random, 95% CI) | ‐2.40 [‐7.10, 2.30] |
|
| 23 Medication compliance: Not compliant to medication Show forest plot | 4 | 374 | Risk Ratio (M‐H, Fixed, 95% CI) | 0.57 [0.42, 0.77] |
|