Masaje perineal prenatal para reducir el trauma perineal
Información
- DOI:
- https://doi.org/10.1002/14651858.CD005123.pub3Copiar DOI

- Base de datos:
-
- Cochrane Database of Systematic Reviews
- Versión publicada:
-
- 30 abril 2013see what's new
- Tipo:
-
- Intervention
- Etapa:
-
- Review
- Grupo Editorial Cochrane:
-
Grupo Cochrane de Embarazo y parto
- Copyright:
-
- Copyright © 2013 The Cochrane Collaboration. Published by John Wiley & Sons, Ltd.
Cifras del artículo
Altmetric:
Citado por:
Autores
Contributions of authors
The updated review was undertaken by Michael Beckmann, and checked and commented on by Owen Stock.
Sources of support
Internal sources
-
No sources of support supplied
External sources
-
Australian Department of Health and Ageing, Australia.
Declarations of interest
None known.
Acknowledgements
We thank Andrea Garrett for her contribution to previous versions of this review. Andrea worked collaboratively on the development of the protocol, undertook selection of trials for inclusion, quality assessment, data extraction and commented on drafts of the review.
Version history
| Published | Title | Stage | Authors | Version |
| 2013 Apr 30 | Antenatal perineal massage for reducing perineal trauma | Review | Michael M Beckmann, Owen M Stock | |
| 2006 Jan 25 | Antenatal perineal massage for reducing perineal trauma | Review | Michael M Beckmann, Andrea J Garrett | |
| 2005 Jan 24 | Antenatal perineal massage for reducing perineal trauma | Protocol | Michael M Beckmann, Andrea J Garrett | |
Differences between protocol and review
Updated methods added to an Appendix.
Keywords
MeSH
Medical Subject Headings (MeSH) Keywords
Medical Subject Headings Check Words
Female; Humans; Pregnancy;
PICO

'Risk of bias' graph: review authors' judgements about each risk of bias item presented as percentages across all included studies.
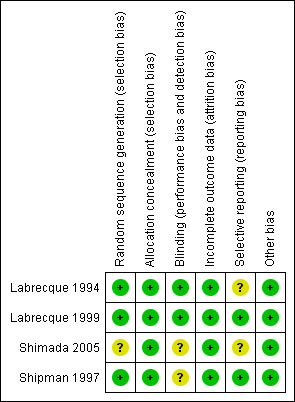
'Risk of bias' summary: review authors' judgements about each risk of bias item for each included study.
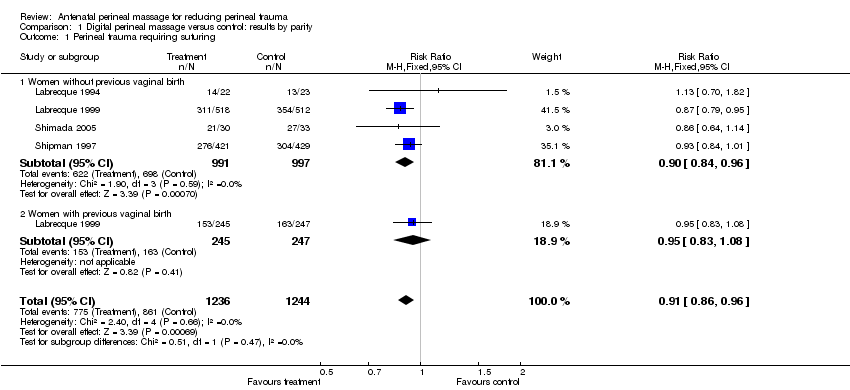
Comparison 1 Digital perineal massage versus control: results by parity, Outcome 1 Perineal trauma requiring suturing.

Comparison 1 Digital perineal massage versus control: results by parity, Outcome 2 1st degree perineal tear.

Comparison 1 Digital perineal massage versus control: results by parity, Outcome 3 2nd degree perineal tear.

Comparison 1 Digital perineal massage versus control: results by parity, Outcome 4 3rd or 4th degree perineal trauma.

Comparison 1 Digital perineal massage versus control: results by parity, Outcome 5 Incidence of episiotomy.
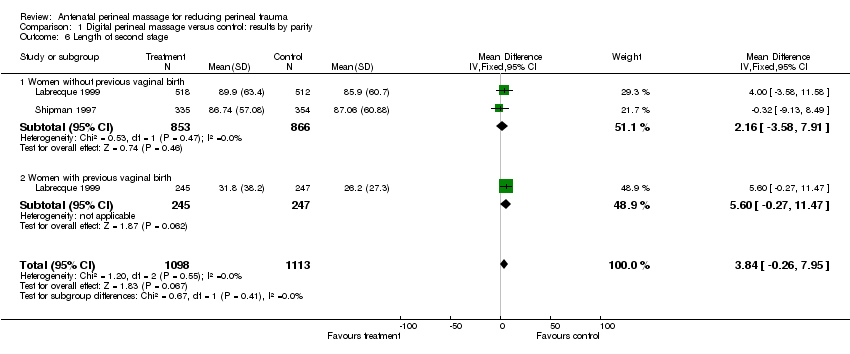
Comparison 1 Digital perineal massage versus control: results by parity, Outcome 6 Length of second stage.
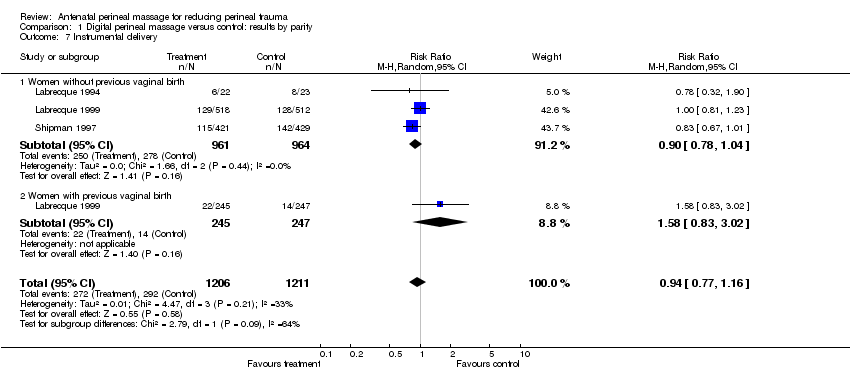
Comparison 1 Digital perineal massage versus control: results by parity, Outcome 7 Instrumental delivery.
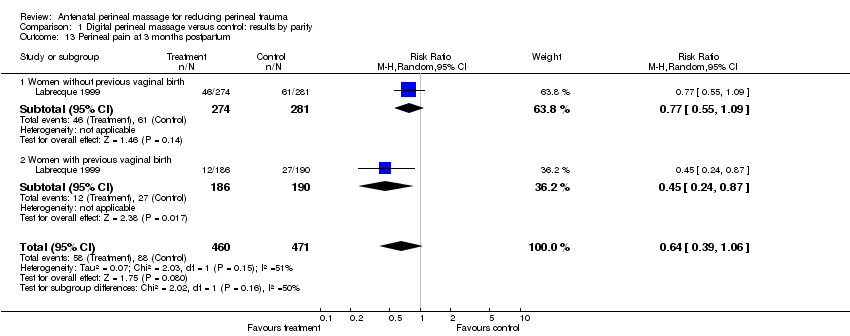
Comparison 1 Digital perineal massage versus control: results by parity, Outcome 13 Perineal pain at 3 months postpartum.
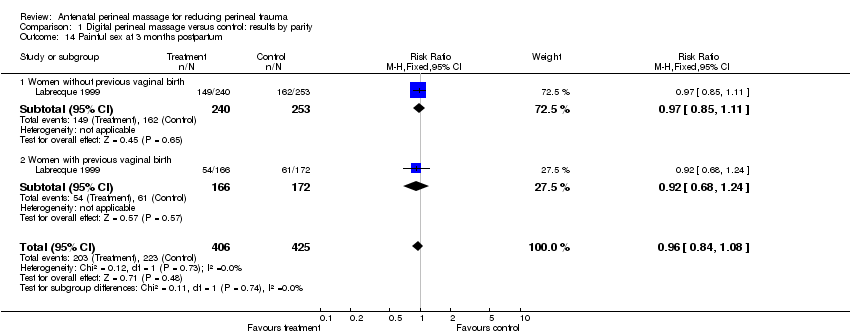
Comparison 1 Digital perineal massage versus control: results by parity, Outcome 14 Painful sex at 3 months postpartum.
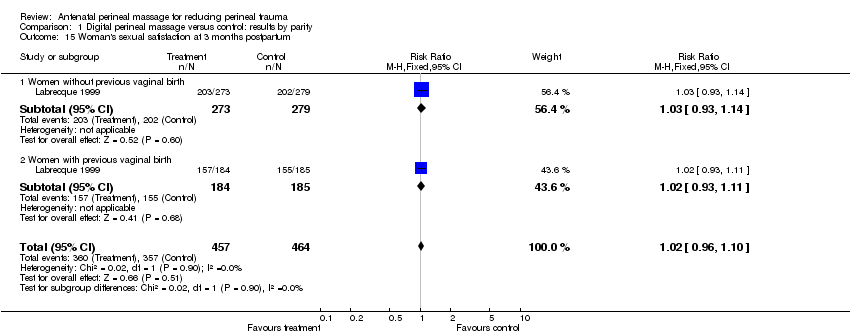
Comparison 1 Digital perineal massage versus control: results by parity, Outcome 15 Woman's sexual satisfaction at 3 months postpartum.
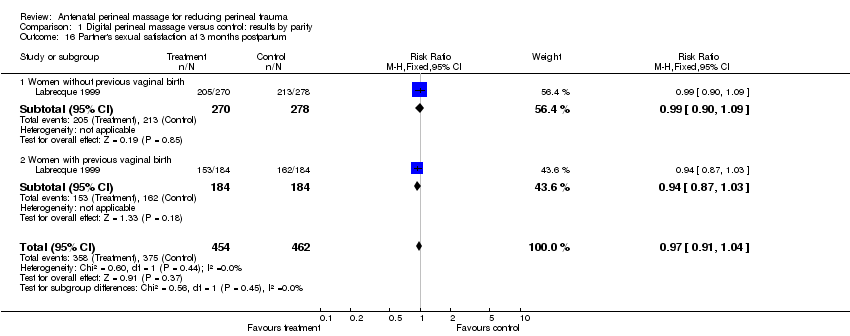
Comparison 1 Digital perineal massage versus control: results by parity, Outcome 16 Partner's sexual satisfaction at 3 months postpartum.
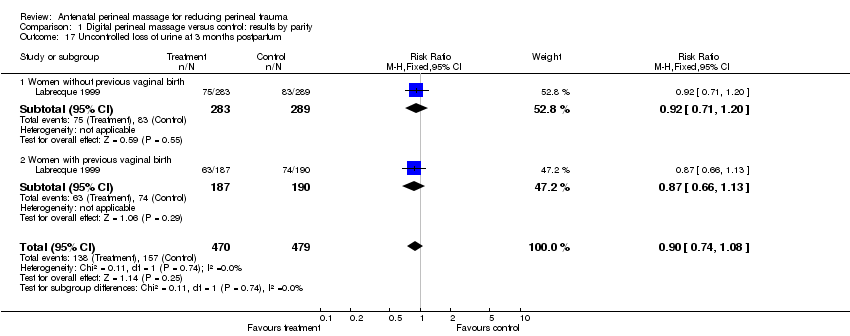
Comparison 1 Digital perineal massage versus control: results by parity, Outcome 17 Uncontrolled loss of urine at 3 months postpartum.
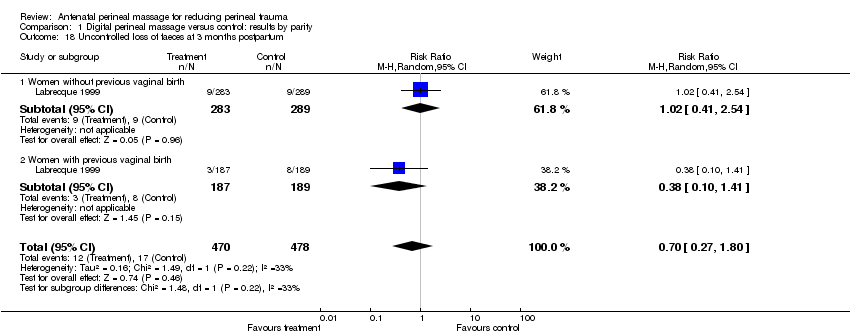
Comparison 1 Digital perineal massage versus control: results by parity, Outcome 18 Uncontrolled loss of faeces at 3 months postpartum.

Comparison 1 Digital perineal massage versus control: results by parity, Outcome 19 Uncontrolled loss of flatus at 3 months postpartum.

Comparison 2 Digital perineal massage versus control: results by frequency of massage, Outcome 1 Perineal trauma requiring suturing.
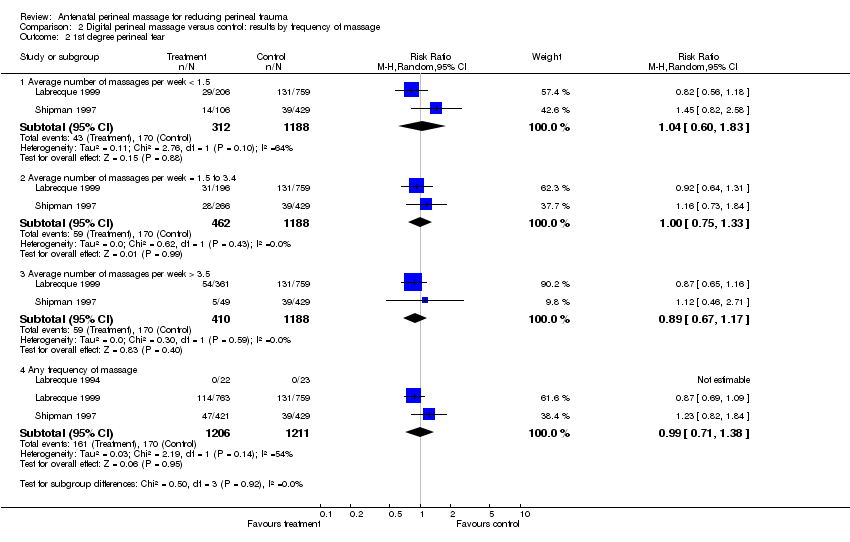
Comparison 2 Digital perineal massage versus control: results by frequency of massage, Outcome 2 1st degree perineal tear.
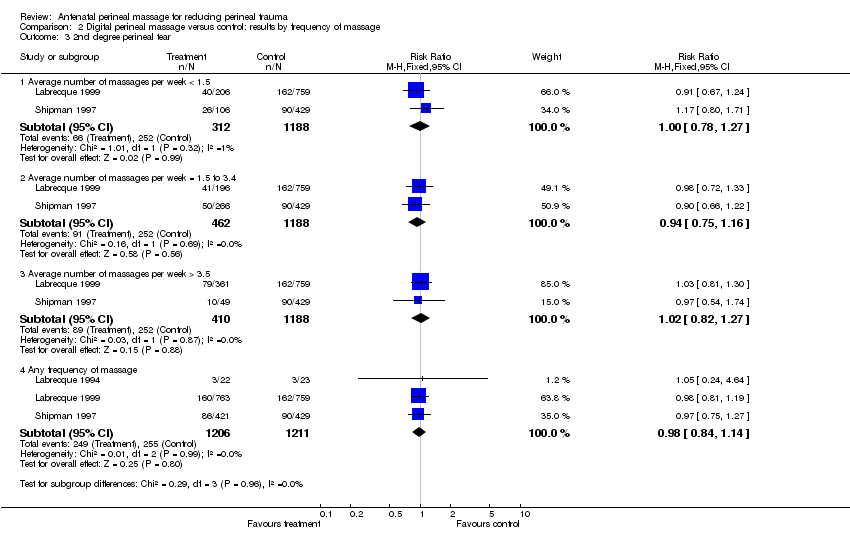
Comparison 2 Digital perineal massage versus control: results by frequency of massage, Outcome 3 2nd degree perineal tear.

Comparison 2 Digital perineal massage versus control: results by frequency of massage, Outcome 4 3rd or 4th degree perineal trauma.

Comparison 2 Digital perineal massage versus control: results by frequency of massage, Outcome 5 Incidence of episiotomy.

Comparison 2 Digital perineal massage versus control: results by frequency of massage, Outcome 6 Length of second stage.
Comparison 2 Digital perineal massage versus control: results by frequency of massage, Outcome 7 Instrumental delivery.

Comparison 2 Digital perineal massage versus control: results by frequency of massage, Outcome 13 Perineal pain at 3 months postpartum.

Comparison 2 Digital perineal massage versus control: results by frequency of massage, Outcome 14 Painful sex at 3 months postpartum.

Comparison 2 Digital perineal massage versus control: results by frequency of massage, Outcome 15 Woman's sexual satisfaction at 3 months postpartum.
Comparison 2 Digital perineal massage versus control: results by frequency of massage, Outcome 16 Partner's sexual satisfaction at 3 months postpartum.

Comparison 2 Digital perineal massage versus control: results by frequency of massage, Outcome 17 Uncontrolled loss of urine at 3 months postpartum.
Comparison 2 Digital perineal massage versus control: results by frequency of massage, Outcome 18 Uncontrolled loss of faeces at 3 months postpartum.

Comparison 2 Digital perineal massage versus control: results by frequency of massage, Outcome 19 Uncontrolled loss of flatus at 3 months postpartum.
| Treatment | Control | Risk ratio, M‐H, Fixed, 95% CI | |||
| Events | Total | Events | Total | ||
| Reporting of infrequent flatal incontinence | 21 | 108 | 107 | 479 | 0.87 (0.57,1.32) |
| Reporting of flatal incontinence at least daily | 6 | 108 | 10 | 479 | 2.66 (0.99,7.16) |
| Duration | All women | Excl episiotomy |
| Length of 2nd stage (mins) | +3.84 (95% CI ‐0.26 to +7.95) | +3.57 (95% CI ‐0.86 to +8.00) |
| Length of 2nd stage for women massaging more than 3.5 times/week (mins) | +10.80 (95% CI +4.03 to +17.58) | +5.21 (95% CI ‐1.45 to +11.86) |
| mins: minutes | ||
| Outcome or subgroup title | No. of studies | No. of participants | Statistical method | Effect size |
| 1 Perineal trauma requiring suturing Show forest plot | 4 | 2480 | Risk Ratio (M‐H, Fixed, 95% CI) | 0.91 [0.86, 0.96] |
| 1.1 Women without previous vaginal birth | 4 | 1988 | Risk Ratio (M‐H, Fixed, 95% CI) | 0.90 [0.84, 0.96] |
| 1.2 Women with previous vaginal birth | 1 | 492 | Risk Ratio (M‐H, Fixed, 95% CI) | 0.95 [0.83, 1.08] |
| 2 1st degree perineal tear Show forest plot | 4 | 2480 | Risk Ratio (M‐H, Random, 95% CI) | 0.96 [0.78, 1.19] |
| 2.1 Women without previous vaginal birth | 4 | 1988 | Risk Ratio (M‐H, Random, 95% CI) | 0.97 [0.69, 1.36] |
| 2.2 Women with previous vaginal birth | 1 | 492 | Risk Ratio (M‐H, Random, 95% CI) | 1.01 [0.72, 1.41] |
| 3 2nd degree perineal tear Show forest plot | 4 | 2480 | Risk Ratio (M‐H, Fixed, 95% CI) | 0.99 [0.85, 1.15] |
| 3.1 Women without previous vaginal birth | 4 | 1988 | Risk Ratio (M‐H, Fixed, 95% CI) | 1.00 [0.84, 1.19] |
| 3.2 Women with previous vaginal birth | 1 | 492 | Risk Ratio (M‐H, Fixed, 95% CI) | 0.96 [0.72, 1.29] |
| 4 3rd or 4th degree perineal trauma Show forest plot | 4 | 2480 | Risk Ratio (M‐H, Fixed, 95% CI) | 0.81 [0.56, 1.18] |
| 4.1 Women without previous vaginal birth | 4 | 1988 | Risk Ratio (M‐H, Fixed, 95% CI) | 0.82 [0.56, 1.20] |
| 4.2 Women with previous vaginal birth | 1 | 492 | Risk Ratio (M‐H, Fixed, 95% CI) | 0.50 [0.05, 5.52] |
| 5 Incidence of episiotomy Show forest plot | 4 | 2480 | Risk Ratio (M‐H, Fixed, 95% CI) | 0.84 [0.74, 0.95] |
| 5.1 Women without previous vaginal birth | 4 | 1988 | Risk Ratio (M‐H, Fixed, 95% CI) | 0.83 [0.73, 0.95] |
| 5.2 Women with previous vaginal birth | 1 | 492 | Risk Ratio (M‐H, Fixed, 95% CI) | 0.86 [0.57, 1.30] |
| 6 Length of second stage Show forest plot | 2 | 2211 | Mean Difference (IV, Fixed, 95% CI) | 3.84 [‐0.26, 7.95] |
| 6.1 Women without previous vaginal birth | 2 | 1719 | Mean Difference (IV, Fixed, 95% CI) | 2.16 [‐3.58, 7.91] |
| 6.2 Women with previous vaginal birth | 1 | 492 | Mean Difference (IV, Fixed, 95% CI) | 5.60 [‐0.27, 11.47] |
| 7 Instrumental delivery Show forest plot | 3 | 2417 | Risk Ratio (M‐H, Random, 95% CI) | 0.94 [0.77, 1.16] |
| 7.1 Women without previous vaginal birth | 3 | 1925 | Risk Ratio (M‐H, Random, 95% CI) | 0.90 [0.78, 1.04] |
| 7.2 Women with previous vaginal birth | 1 | 492 | Risk Ratio (M‐H, Random, 95% CI) | 1.58 [0.83, 3.02] |
| 8 Length of inpatient stay | 0 | 0 | Mean Difference (IV, Fixed, 95% CI) | 0.0 [0.0, 0.0] |
| 8.1 Women without previous vaginal birth | 0 | 0 | Mean Difference (IV, Fixed, 95% CI) | 0.0 [0.0, 0.0] |
| 8.2 Women with previous vaginal birth | 0 | 0 | Mean Difference (IV, Fixed, 95% CI) | 0.0 [0.0, 0.0] |
| 9 Admission to nursery | 0 | 0 | Risk Ratio (M‐H, Fixed, 95% CI) | 0.0 [0.0, 0.0] |
| 9.1 Women without previous vaginal birth | 0 | 0 | Risk Ratio (M‐H, Fixed, 95% CI) | 0.0 [0.0, 0.0] |
| 9.2 Women with previous vaginal birth | 0 | 0 | Risk Ratio (M‐H, Fixed, 95% CI) | 0.0 [0.0, 0.0] |
| 10 Apgar < 4 at 1 minute and/or Apgar < 7 at 5 minutes | 0 | 0 | Risk Ratio (M‐H, Fixed, 95% CI) | 0.0 [0.0, 0.0] |
| 10.1 Women without previous vaginal birth | 0 | 0 | Risk Ratio (M‐H, Fixed, 95% CI) | 0.0 [0.0, 0.0] |
| 10.2 Women with previous vaginal birth | 0 | 0 | Risk Ratio (M‐H, Fixed, 95% CI) | 0.0 [0.0, 0.0] |
| 11 Woman's satisfaction with perineal massage | 0 | 0 | Risk Ratio (M‐H, Fixed, 95% CI) | 0.0 [0.0, 0.0] |
| 11.1 Women without previous vaginal birth | 0 | 0 | Risk Ratio (M‐H, Fixed, 95% CI) | 0.0 [0.0, 0.0] |
| 11.2 Women with previous vaginal birth | 0 | 0 | Risk Ratio (M‐H, Fixed, 95% CI) | 0.0 [0.0, 0.0] |
| 12 Perineal pain postpartum | 0 | 0 | Mean Difference (IV, Fixed, 95% CI) | 0.0 [0.0, 0.0] |
| 12.1 Women without previous vaginal birth | 0 | 0 | Mean Difference (IV, Fixed, 95% CI) | 0.0 [0.0, 0.0] |
| 12.2 Women with previous vaginal birth | 0 | 0 | Mean Difference (IV, Fixed, 95% CI) | 0.0 [0.0, 0.0] |
| 13 Perineal pain at 3 months postpartum Show forest plot | 1 | 931 | Risk Ratio (M‐H, Random, 95% CI) | 0.64 [0.39, 1.06] |
| 13.1 Women without previous vaginal birth | 1 | 555 | Risk Ratio (M‐H, Random, 95% CI) | 0.77 [0.55, 1.09] |
| 13.2 Women with previous vaginal birth | 1 | 376 | Risk Ratio (M‐H, Random, 95% CI) | 0.45 [0.24, 0.87] |
| 14 Painful sex at 3 months postpartum Show forest plot | 1 | 831 | Risk Ratio (M‐H, Fixed, 95% CI) | 0.96 [0.84, 1.08] |
| 14.1 Women without previous vaginal birth | 1 | 493 | Risk Ratio (M‐H, Fixed, 95% CI) | 0.97 [0.85, 1.11] |
| 14.2 Women with previous vaginal birth | 1 | 338 | Risk Ratio (M‐H, Fixed, 95% CI) | 0.92 [0.68, 1.24] |
| 15 Woman's sexual satisfaction at 3 months postpartum Show forest plot | 1 | 921 | Risk Ratio (M‐H, Fixed, 95% CI) | 1.02 [0.96, 1.10] |
| 15.1 Women without previous vaginal birth | 1 | 552 | Risk Ratio (M‐H, Fixed, 95% CI) | 1.03 [0.93, 1.14] |
| 15.2 Women with previous vaginal birth | 1 | 369 | Risk Ratio (M‐H, Fixed, 95% CI) | 1.02 [0.93, 1.11] |
| 16 Partner's sexual satisfaction at 3 months postpartum Show forest plot | 1 | 916 | Risk Ratio (M‐H, Fixed, 95% CI) | 0.97 [0.91, 1.04] |
| 16.1 Women without previous vaginal birth | 1 | 548 | Risk Ratio (M‐H, Fixed, 95% CI) | 0.99 [0.90, 1.09] |
| 16.2 Women with previous vaginal birth | 1 | 368 | Risk Ratio (M‐H, Fixed, 95% CI) | 0.94 [0.87, 1.03] |
| 17 Uncontrolled loss of urine at 3 months postpartum Show forest plot | 1 | 949 | Risk Ratio (M‐H, Fixed, 95% CI) | 0.90 [0.74, 1.08] |
| 17.1 Women without previous vaginal birth | 1 | 572 | Risk Ratio (M‐H, Fixed, 95% CI) | 0.92 [0.71, 1.20] |
| 17.2 Women with previous vaginal birth | 1 | 377 | Risk Ratio (M‐H, Fixed, 95% CI) | 0.87 [0.66, 1.13] |
| 18 Uncontrolled loss of faeces at 3 months postpartum Show forest plot | 1 | 948 | Risk Ratio (M‐H, Random, 95% CI) | 0.70 [0.27, 1.80] |
| 18.1 Women without previous vaginal birth | 1 | 572 | Risk Ratio (M‐H, Random, 95% CI) | 1.02 [0.41, 2.54] |
| 18.2 Women with previous vaginal birth | 1 | 376 | Risk Ratio (M‐H, Random, 95% CI) | 0.38 [0.10, 1.41] |
| 19 Uncontrolled loss of flatus at 3 months postpartum Show forest plot | 1 | 948 | Risk Ratio (M‐H, Fixed, 95% CI) | 1.09 [0.88, 1.36] |
| 19.1 Women without previous vaginal birth | 1 | 571 | Risk Ratio (M‐H, Fixed, 95% CI) | 1.13 [0.85, 1.50] |
| 19.2 Women with previous vaginal birth | 1 | 377 | Risk Ratio (M‐H, Fixed, 95% CI) | 1.04 [0.74, 1.45] |
| Outcome or subgroup title | No. of studies | No. of participants | Statistical method | Effect size |
| 1 Perineal trauma requiring suturing Show forest plot | 3 | Risk Ratio (M‐H, Random, 95% CI) | Subtotals only | |
| 1.1 Average number of massages per week < 1.5 | 2 | 1500 | Risk Ratio (M‐H, Random, 95% CI) | 0.84 [0.74, 0.96] |
| 1.2 Average number of massages per week = 1.5 to 3.4 | 2 | 1650 | Risk Ratio (M‐H, Random, 95% CI) | 0.92 [0.85, 1.00] |
| 1.3 Average number of massages per week > 3.5 | 2 | 1598 | Risk Ratio (M‐H, Random, 95% CI) | 0.94 [0.86, 1.02] |
| 1.4 Any frequency of massage | 3 | 2417 | Risk Ratio (M‐H, Random, 95% CI) | 0.91 [0.86, 0.96] |
| 2 1st degree perineal tear Show forest plot | 3 | Risk Ratio (M‐H, Random, 95% CI) | Subtotals only | |
| 2.1 Average number of massages per week < 1.5 | 2 | 1500 | Risk Ratio (M‐H, Random, 95% CI) | 1.04 [0.60, 1.83] |
| 2.2 Average number of massages per week = 1.5 to 3.4 | 2 | 1650 | Risk Ratio (M‐H, Random, 95% CI) | 1.00 [0.75, 1.33] |
| 2.3 Average number of massages per week > 3.5 | 2 | 1598 | Risk Ratio (M‐H, Random, 95% CI) | 0.89 [0.67, 1.17] |
| 2.4 Any frequency of massage | 3 | 2417 | Risk Ratio (M‐H, Random, 95% CI) | 0.99 [0.71, 1.38] |
| 3 2nd degree perineal tear Show forest plot | 3 | Risk Ratio (M‐H, Fixed, 95% CI) | Subtotals only | |
| 3.1 Average number of massages per week < 1.5 | 2 | 1500 | Risk Ratio (M‐H, Fixed, 95% CI) | 1.00 [0.78, 1.27] |
| 3.2 Average number of massages per week = 1.5 to 3.4 | 2 | 1650 | Risk Ratio (M‐H, Fixed, 95% CI) | 0.94 [0.75, 1.16] |
| 3.3 Average number of massages per week > 3.5 | 2 | 1598 | Risk Ratio (M‐H, Fixed, 95% CI) | 1.02 [0.82, 1.27] |
| 3.4 Any frequency of massage | 3 | 2417 | Risk Ratio (M‐H, Fixed, 95% CI) | 0.98 [0.84, 1.14] |
| 4 3rd or 4th degree perineal trauma Show forest plot | 3 | Risk Ratio (M‐H, Random, 95% CI) | Subtotals only | |
| 4.1 Average number of massages per week < 1.5 | 2 | 1500 | Risk Ratio (M‐H, Random, 95% CI) | 0.82 [0.08, 8.48] |
| 4.2 Average number of massages per week = 1.5 to 3.4 | 2 | 1650 | Risk Ratio (M‐H, Random, 95% CI) | 0.64 [0.33, 1.25] |
| 4.3 Average number of massages per week > 3.5 | 2 | 1598 | Risk Ratio (M‐H, Random, 95% CI) | 1.19 [0.78, 1.81] |
| 4.4 Any frequency of massage | 3 | 2417 | Risk Ratio (M‐H, Random, 95% CI) | 0.81 [0.56, 1.19] |
| 5 Incidence of episiotomy Show forest plot | 3 | Risk Ratio (M‐H, Fixed, 95% CI) | Subtotals only | |
| 5.1 Average number of massages per week < 1.5 | 2 | 1500 | Risk Ratio (M‐H, Fixed, 95% CI) | 0.72 [0.57, 0.91] |
| 5.2 Average number of massages per week = 1.5 to 3.4 | 2 | 1650 | Risk Ratio (M‐H, Fixed, 95% CI) | 0.91 [0.77, 1.08] |
| 5.3 Average number of massages per week > 3.5 | 2 | 1598 | Risk Ratio (M‐H, Fixed, 95% CI) | 0.84 [0.67, 1.04] |
| 5.4 Any frequency of massage | 3 | 2417 | Risk Ratio (M‐H, Fixed, 95% CI) | 0.85 [0.75, 0.97] |
| 6 Length of second stage Show forest plot | 2 | Mean Difference (IV, Random, 95% CI) | Subtotals only | |
| 6.1 Average number of massages per week < 1.5 | 2 | 1403 | Mean Difference (IV, Random, 95% CI) | 0.97 [‐6.45, 8.39] |
| 6.2 Average number of massages per week = 1.5 to 3.4 | 2 | 1525 | Mean Difference (IV, Random, 95% CI) | ‐2.38 [‐8.55, 3.79] |
| 6.3 Average number of massages per week > 3.5 | 2 | 1509 | Mean Difference (IV, Random, 95% CI) | 10.80 [4.03, 17.58] |
| 6.4 Any frequency of massage | 2 | 2211 | Mean Difference (IV, Random, 95% CI) | 3.35 [‐1.29, 8.00] |
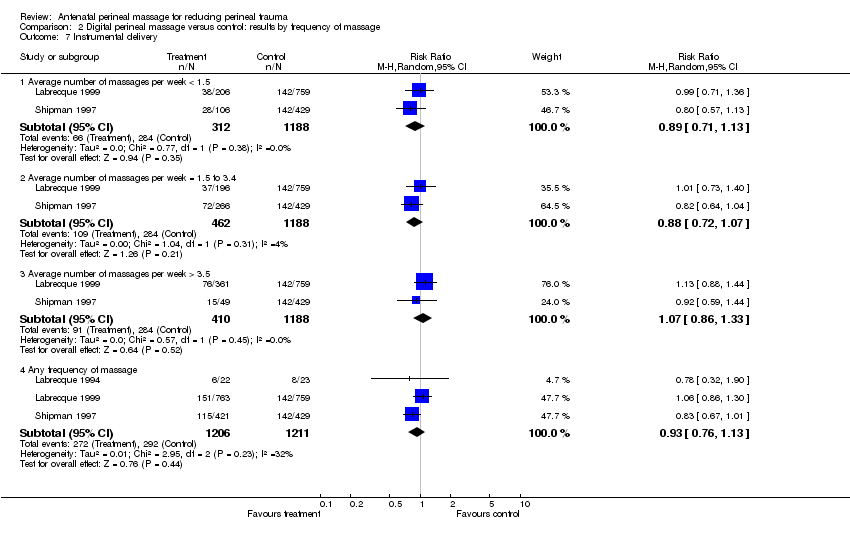
| 7 Instrumental delivery Show forest plot | 3 | Risk Ratio (M‐H, Random, 95% CI) | Subtotals only | |
| 7.1 Average number of massages per week < 1.5 | 2 | 1500 | Risk Ratio (M‐H, Random, 95% CI) | 0.89 [0.71, 1.13] |
| 7.2 Average number of massages per week = 1.5 to 3.4 | 2 | 1650 | Risk Ratio (M‐H, Random, 95% CI) | 0.88 [0.72, 1.07] |
| 7.3 Average number of massages per week > 3.5 | 2 | 1598 | Risk Ratio (M‐H, Random, 95% CI) | 1.07 [0.86, 1.33] |
| 7.4 Any frequency of massage | 3 | 2417 | Risk Ratio (M‐H, Random, 95% CI) | 0.93 [0.76, 1.13] |
| 8 Length of inpatient stay | 0 | Mean Difference (IV, Fixed, 95% CI) | Subtotals only | |
| 8.1 Average number of massages per week < 1.5 | 0 | 0 | Mean Difference (IV, Fixed, 95% CI) | 0.0 [0.0, 0.0] |
| 8.2 Average number of massages per week = 1.5 to 3.4 | 0 | 0 | Mean Difference (IV, Fixed, 95% CI) | 0.0 [0.0, 0.0] |
| 8.3 Average number of massages per week > 3.5 | 0 | 0 | Mean Difference (IV, Fixed, 95% CI) | 0.0 [0.0, 0.0] |
| 8.4 Any frequency of massage | 0 | 0 | Mean Difference (IV, Fixed, 95% CI) | 0.0 [0.0, 0.0] |
| 9 Admission to nursery | 0 | Risk Ratio (M‐H, Fixed, 95% CI) | Subtotals only | |
| 9.1 Average number of massages per week < 1.5 | 0 | 0 | Risk Ratio (M‐H, Fixed, 95% CI) | 0.0 [0.0, 0.0] |
| 9.2 Average number of massages per week = 1.5 to 3.4 | 0 | 0 | Risk Ratio (M‐H, Fixed, 95% CI) | 0.0 [0.0, 0.0] |
| 9.3 Average number of massages per week > 3.5 | 0 | 0 | Risk Ratio (M‐H, Fixed, 95% CI) | 0.0 [0.0, 0.0] |
| 9.4 Any frequency of massage | 0 | 0 | Risk Ratio (M‐H, Fixed, 95% CI) | 0.0 [0.0, 0.0] |
| 10 Apgar < 4 at 1 minute and/or Apgar < 7 at 5 minutes | 0 | Risk Ratio (M‐H, Fixed, 95% CI) | Subtotals only | |
| 10.1 Average number of massages per week < 1.5 | 0 | 0 | Risk Ratio (M‐H, Fixed, 95% CI) | 0.0 [0.0, 0.0] |
| 10.2 Average number of massages per week = 1.5 to 3.4 | 0 | 0 | Risk Ratio (M‐H, Fixed, 95% CI) | 0.0 [0.0, 0.0] |
| 10.3 Average number of massages per week > 3.5 | 0 | 0 | Risk Ratio (M‐H, Fixed, 95% CI) | 0.0 [0.0, 0.0] |
| 10.4 Any frequency of massage | 0 | 0 | Risk Ratio (M‐H, Fixed, 95% CI) | 0.0 [0.0, 0.0] |
| 11 Woman's satisfaction with perineal massage | 0 | Risk Ratio (M‐H, Fixed, 95% CI) | Subtotals only | |
| 11.1 Average number of massages per week < 1.5 | 0 | 0 | Risk Ratio (M‐H, Fixed, 95% CI) | 0.0 [0.0, 0.0] |
| 11.2 Average number of massages per week = 1.5 to 3.4 | 0 | 0 | Risk Ratio (M‐H, Fixed, 95% CI) | 0.0 [0.0, 0.0] |
| 11.3 Average number of massages per week > 3.5 | 0 | 0 | Risk Ratio (M‐H, Fixed, 95% CI) | 0.0 [0.0, 0.0] |
| 11.4 Any frequency of massage | 0 | 0 | Risk Ratio (M‐H, Fixed, 95% CI) | 0.0 [0.0, 0.0] |
| 12 Perineal pain postpartum | 0 | Mean Difference (IV, Fixed, 95% CI) | Subtotals only | |
| 12.1 Average number of massages per week < 1.5 | 0 | 0 | Mean Difference (IV, Fixed, 95% CI) | 0.0 [0.0, 0.0] |
| 12.2 Average number of massages per week = 1.5 to 3.4 | 0 | 0 | Mean Difference (IV, Fixed, 95% CI) | 0.0 [0.0, 0.0] |
| 12.3 Average number of massages per week > 3.5 | 0 | 0 | Mean Difference (IV, Fixed, 95% CI) | 0.0 [0.0, 0.0] |
| 12.4 Any frequency of massage | 0 | 0 | Mean Difference (IV, Fixed, 95% CI) | 0.0 [0.0, 0.0] |
| 13 Perineal pain at 3 months postpartum Show forest plot | 1 | Risk Ratio (M‐H, Fixed, 95% CI) | Subtotals only | |
| 13.1 Average number of massages per week < 1.5 | 1 | 577 | Risk Ratio (M‐H, Fixed, 95% CI) | 1.01 [0.65, 1.56] |
| 13.2 Average number of massages per week = 1.5 to 3.4 | 1 | 595 | Risk Ratio (M‐H, Fixed, 95% CI) | 0.69 [0.42, 1.13] |
| 13.3 Average number of massages per week > 3.5 | 1 | 701 | Risk Ratio (M‐H, Fixed, 95% CI) | 0.51 [0.33, 0.79] |
| 13.4 Any frequency of massage | 1 | 931 | Risk Ratio (M‐H, Fixed, 95% CI) | 0.67 [0.50, 0.92] |
| 14 Painful sex at 3 months postpartum Show forest plot | 1 | Risk Ratio (M‐H, Fixed, 95% CI) | Subtotals only | |
| 14.1 Average number of massages per week < 1.5 | 1 | 521 | Risk Ratio (M‐H, Fixed, 95% CI) | 0.85 [0.67, 1.08] |
| 14.2 Average number of massages per week = 1.5 to 3.4 | 1 | 538 | Risk Ratio (M‐H, Fixed, 95% CI) | 1.03 [0.85, 1.25] |
| 14.3 Average number of massages per week > 3.5 | 1 | 622 | Risk Ratio (M‐H, Fixed, 95% CI) | 0.96 [0.81, 1.13] |
| 14.4 Any frequency of massage | 1 | 831 | Risk Ratio (M‐H, Fixed, 95% CI) | 0.95 [0.83, 1.09] |
| 15 Woman's sexual satisfaction at 3 months postpartum Show forest plot | 1 | Risk Ratio (M‐H, Fixed, 95% CI) | Subtotals only | |
| 15.1 Average number of massages per week < 1.5 | 1 | 569 | Risk Ratio (M‐H, Fixed, 95% CI) | 1.04 [0.93, 1.16] |
| 15.2 Average number of massages per week = 1.5 to 3.4 | 1 | 588 | Risk Ratio (M‐H, Fixed, 95% CI) | 1.08 [0.98, 1.19] |
| 15.3 Average number of massages per week > 3.5 | 1 | 692 | Risk Ratio (M‐H, Fixed, 95% CI) | 0.99 [0.90, 1.08] |
| 15.4 Any frequency of massage | 1 | 921 | Risk Ratio (M‐H, Fixed, 95% CI) | 1.02 [0.96, 1.10] |
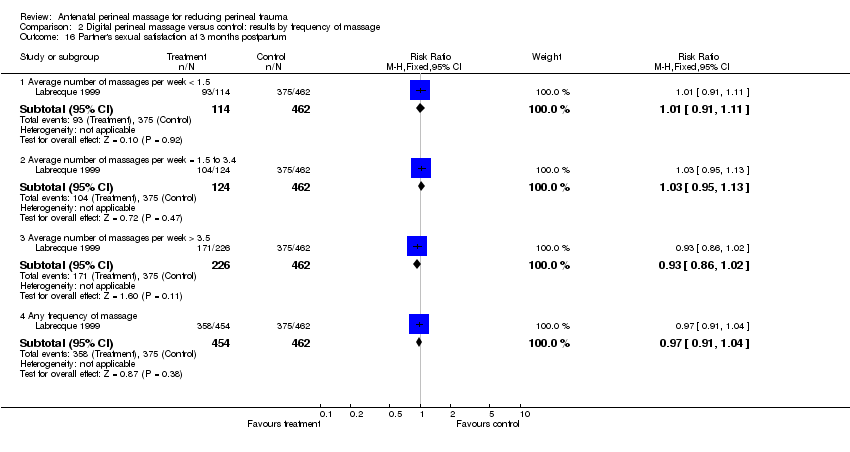
| 16 Partner's sexual satisfaction at 3 months postpartum Show forest plot | 1 | Risk Ratio (M‐H, Fixed, 95% CI) | Subtotals only | |
| 16.1 Average number of massages per week < 1.5 | 1 | 576 | Risk Ratio (M‐H, Fixed, 95% CI) | 1.01 [0.91, 1.11] |
| 16.2 Average number of massages per week = 1.5 to 3.4 | 1 | 586 | Risk Ratio (M‐H, Fixed, 95% CI) | 1.03 [0.95, 1.13] |
| 16.3 Average number of massages per week > 3.5 | 1 | 688 | Risk Ratio (M‐H, Fixed, 95% CI) | 0.93 [0.86, 1.02] |
| 16.4 Any frequency of massage | 1 | 916 | Risk Ratio (M‐H, Fixed, 95% CI) | 0.97 [0.91, 1.04] |
| 17 Uncontrolled loss of urine at 3 months postpartum Show forest plot | 1 | Risk Ratio (M‐H, Fixed, 95% CI) | Subtotals only | |
| 17.1 Average number of massages per week < 1.5 | 1 | 587 | Risk Ratio (M‐H, Fixed, 95% CI) | 1.10 [0.83, 1.46] |
| 17.2 Average number of massages per week = 1.5 to 3.4 | 1 | 606 | Risk Ratio (M‐H, Fixed, 95% CI) | 0.84 [0.62, 1.15] |
| 17.3 Average number of massages per week > 3.5 | 1 | 714 | Risk Ratio (M‐H, Fixed, 95% CI) | 0.83 [0.65, 1.06] |
| 17.4 Any frequency of massage | 1 | 949 | Risk Ratio (M‐H, Fixed, 95% CI) | 0.90 [0.74, 1.08] |
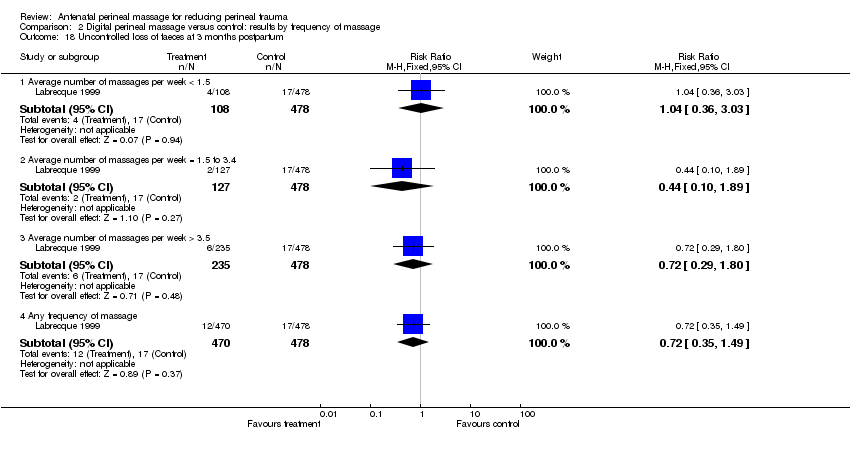
| 18 Uncontrolled loss of faeces at 3 months postpartum Show forest plot | 1 | Risk Ratio (M‐H, Fixed, 95% CI) | Subtotals only | |
| 18.1 Average number of massages per week < 1.5 | 1 | 586 | Risk Ratio (M‐H, Fixed, 95% CI) | 1.04 [0.36, 3.03] |
| 18.2 Average number of massages per week = 1.5 to 3.4 | 1 | 605 | Risk Ratio (M‐H, Fixed, 95% CI) | 0.44 [0.10, 1.89] |
| 18.3 Average number of massages per week > 3.5 | 1 | 713 | Risk Ratio (M‐H, Fixed, 95% CI) | 0.72 [0.29, 1.80] |
| 18.4 Any frequency of massage | 1 | 948 | Risk Ratio (M‐H, Fixed, 95% CI) | 0.72 [0.35, 1.49] |
| 19 Uncontrolled loss of flatus at 3 months postpartum Show forest plot | 1 | 2854 | Risk Ratio (M‐H, Fixed, 95% CI) | 1.09 [0.95, 1.25] |
| 19.1 Average number of massages per week < 1.5 | 1 | 587 | Risk Ratio (M‐H, Fixed, 95% CI) | 1.40 [1.03, 1.90] |
| 19.2 Average number of massages per week = 1.5 to 3.4 | 1 | 606 | Risk Ratio (M‐H, Fixed, 95% CI) | 0.87 [0.60, 1.26] |
| 19.3 Average number of massages per week > 3.5 | 1 | 713 | Risk Ratio (M‐H, Fixed, 95% CI) | 1.07 [0.82, 1.39] |
| 19.4 Any frequency of massage | 1 | 948 | Risk Ratio (M‐H, Fixed, 95% CI) | 1.09 [0.88, 1.36] |