Scolaris Content Display Scolaris Content Display

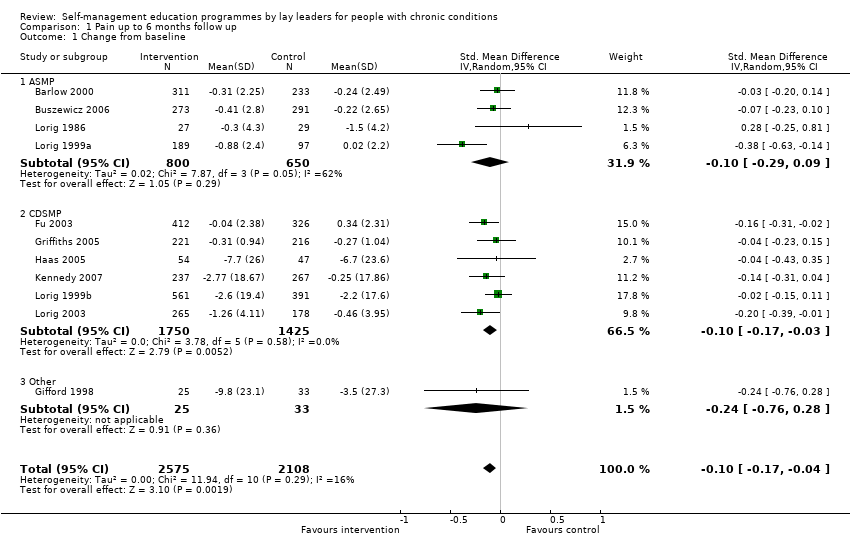
Comparison 1 Pain up to 6 months follow up, Outcome 1 Change from baseline.
Figuras y tablas -
Analysis 1.1

Comparison 1 Pain up to 6 months follow up, Outcome 1 Change from baseline.

Comparison 2 Pain more than 6 months follow up, Outcome 1 Change from baseline.
Figuras y tablas -
Analysis 2.1

Comparison 2 Pain more than 6 months follow up, Outcome 1 Change from baseline.

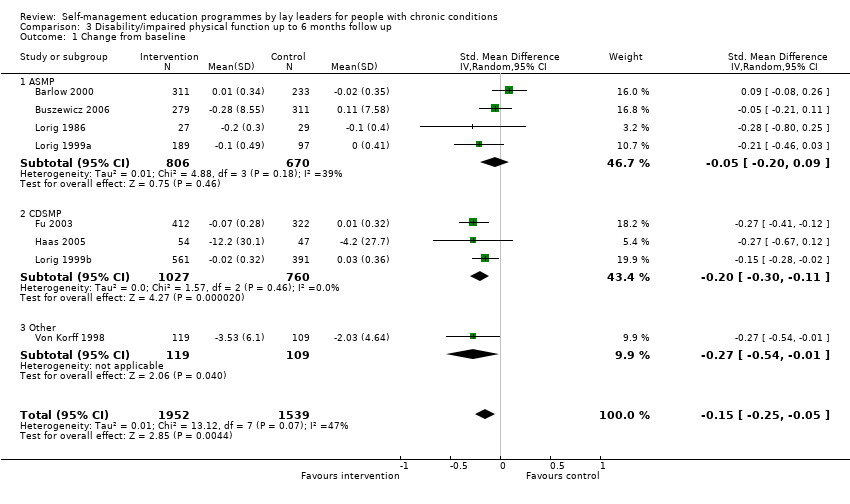
Comparison 3 Disability/impaired physical function up to 6 months follow up, Outcome 1 Change from baseline.
Figuras y tablas -
Analysis 3.1

Comparison 3 Disability/impaired physical function up to 6 months follow up, Outcome 1 Change from baseline.

Comparison 4 Disability more than 6 months follow up, Outcome 1 Change from baseline.
Figuras y tablas -
Analysis 4.1

Comparison 4 Disability more than 6 months follow up, Outcome 1 Change from baseline.

Comparison 5 Fatigue up to 6 months follow up, Outcome 1 Change from baseline.
Figuras y tablas -
Analysis 5.1

Comparison 5 Fatigue up to 6 months follow up, Outcome 1 Change from baseline.

Comparison 6 Shortness of breath up to 6 months follow up, Outcome 1 Change from baseline.
Figuras y tablas -
Analysis 6.1

Comparison 6 Shortness of breath up to 6 months follow up, Outcome 1 Change from baseline.

Comparison 7 Depression up to 6 months follow up, Outcome 1 Change from baseline.
Figuras y tablas -
Analysis 7.1

Comparison 7 Depression up to 6 months follow up, Outcome 1 Change from baseline.

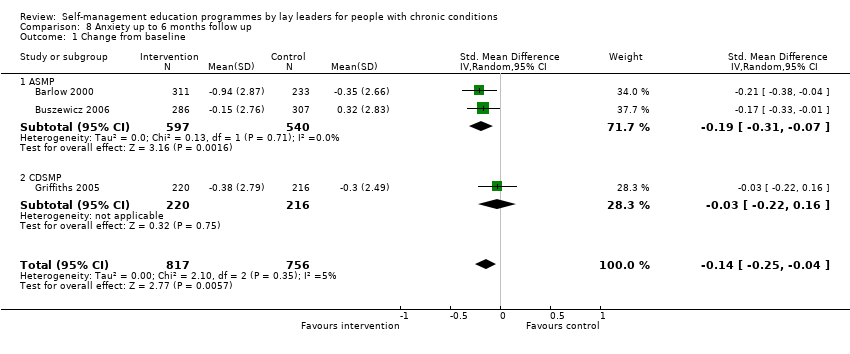
Comparison 8 Anxiety up to 6 months follow up, Outcome 1 Change from baseline.
Figuras y tablas -
Analysis 8.1

Comparison 8 Anxiety up to 6 months follow up, Outcome 1 Change from baseline.

Comparison 9 Psychological well being up to 6 months follow up, Outcome 1 Change from baseline.
Figuras y tablas -
Analysis 9.1

Comparison 9 Psychological well being up to 6 months follow up, Outcome 1 Change from baseline.

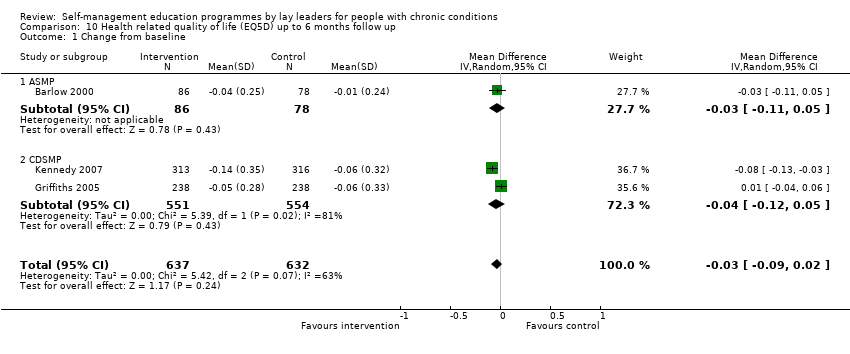
Comparison 10 Health related quality of life (EQ5D) up to 6 months follow up, Outcome 1 Change from baseline.
Figuras y tablas -
Analysis 10.1

Comparison 10 Health related quality of life (EQ5D) up to 6 months follow up, Outcome 1 Change from baseline.

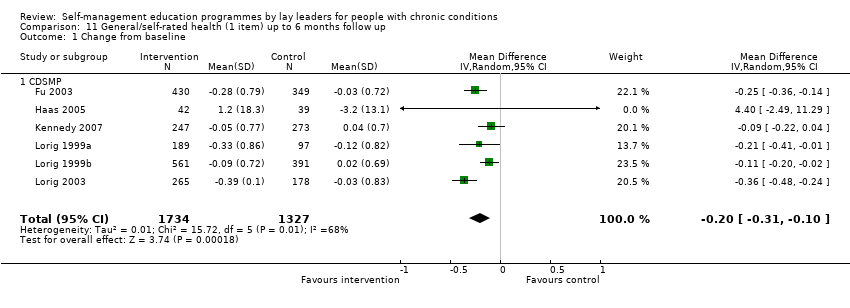
Comparison 11 General/self‐rated health (1 item) up to 6 months follow up, Outcome 1 Change from baseline.
Figuras y tablas -
Analysis 11.1

Comparison 11 General/self‐rated health (1 item) up to 6 months follow up, Outcome 1 Change from baseline.

Comparison 12 Health distress up to 6 months follow up, Outcome 1 Change from baseline.
Figuras y tablas -
Analysis 12.1

Comparison 12 Health distress up to 6 months follow up, Outcome 1 Change from baseline.

Comparison 13 Frequency of aerobic exercise up to 6 months follow up, Outcome 1 Change from baseline.
Figuras y tablas -
Analysis 13.1

Comparison 13 Frequency of aerobic exercise up to 6 months follow up, Outcome 1 Change from baseline.

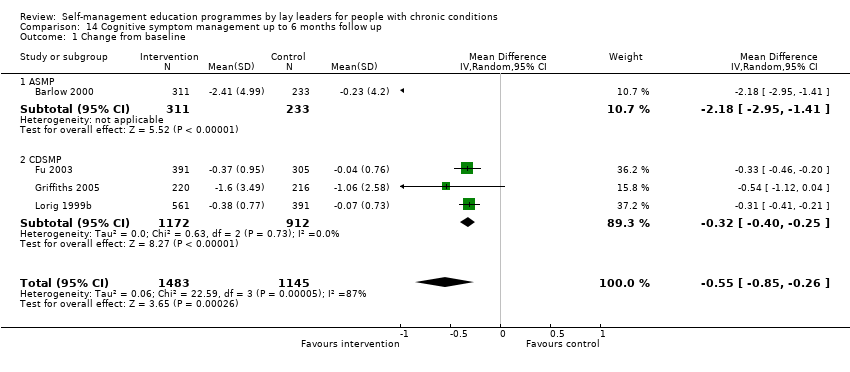
Comparison 14 Cognitive symptom management up to 6 months follow up, Outcome 1 Change from baseline.
Figuras y tablas -
Analysis 14.1

Comparison 14 Cognitive symptom management up to 6 months follow up, Outcome 1 Change from baseline.

Comparison 15 Physician/GP visits up to 6 months follow up (for Barlow 2000, GP visits for arthritis), Outcome 1 Change from baseline.
Figuras y tablas -
Analysis 15.1

Comparison 15 Physician/GP visits up to 6 months follow up (for Barlow 2000, GP visits for arthritis), Outcome 1 Change from baseline.

Comparison 16 Number of days/or nights spent in hospital up to 6 months follow up, Outcome 1 Change from baseline.
Figuras y tablas -
Analysis 16.1

Comparison 16 Number of days/or nights spent in hospital up to 6 months follow up, Outcome 1 Change from baseline.

Comparison 17 Self‐efficacy to manage pain (ASMP) or symptoms/condition (all other) up to 6 months follow up, Outcome 1 Change from baseline.
Figuras y tablas -
Analysis 17.1

Comparison 17 Self‐efficacy to manage pain (ASMP) or symptoms/condition (all other) up to 6 months follow up, Outcome 1 Change from baseline.

Comparison 18 Communication with health professionals up to 6 months follow up, Outcome 1 Change from baseline.
Figuras y tablas -
Analysis 18.1

Comparison 18 Communication with health professionals up to 6 months follow up, Outcome 1 Change from baseline.

Table 1. Study quality components table

Study ID

Randomisation

Allocation Conceal

Blinding O A

Blindin D A

Baseline

Attrition bias (a)

ITT analysis

Validation (b)

Barlow 2000

Pre‐generated lists of random allocations

Done

Unclear

Unclear

Yes

32% I
27% C

Yes

Yes

Buszewicz 2006

Computerised system with minimisation

Done

Yes

Unclear

Yes

27.5% I
20% C

Yes

Yes

Cohen 1986

Unclear

Unclear

Unclear

Unclear

Yes

12.5% I
5. 5% C
17% HP (c)

No

Unclear

de Weerdt 1991

Unclear

Unclear

Unclear

Unclear

Yes

Unclear

No

yes

Fu 2003

Random number table

Unclear

Yes

Unclear

Yes

11% I
16% C

Yes, data not presented

Unclear

Gifford 1998

Unclear

Unclear

Unclear

Unclear

Yes

26.5% I
11% C

No

Unclear

Griffiths 2005

Computer minimization programme

Done

Yes

Unclear

Yes

7% I
8% C

No

Yes

Haas 2005

Equal allocation algorithm stratified by race

Unclear

Unclear

Unclear

Yes (d)

38% I
33% C

No

Yes

Kennedy 2007

A computer generated minimisation procedure

Done

Unclear

Unclear

Yes

21% I
14% C (e)

No

Yes

Lorig 1986

Unclear

Unclear

Unclear

Unclear

Yes (f)

21% I
9% C
15% HP

No

Yes, partly

Lorig 1999a

Unclear

Unclear

Unclear

Unclear

Yes

14% I
15.4% C

Yes, data not presented

Yes, partly

Lorig 1999b

Unclear

Unclear

Yes

Unclear

Yes

16% I
18% C

Yes, data not presented

Yes, partly

Lorig 2003

Unclear

Unclear

Yes

Unclear

Yes

19% I
20% C

Yes, data not presented

Yes

Riegel 2004

Pre‐assigned random number sequence

Unclear

Unclear

Unclear

Yes

29% I
33% C

Yes, resource use only

Yes

Summers Holtrop 2002

Unclear

Unclear

Unclear

Unclear

Yes

28% I
35% C

Yes

Yes

Swerissen 2006

Unclear

Unclear

Unclear

Unclear

Yes

31% I
41% C

No

Unclear

Von Korff 1998

Unclear

Unclear

Yes

Unclear

Yes

8% I
13% C
* @6m

No

Yes

a) % attrition in intervention (I), control (c) groups and (HP) health care professional led groups,

b) where some tools/ instruments are validated and others appear not to have been validated and no primary outcomes are given we have scored this as unclear,

c) Health professional group possessed significantly more knowledge than lay led or control group

d) authors' report no important differences between groups however, the control group were 75% more likely to have seen a health care provider in the previous 2 weeks,

e) authors report a differential attrition rate

f) lay led group were significantly older.

Figuras y tablas -
Table 1. Study quality components table
Table 2. Chronic conditions of participants

Study ID

Chronic condition

Method of diagnosis

Barlow 2000

Arthritis

Confirmed by GP

Buszewicz 2006

Osteoarthritis of the hips or knees (or both)

From general practice database

Cohen 1986

Arthritis

Self diagnosed and possibly health professional identified

de Weerdt 1991

Adult diabetics on insulin

Identified by hospital physician

Fu 2003

Hypertension, heart disease, chronic lung disease, arthritis, stroke or diabetes

Confirmed by medical record.

Gifford 1998

HIV+

Identified by health care providers

Griffiths 2005

Diabetes, arthritis, respiratory or cardiovascular disease

From general practice database

Haas 2005

Chronic low back pain

Insufficient details

Summers Holtrop 2002

Type II diabetes

Computerized billing lists

Kennedy 2007

Musculoskeletal, endocrine, circulatory, myalgic encephalitis /chronic fatigue, respiratory, mental health and neurological conditions.

Self defined

Lorig 1986

Arthritis

Confirmed by personal physician

Lorig 1999a

Arthritis

Insufficient details

Lorig 1999b

Chronic lung disease, heart disease or chronic arthritis

Confirmed by physician

Lorig 2003

Heart disease, Lung disease or type II diabetes

Mostly confirmed by a physician, otherwise they were self reported

Riegel 2004

Heart failure

Hospitalised patients

Swerissen 2006

Arthritis, hypertension, diabetes, heart disease, asthma or chronic pain

Confirmed diagnosis, however insufficient details about confirmation.

Von Korff 1998

Chronic low back pain (back pain or strain, a disc disorder, or sciatica).

Identified from diagnoses recorded on automated visit encounter forms

Figuras y tablas -
Table 2. Chronic conditions of participants
Table 3. Included studies ‐ outcome data not used in meta‐analyses

Study ID

Outcome measure

Reason for omission

Barlow 2000

Negative and positive affect, diet and fluids.

No or only one other study used these or similar measures.

Buszewicz 2006

Stiffness (WOMAC).

No other studies used this or a similar measure.

Cohen 1986

Arthritis self management knowledge and behaviour, pain, disability, perceived instrumental support, perceived affective support.

Authors combined the results for lay‐led and health professional led groups.

de Weerdt 1991

Number of hypoglycaemic reactions, severity of attacks, costs of therapy, number of days unable to work, attitude and social norm, anxiety

No or only one other study used these or similar measures. For anxiety no results were presented.

Fu 2003

Illness intrusiveness, social/role activity limitations, energy, stretching exercises, emergency room visits.

No or only one other study used these or similar measures.

Gifford 1998

HIV knowledge, stress/relaxation exercises, stress, anger.

No or only one other study used these or similar measures.

Haas 2005

Number of days with pain, energy‐fatigue.

No or only one other study used these or similar measures.

Kennedy 2007

Relaxation, energy, social role limitations, information seeking, diet, specialist OPD visits, complementary products.

No or only one other study used these or similar measures.

Lorig 1986

Arthritis knowledge, relaxation exercises.

No or only one other study used these or similar measures.

Lorig 1999a

Medication use, NSAIDs, range of motion exercises.

No or only one other study used these or similar measures.

Lorig 1999b

Stretching and strengthening exercise, social/role activities, number of hospital stays.

No or only one other study used these or similar measures.

Lorig 2003

Role function, mental stress management, current tobacco use.

No or only one other study used these or similar measures.

Riegel 2004

Self care maintenance, self care of heart failure, confidence in ability to communicate with physician, social support.

No or only one other study used these or similar measures.

Summers Holtrop 2002

Stages for behaviour change, behaviour risk factor (dietary fat and fruit intake), thoughts and feelings about diabetes.

No other studies used these, or a similar measures.

Swerissen 2006

Health status, health behaviour, self efficacy, health care use, energy, role function, illness intrusiveness.

Data not available as mean change from baseline.

Von Korff 1998

Attitudes towards back pain, self care orientation, mental health inventory, back pain worries, pain intensity and interference.

Data not available as mean change from baseline.

Figuras y tablas -
Table 3. Included studies ‐ outcome data not used in meta‐analyses
Comparison 1. Pain up to 6 months follow up

Outcome or subgroup title

No. of studies

No. of participants

Statistical method

Effect size

1 Change from baseline Show forest plot

11

4683

Std. Mean Difference (IV, Random, 95% CI)

‐0.10 [‐0.17, ‐0.04]

1.1 ASMP

4

1450

Std. Mean Difference (IV, Random, 95% CI)

‐0.10 [‐0.29, 0.09]

1.2 CDSMP

6

3175

Std. Mean Difference (IV, Random, 95% CI)

‐0.10 [‐0.17, ‐0.03]

1.3 Other

1

58

Std. Mean Difference (IV, Random, 95% CI)

‐0.24 [‐0.76, 0.28]

Figuras y tablas -
Comparison 1. Pain up to 6 months follow up
Comparison 2. Pain more than 6 months follow up

Outcome or subgroup title

No. of studies

No. of participants

Statistical method

Effect size

1 Change from baseline Show forest plot

1

530

Std. Mean Difference (IV, Random, 95% CI)

‐0.12 [‐0.29, 0.05]

Figuras y tablas -
Comparison 2. Pain more than 6 months follow up
Comparison 3. Disability/impaired physical function up to 6 months follow up

Outcome or subgroup title

No. of studies

No. of participants

Statistical method

Effect size

1 Change from baseline Show forest plot

8

3491

Std. Mean Difference (IV, Random, 95% CI)

‐0.15 [‐0.25, ‐0.05]

1.1 ASMP

4

1476

Std. Mean Difference (IV, Random, 95% CI)

‐0.05 [‐0.20, 0.09]

1.2 CDSMP

3

1787

Std. Mean Difference (IV, Random, 95% CI)

‐0.20 [‐0.30, ‐0.11]

1.3 Other

1

228

Std. Mean Difference (IV, Random, 95% CI)

‐0.27 [‐0.54, ‐0.01]

Figuras y tablas -
Comparison 3. Disability/impaired physical function up to 6 months follow up
Comparison 4. Disability more than 6 months follow up

Outcome or subgroup title

No. of studies

No. of participants

Statistical method

Effect size

1 Change from baseline Show forest plot

2

777

Std. Mean Difference (IV, Random, 95% CI)

0.06 [‐0.22, 0.33]

1.1 ASMP

1

559

Std. Mean Difference (IV, Random, 95% CI)

‐0.07 [‐0.23, 0.10]

1.2 CDSMP

0

0

Std. Mean Difference (IV, Random, 95% CI)

0.0 [0.0, 0.0]

1.3 Other

1

218

Std. Mean Difference (IV, Random, 95% CI)

0.22 [‐0.05, 0.48]

Figuras y tablas -
Comparison 4. Disability more than 6 months follow up
Comparison 5. Fatigue up to 6 months follow up

Outcome or subgroup title

No. of studies

No. of participants

Statistical method

Effect size

1 Change from baseline Show forest plot

7

3251

Std. Mean Difference (IV, Random, 95% CI)

‐0.16 [‐0.23, ‐0.09]

1.1 ASMP

1

544

Std. Mean Difference (IV, Random, 95% CI)

‐0.20 [‐0.37, ‐0.03]

1.2 CDSMP

5

2649

Std. Mean Difference (IV, Random, 95% CI)

‐0.15 [‐0.22, ‐0.07]

1.3 Other

1

58

Std. Mean Difference (IV, Random, 95% CI)

‐0.43 [‐0.95, 0.10]

Figuras y tablas -
Comparison 5. Fatigue up to 6 months follow up
Comparison 6. Shortness of breath up to 6 months follow up

Outcome or subgroup title

No. of studies

No. of participants

Statistical method

Effect size

1 Change from baseline Show forest plot

3

2126

Std. Mean Difference (IV, Random, 95% CI)

‐0.09 [‐0.25, 0.06]

1.1 CDSMP

3

2126

Std. Mean Difference (IV, Random, 95% CI)

‐0.09 [‐0.25, 0.06]

Figuras y tablas -
Comparison 6. Shortness of breath up to 6 months follow up
Comparison 7. Depression up to 6 months follow up

Outcome or subgroup title

No. of studies

No. of participants

Statistical method

Effect size

1 Change from baseline Show forest plot

6

2613

Std. Mean Difference (IV, Random, 95% CI)

‐0.16 [‐0.24, ‐0.07]

1.1 ASMP

3

1426

Std. Mean Difference (IV, Random, 95% CI)

‐0.22 [‐0.34, ‐0.09]

1.2 CDSMP

2

1129

Std. Mean Difference (IV, Random, 95% CI)

‐0.10 [‐0.22, 0.02]

1.3 Other

1

58

Std. Mean Difference (IV, Random, 95% CI)

0.10 [‐0.42, 0.62]

Figuras y tablas -
Comparison 7. Depression up to 6 months follow up
Comparison 8. Anxiety up to 6 months follow up

Outcome or subgroup title

No. of studies

No. of participants

Statistical method

Effect size

1 Change from baseline Show forest plot

3

1573

Std. Mean Difference (IV, Random, 95% CI)

‐0.14 [‐0.25, ‐0.04]

1.1 ASMP

2

1137

Std. Mean Difference (IV, Random, 95% CI)

‐0.19 [‐0.31, ‐0.07]

1.2 CDSMP

1

436

Std. Mean Difference (IV, Random, 95% CI)

‐0.03 [‐0.22, 0.16]

Figuras y tablas -
Comparison 8. Anxiety up to 6 months follow up
Comparison 9. Psychological well being up to 6 months follow up

Outcome or subgroup title

No. of studies

No. of participants

Statistical method

Effect size

1 Change from baseline Show forest plot

5

2168

Std. Mean Difference (IV, Random, 95% CI)

‐0.12 [‐0.33, 0.09]

1.1 ASMP

1

432

Std. Mean Difference (IV, Random, 95% CI)

0.03 [‐0.16, 0.21]

1.2 CDSMP

3

1551

Std. Mean Difference (IV, Random, 95% CI)

‐0.28 [‐0.55, ‐0.01]

1.3 Other

1

185

Std. Mean Difference (IV, Random, 95% CI)

0.21 [‐0.08, 0.50]

Figuras y tablas -
Comparison 9. Psychological well being up to 6 months follow up
Comparison 10. Health related quality of life (EQ5D) up to 6 months follow up

Outcome or subgroup title

No. of studies

No. of participants

Statistical method

Effect size

1 Change from baseline Show forest plot

3

1269

Mean Difference (IV, Random, 95% CI)

‐0.03 [‐0.09, 0.02]

1.1 ASMP

1

164

Mean Difference (IV, Random, 95% CI)

‐0.03 [‐0.11, 0.05]

1.2 CDSMP

2

1105

Mean Difference (IV, Random, 95% CI)

‐0.04 [‐0.12, 0.05]

Figuras y tablas -
Comparison 10. Health related quality of life (EQ5D) up to 6 months follow up
Comparison 11. General/self‐rated health (1 item) up to 6 months follow up

Outcome or subgroup title

No. of studies

No. of participants

Statistical method

Effect size

1 Change from baseline Show forest plot

6

3061

Mean Difference (IV, Random, 95% CI)

‐0.20 [‐0.31, ‐0.10]

1.1 CDSMP

6

3061

Mean Difference (IV, Random, 95% CI)

‐0.20 [‐0.31, ‐0.10]

Figuras y tablas -
Comparison 11. General/self‐rated health (1 item) up to 6 months follow up
Comparison 12. Health distress up to 6 months follow up

Outcome or subgroup title

No. of studies

No. of participants

Statistical method

Effect size

1 Change from baseline Show forest plot

4

2593

Std. Mean Difference (IV, Random, 95% CI)

‐0.25 [‐0.34, ‐0.15]

1.1 CDSMP

4

2593

Std. Mean Difference (IV, Random, 95% CI)

‐0.25 [‐0.34, ‐0.15]

Figuras y tablas -
Comparison 12. Health distress up to 6 months follow up
Comparison 13. Frequency of aerobic exercise up to 6 months follow up

Outcome or subgroup title

No. of studies

No. of participants

Statistical method

Effect size

1 Change from baseline Show forest plot

7

3040

Std. Mean Difference (IV, Random, 95% CI)

‐0.20 [‐0.27, ‐0.12]

1.1 ASMP

2

342

Std. Mean Difference (IV, Random, 95% CI)

‐0.38 [‐1.09, 0.32]

1.2 CDSMP

4

2640

Std. Mean Difference (IV, Random, 95% CI)

‐0.19 [‐0.27, ‐0.11]

1.3 Other

1

58

Std. Mean Difference (IV, Random, 95% CI)

‐0.42 [‐0.94, 0.11]

Figuras y tablas -
Comparison 13. Frequency of aerobic exercise up to 6 months follow up
Comparison 14. Cognitive symptom management up to 6 months follow up

Outcome or subgroup title

No. of studies

No. of participants

Statistical method

Effect size

1 Change from baseline Show forest plot

4

2628

Mean Difference (IV, Random, 95% CI)

‐0.55 [‐0.85, ‐0.26]

1.1 ASMP

1

544

Mean Difference (IV, Random, 95% CI)

‐2.18 [‐2.95, ‐1.41]

1.2 CDSMP

3

2084

Mean Difference (IV, Random, 95% CI)

‐0.32 [‐0.40, ‐0.25]

Figuras y tablas -
Comparison 14. Cognitive symptom management up to 6 months follow up
Comparison 15. Physician/GP visits up to 6 months follow up (for Barlow 2000, GP visits for arthritis)

Outcome or subgroup title

No. of studies

No. of participants

Statistical method

Effect size

1 Change from baseline Show forest plot

9

3812

Std. Mean Difference (IV, Random, 95% CI)

‐0.03 [‐0.09, 0.04]

1.1 ASMP

3

506

Std. Mean Difference (IV, Random, 95% CI)

0.04 [‐0.14, 0.22]

1.2 CDSMP

5

3121

Std. Mean Difference (IV, Random, 95% CI)

‐0.04 [‐0.11, 0.03]

1.3 Other

1

185

Std. Mean Difference (IV, Random, 95% CI)

0.08 [‐0.21, 0.37]

Figuras y tablas -
Comparison 15. Physician/GP visits up to 6 months follow up (for Barlow 2000, GP visits for arthritis)
Comparison 16. Number of days/or nights spent in hospital up to 6 months follow up

Outcome or subgroup title

No. of studies

No. of participants

Statistical method

Effect size

1 Change from baseline Show forest plot

6

3310

Mean Difference (IV, Random, 95% CI)

‐0.32 [‐0.71, 0.07]

1.1 CDSMP

5

3125

Mean Difference (IV, Random, 95% CI)

‐0.24 [‐0.61, 0.13]

1.2 Other

1

185

Mean Difference (IV, Random, 95% CI)

‐1.3 [‐2.83, 0.23]

Figuras y tablas -
Comparison 16. Number of days/or nights spent in hospital up to 6 months follow up
Comparison 17. Self‐efficacy to manage pain (ASMP) or symptoms/condition (all other) up to 6 months follow up

Outcome or subgroup title

No. of studies

No. of participants

Statistical method

Effect size

1 Change from baseline Show forest plot

10

3682

Std. Mean Difference (IV, Random, 95% CI)

‐0.30 [‐0.41, ‐0.19]

1.1 ASMP

3

1421

Std. Mean Difference (IV, Random, 95% CI)

‐0.35 [‐0.46, ‐0.24]

1.2 CDSMP

5

2146

Std. Mean Difference (IV, Random, 95% CI)

‐0.26 [‐0.43, ‐0.09]

1.3 Other

2

115

Std. Mean Difference (IV, Random, 95% CI)

‐0.21 [‐0.87, 0.44]

Figuras y tablas -
Comparison 17. Self‐efficacy to manage pain (ASMP) or symptoms/condition (all other) up to 6 months follow up
Comparison 18. Communication with health professionals up to 6 months follow up

Outcome or subgroup title

No. of studies

No. of participants

Statistical method

Effect size

1 Change from baseline Show forest plot

7

3643

Std. Mean Difference (IV, Random, 95% CI)

‐0.15 [‐0.25, ‐0.05]

1.1 ASMP

1

544

Std. Mean Difference (IV, Random, 95% CI)

‐0.28 [‐0.45, ‐0.10]

1.2 CDSMP

5

3038

Std. Mean Difference (IV, Random, 95% CI)

‐0.13 [‐0.24, ‐0.01]

1.3 Other

1

61

Std. Mean Difference (IV, Random, 95% CI)

‐0.02 [‐0.52, 0.48]

Figuras y tablas -
Comparison 18. Communication with health professionals up to 6 months follow up