| 1 pain [intensity] Show forest plot | 5 | | Std. Mean Difference (IV, Random, 95% CI) | Totals not selected |
|
| 1.1 INDIV [instruct: act‐as‐usual] versus REST [Collar two weeks]: acute WAD at one session + six weeks follow‐up | 1 | | Std. Mean Difference (IV, Random, 95% CI) | 0.0 [0.0, 0.0] |
| 1.2 INDIV [instruct: act‐as‐usual] vs REST [Collar two weeks]: acute WAD at one session + 24 weeks follow‐up | 1 | | Std. Mean Difference (IV, Random, 95% CI) | 0.0 [0.0, 0.0] |
| 1.3 GROUP [written info, instruct: exercise, disorder] versus HOME EXERCISE: chronic MND at two sessions/two weeks + 12 weeks follow‐up | 1 | | Std. Mean Difference (IV, Random, 95% CI) | 0.0 [0.0, 0.0] |
| 1.4 GROUP [written info, instruct: exercise, disorder] versus HOME EXERCISE: chronic MND at two sessions/two weeks + 56 weeks follow‐up | 1 | | Std. Mean Difference (IV, Random, 95% CI) | 0.0 [0.0, 0.0] |
| 1.5 GROUP [written info, instruct: exercise, disorder] versus COGNITIVE BEHAV: chronic MND at two sessions/two weeks + 12 weeks follow‐up | 1 | | Std. Mean Difference (IV, Random, 95% CI) | 0.0 [0.0, 0.0] |
| 1.6 GROUP [written info, instruct: exercise, disorder] versus COGITIVE BEHAV: chronic MND at two sessions/two weeks + 56 weeks follow‐up | 1 | | Std. Mean Difference (IV, Random, 95% CI) | 0.0 [0.0, 0.0] |
| 1.7 INDIV [instruct: ex, rest/activities, posture, lift/carrying] versus EXERCISE: acute WAD at six weeks/three sessions + 24 weeks follow‐up | 1 | | Std. Mean Difference (IV, Random, 95% CI) | 0.0 [0.0, 0.0] |
| 1.8 INDIV [Video, written info, discuss: return to normal activities] versus USUAL CARE: subacute/chronic MND at two sessions + 12 weeks follow‐up | 1 | | Std. Mean Difference (IV, Random, 95% CI) | 0.0 [0.0, 0.0] |
| 1.9 INDIV [Video, written info, discuss: return to normal activities] versus USUAL CARE: subacute/chronic MND at two sessions + 52 weeks follow‐up | 1 | | Std. Mean Difference (IV, Random, 95% CI) | 0.0 [0.0, 0.0] |
| 2 pain [intensity] Show forest plot | | | Other data | No numeric data |
|
| 2.1 INDIV [act‐as‐usual] versus REST: acute WAD at one session + six weeks follow‐up | | | Other data | No numeric data |
| 2.2 INDIV [act‐as‐usual] versus REST: acute WAD at one session + 24 weeks follow‐up | | | Other data | No numeric data |
| 3 headache Show forest plot | | | Other data | No numeric data |
|
| 3.1 INDIV [act‐as‐usual] versus REST: acute WAD at one session + six weeks follow‐up | | | Other data | No numeric data |
| 3.2 INDIV [act‐as‐usual] versus REST: acute WAD at one session + 24 weeks follow‐up | | | Other data | No numeric data |
| 4 change in pain Show forest plot | | | Other data | No numeric data |
|
| 4.1 INDIV [written info, instruct: ex] versus BOOKLET: duration disorder not specified, MND at two weeks | | | Other data | No numeric data |
| 4.2 INDIV [written info: ex] versus EXERCISE: duration disorder not specified, MND at two weeks | | | Other data | No numeric data |
| 5 function [self report] Show forest plot | 2 | | Std. Mean Difference (IV, Random, 95% CI) | Totals not selected |
|
| 5.1 INDIV [instruct: ex, rest/activities, posture, lift/carrying] versus EXERCISE: acute WAD at six weeks/three sessions + 24 weeks follow‐up | 1 | | Std. Mean Difference (IV, Random, 95% CI) | 0.0 [0.0, 0.0] |
| 5.2 INDIV [Video, written info, discuss: return to normal activities] versus USUAL CARE: subacute/chronic MND at two sessions + 12 weeks follow‐up | 1 | | Std. Mean Difference (IV, Random, 95% CI) | 0.0 [0.0, 0.0] |
| 5.3 INDIV [Video, written info, discuss: return to normal activities] versus USUAL CARE: subacute/chronic MND at two sessions + 52 weeks follow‐up | 1 | | Std. Mean Difference (IV, Random, 95% CI) | 0.0 [0.0, 0.0] |
| 6 self experienced physical impairment Show forest plot | | | Other data | No numeric data |
|
| 6.1 GROUP [written info, instruct: exercise, disorder] versus HOME EXERCISE: chronic MND at two sessions/two weeks + 12 weeks follow‐up | | | Other data | No numeric data |
| 6.2 GROUP [written info, instruct: exercise, disorder] versus HOME EXERCISE: chronic MND at two sessions/two weeks + 56 weeks follow‐up | | | Other data | No numeric data |
| 6.3 GROUP [written info, instruct: exercise, disorder] versus COGNITIVE BEHAV: chronic MND at two sessions/two weeks + 12 weeks follow‐up | | | Other data | No numeric data |
| 6.4 GROUP [written info, instruct: exercise, disorder] versus COGNITIVE BEHAV: chronic MND at two sessions/two weeks + 56 weeks follow‐up | | | Other data | No numeric data |
| 7 self experienced physical impairment Show forest plot | 2 | | Std. Mean Difference (IV, Random, 95% CI) | Totals not selected |
|
| 7.1 GROUP [written info, instruct: exercise, disorder] versus HOME EXERCISE: chronic MND at two sessions/two weeks + 12 weeks follow‐up | 1 | | Std. Mean Difference (IV, Random, 95% CI) | 0.0 [0.0, 0.0] |
| 7.2 GROUP [written info, instruct: exercise, disorder] versus HOME EXERCISE: chronic MND at two sessions/two weeks + 56 weeks follow‐up | 1 | | Std. Mean Difference (IV, Random, 95% CI) | 0.0 [0.0, 0.0] |
| 7.3 GROUP [written info, instruct: exercise, disorder] versus COGNITIVE BEHAV: chronic MND at two sessions/two weeks + 12 weeks follow‐up | 1 | | Std. Mean Difference (IV, Random, 95% CI) | 0.0 [0.0, 0.0] |
| 7.4 GROUP [written info, instruct: exercise, disorder] versus COGNIVITVE BEHAV: chronic MND at two sessions/two weeks + 56 weeks follow‐up | 1 | | Std. Mean Difference (IV, Random, 95% CI) | 0.0 [0.0, 0.0] |
| 8 working ability Show forest plot | | | Other data | No numeric data |
|
| 8.1 GROUP [written info, instruct: exercise, disorder] versus HOME EXERCISE: chronic MND at two sessions/two weeks + 12 weeks follow‐up | | | Other data | No numeric data |
| 8.2 GROUP [written info, instruct: exercise, disorder] versus HOME EXERCISE: chronic MND at two sessions/two weeks + 56 weeks follow‐up | | | Other data | No numeric data |
| 8.3 GROUP [written info, instruct: exercise, disorder] versus COGNITIVE BEHAV: chronic MND at two sessions/two weeks + 12 weeks follow‐up | | | Other data | No numeric data |
| 8.4 GROUP [written info, instruct: exercise, disorder] versus COGNITIVE BEHAV: chronic MND at two sessions/two weeks + 56 weeks follow‐up | | | Other data | No numeric data |
| 9 working ability Show forest plot | 2 | | Std. Mean Difference (IV, Random, 95% CI) | Totals not selected |
|
| 9.1 GROUP [written info, instruct: exercise, disorder] versus HOME EXERCISE: chronic MND at two sessions/two weeks + 12 weeks follow‐up | 1 | | Std. Mean Difference (IV, Random, 95% CI) | 0.0 [0.0, 0.0] |
| 9.2 GROUP [written info, instruct: exercise, disorder] versus HOME EXERCISE: chronic MND at two sessions/two weeks + 56 weeks follow‐up | 1 | | Std. Mean Difference (IV, Random, 95% CI) | 0.0 [0.0, 0.0] |
| 9.3 GROUP [written info, instruct: exercise, disorder] versus COGNITIVE BEHAV: chronic MND at two sessions/two weeks + 12 weeks follow‐up | 1 | | Std. Mean Difference (IV, Random, 95% CI) | 0.0 [0.0, 0.0] |
| 9.4 GROUP [written info, instruct: exercise, disorder] versus COGNITIVE BEHAV: chronic MND at two sessions/two weeks + 56 weeks follow‐up | 1 | | Std. Mean Difference (IV, Random, 95% CI) | 0.0 [0.0, 0.0] |
| 10 sick leave [number of people] Show forest plot | 1 | | Risk Ratio (M‐H, Random, 95% CI) | Totals not selected |
|
| 10.1 INDIV [instruct: act‐as‐usual] versus REST [Collar]: acute WAD at one session + 24 weeks follow‐up | 1 | | Risk Ratio (M‐H, Random, 95% CI) | 0.0 [0.0, 0.0] |
| 11 global perceived improvement [felt worse or no change] Show forest plot | 1 | | Risk Ratio (M‐H, Random, 95% CI) | Totals not selected |
|
| 11.1 INDIV [instruct: act‐as‐usual] versus REST: acute WAD at one session + 24 weeks follow‐up | 1 | | Risk Ratio (M‐H, Random, 95% CI) | 0.0 [0.0, 0.0] |
| 12 self experienced benefit of treatment Show forest plot | | | Other data | No numeric data |
|
| 12.1 GROUP [written info, instruct: exercise, disorder] versus HOME EXERCISE: chronic MND at two sessions/two weeks + 12 weeks follow‐up | | | Other data | No numeric data |
| 12.2 GROUP [written info, instruct: exercise, disorder] versus HOME EXERCISE: chronic MND at two sessions/two weeks + 56 weeks follow‐up | | | Other data | No numeric data |
| 12.3 GROUP [written info, instruct: exercise, disorder] versus COGNITIVE BEHAV: chronic MND at two sessions/two weeks + 12 weeks follow‐up | | | Other data | No numeric data |
| 12.4 GROUP [written info, instruct: exercise, disorder] versus COGNITIVE BEHAV: chronic MND at two sessions/two weeks + 56 weeks follow‐up | | | Other data | No numeric data |
| 13 self experienced benefit of treatment Show forest plot | 2 | | Std. Mean Difference (IV, Random, 95% CI) | Totals not selected |
|
| 13.1 GROUP [written info, instruct: exercise, disorder] versus HOME EXERCISE: chronic MND at two sessions/two weeks + 12 weeks follow‐up | 1 | | Std. Mean Difference (IV, Random, 95% CI) | 0.0 [0.0, 0.0] |
| 13.2 GROUP [written info, instruct: exercise, disorder] versus HOME EXERCISE: chronic MND at two sessions/two weeks + 56 weeks follow‐up | 1 | | Std. Mean Difference (IV, Random, 95% CI) | 0.0 [0.0, 0.0] |
| 13.3 GROUP [written info, instruct: exercise, disorder] versus COGNITIVE BEHAV: chronic MND at two sessions/two weeks + 12 weeks follow‐up | 1 | | Std. Mean Difference (IV, Random, 95% CI) | 0.0 [0.0, 0.0] |
| 13.4 GROUP [written info, instruct: exercise, disorder] versus COGNITIVE BEHAV: chronic MND at two sessions/two weeks + 56 weeks follow‐up | 1 | | Std. Mean Difference (IV, Random, 95% CI) | 0.0 [0.0, 0.0] |
| 14 knowledge: retention of instruction on exercises Show forest plot | | | Other data | No numeric data |
|
| 14.1 INDIV [written info: ex] versus EXERCISE: duration disorder not specified, MND at 2 weeks | | | Other data | No numeric data |
| 14.2 INDIV [written info, instruct: ex] versus BOOKLET: duration disorder not specified, MND at 2 weeks | | | Other data | No numeric data |
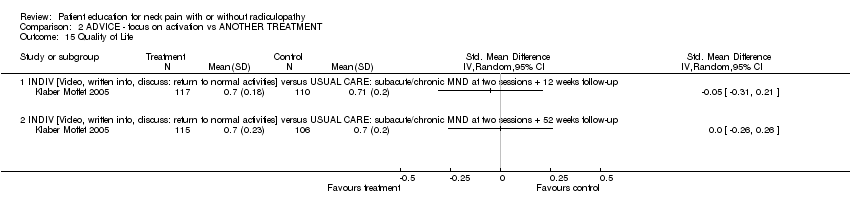
| 15 Quality of Life Show forest plot | 1 | | Std. Mean Difference (IV, Random, 95% CI) | Totals not selected |
|
| 15.1 INDIV [Video, written info, discuss: return to normal activities] versus USUAL CARE: subacute/chronic MND at two sessions + 12 weeks follow‐up | 1 | | Std. Mean Difference (IV, Random, 95% CI) | 0.0 [0.0, 0.0] |
| 15.2 INDIV [Video, written info, discuss: return to normal activities] versus USUAL CARE: subacute/chronic MND at two sessions + 52 weeks follow‐up | 1 | | Std. Mean Difference (IV, Random, 95% CI) | 0.0 [0.0, 0.0] |
![Comparison 1 ADVICE ‐ focus on activation vs PLACEBO or CONTROL, Outcome 1 pain [intensity].](/es/cdsr/doi/10.1002/14651858.CD005106.pub2/media/CDSR/CD005106/rel0002/CD005106/image_n/nCD005106-CMP-001-01.png)
![Comparison 1 ADVICE ‐ focus on activation vs PLACEBO or CONTROL, Outcome 2 pain [present].](/es/cdsr/doi/10.1002/14651858.CD005106.pub2/media/CDSR/CD005106/rel0002/CD005106/image_n/nCD005106-CMP-001-02.png)
![Comparison 1 ADVICE ‐ focus on activation vs PLACEBO or CONTROL, Outcome 5 function [self report].](/es/cdsr/doi/10.1002/14651858.CD005106.pub2/media/CDSR/CD005106/rel0002/CD005106/image_n/nCD005106-CMP-001-05.png)
![Comparison 1 ADVICE ‐ focus on activation vs PLACEBO or CONTROL, Outcome 6 sick leave [number of people].](/es/cdsr/doi/10.1002/14651858.CD005106.pub2/media/CDSR/CD005106/rel0002/CD005106/image_n/nCD005106-CMP-001-06.png)
![Comparison 1 ADVICE ‐ focus on activation vs PLACEBO or CONTROL, Outcome 9 global perceived improvement [felt worse or no change].](/es/cdsr/doi/10.1002/14651858.CD005106.pub2/media/CDSR/CD005106/rel0002/CD005106/image_n/nCD005106-CMP-001-09.png)

![Comparison 2 ADVICE ‐ focus on activation vs ANOTHER TREATMENT, Outcome 1 pain [intensity].](/es/cdsr/doi/10.1002/14651858.CD005106.pub2/media/CDSR/CD005106/rel0002/CD005106/image_n/nCD005106-CMP-002-01.png)
![Comparison 2 ADVICE ‐ focus on activation vs ANOTHER TREATMENT, Outcome 5 function [self report].](/es/cdsr/doi/10.1002/14651858.CD005106.pub2/media/CDSR/CD005106/rel0002/CD005106/image_n/nCD005106-CMP-002-05.png)


![Comparison 2 ADVICE ‐ focus on activation vs ANOTHER TREATMENT, Outcome 10 sick leave [number of people].](/es/cdsr/doi/10.1002/14651858.CD005106.pub2/media/CDSR/CD005106/rel0002/CD005106/image_n/nCD005106-CMP-002-10.png)
![Comparison 2 ADVICE ‐ focus on activation vs ANOTHER TREATMENT, Outcome 11 global perceived improvement [felt worse or no change].](/es/cdsr/doi/10.1002/14651858.CD005106.pub2/media/CDSR/CD005106/rel0002/CD005106/image_n/nCD005106-CMP-002-11.png)

![Comparison 3 ADVICE ‐ focus on pain & stress coping skills vs CONTROL, Outcome 1 pain [present].](/es/cdsr/doi/10.1002/14651858.CD005106.pub2/media/CDSR/CD005106/rel0002/CD005106/image_n/nCD005106-CMP-003-01.png)
![Comparison 3 ADVICE ‐ focus on pain & stress coping skills vs CONTROL, Outcome 2 pain [intensity].](/es/cdsr/doi/10.1002/14651858.CD005106.pub2/media/CDSR/CD005106/rel0002/CD005106/image_n/nCD005106-CMP-003-02.png)

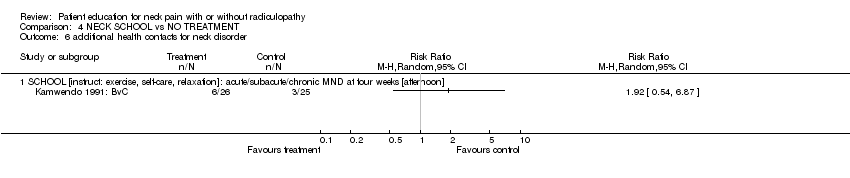
![Comparison 4 NECK SCHOOL vs NO TREATMENT, Outcome 1 pain [intensity].](/es/cdsr/doi/10.1002/14651858.CD005106.pub2/media/CDSR/CD005106/rel0002/CD005106/image_n/nCD005106-CMP-004-01.png)