| 1 Hospitalizations for COPD /100 patient years Show forest plot | 1 | 743 | Rate Ratio (Fixed, 95% CI) | 0.69 [0.47, 1.01] |
|
| 1.1 Action Plan +phone follow up | 1 | 743 | Rate Ratio (Fixed, 95% CI) | 0.69 [0.47, 1.01] |
| 2 At least 1 hospital admission (12 months) Show forest plot | 2 | 897 | Odds Ratio (M‐H, Fixed, 95% CI) | 0.69 [0.49, 0.97] |
|
| 2.1 Action Plan | 1 | 154 | Odds Ratio (M‐H, Fixed, 95% CI) | 0.97 [0.31, 3.03] |
| 2.2 Action Plan + Phonecall Follow‐up | 1 | 743 | Odds Ratio (M‐H, Fixed, 95% CI) | 0.66 [0.46, 0.95] |
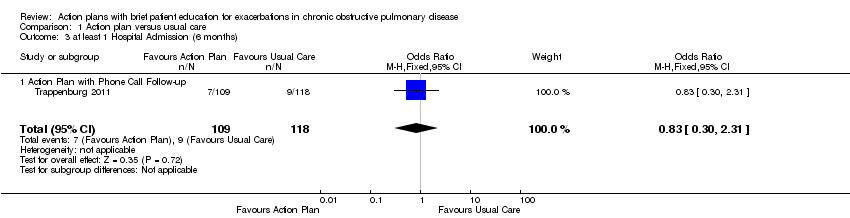
| 3 at least 1 Hospital Admission (6 months) Show forest plot | 1 | 227 | Odds Ratio (M‐H, Fixed, 95% CI) | 0.83 [0.30, 2.31] |
|
| 3.1 Action Plan with Phone Call Follow‐up | 1 | 227 | Odds Ratio (M‐H, Fixed, 95% CI) | 0.83 [0.30, 2.31] |
| 4 Hospital admission (12 months) Show forest plot | 2 | 205 | Mean Difference (IV, Fixed, 95% CI) | 0.23 [‐0.03, 0.49] |
|
| 4.1 Action Plan | 2 | 205 | Mean Difference (IV, Fixed, 95% CI) | 0.23 [‐0.03, 0.49] |
| 5 Hospital Admission for COPD (6 months) Show forest plot | 1 | 227 | Mean Difference (IV, Fixed, 95% CI) | 0.0 [‐0.08, 0.08] |
|
| 5.1 Action Plan with Phone Call Follow‐up | 1 | 227 | Mean Difference (IV, Fixed, 95% CI) | 0.0 [‐0.08, 0.08] |
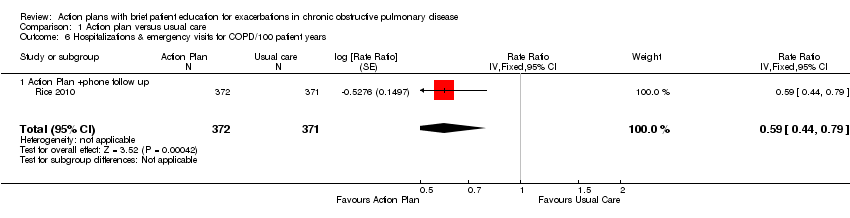
| 6 Hospitalizations & emergency visits for COPD/100 patient years Show forest plot | 1 | 743 | Rate Ratio (Fixed, 95% CI) | 0.59 [0.44, 0.79] |
|
| 6.1 Action Plan +phone follow up | 1 | 743 | Rate Ratio (Fixed, 95% CI) | 0.59 [0.44, 0.79] |
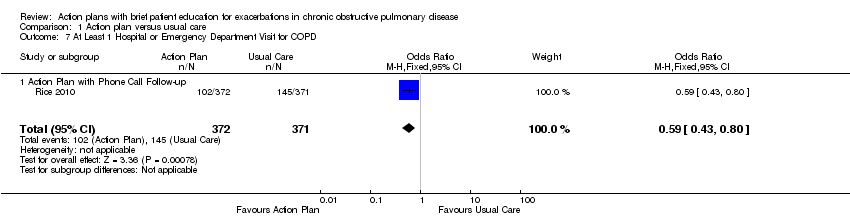
| 7 At Least 1 Hospital or Emergency Department Visit for COPD Show forest plot | 1 | 743 | Odds Ratio (M‐H, Fixed, 95% CI) | 0.59 [0.43, 0.80] |
|
| 7.1 Action Plan with Phone Call Follow‐up | 1 | 743 | Odds Ratio (M‐H, Fixed, 95% CI) | 0.59 [0.43, 0.80] |
| 8 Emergency department visits for COPD /100 patient years Show forest plot | 1 | 743 | Rate Ratio (Fixed, 95% CI) | 0.49 [0.33, 0.73] |
|
| 8.1 Action Plan +phone follow up | 1 | 743 | Rate Ratio (Fixed, 95% CI) | 0.49 [0.33, 0.73] |
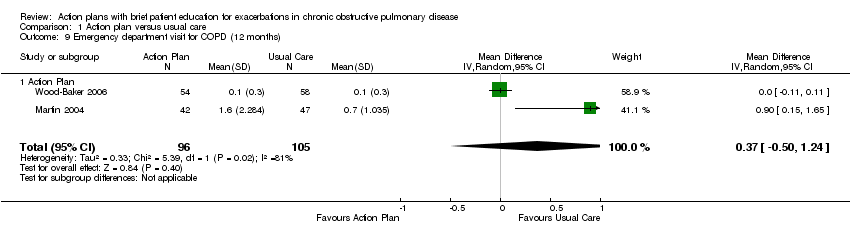
| 9 Emergency department visit for COPD (12 months) Show forest plot | 2 | 201 | Mean Difference (IV, Random, 95% CI) | 0.37 [‐0.50, 1.24] |
|
| 9.1 Action Plan | 2 | 201 | Mean Difference (IV, Random, 95% CI) | 0.37 [‐0.50, 1.24] |
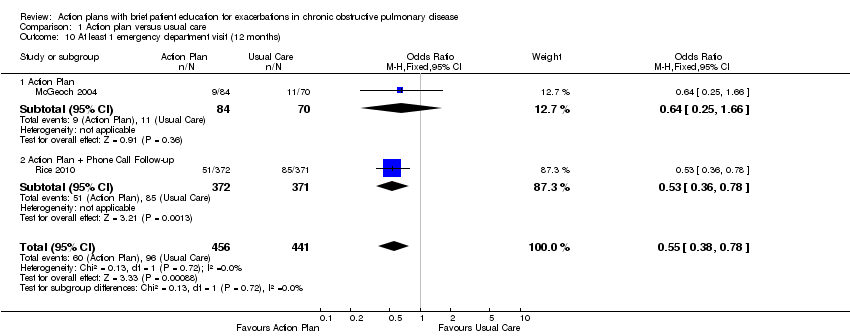
| 10 At least 1 emergency department visit (12 months) Show forest plot | 2 | 897 | Odds Ratio (M‐H, Fixed, 95% CI) | 0.55 [0.38, 0.78] |
|
| 10.1 Action Plan | 1 | 154 | Odds Ratio (M‐H, Fixed, 95% CI) | 0.64 [0.25, 1.66] |
| 10.2 Action Plan + Phone Call Follow‐up | 1 | 743 | Odds Ratio (M‐H, Fixed, 95% CI) | 0.53 [0.36, 0.78] |
| 11 Emergency Department Visits for COPD (6 months) Show forest plot | 1 | 227 | Mean Difference (IV, Fixed, 95% CI) | 0.0 [‐0.09, 0.09] |
|
| 11.1 Action Plan with Phone Call Follow‐up | 1 | 227 | Mean Difference (IV, Fixed, 95% CI) | 0.0 [‐0.09, 0.09] |
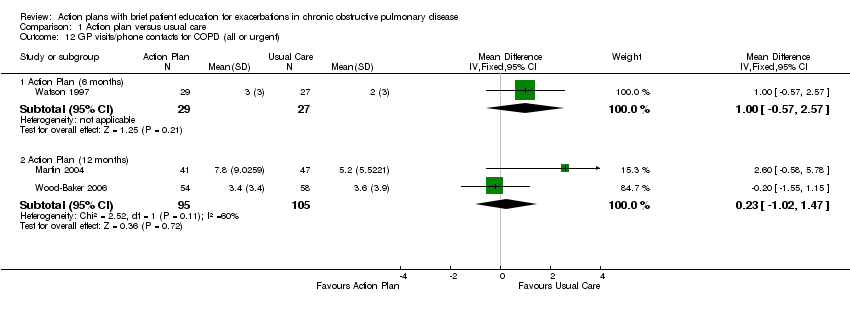
| 12 GP visits/phone contacts for COPD (all or urgent) Show forest plot | 3 | | Mean Difference (IV, Fixed, 95% CI) | Subtotals only |
|
| 12.1 Action Plan (6 months) | 1 | 56 | Mean Difference (IV, Fixed, 95% CI) | 1.0 [‐0.57, 2.57] |
| 12.2 Action Plan (12 months) | 2 | 200 | Mean Difference (IV, Fixed, 95% CI) | 0.23 [‐1.02, 1.47] |
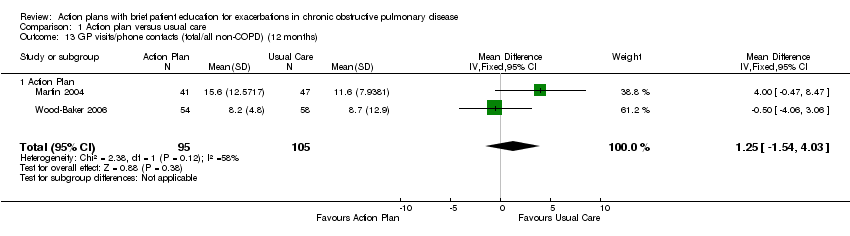
| 13 GP visits/phone contacts (total/all non‐COPD) (12 months) Show forest plot | 2 | 200 | Mean Difference (IV, Fixed, 95% CI) | 1.25 [‐1.54, 4.03] |
|
| 13.1 Action Plan | 2 | 200 | Mean Difference (IV, Fixed, 95% CI) | 1.25 [‐1.54, 4.03] |
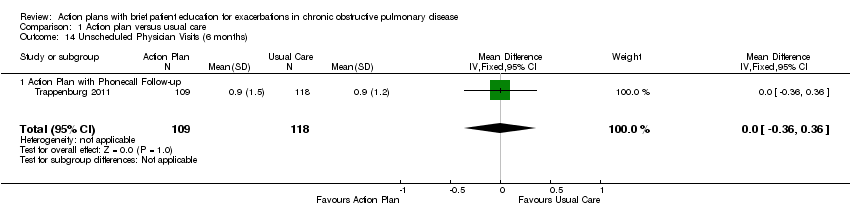
| 14 Unscheduled Physician Visits (6 months) Show forest plot | 1 | 227 | Mean Difference (IV, Fixed, 95% CI) | 0.0 [‐0.36, 0.36] |
|
| 14.1 Action Plan with Phonecall Follow‐up | 1 | 227 | Mean Difference (IV, Fixed, 95% CI) | 0.0 [‐0.36, 0.36] |
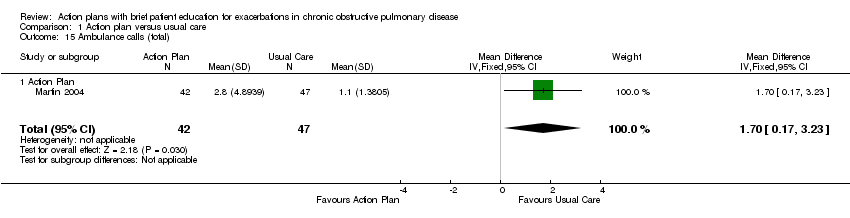
| 15 Ambulance calls (total) Show forest plot | 1 | 89 | Mean Difference (IV, Fixed, 95% CI) | 1.70 [0.17, 3.23] |
|
| 15.1 Action Plan | 1 | 89 | Mean Difference (IV, Fixed, 95% CI) | 1.70 [0.17, 3.23] |
| 16 Total Hospital Days (12 months) Show forest plot | 1 | 743 | Mean Difference (IV, Fixed, 95% CI) | ‐1.10 [0.00, ‐0.20] |
|
| 16.1 Action Plan + Phone Call Folow‐up | 1 | 743 | Mean Difference (IV, Fixed, 95% CI) | ‐1.10 [0.00, ‐0.20] |
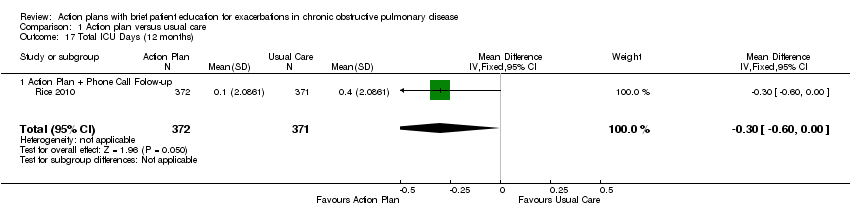
| 17 Total ICU Days (12 months) Show forest plot | 1 | 743 | Mean Difference (IV, Fixed, 95% CI) | ‐0.30 [‐0.60, ‐0.00] |
|
| 17.1 Action Plan + Phone Call Folow‐up | 1 | 743 | Mean Difference (IV, Fixed, 95% CI) | ‐0.30 [‐0.60, ‐0.00] |
| 18 Mortality (all cause) 12 months Show forest plot | 4 | 1134 | Peto Odds Ratio (Peto, Fixed, 95% CI) | 0.88 [0.59, 1.31] |
|
| 18.1 Action Plan | 3 | 391 | Peto Odds Ratio (Peto, Fixed, 95% CI) | 1.66 [0.73, 3.79] |
| 18.2 Action Plan with Phone call follow up | 1 | 743 | Peto Odds Ratio (Peto, Fixed, 95% CI) | 0.72 [0.46, 1.14] |
| 19 Mortality (all cause) per 100 Patient‐Years (12 months) Show forest plot | 1 | 743 | Mean Difference (IV, Fixed, 95% CI) | ‐3.70 [‐8.86, 1.46] |
|
| 19.1 Action Plan with Phone Call Follow‐up | 1 | 743 | Mean Difference (IV, Fixed, 95% CI) | ‐3.70 [‐8.86, 1.46] |
| 20 Mortality (all cause) 6 months Show forest plot | 1 | 229 | Peto Odds Ratio (Peto, Fixed, 95% CI) | 1.06 [0.15, 7.66] |
|
| 20.1 Action Plan with Phone Call Follow‐up | 1 | 229 | Peto Odds Ratio (Peto, Fixed, 95% CI) | 1.06 [0.15, 7.66] |
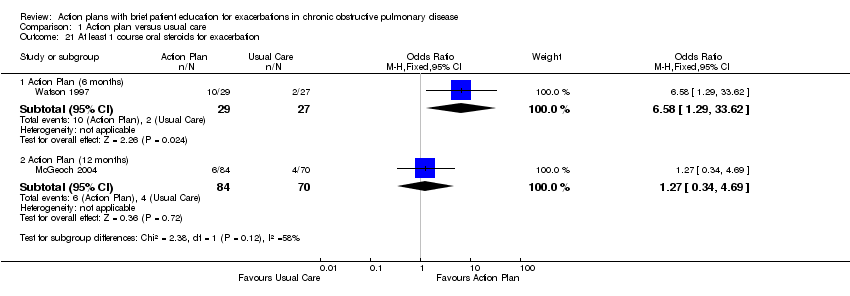
| 21 At least 1 course oral steroids for exacerbation Show forest plot | 2 | | Odds Ratio (M‐H, Fixed, 95% CI) | Subtotals only |
|
| 21.1 Action Plan (6 months) | 1 | 56 | Odds Ratio (M‐H, Fixed, 95% CI) | 6.58 [1.29, 33.62] |
| 21.2 Action Plan (12 months) | 1 | 154 | Odds Ratio (M‐H, Fixed, 95% CI) | 1.27 [0.34, 4.69] |
| 22 Courses of oral corticosteroids (12 months) Show forest plot | 2 | 200 | Mean Difference (IV, Fixed, 95% CI) | 0.74 [0.12, 1.35] |
|
| 22.1 Action Plan | 2 | 200 | Mean Difference (IV, Fixed, 95% CI) | 0.74 [0.12, 1.35] |
| 23 Courses of Corticosteroids (6 months) Show forest plot | 1 | 227 | Mean Difference (IV, Fixed, 95% CI) | 0.0 [‐0.23, 0.23] |
|
| 23.1 Action Plan with Phone Call Follow‐up | 1 | 227 | Mean Difference (IV, Fixed, 95% CI) | 0.0 [‐0.23, 0.23] |
| 24 Days on corticosteroids (6 months) Show forest plot | 1 | 56 | Mean Difference (IV, Fixed, 95% CI) | 6.0 [‐5.53, 17.53] |
|
| 24.1 Action Plan | 1 | 56 | Mean Difference (IV, Fixed, 95% CI) | 6.0 [‐5.53, 17.53] |
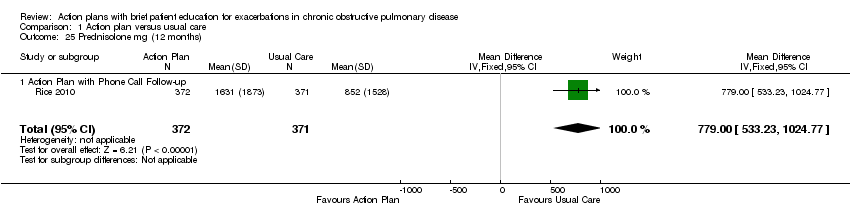
| 25 Prednisolone mg (12 months) Show forest plot | 1 | 743 | Mean Difference (IV, Fixed, 95% CI) | 779.0 [533.23, 1024.77] |
|
| 25.1 Action Plan with Phone Call Follow‐up | 1 | 743 | Mean Difference (IV, Fixed, 95% CI) | 779.0 [533.23, 1024.77] |
| 26 At least 1 course antibiotics for exacerbation Show forest plot | 3 | | Peto Odds Ratio (Peto, Fixed, 95% CI) | Subtotals only |
|
| 26.1 Action Plan (6 months) | 1 | 56 | Peto Odds Ratio (Peto, Fixed, 95% CI) | 6.51 [2.02, 21.05] |
| 26.2 Action Plan (12 months) | 2 | 293 | Peto Odds Ratio (Peto, Fixed, 95% CI) | 1.65 [1.01, 2.69] |
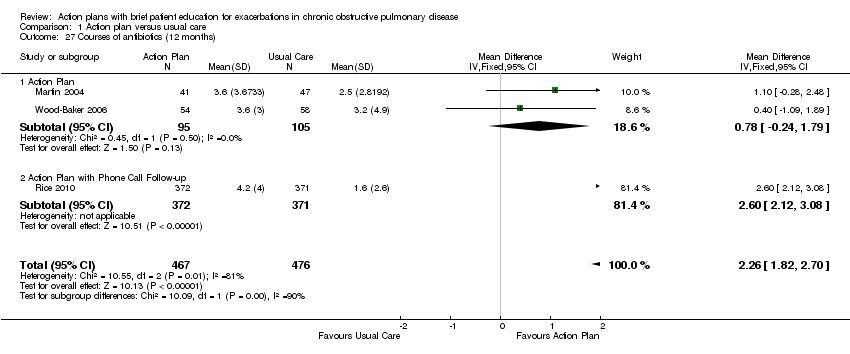
| 27 Courses of antibiotics (12 months) Show forest plot | 3 | 943 | Mean Difference (IV, Fixed, 95% CI) | 2.26 [1.82, 2.70] |
|
| 27.1 Action Plan | 2 | 200 | Mean Difference (IV, Fixed, 95% CI) | 0.78 [‐0.24, 1.79] |
| 27.2 Action Plan with Phone Call Follow‐up | 1 | 743 | Mean Difference (IV, Fixed, 95% CI) | 2.6 [2.12, 3.08] |
| 28 Courses of Antibiotics (6 months) Show forest plot | 1 | 227 | Mean Difference (IV, Fixed, 95% CI) | 0.0 [‐0.26, 0.26] |
|
| 28.1 Action Plan with Phone Call Follow‐up | 1 | 227 | Mean Difference (IV, Fixed, 95% CI) | 0.0 [‐0.26, 0.26] |
| 29 Days on antibiotics (6 months) Show forest plot | 1 | 56 | Mean Difference (IV, Fixed, 95% CI) | 6.0 [1.40, 10.60] |
|
| 29.1 Action Plan | 1 | 56 | Mean Difference (IV, Fixed, 95% CI) | 6.0 [1.40, 10.60] |
| 30 SGRQ overall score (12 months) Show forest plot | 3 | 1009 | Mean Difference (IV, Fixed, 95% CI) | ‐2.79 [‐4.77, ‐0.82] |
|
| 30.1 Action Plan | 2 | 266 | Mean Difference (IV, Fixed, 95% CI) | 0.32 [‐2.70, 3.34] |
| 30.2 Action Plan + Phone Call Follow‐up | 1 | 743 | Mean Difference (IV, Fixed, 95% CI) | ‐5.10 [‐7.70, ‐2.50] |
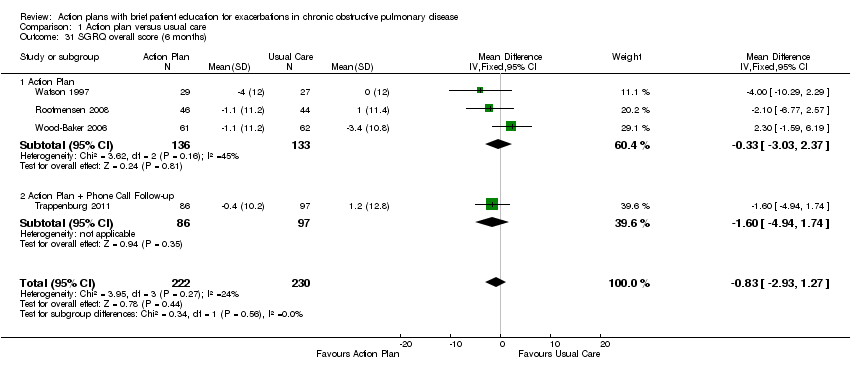
| 31 SGRQ overall score (6 months) Show forest plot | 4 | 452 | Mean Difference (IV, Fixed, 95% CI) | ‐0.83 [‐2.93, 1.27] |
|
| 31.1 Action Plan | 3 | 269 | Mean Difference (IV, Fixed, 95% CI) | ‐0.33 [‐3.03, 2.37] |
| 31.2 Action Plan + Phone Call Follow‐up | 1 | 183 | Mean Difference (IV, Fixed, 95% CI) | ‐1.6 [‐4.94, 1.74] |
| 32 SGRQ symptoms (12 months) Show forest plot | 2 | 266 | Mean Difference (IV, Fixed, 95% CI) | ‐1.84 [‐7.14, 3.47] |
|
| 32.1 Action Plan | 2 | 266 | Mean Difference (IV, Fixed, 95% CI) | ‐1.84 [‐7.14, 3.47] |
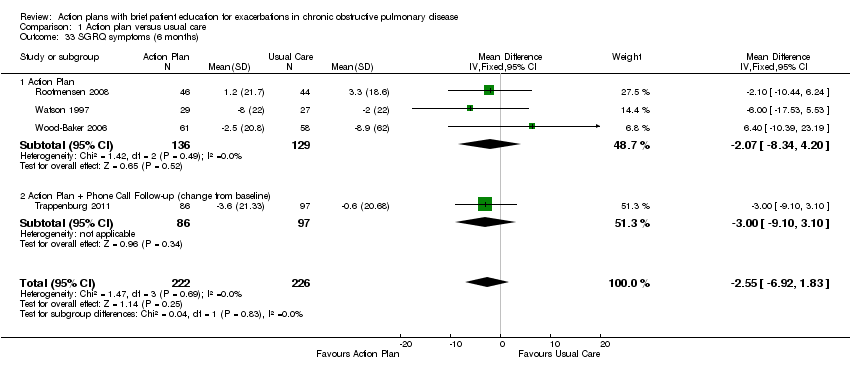
| 33 SGRQ symptoms (6 months) Show forest plot | 4 | 448 | Mean Difference (IV, Fixed, 95% CI) | ‐2.55 [‐6.92, 1.83] |
|
| 33.1 Action Plan | 3 | 265 | Mean Difference (IV, Fixed, 95% CI) | ‐2.07 [‐8.34, 4.20] |
| 33.2 Action Plan + Phone Call Follow‐up (change from baseline) | 1 | 183 | Mean Difference (IV, Fixed, 95% CI) | ‐3.0 [‐9.10, 3.10] |
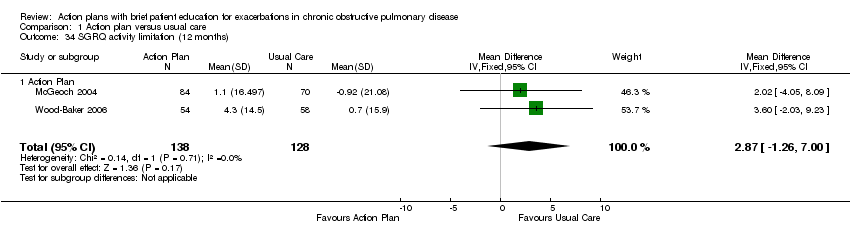
| 34 SGRQ activity limitation (12 months) Show forest plot | 2 | 266 | Mean Difference (IV, Fixed, 95% CI) | 2.87 [‐1.26, 7.00] |
|
| 34.1 Action Plan | 2 | 266 | Mean Difference (IV, Fixed, 95% CI) | 2.87 [‐1.26, 7.00] |
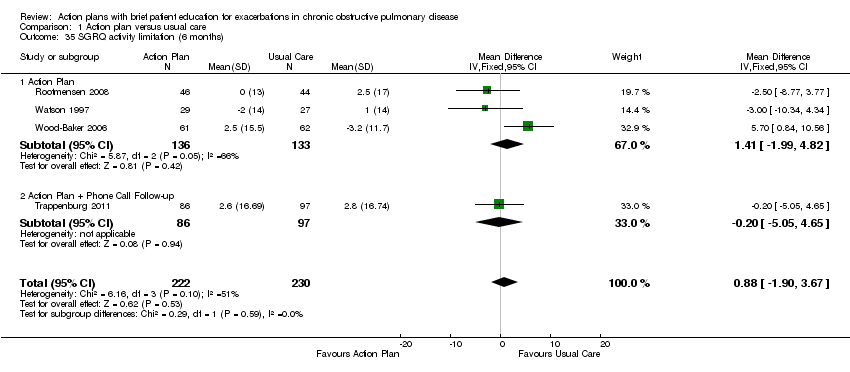
| 35 SGRQ activity limitation (6 months) Show forest plot | 4 | 452 | Mean Difference (IV, Fixed, 95% CI) | 0.88 [‐1.90, 3.67] |
|
| 35.1 Action Plan | 3 | 269 | Mean Difference (IV, Fixed, 95% CI) | 1.41 [‐1.99, 4.82] |
| 35.2 Action Plan + Phone Call Follow‐up | 1 | 183 | Mean Difference (IV, Fixed, 95% CI) | ‐0.20 [‐5.05, 4.65] |
| 36 SGRQ impact (12 months) Show forest plot | 2 | 266 | Mean Difference (IV, Fixed, 95% CI) | ‐1.04 [‐4.51, 2.43] |
|
| 36.1 Action Plan | 2 | 266 | Mean Difference (IV, Fixed, 95% CI) | ‐1.04 [‐4.51, 2.43] |
| 37 SGRQ impact score (6 months) Show forest plot | 4 | 452 | Mean Difference (IV, Fixed, 95% CI) | ‐1.26 [‐3.47, 0.95] |
|
| 37.1 Action Plan | 3 | 269 | Mean Difference (IV, Fixed, 95% CI) | ‐1.53 [‐4.45, 1.39] |
| 37.2 Action Plan + Phone Call Follow‐up | 1 | 183 | Mean Difference (IV, Fixed, 95% CI) | ‐0.9 [‐4.27, 2.47] |
| 38 SF36 physical function (6 months) Show forest plot | 1 | | Mean Difference (IV, Fixed, 95% CI) | Subtotals only |
|
| 38.1 Action Plan | 1 | 90 | Mean Difference (IV, Fixed, 95% CI) | 0.30 [‐7.13, 7.73] |
| 39 SF36 role limitation physical (6 months) Show forest plot | 1 | | Mean Difference (IV, Fixed, 95% CI) | Subtotals only |
|
| 39.1 Action Plan | 1 | 90 | Mean Difference (IV, Fixed, 95% CI) | 9.0 [‐8.07, 26.07] |
| 40 SF36 bodily pain (6 months) Show forest plot | 1 | | Mean Difference (IV, Fixed, 95% CI) | Subtotals only |
|
| 40.1 Action Plan | 1 | 90 | Mean Difference (IV, Fixed, 95% CI) | 18.5 [6.14, 30.86] |
| 41 SF36 general health (6 months) Show forest plot | 1 | | Mean Difference (IV, Fixed, 95% CI) | Subtotals only |
|
| 41.1 Action Plan | 1 | 90 | Mean Difference (IV, Fixed, 95% CI) | 2.60 [‐3.71, 8.91] |
| 42 SF36 vitality (6 months) Show forest plot | 1 | | Mean Difference (IV, Fixed, 95% CI) | Subtotals only |
|
| 42.1 Action Plan | 1 | 90 | Mean Difference (IV, Fixed, 95% CI) | 1.6 [‐4.73, 7.93] |
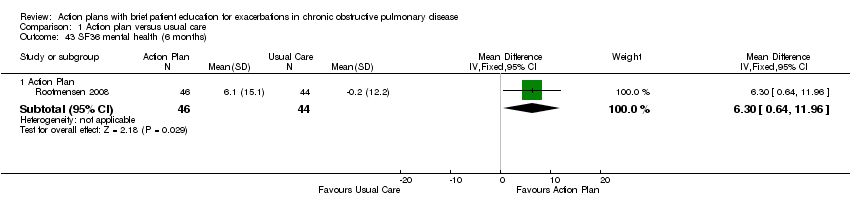
| 43 SF36 mental health (6 months) Show forest plot | 1 | | Mean Difference (IV, Fixed, 95% CI) | Subtotals only |
|
| 43.1 Action Plan | 1 | 90 | Mean Difference (IV, Fixed, 95% CI) | 6.3 [0.64, 11.96] |
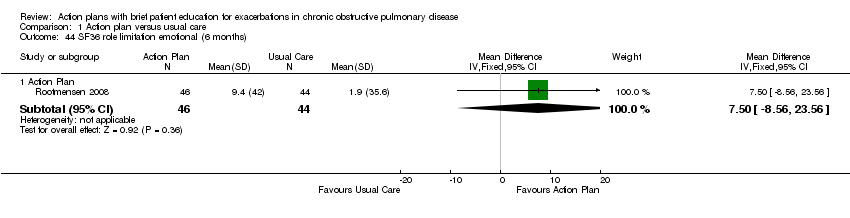
| 44 SF36 role limitation emotional (6 months) Show forest plot | 1 | | Mean Difference (IV, Fixed, 95% CI) | Subtotals only |
|
| 44.1 Action Plan | 1 | 90 | Mean Difference (IV, Fixed, 95% CI) | 7.5 [‐8.56, 23.56] |
| 45 SF36 social function (6 months) Show forest plot | 1 | | Mean Difference (IV, Fixed, 95% CI) | Subtotals only |
|
| 45.1 Action Plan | 1 | 90 | Mean Difference (IV, Fixed, 95% CI) | 5.30 [‐4.68, 15.28] |
| 46 HADS ‐ depression score (12 months) Show forest plot | 1 | | Mean Difference (IV, Fixed, 95% CI) | Subtotals only |
|
| 46.1 Action Plan | 1 | 154 | Mean Difference (IV, Fixed, 95% CI) | ‐0.25 [‐1.14, 0.64] |
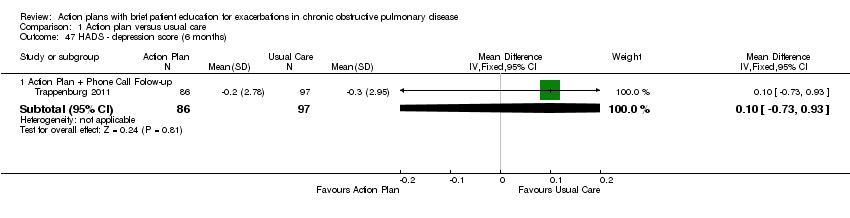
| 47 HADS ‐ depression score (6 months) Show forest plot | 1 | | Mean Difference (IV, Fixed, 95% CI) | Subtotals only |
|
| 47.1 Action Plan + Phone Call Folow‐up | 1 | 183 | Mean Difference (IV, Fixed, 95% CI) | 0.10 [‐0.73, 0.93] |
| 48 HADS ‐ anxiety score (12 months) Show forest plot | 1 | | Mean Difference (IV, Fixed, 95% CI) | Subtotals only |
|
| 48.1 Action Plan | 1 | 154 | Mean Difference (IV, Fixed, 95% CI) | 0.14 [‐1.38, 1.66] |
| 49 HADS ‐ anxiety score (6 months) Show forest plot | 1 | | Mean Difference (IV, Fixed, 95% CI) | Subtotals only |
|
| 49.1 Action Plan + Phone Call Follow‐up (change from baseline) | 1 | 183 | Mean Difference (IV, Fixed, 95% CI) | 0.0 [‐0.83, 0.83] |
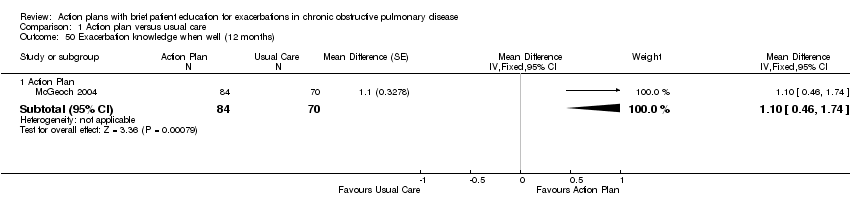
| 50 Exacerbation knowledge when well (12 months) Show forest plot | 1 | | Mean Difference (Fixed, 95% CI) | Subtotals only |
|
| 50.1 Action Plan | 1 | 154 | Mean Difference (Fixed, 95% CI) | 1.1 [0.46, 1.74] |
| 51 Exacerbation actions when well (12 months) Show forest plot | 1 | | Mean Difference (Fixed, 95% CI) | Subtotals only |
|
| 51.1 Action Plan | 1 | 154 | Mean Difference (Fixed, 95% CI) | 0.5 [‐0.24, 1.24] |
| 52 Early exacerbation knowledge (12 months) Show forest plot | 1 | | Mean Difference (Fixed, 95% CI) | Subtotals only |
|
| 52.1 Action Plan | 1 | 154 | Mean Difference (Fixed, 95% CI) | 1.80 [0.75, 2.85] |
| 53 Early exacerbation actions (12 months) Show forest plot | 1 | | Mean Difference (Fixed, 95% CI) | Subtotals only |
|
| 53.1 Action Plan | 1 | 154 | Mean Difference (Fixed, 95% CI) | 2.3 [0.96, 3.64] |
| 54 Severe exacerbation knowledge (12 months) Show forest plot | 1 | | Mean Difference (Fixed, 95% CI) | Subtotals only |
|
| 54.1 Action Plan | 1 | 154 | Mean Difference (Fixed, 95% CI) | 2.5 [0.94, 4.06] |
| 55 Severe exacerbation actions (12 months) Show forest plot | 1 | | Mean Difference (Fixed, 95% CI) | Subtotals only |
|
| 55.1 Action Plan | 1 | 154 | Mean Difference (Fixed, 95% CI) | 1.5 [0.47, 2.53] |
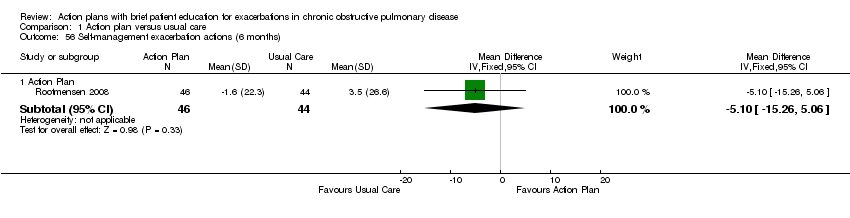
| 56 Self‐management exacerbation actions (6 months) Show forest plot | 1 | | Mean Difference (IV, Fixed, 95% CI) | Subtotals only |
|
| 56.1 Action Plan | 1 | 90 | Mean Difference (IV, Fixed, 95% CI) | ‐5.1 [‐15.26, 5.06] |
| 57 Self‐efficacy for Exacerbation Recognition (6 months) Show forest plot | 1 | | Mean Difference (IV, Fixed, 95% CI) | Subtotals only |
|
| 57.1 Action Plan + Phone Call Follow‐up | 1 | 183 | Mean Difference (IV, Fixed, 95% CI) | ‐0.70 [‐0.98, ‐0.42] |
| 58 Self‐efficacy for Exacerbation Prevention/Action (6 months) Show forest plot | 1 | | Mean Difference (IV, Fixed, 95% CI) | Subtotals only |
|
| 58.1 Action Plan + Phone Call Follow‐up | 1 | 183 | Mean Difference (IV, Fixed, 95% CI) | ‐0.90 [‐1.18, ‐0.62] |
| 59 FEV1 % predicted Show forest plot | 2 | | Mean Difference (IV, Fixed, 95% CI) | Subtotals only |
|
| 59.1 6 months | 2 | 179 | Mean Difference (IV, Fixed, 95% CI) | 1.83 [‐1.05, 4.71] |
| 59.2 12 months | 1 | 112 | Mean Difference (IV, Fixed, 95% CI) | 2.00 [‐1.89, 5.89] |
| 60 Cost HADM per patient US$ (12 months) Show forest plot | 1 | | Mean Difference (IV, Fixed, 95% CI) | Subtotals only |
|
| 60.1 Action Plan with Phone Call Folow‐up | 1 | 743 | Mean Difference (IV, Fixed, 95% CI) | ‐1117.0 [‐1754.50, ‐479.50] |
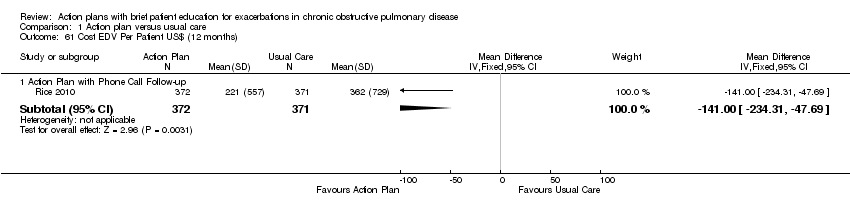
| 61 Cost EDV Per Patient US$ (12 months) Show forest plot | 1 | | Mean Difference (IV, Fixed, 95% CI) | Subtotals only |
|
| 61.1 Action Plan with Phone Call Follow‐up | 1 | 743 | Mean Difference (IV, Fixed, 95% CI) | ‐141.0 [‐234.31, ‐47.69] |
| 62 Cost Pulmonary Drug Prescriptions per Patient US$ (12 months) Show forest plot | 1 | | Mean Difference (IV, Fixed, 95% CI) | Subtotals only |
|
| 62.1 Action Plan with Phone Call Follow‐up | 1 | 743 | Mean Difference (IV, Fixed, 95% CI) | 15.00 [‐6.32, 36.32] |