Embolización de la arteria uterina para los fibromas uterinos sintomáticos
Appendices
Appendix 1. MDSG search string
Keywords CONTAINS "fibroids" or "Leiomyoma" or "myoma" or "uterine fibroids" or "uterine leiomyomas" or "uterine myomas" or Title CONTAINS "fibroids" or "Leiomyoma" or "myoma" or "uterine fibroids" or "uterine leiomyomas" or "uterine myomas"
AND
Keywords CONTAINS "uterine artery embolization" or "UAE" or Title CONTAINS "uterine artery embolization" or "UAE"
Appendix 2. MEDLINE search strategy
The MEDLINE database was searched using the following subject headings and keywords:
1 exp Embolization, Therapeutic/ (23874)
2 (uter$ arter$ adj3 emboli#ation$).tw. (999)
3 UAE.tw. (1663)
4 (fibroid$ adj3 emboli#ation$).tw. (257)
5 or/1‐4 (25336)
6 exp leiomyoma/ or exp myoma/ (17581)
7 (leiomyoma$ or myoma$).tw. (13026)
8 fibro$.tw. (359782)
9 hysteromyom$.tw. (49)
10 or/6‐9 (376897)
11 5 and 10 (1409)
12 randomised controlled trial.pt. (321305)
13 controlled clinical trial.pt. (83863)
14 randomized.ab. (236535)
15 placebo.tw. (137888)
16 clinical trials as topic.sh. (159162)
17 randomly.ab. (173282)
18 trial.ti. (101540)
19 (crossover or cross‐over or cross over).tw. (52610)
20 or/12‐19 (787118)
21 exp animals/ not humans.sh. (3709121)
22 20 not 21 (726837)
23 11 and 22 (117)
Appendix 3. EMBASE search strategy
The EMBASE database was searched using the following subject headings and keywords:
1 exp Uterine Artery Embolization/ (1317)
2 (uter$ arter$ adj3 emboli#ation$).tw. (1313)
3 UAE.tw. (2164)
4 (fibroid$ adj3 emboli#ation$).tw. (371)
5 or/1‐4 (3507)
6 exp benign uterus tumor/ or exp leiomyoma/ or exp uterus myoma/ (18702)
7 (leiomyoma$ or myoma$).tw. (14385)
8 fibro$.tw. (389052)
9 hysteromyom$.tw. (78)
10 or/6‐9 (407253)
11 5 and 10 (1300)
12 Clinical Trial/ (820351)
13 Randomized Controlled Trial/ (291727)
14 exp randomization/ (54876)
15 Single Blind Procedure/ (14365)
16 Double Blind Procedure/ (101449)
17 Crossover Procedure/ (31081)
18 Placebo/ (186763)
19 Randomi?ed controlled trial$.tw. (65701)
20 Rct.tw. (7913)
21 random allocation.tw. (1060)
22 randomly allocated.tw. (15732)
23 allocated randomly.tw. (1715)
24 (allocated adj2 random).tw. (688)
25 Single blind$.tw. (11180)
26 Double blind$.tw. (118790)
27 (treble or triple) adj blind$).tw. (249)
28 placebo$.tw. (160855)
29 prospective study/ (175478)
30 or/12‐29 (1153000)
31 case study/ (13675)
32 case report.tw. (209434)
33 abstract report/ or letter/ (797863)
34 or/31‐33 (1016890)
35 30 not 34 (1119551)
36 11 and 35 (251)
Appendix 4. CENTRAL search strategy
We searched the Cochrane Central Register of Controlled Trials (CENTRAL) in The Cochrane Library, 4th Quarter 2011, and again most recently on 17 April 2014. The CENTRAL database was searched using the following subject headings and keywords:
1 exp Embolization, Therapeutic/ (380)
2 (uter$ arter$ adj3 emboli#ation$).tw. (63)
3 UAE.tw. (221)
4 (fibroid$ adj3 emboli#ation$).tw. (15)
5 or/1‐4 (584)
6 exp leiomyoma/ or exp myoma/ (346)
7 (leiomyoma$ or myoma$).tw. (340)
8 fibro$.tw. (5954)
9 hysteromyom$.tw. (15)
10 or/6‐9 (6297)
11 5 and 10 (67)
Appendix 5. PsycINFO search strategy
The PsycINF0 database was searched using the following subject headings and keywords:
1 (uter$ adj3 emboli?ation$).tw. (2)
2 UAE.tw. (133)
3 (fibroid$ adj3 emboli?ation$).tw. (0)
4 or/1‐3 (135)
5 (leiomyoma$ or myoma$).tw. (28)
6 fibro$.tw. (4305)
7 hysteromyom$.tw. (2)
8 or/5‐7 (4331)
9 4 and 8 (0)
Appendix 6. CINAHL search strategy
| # | Query | Results |
| S27 | S11 AND S25 | 57 |
| S26 | S11 AND S25 | 94 |
| S25 | S12 OR S13 or S14 or S15 OR S16 OR S17 OR S18 OR S19 OR S20 OR S21 OR S22 OR S23 OR S24 | 883,706 |
| S24 | TX allocat* random* | 3,869 |
| S23 | (MH "Quantitative Studies") | 11,815 |
| S22 | (MH "Placebos") | 8,705 |
| S21 | TX placebo* | 31,365 |
| S20 | TX random* allocat* | 3,869 |
| S19 | (MH "Random Assignment") | 37,008 |
| S18 | TX randomi* control* trial* | 71,284 |
| S17 | TX ( (singl* n1 blind*) or (singl* n1 mask*) ) or TX ( (doubl* n1 blind*) or (doubl* n1 mask*) ) or TX ( (tripl* n1 blind*) or (tripl* n1 mask*) ) or TX ( (trebl* n1 blind*) or (trebl* n1 mask*) ) | 710,423 |
| S16 | TX ( (trebl* n1 blind*) or (trebl* n1 mask*) ) | 104 |
| S15 | TX ( (trebl* n1 blind*) or (trebl* n1 mask*) ) | 0 |
| S14 | TX clinic* n1 trial* | 162,339 |
| S13 | PT Clinical trial | 75,742 |
| S12 | (MH "Clinical Trials+") | 173,495 |
| S11 | S5 AND S10 | 407 |
| S10 | S6 OR S7 OR S8 OR S9 | 2,290 |
| S9 | TX fibroid* | 820 |
| S8 | TX hysteromyom* | 3 |
| S7 | TX (leiomyoma* or myoma*) | 2,132 |
| S6 | (MM "Myoma") | 59 |
| S5 | S1 OR S2 OR S3 OR S4 | 3,231 |
| S4 | TX (fibroid* N3 emboli?ation*) | 132 |
| S3 | TX UAE | 541 |
| S2 | TX (uter* arter* N3 emboli?ation*) | 450 |
| S1 | (MM "Uterine Artery Embolization"# OR #MM "Embolization, Therapeutic"# | 2,634 |
Appendix 7. Clinical trials registries: International Clinical Trials Registry Platform and ClinicalTrials.gov
'uterine artery embolization' AND 'fibroid*'
Clinicaltrials.gov: (22)
ICTRP: (1)
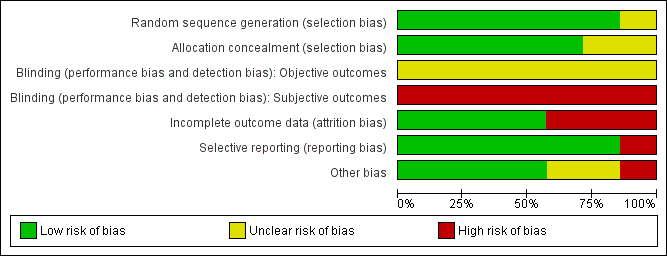
Methodological quality graph: review authors' judgements about each methodological quality item presented as percentages across all included studies.

Methodological quality summary: review authors' judgements about each methodological quality item for each included study.

Forest plot of comparison: 1 UAE versus surgery, outcome: 1.1 Satisfaction with treatment up to 24 months.

Forest plot of comparison: 1 UAE versus surgery, outcome: 1.2 Satisfaction with treatment at 5 years.

Forest plot of comparison: 1 UAE versus surgery, outcome: 1.3 Live birth.

Forest plot of comparison: 1 UAE versus surgery, outcome: 1.10 Further interventions within 2 years.

Comparison 1 UAE versus surgery, Outcome 1 Satisfaction with treatment up to 24 months.

Comparison 1 UAE versus surgery, Outcome 2 Satisfaction with treatment at 5 years.

Comparison 1 UAE versus surgery, Outcome 3 Live birth.

Comparison 1 UAE versus surgery, Outcome 4 Adverse events: intraprocedural complications.

Comparison 1 UAE versus surgery, Outcome 5 Adverse events: Need for blood transfusion.

Comparison 1 UAE versus surgery, Outcome 6 Adverse events: minor postprocedural complications.

Comparison 1 UAE versus surgery, Outcome 7 Adverse events: major postprocedural complications within one year.
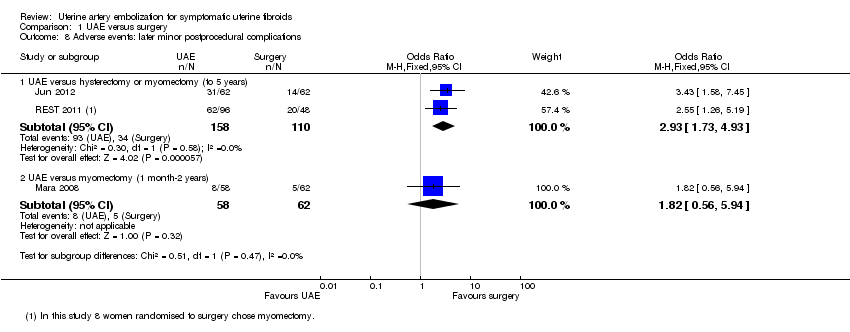
Comparison 1 UAE versus surgery, Outcome 8 Adverse events: later minor postprocedural complications.

Comparison 1 UAE versus surgery, Outcome 9 Adverse events: major postprocedural complications.
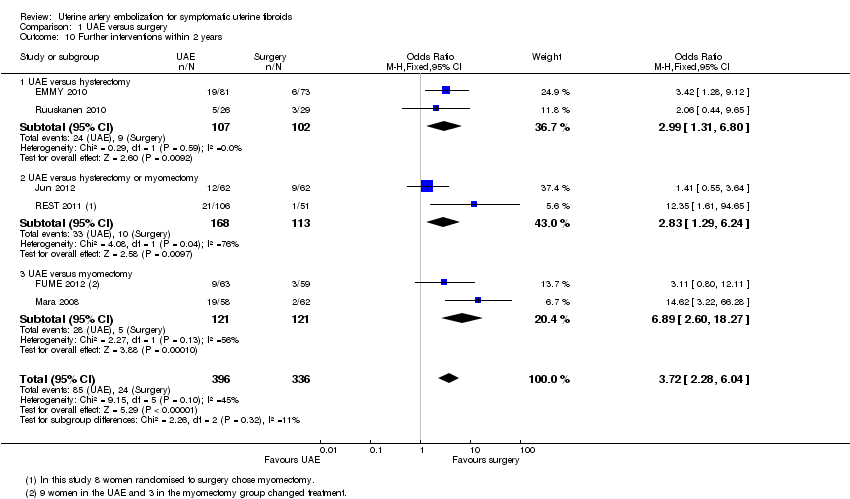
Comparison 1 UAE versus surgery, Outcome 10 Further interventions within 2 years.

Comparison 1 UAE versus surgery, Outcome 11 Further interventions within 5 years.

Comparison 1 UAE versus surgery, Outcome 12 Unscheduled readmission rate within 4‐6 weeks.
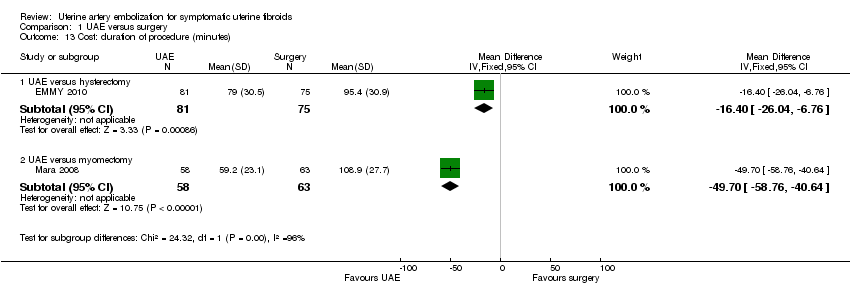
Comparison 1 UAE versus surgery, Outcome 13 Cost: duration of procedure (minutes).

Comparison 1 UAE versus surgery, Outcome 14 Cost: length of hospital stay (days).

Comparison 1 UAE versus surgery, Outcome 15 Cost: resumption of normal activities (days).
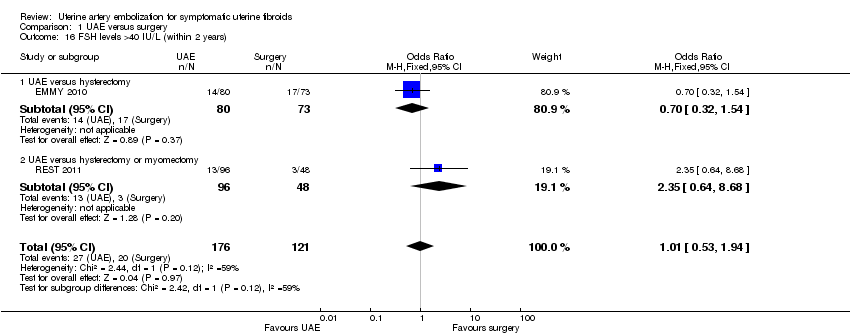
Comparison 1 UAE versus surgery, Outcome 16 FSH levels >40 IU/L (within 2 years).
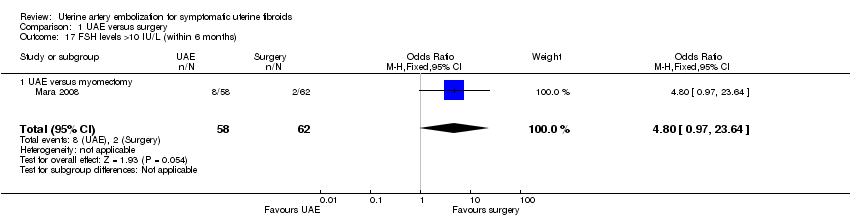
Comparison 1 UAE versus surgery, Outcome 17 FSH levels >10 IU/L (within 6 months).

Comparison 1 UAE versus surgery, Outcome 18 Fibroid recurrence within 2 years.

Comparison 1 UAE versus surgery, Outcome 19 Pregnancy.

Comparison 1 UAE versus surgery, Outcome 20 UAE versus myomectomy: Health related quality of life at one year.
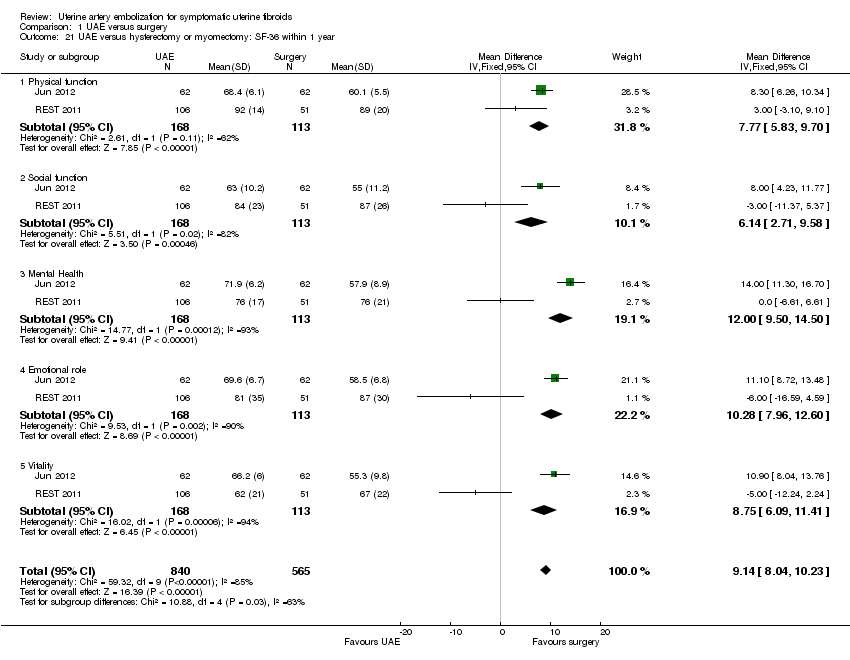
Comparison 1 UAE versus surgery, Outcome 21 UAE versus hysterectomy or myomectomy: SF‐36 within 1 year.
| UAE compared to surgery for symptomatic uterine fibroids | ||||||
| Population: women with symptomatic uterine fibroids | ||||||
| Outcomes | Illustrative comparative risks* (95% CI) | Relative effect | No of participants | Quality of the evidence | Comments | |
| Assumed risk | Corresponding risk | |||||
| Surgery | UAE | |||||
| Satisfaction with treatment up to 24 months | 861 per 1000 | 853 per 1000 | OR 0.94 | 640 | ⊕⊕⊕⊝ | |
| Satisfaction with treatment at 5 years | 876 per 1000 | 864 per 1000 | OR 0.90 | 295 | ⊕⊕⊕⊝ | |
| Live birth ‐ UAE versus myomectomy | 475 per 1000 | 190 per 1000 | OR 0.26 | 66 | ⊕⊝⊝⊝ | |
| Adverse events: intra‐procedural complications | 63 per 1000 | 57 per 1000 | OR 0.91 | 452 | ⊕⊕⊝⊝ | |
| Adverse events: minor post‐procedural complications within one year | 230 per 1000 | 373 per 1000 | OR 1.99 | 735 | ⊕⊕⊕⊝ | |
| Adverse events: major post‐procedural complications within one year | 69 per 1000 | 46 per 1000 | OR 0.65 | 611 | ⊕⊕⊕⊝ | |
| Further interventions within 2 years | 71 per 1000 | 222 per 1000 | OR 3.72 | 732 | ⊕⊕⊕⊝ | |
| *The basis for the assumed risk is the median control group risk across studies. The corresponding risk (and its 95% confidence interval) is based on the assumed risk in the comparison group and the relative effect of the intervention (and its 95% CI). | ||||||
| GRADE Working Group grades of evidence | ||||||
| 1Studies unblinded 2Two studies did not fully explain randomisation and allocation concealment, but quality not downgraded for this as their omission from analysis did not substantially change the findings 3 Wide confidence intervals compatible with substantial harm from UAE or with no effect 4Includes only those trial participants who wished to conceive (66/121) 5One study did not fully explain methods of randomisation and allocation concealment, but omission of this study did not substantially affect the findings 6Low event rate 7Wide confidence intervals compatible with substantial harm or benefit from either intervention, or with no effect 8Some statistical heterogeneity (I2 = 45%); quality not downgraded for this as direction of effect is consistent | ||||||
| Outcome or subgroup title | No. of studies | No. of participants | Statistical method | Effect size |
| 1 Satisfaction with treatment up to 24 months Show forest plot | 6 | 640 | Odds Ratio (M‐H, Fixed, 95% CI) | 0.94 [0.59, 1.48] |
| 1.1 UAE versus hysterectomy | 3 | 266 | Odds Ratio (M‐H, Fixed, 95% CI) | 0.63 [0.30, 1.32] |
| 1.2 UAE versus hysterectomy or myomectomy | 2 | 264 | Odds Ratio (M‐H, Fixed, 95% CI) | 1.29 [0.64, 2.58] |
| 1.3 UAE versus myomectomy | 1 | 110 | Odds Ratio (M‐H, Fixed, 95% CI) | 1.05 [0.33, 3.36] |
| 2 Satisfaction with treatment at 5 years Show forest plot | 2 | 295 | Odds Ratio (M‐H, Fixed, 95% CI) | 0.90 [0.45, 1.80] |
| 2.1 UAE versus hysterectomy | 1 | 156 | Odds Ratio (M‐H, Fixed, 95% CI) | 0.71 [0.29, 1.78] |
| 2.2 UAE versus hysterectomy or myomectomy | 1 | 139 | Odds Ratio (M‐H, Fixed, 95% CI) | 1.25 [0.42, 3.67] |
| 3 Live birth Show forest plot | 1 | Odds Ratio (M‐H, Fixed, 95% CI) | Subtotals only | |
| 3.1 UAE versus myomectomy | 1 | 66 | Odds Ratio (M‐H, Fixed, 95% CI) | 0.26 [0.08, 0.84] |
| 4 Adverse events: intraprocedural complications Show forest plot | 4 | 452 | Odds Ratio (M‐H, Fixed, 95% CI) | 0.91 [0.42, 1.97] |
| 4.1 UAE versus hysterectomy | 2 | 209 | Odds Ratio (M‐H, Fixed, 95% CI) | 1.23 [0.44, 3.44] |
| 4.2 UAE versus myomectomy | 2 | 243 | Odds Ratio (M‐H, Fixed, 95% CI) | 0.61 [0.18, 2.03] |
| 5 Adverse events: Need for blood transfusion Show forest plot | 2 | 277 | Odds Ratio (M‐H, Fixed, 95% CI) | 0.07 [0.01, 0.52] |
| 5.1 UAE versus hysterectomy | 1 | 156 | Odds Ratio (M‐H, Fixed, 95% CI) | 0.04 [0.00, 0.67] |
| 5.2 UAE versus myomectomy | 1 | 121 | Odds Ratio (M‐H, Fixed, 95% CI) | 0.21 [0.01, 4.47] |
| 6 Adverse events: minor postprocedural complications Show forest plot | 6 | 735 | Odds Ratio (M‐H, Fixed, 95% CI) | 1.99 [1.41, 2.81] |
| 6.1 UAE versus hysterectomy | 2 | 211 | Odds Ratio (M‐H, Fixed, 95% CI) | 2.12 [1.13, 3.96] |
| 6.2 UAE versus hysterectomy or myomectomy | 2 | 281 | Odds Ratio (M‐H, Fixed, 95% CI) | 2.51 [1.49, 4.23] |
| 6.3 UAE versus myomectomy | 2 | 243 | Odds Ratio (M‐H, Fixed, 95% CI) | 1.23 [0.62, 2.44] |
| 7 Adverse events: major postprocedural complications within one year Show forest plot | 5 | 611 | Odds Ratio (M‐H, Fixed, 95% CI) | 0.65 [0.33, 1.26] |
| 7.1 UAE versus hysterectomy | 2 | 211 | Odds Ratio (M‐H, Fixed, 95% CI) | 1.00 [0.22, 4.58] |
| 7.2 UAE versus hysterectomy or myomectomy | 1 | 157 | Odds Ratio (M‐H, Fixed, 95% CI) | 0.73 [0.30, 1.74] |
| 7.3 UAE versus myomectomy | 2 | 243 | Odds Ratio (M‐H, Fixed, 95% CI) | 0.29 [0.06, 1.50] |
| 8 Adverse events: later minor postprocedural complications Show forest plot | 3 | Odds Ratio (M‐H, Fixed, 95% CI) | Subtotals only | |
| 8.1 UAE versus hysterectomy or myomectomy (to 5 years) | 2 | 268 | Odds Ratio (M‐H, Fixed, 95% CI) | 2.93 [1.73, 4.93] |
| 8.2 UAE versus myomectomy (1 month‐2 years) | 1 | 120 | Odds Ratio (M‐H, Fixed, 95% CI) | 1.82 [0.56, 5.94] |
| 9 Adverse events: major postprocedural complications Show forest plot | 3 | 388 | Odds Ratio (M‐H, Fixed, 95% CI) | 0.56 [0.27, 1.18] |
| 9.1 UAE versus hysterectomy or myomectomy (to 5 years) | 2 | 268 | Odds Ratio (M‐H, Fixed, 95% CI) | 0.56 [0.27, 1.18] |
| 9.2 UAE versus myomectomy (1 month‐2 years) | 1 | 120 | Odds Ratio (M‐H, Fixed, 95% CI) | 0.0 [0.0, 0.0] |
| 10 Further interventions within 2 years Show forest plot | 6 | 732 | Odds Ratio (M‐H, Fixed, 95% CI) | 3.72 [2.28, 6.04] |
| 10.1 UAE versus hysterectomy | 2 | 209 | Odds Ratio (M‐H, Fixed, 95% CI) | 2.99 [1.31, 6.80] |
| 10.2 UAE versus hysterectomy or myomectomy | 2 | 281 | Odds Ratio (M‐H, Fixed, 95% CI) | 2.83 [1.29, 6.24] |
| 10.3 UAE versus myomectomy | 2 | 242 | Odds Ratio (M‐H, Fixed, 95% CI) | 6.89 [2.60, 18.27] |
| 11 Further interventions within 5 years Show forest plot | 2 | 289 | Odds Ratio (M‐H, Fixed, 95% CI) | 5.79 [2.65, 12.65] |
| 11.1 UAE versus hysterectomy | 1 | 145 | Odds Ratio (M‐H, Fixed, 95% CI) | 3.43 [1.41, 8.30] |
| 11.2 UAE versus hysterectomy or myomectomy | 1 | 144 | Odds Ratio (M‐H, Fixed, 95% CI) | 20.34 [2.68, 154.59] |
| 12 Unscheduled readmission rate within 4‐6 weeks Show forest plot | 2 | 278 | Risk Difference (M‐H, Fixed, 95% CI) | 0.14 [0.05, 0.22] |
| 12.1 UAE versus hysterectomy | 1 | 157 | Risk Difference (M‐H, Fixed, 95% CI) | 0.23 [0.09, 0.38] |
| 12.2 UAE versus myomectomy | 1 | 121 | Risk Difference (M‐H, Fixed, 95% CI) | 0.02 [‐0.04, 0.07] |
| 13 Cost: duration of procedure (minutes) Show forest plot | 2 | Mean Difference (IV, Fixed, 95% CI) | Subtotals only | |
| 13.1 UAE versus hysterectomy | 1 | 156 | Mean Difference (IV, Fixed, 95% CI) | ‐16.40 [‐26.04, ‐6.76] |
| 13.2 UAE versus myomectomy | 1 | 121 | Mean Difference (IV, Fixed, 95% CI) | ‐49.7 [‐58.76, ‐40.64] |
| 14 Cost: length of hospital stay (days) Show forest plot | 7 | Mean Difference (IV, Fixed, 95% CI) | Totals not selected | |
| 14.1 UAE versus hysterectomy | 3 | Mean Difference (IV, Fixed, 95% CI) | 0.0 [0.0, 0.0] | |
| 14.2 UAE versus hysterectomy or myomectomy | 2 | Mean Difference (IV, Fixed, 95% CI) | 0.0 [0.0, 0.0] | |
| 14.3 UAE versus myomectomy | 2 | Mean Difference (IV, Fixed, 95% CI) | 0.0 [0.0, 0.0] | |
| 15 Cost: resumption of normal activities (days) Show forest plot | 5 | Mean Difference (IV, Fixed, 95% CI) | Subtotals only | |
| 15.1 UAE versus hysterectomy | 2 | 188 | Mean Difference (IV, Fixed, 95% CI) | ‐22.85 [‐27.30, ‐18.40] |
| 15.2 UAE versus hysterectomy or myomectomy | 2 | 220 | Mean Difference (IV, Fixed, 95% CI) | ‐13.68 [‐16.05, ‐11.30] |
| 15.3 UAE versus myomectomy | 1 | 121 | Mean Difference (IV, Fixed, 95% CI) | ‐10.20 [‐13.60, ‐6.80] |
| 16 FSH levels >40 IU/L (within 2 years) Show forest plot | 2 | 297 | Odds Ratio (M‐H, Fixed, 95% CI) | 1.01 [0.53, 1.94] |
| 16.1 UAE versus hysterectomy | 1 | 153 | Odds Ratio (M‐H, Fixed, 95% CI) | 0.70 [0.32, 1.54] |
| 16.2 UAE versus hysterectomy or myomectomy | 1 | 144 | Odds Ratio (M‐H, Fixed, 95% CI) | 2.35 [0.64, 8.68] |
| 17 FSH levels >10 IU/L (within 6 months) Show forest plot | 1 | 120 | Odds Ratio (M‐H, Fixed, 95% CI) | 4.8 [0.97, 23.64] |
| 17.1 UAE versus myomectomy | 1 | 120 | Odds Ratio (M‐H, Fixed, 95% CI) | 4.8 [0.97, 23.64] |
| 18 Fibroid recurrence within 2 years Show forest plot | 1 | 120 | Odds Ratio (M‐H, Fixed, 95% CI) | 1.32 [0.38, 4.57] |
| 18.1 UAE versus myomectomy | 1 | 120 | Odds Ratio (M‐H, Fixed, 95% CI) | 1.32 [0.38, 4.57] |
| 19 Pregnancy Show forest plot | 1 | 66 | Odds Ratio (M‐H, Fixed, 95% CI) | 0.29 [0.10, 0.85] |
| 19.1 UAE versus myomectomy | 1 | 66 | Odds Ratio (M‐H, Fixed, 95% CI) | 0.29 [0.10, 0.85] |
| 20 UAE versus myomectomy: Health related quality of life at one year Show forest plot | 1 | Mean Difference (IV, Fixed, 95% CI) | Subtotals only | |
| 20.1 USF‐QOL end scores | 1 | 122 | Mean Difference (IV, Fixed, 95% CI) | ‐13.40 [‐21.41, ‐5.39] |
| 20.2 USF‐QOL change scores | 1 | 122 | Mean Difference (IV, Fixed, 95% CI) | ‐7.60 [‐17.55, 2.35] |
| 21 UAE versus hysterectomy or myomectomy: SF‐36 within 1 year Show forest plot | 2 | 1405 | Mean Difference (IV, Fixed, 95% CI) | 9.14 [8.04, 10.23] |
| 21.1 Physical function | 2 | 281 | Mean Difference (IV, Fixed, 95% CI) | 7.77 [5.83, 9.70] |
| 21.2 Social function | 2 | 281 | Mean Difference (IV, Fixed, 95% CI) | 6.14 [2.71, 9.58] |
| 21.3 Mental Health | 2 | 281 | Mean Difference (IV, Fixed, 95% CI) | 12.00 [9.50, 14.50] |
| 21.4 Emotional role | 2 | 281 | Mean Difference (IV, Fixed, 95% CI) | 10.28 [7.96, 12.60] |
| 21.5 Vitality | 2 | 281 | Mean Difference (IV, Fixed, 95% CI) | 8.75 [6.09, 11.41] |