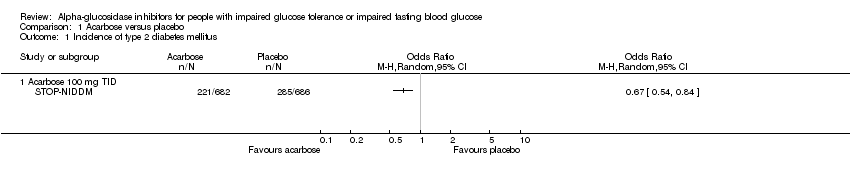
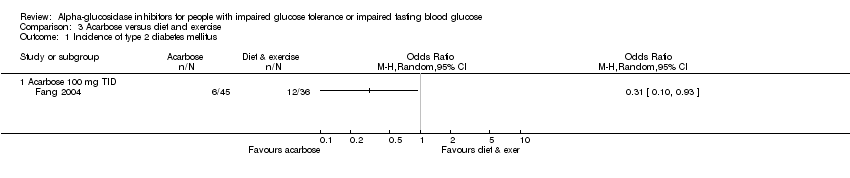
| 1 Incidence of type 2 diabetes mellitus Show forest plot | 1 | | Odds Ratio (M‐H, Random, 95% CI) | Totals not selected |
|
| 1.1 Acarbose 100 mg TID | 1 | | Odds Ratio (M‐H, Random, 95% CI) | 0.0 [0.0, 0.0] |
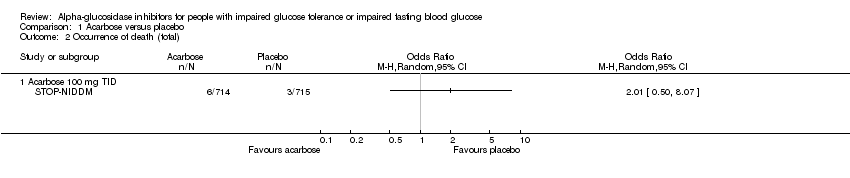
| 2 Occurrence of death (total) Show forest plot | 1 | | Odds Ratio (M‐H, Random, 95% CI) | Totals not selected |
|
| 2.1 Acarbose 100 mg TID | 1 | | Odds Ratio (M‐H, Random, 95% CI) | 0.0 [0.0, 0.0] |
| 3 Occurrence of cardiovascular death Show forest plot | 1 | | Odds Ratio (M‐H, Random, 95% CI) | Totals not selected |
|
| 3.1 Acarbose 100 mg TID | 1 | | Odds Ratio (M‐H, Random, 95% CI) | 0.0 [0.0, 0.0] |
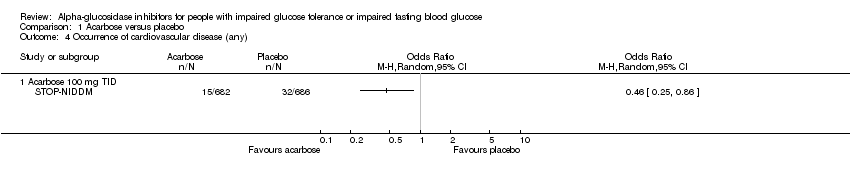
| 4 Occurrence of cardiovascular disease (any) Show forest plot | 1 | | Odds Ratio (M‐H, Random, 95% CI) | Totals not selected |
|
| 4.1 Acarbose 100 mg TID | 1 | | Odds Ratio (M‐H, Random, 95% CI) | 0.0 [0.0, 0.0] |
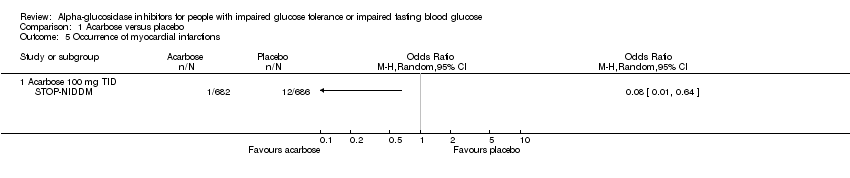
| 5 Occurrence of myocardial infarctions Show forest plot | 1 | | Odds Ratio (M‐H, Random, 95% CI) | Totals not selected |
|
| 5.1 Acarbose 100 mg TID | 1 | | Odds Ratio (M‐H, Random, 95% CI) | 0.0 [0.0, 0.0] |
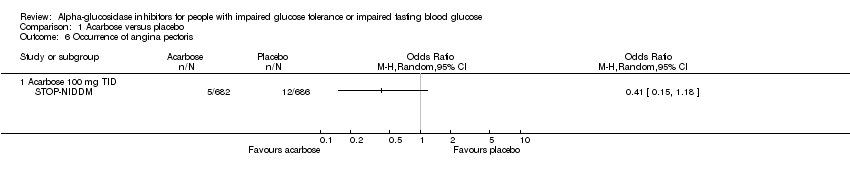
| 6 Occurrence of angina pectoris Show forest plot | 1 | | Odds Ratio (M‐H, Random, 95% CI) | Totals not selected |
|
| 6.1 Acarbose 100 mg TID | 1 | | Odds Ratio (M‐H, Random, 95% CI) | 0.0 [0.0, 0.0] |
| 7 Occurrence of revascularisation procedures Show forest plot | 1 | | Odds Ratio (M‐H, Random, 95% CI) | Totals not selected |
|
| 7.1 Acarbose 100 mg TID | 1 | | Odds Ratio (M‐H, Random, 95% CI) | 0.0 [0.0, 0.0] |
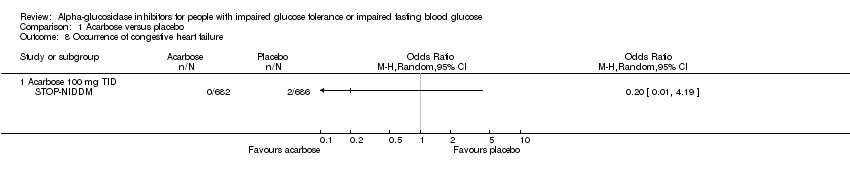
| 8 Occurrence of congestive heart failure Show forest plot | 1 | | Odds Ratio (M‐H, Random, 95% CI) | Totals not selected |
|
| 8.1 Acarbose 100 mg TID | 1 | | Odds Ratio (M‐H, Random, 95% CI) | 0.0 [0.0, 0.0] |
| 9 Occurrence of cerebrovascular events Show forest plot | 1 | | Odds Ratio (M‐H, Random, 95% CI) | Totals not selected |
|
| 9.1 Acarbose 100 mg TID | 1 | | Odds Ratio (M‐H, Random, 95% CI) | 0.0 [0.0, 0.0] |
| 10 Occurrence of peripheral vascular events Show forest plot | 1 | | Odds Ratio (M‐H, Random, 95% CI) | Totals not selected |
|
| 10.1 Acarbose 100 mg TID | 1 | | Odds Ratio (M‐H, Random, 95% CI) | 0.0 [0.0, 0.0] |
| 11 Change in glycated haemoglobin (%) Show forest plot | 1 | | Mean Difference (IV, Random, 95% CI) | Totals not selected |
|
| 11.1 Acarbose 100 mg TID | 1 | | Mean Difference (IV, Random, 95% CI) | 0.0 [0.0, 0.0] |
| 12 Change in fasting blood glucose (mmol/l) Show forest plot | 1 | | Mean Difference (IV, Random, 95% CI) | Totals not selected |
|
| 12.1 Acarbose 100 mg TID | 1 | | Mean Difference (IV, Random, 95% CI) | 0.0 [0.0, 0.0] |
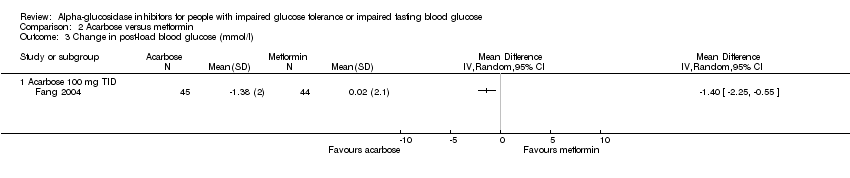
| 13 Change in post‐load blood glucose (mmol/l) Show forest plot | 1 | | Mean Difference (IV, Random, 95% CI) | Totals not selected |
|
| 13.1 Acarbose 100 mg TID | 1 | | Mean Difference (IV, Random, 95% CI) | 0.0 [0.0, 0.0] |
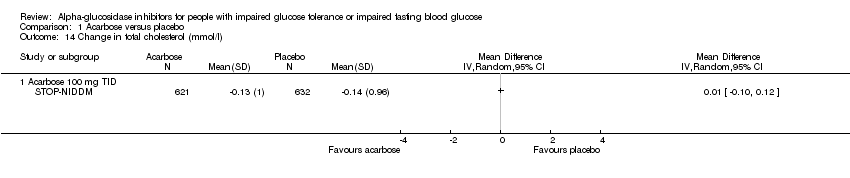
| 14 Change in total cholesterol (mmol/l) Show forest plot | 1 | | Mean Difference (IV, Random, 95% CI) | Totals not selected |
|
| 14.1 Acarbose 100 mg TID | 1 | | Mean Difference (IV, Random, 95% CI) | 0.0 [0.0, 0.0] |
| 15 Change in HDL‐cholesterol (mmol/l) Show forest plot | 1 | | Mean Difference (IV, Random, 95% CI) | Totals not selected |
|
| 15.1 Acarbose 100 mg TID | 1 | | Mean Difference (IV, Random, 95% CI) | 0.0 [0.0, 0.0] |
| 16 Change in LDL‐cholesterol (mmol/l) Show forest plot | 1 | | Mean Difference (IV, Random, 95% CI) | Totals not selected |
|
| 16.1 Acarbose 100 mg TID | 1 | | Mean Difference (IV, Random, 95% CI) | 0.0 [0.0, 0.0] |
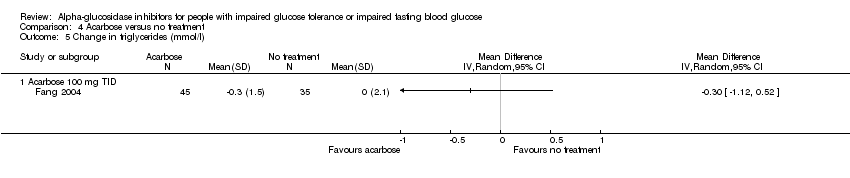
| 17 Change in triglycerides (mmol/l) Show forest plot | 1 | | Mean Difference (IV, Random, 95% CI) | Totals not selected |
|
| 17.1 Acarbose 100 mg TID | 1 | | Mean Difference (IV, Random, 95% CI) | 0.0 [0.0, 0.0] |
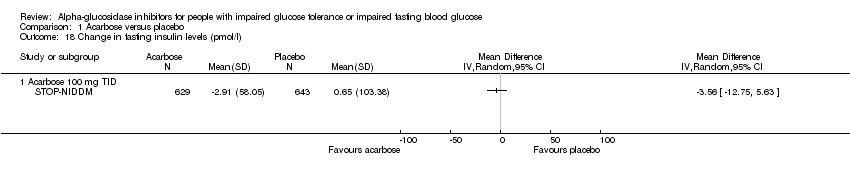
| 18 Change in fasting insulin levels (pmol/l) Show forest plot | 1 | | Mean Difference (IV, Random, 95% CI) | Totals not selected |
|
| 18.1 Acarbose 100 mg TID | 1 | | Mean Difference (IV, Random, 95% CI) | 0.0 [0.0, 0.0] |
| 19 Change in post‐load insulin levels (pmol/l) Show forest plot | 1 | | Mean Difference (IV, Random, 95% CI) | Totals not selected |
|
| 19.1 Acarbose 100 mg TID | 1 | | Mean Difference (IV, Random, 95% CI) | 0.0 [0.0, 0.0] |
| 20 Change in body weight (Kg) Show forest plot | 1 | | Mean Difference (IV, Random, 95% CI) | Totals not selected |
|
| 20.1 Acarbose 100 mg TID | 1 | | Mean Difference (IV, Random, 95% CI) | 0.0 [0.0, 0.0] |
| 21 Change in body mass index (Kg/m2) Show forest plot | 1 | | Mean Difference (IV, Random, 95% CI) | Totals not selected |
|
| 21.1 Acarbose 100 mg TID | 1 | | Mean Difference (IV, Random, 95% CI) | 0.0 [0.0, 0.0] |
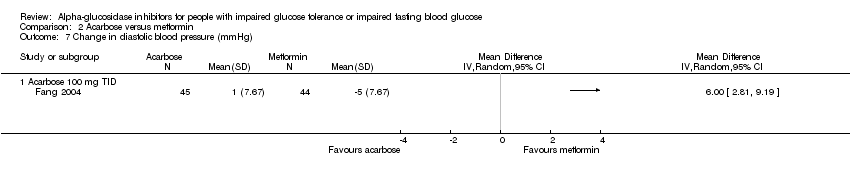
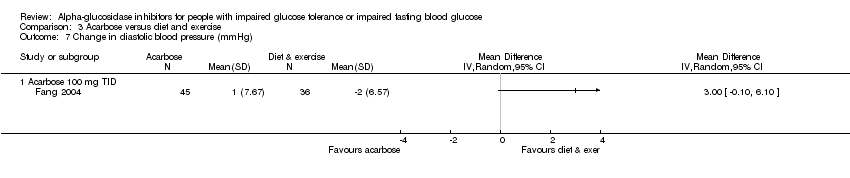
| 22 Change in diastolic blood pressure (mmHg) Show forest plot | 1 | | Mean Difference (IV, Random, 95% CI) | Totals not selected |
|
| 22.1 Acarbose 100 mg TID | 1 | | Mean Difference (IV, Random, 95% CI) | 0.0 [0.0, 0.0] |
| 23 Change in systolic blood pressure (mmHg) Show forest plot | 1 | | Mean Difference (IV, Random, 95% CI) | Totals not selected |
|
| 23.1 Acarbose 100 mg TID | 1 | | Mean Difference (IV, Random, 95% CI) | 0.0 [0.0, 0.0] |
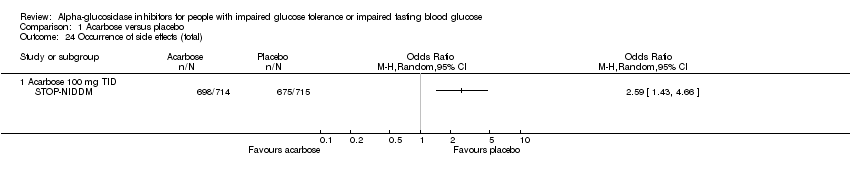
| 24 Occurrence of side effects (total) Show forest plot | 1 | | Odds Ratio (M‐H, Random, 95% CI) | Totals not selected |
|
| 24.1 Acarbose 100 mg TID | 1 | | Odds Ratio (M‐H, Random, 95% CI) | 0.0 [0.0, 0.0] |
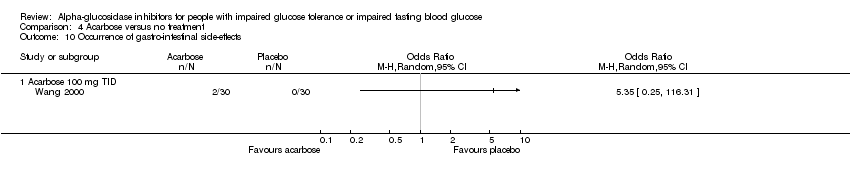
| 25 Occurrence of gastro‐intestinal side‐effects Show forest plot | 1 | | Odds Ratio (M‐H, Random, 95% CI) | Totals not selected |
|
| 25.1 Acarbose 100 mg TID | 1 | | Odds Ratio (M‐H, Random, 95% CI) | 0.0 [0.0, 0.0] |