Vollkorngetreide zur primären oder sekundären Prävention von kardiovaskulären Erkrankungen
Referencias
References to studies included in this review
References to studies excluded from this review
References to studies awaiting assessment
References to ongoing studies
Additional references
References to other published versions of this review
Characteristics of studies
Characteristics of included studies [ordered by study ID]
| Study characteristics | ||
| Methods | Setting: UK (Cambridge and Newcastle) Design: randomisation by minimisation with even distribution of participants in each group by age sex and BMI, parallel group. Dates: trial dates not reported Intervention duration: 16 weeks Follow‐up: no postintervention follow‐up Focus: to compare the effects of different levels of whole grain diets (2 intervention groups) to replace refined grains in the diets of overweight and obese people who were not whole grain consumers on markers of cardiovascular risk. | |
| Participants | N: 316 randomised (to 3 groups) (85/105 completers in the lower‐dose intervention group, 81/105 in the higher‐dose intervention group, and 100/106 in the control group). Inclusion criteria: overweight or obese adults, aged 18 to 65 years, BMI > 25 kg/m2, consuming < 30 g whole grains/day. Exclusion criteria: BMI < 25 kg/m2; habitual consumption of > 30 g/day whole grain; CVD, diabetes, or hyperlipidaemia; smoking > 20 cigarettes/day; history of substance abuse; recent weight change; desire to diet; or absence during a period of the intervention. Age (years): intervention (lower dose): 45.9 SD 10.1; intervention (higher dose): 45.7 SD 9.9; control: 45.6 SD 10.0 Sex (% men): intervention (lower dose): 50.0%; intervention (higher dose): 51.2%%; control: 49.0% Ethnicity: British (ethnic composition not reported) Baseline cardiovascular risk status: all reported as medians. BMI (kg/m2): intervention (lower dose): 30.0 SD 3.7; intervention (higher dose): 30.3 SD 4.5; control: 30.0 SD 4.0 Total cholesterol (mmol/L): intervention (lower dose): 5.1 SD 0.8; intervention (higher dose): 5.3 SD 1.0; control: 5.2 SD 1.0 HDL cholesterol (mmol/L): intervention (lower dose): 1.3 SD 0.3; intervention (higher dose): 1.3 SD 0.2; control: 1.3 SD 0.3 LDL cholesterol (mmol/L): intervention (lower dose): 3.2 SD 0.7; intervention (higher dose): 3.3 SD 0.8; control: 3.2 SD 0.9 Systolic blood pressure (mmHg): intervention (lower dose): 125.5 SD 16.1; intervention (higher dose): 129.5 SD 15.5; control: 127.3 SD 14.8 Diastolic blood pressure (mmHg): intervention (lower dose): 79.0 SD 9.8; intervention (higher dose): 79.0 SD 9.3; control: 79.8 SD 10.2 Medications used: not reported | |
| Interventions | Whole grain group 1: (lower whole grain; 60 g WG/d as 3 servings for 16 weeks) (n = 105 randomised, 85 completed) Whole grain group 2: (higher whole grain; 60 g WG/d as 3 servings for 8 weeks, then 120 g WG/d as 5 servings for 8 weeks) (n = 105 randomised, 81 completed) Control: (usual diet) (n = 106 randomised, 100 completed) Description of dietary intervention: the 2 intervention groups were provided with a range of whole grain foods (whole wheat bread, Shredded Wheat Fruitful, Cheerios, porridge oats, brown basmati rice, whole wheat pasta, Weetabix, porridge, oat bars, and whole grain crisps) and asked to substitute ‘like for like’ for refined grain foods to a prescribed amount. The approach was chosen to reflect choices of whole grains in a free‐living population. Incentives: not reported Co‐interventions in both groups: none Assessment of dietary adherence: FFQ (7‐day recall) at weeks 8 and 16 Was the diet energy reduced? no Comparability of diet composition: There was an (P < 0.05) increase in carbohydrate intake in both whole grain groups at week 8 and week 16, and between control and whole grain group 1 and whole grain group 2. There was also an increase in total energy intake in whole grain group 1 at week 8 and wholegrain group 2 at week 16. There was an increase in protein in whole grain group 1 at week 8 and whole grain group 2 at week 16. Percentage energy from fat decreased in whole grain group 2 at weeks 8 and 16. Dietary fibre increased in both whole grain groups at both week 8 and week 16. (See Table 1.) Change in diet over time: Whole grain intake (estimated from FFQ data): at baseline WG intake was < 20 g/day for each group; for the control group, WG intake averaged 19 (SD 19.9) g/d; for whole grain group 1, WG intake was 74 (SD 28.5) g/d averaged for weeks 8 and 16 (no significant difference between week 8 and 16); for whole grain group 2, WG intake was 83 (SD 3) g/d at week 8 and 115 (SD 39.6) g/d at week 16. (See Table 1.) There were differences between baseline and intervention groups in frequency of consumption of breads and breakfast cereals at week 16 (P < 0.05):
A difference between whole grain group 2 and control was seen for fruit intake after 16 weeks (p<0.005). There were no differences in other food groups (meat, fish, potatoes, rice and pasta, dairy and egg products, milk, spreads, sweets and snacks, vegetables. | |
| Outcomes | Total cholesterol, HDL cholesterol, LDL cholesterol, triacylglycerides (TAG; mmol/L), weight (kg), body fat (%), systolic BP (mm Hg), diastolic BP (mmHg), NEFA (mmol/L), markers of insulin sensitivity, endothelial function, inflammatory and coagulatory status. States no conflicts of interest for any authors. | |
| Funding/conflicts of interest | Fully funded by UK Food Standards Agency (project N02036). Study foods were provided by commercial suppliers (Cereal Partners Worldwide, Weetabix, Allied Bakeries, PepsiCo). | |
| Notes | The authors noted that "the participants appeared to include the whole grain foods as a dietary addition as opposed to the dietary substitution that was explicitly requested". This conclusion is supported by the diet composition data. Adverse effects: 3 participants in both whole grain groups reported intolerance to study foods, none in control group. | |
| Risk of bias | ||
| Bias | Authors' judgement | Support for judgement |
| Random sequence generation (selection bias) | Low risk | "Participants were randomly allocated (using an MS‐DOS based computer program at each study centre)"; minimisation was used to ensure even distribution within each group by age, sex, and BMI |
| Allocation concealment (selection bias) | Unclear risk | Not reported |
| Blinding of outcome assessment (detection bias) | Unclear risk | Researcher collecting anthropometric data was not blind to allocation (secondary outcome). Lipid analysis not specifically reported to have been blind. |
| Incomplete outcome data (attrition bias) | High risk | Attrition greater in both whole grain intervention groups than in control group (85/105 completers in the lower‐dose intervention group, 81/105 in the higher‐dose intervention group, and 100/106 in the control group). Characteristics of those lost to follow‐up not completed. Some reasons provided but not for all dropouts. |
| Intention to treat analysis | Unclear risk | Not reported. Only outcomes for completers reported, so probably not done. |
| Selective reporting (reporting bias) | Unclear risk | Reports all relevant outcomes, but not enough information to judge. |
| Groups comparable at baseline | Low risk | Comparable for lipids (total, HDL, LDL, TAG), blood pressure, and anthropometry |
| Other bias | Low risk | Sample size of 254 participants was calculated to detect a 10% decrease in LDL cholesterol with a 0.05 significance level and 80% power. Allowing for an estimated dropout of 15%, a target of 100 participants per treatment group was proposed. This was achieved. |
| Study characteristics | ||
| Methods | Setting: Finland (Kuopio) and Italy (Naples) Design: parallel groups (with stratification for sex, age, and BMI). Dates: March 2008 to May 2014 Intervention duration: 12 weeks Follow‐up: no postintervention follow‐up Focus: to compare the effects of diets containing whole grain rye or wheat cereals compared to refined grains on markers of metabolic syndrome in people with metabolic syndrome. | |
| Participants | N: 146 randomised (62/71 completers in the whole grain intervention group and 61/75 in the control group). Inclusion criteria: male and female, aged 40 to 65 years, with metabolic syndrome (diagnosed on National Cholesterol Education Program criteria). Exclusion criteria: diabetes and/or renal failure (serum creatinine > 1.5 mg/dL), liver abnormalities (ALT/AST ratio 2 times above normal values), anaemia (haemoglobin < 12 g/dL), any other chronic disease, or if they used any drug able to influence glucose and lipid metabolism and inflammation (corticosteroid hormones other than inhaled corticosteroids, hypolipidaemic and/or anti‐inflammatory drugs); however, in the Kuopio study centre the use of cholesterol lowering medications (statins) was allowed. Age (years): 40 to 65 years, otherwise not reported. Sex (% men): whole grain intervention: 46.9%; control: 47.5% Ethnicity: Italian and Finnish (ethnic composition not reported) Baseline cardiovascular risk status: BMI (kg/m2): whole grain intervention: 31.6 (4.6); control: 31.3 (4.4) Total cholesterol (mmol/L): whole grain intervention: 5.15 (1.09); control: 5.28 (0.93) HDL cholesterol (mmol/L): whole grain intervention: 6 (0.36); control: 4 (0.31) LDL cholesterol (mmol/L): whole grain intervention: 3.26 (0.98); control: 3.41 (0.80) Systolic blood pressure (mmHg): whole grain intervention: 133 (15); control: 135 (14) Diastolic blood pressure (mmHg): whole grain intervention: 84 (9); control: 86 (8) Medications used: in the Kuopio study centre, some individuals were using cholesterol‐lowering medication (10 in the whole grain intervention group and 10 in the control group), however sensitivity analyses were conducted after excluding these people. | |
| Interventions | Whole grain diet group: (wheat and rye whole grain) Control: (refined cereal foods), differed between centres Description of dietary intervention: whole grain wheat and rye products (and smaller amounts of oat and barley), most with a low postprandial glucose and/or insulin response. The only difference between the whole grain and the control diet was the inclusion of a fixed amount of whole grain or refined cereal products as the main carbohydrate source. Aimed to include 90% sourdough bread and 10% endosperm rye bread. Naples ‐ whole grain products including whole wheat bread (plus some endosperm rye bread), whole wheat pasta, barley kernels, whole grain oat biscuits and breakfast cereals (all bran sticks and flakes). Kuopio ‐ whole grain and control diets aimed to include 20% to 25% of the total daily energy intake as study breads. The type of bread consumed by the Kuopio participants was 50% commercial whole grain rye bread, 40% endosperm rye bread, and 10% sourdough whole wheat bread, and participants were advised to replace their habitual potato consumption with 210 g dry weight of whole wheat pasta per week, and were given whole oat biscuits for snacks. Test products in both diets provided free of charge on a weekly basis. Also given written instructions and recipes. Incentives: not reported Co‐interventions in both groups: none Assessment of dietary adherence: 4‐day and 7‐day food records and plasma alkylresorcinols Was the diet energy reduced? no Comparability of diet composition: energy intake increased in intervention and control groups P < 0.02 from baseline, but no significant difference between groups at 12 wks. Significant increased protein, PUFA, total fibre, and cereal fibre between WG group and control at 12 wks (P < 0.05). (See Table 1.) Change in diet over time: not reported | |
| Outcomes | Peripheral insulin sensitivity assessed by FSIGT, lipids and inflammatory markers, body weight, blood pressure, waist circumference, short‐chain fatty acids | |
| Funding/conflicts of interest | European Commission (6th Framework Programme, project HEALTHGRAIN FOOD‐CT‐2005‐514008), Raisio plc Research Foundation (Raisio is a commercial organisation that makes cereal products), the Nordic Centre of Excellence (projects HELGA and SYSDIET). Barilla G&R F.lli.SpA, Parma, Italy and Raisio Nutrition Ltd, Finland provided some of the cereal products for the study participants. | |
| Notes | Stable body weight, body fat composition, and waist circumference maintained during the intervention. | |
| Risk of bias | ||
| Bias | Authors' judgement | Support for judgement |
| Random sequence generation (selection bias) | Low risk | Randomisation was carried out by means of a computerised random allocation list. |
| Allocation concealment (selection bias) | Low risk | Allocation was carried out by personnel not involved in the study. |
| Blinding of outcome assessment (detection bias) | Unclear risk | Anthropometric data collection does not appear to have been blind (secondary outcome). Lipid analysis appears to have been blind. |
| Incomplete outcome data (attrition bias) | High risk | Differential rates of attrition between groups, and characteristics of those lost to follow‐up not reported (62/71 completers in the whole grain intervention group and 61/75 in the control group). |
| Intention to treat analysis | Unclear risk | Not reported. Only outcomes for completers reported, so probably not done. |
| Selective reporting (reporting bias) | Unclear risk | Reports all relevant outcomes, but not enough information to judge. |
| Groups comparable at baseline | Low risk | Comparable for lipids (total, HDL, LDL, TAG), blood pressure, anthropometry, and age |
| Other bias | Unclear risk | Power calculations used insulin sensitivity as outcome variable (not a primary outcome of this review). Power relevant to lipids, blood pressure, or BMI not reported. The 2 centres had different nutritional constituent parts and respective controls. 10 participants in each group had lipid‐lowering medications. |
| Study characteristics | ||
| Methods | Setting: USA Design: randomised parallel study Dates: March 2009 to May 2011 Intervention duration: 12 weeks (6 weeks weight maintenance diet, followed by 6 weeks weight loss diet) Follow‐up: no postintervention follow‐up Focus: to compare the effects of whole grain diets compared to refined grains in people with or at risk of metabolic syndrome (overweight and obese individuals with increased waist circumference and 1 or more other MetS criteria). | |
| Participants | N: 60 randomised (25/28 completers in the whole grain intervention group and 25/32 in the control group). Inclusion criteria: male and female, aged 35 to 55 years (overweight and obese individuals with BMI 25 to 42 kg/m2; with increased waist circumference >/= 102 cm in men and >/= 88 cm in women; and 1 or more other MetS criteria: fasting plasma glucose >/= 100 mg/dL, fasting serum triglycerides >/= 150 mg/dL, BP >/= 130/85 mmHg and/or fasting serum HDL cholesterol < 50 mg/dL in women or < 40 mg/dL in men). Exclusion criteria: use of medications affecting glucose or lipid metabolism, frequent (> 4 times/wk) use of anti‐inflammatory medications, pregnancy or lactation, smoking, high alcohol intake (> 14 drinks/wk), and diagnosed CVD, diabetes, or inflammatory disease. Age (years): 35 to 55 years: whole grain: 46.4 (SD 5.9); control: 45.8 (SD 6.0) Sex (% men): whole grain: 48%; control: 52% Ethnicity: US (ethnic composition not reported) Baseline cardiovascular risk status: BMI (kg/m2): whole grain intervention: 32.9 (3.5); control: 33.5 (4.0) Total cholesterol (mmol/L): not reported HDL cholesterol (mmol/L): whole grain intervention: 6 (0.28); control: 1.06 (0.39) LDL cholesterol (mmol/L): not reported Systolic blood pressure (mmHg): whole grain intervention: 123 (12); control: 125 (12) Diastolic blood pressure (mmHg): whole grain intervention: 83 (10); control: 85(6) Medications used: whole grain group: 48%; control: 40%. Blood pressure medications were allowed. | |
| Interventions | Whole grain diet group (whole grain products, variety of grain types) Control (refined grain products) Description of dietary intervention: the whole grain diet group consumed all WG products from a variety of grain types; those receiving the control diet consumed the refined grain counterpart. The top 3 grains consumed were wheat, oats, and rice with the whole grain diet and wheat, rice, and corn with the refined grain diet. Wheat products constituted 77% of the whole grain diets and 63% of the control diets. Diets were tailored to individual energy requirements; the whole grain diets contained between 163 and 301 g/whole grain per day, and the refined grain diets no whole grains. Both diets comprised an isocaloric weight maintenance diet for 6 weeks followed by an energy‐reduced diet for the next 6 weeks (reduced by ~500 kilocalories/d). All meals and snacks were prepared at metabolic kitchens on the university campus. Participants had to go to the kitchen to pick up or eat their meals. Incentives: not reported Co‐interventions in both groups: none Assessment of dietary adherence: compliance forms (all food provided) Was the diet energy reduced? yes Comparability of diet composition: both diets were designed to have the same macronutrient composition and to meet National Cholesterol Education Program guidelines for saturated fat (< 7% E), mono‐ and polyunsaturated fats (~10% and ~7% E), total cholesterol (< 200 mg/d), and total fibre (> 20 g/d). Participants consumed all study foods and did not consume any additional non‐study foods on 86% of reported days. Physical activity levels were stable. (See Table 1.) Change in diet over time: not reported | |
| Outcomes | Primary: weight, BMI, waist circumference, triglycerides, HDL cholesterol, glucose, systolic BP, diastolic BP. Secondary: total adiponectin, HMW adiponectin, leptin, TC:HDL ratio, LDL cholesterol, CRP, IL‐6, TNF‐alpha, insulin, HOMA‐IR, RMR, % adipose tissue. | |
| Funding/conflicts of interest | Bell Institute of Health and Nutrition (General Mills, Inc.) and National Institutes of Health grant M01RR10732. The first author was supported by a Nestle fellowship, alkylresorcinol analysis was funded by Cereal Partners Worldwide (a joint venture between General Mills, Inc. and Nestle SA). | |
| Notes | To enhance compliance, participants were given the option of taking a 1‐ to 2‐week break after the first 6‐week diet period. | |
| Risk of bias | ||
| Bias | Authors' judgement | Support for judgement |
| Random sequence generation (selection bias) | Low risk | "randomly assigned ... using a computer‐generated random number assignment" |
| Allocation concealment (selection bias) | Unclear risk | "An unblinded study coordinator stratified participants by age, sex and BMI" |
| Blinding of outcome assessment (detection bias) | Low risk | "Outcome assessors (i.e. nurses and technicians) were blinded" |
| Incomplete outcome data (attrition bias) | High risk | Reasons for attrition reported: 7 lost to follow‐up in control group (none due to diet issues), 3 lost to follow‐up in whole grain group (2 due to diet issues), similar rates of loss to follow‐up, but differential rates in those withdrawing because of the diet. |
| Intention to treat analysis | Unclear risk | "Per protocol analysis included only the data from participants who completed both phases of the study" |
| Selective reporting (reporting bias) | Unclear risk | Reports all relevant outcomes but not enough information to judge. |
| Groups comparable at baseline | Low risk | Yes, except for triglycerides, which were higher in the control group. Unclear risk for triglycerides |
| Other bias | Unclear risk | Power calculations used body composition (% of abdominal AT) as outcome variable (not a primary outcome of this review), which required a sample size of 50. This was met, but power relevant to measuring changes in lipids or blood pressure not reported. |
| Study characteristics | ||
| Methods | Setting: USA Design: parallel RCT with stratified randomisation by sex (male or female) and BMI status (BMI < 40 or >/= 40 kg/m2). Dates: trial opened to accrual September 2005, enrolment completed August 2006. Intervention duration: 12 weeks Follow‐up: no postintervention follow‐up Focus: to determine whether including whole grain foods in a hypocaloric (reduced by 500 kilocalories/d) diet enhances weight loss and improves CVD risk factors in obese adults with metabolic syndrome. | |
| Participants | N: 50 randomised (24/25 completers in the whole grain intervention group and 23/25 in the control group). Inclusion criteria: men and women were eligible if they had a BMI (in kg/m2) >/= 30 and met 3 of 5 National Cholesterol Education Program Adult Treatment Panel III criteria for metabolic syndrome:
Exclusion criteria: diagnosed with type 1 or 2 diabetes, CVD, cancer, or any other serious medical condition or if they were using any medications known to affect glucose, insulin, cholesterol, or reproductive hormones; people who smoked, drank > 2 alcoholic beverages/d, or consumed a diet high in whole grains (> 3 servings/d); or who were pregnant or lactating. Age (years): 24 to 63 years. Whole grain group mean age: 45.4 (SD 8); refined grain group mean age 46.6 (SD 9.7). Sex (% men): whole grain group: 48%; refined grain group: 52% Ethnicity: US (48/50 white; 1/50 African‐American; 1/50 Hispanic) Baseline cardiovascular risk status: BMI (kg/m2): whole grain intervention: 35.54 (4.1); control: 36.1 (4.9) Total cholesterol mmol/L: whole grain intervention: 4.91 (1.22); control: 4.86 (0.64) LDL cholesterol, mmol/L: whole grain intervention: 3.08 (1.02); control: 2.96 (0.51) HDL cholesterol, mmol/L: whole grain intervention: 1.07 (0.23); control: 1.06 (0.2) Systolic blood pressure (mmHg): whole grain intervention: 123 (9.4); control: 130.3 (13.3), P = 0.03 Diastolic blood pressure (mmHg) : whole grain intervention: 83.2 (8.3); control: 82.0 (7.5) Medications used: not reported, other than that participants on medications known to affect glucose, insulin, cholesterol, or reproductive hormones were excluded. | |
| Interventions | Whole grain diet group: based on a range of whole grains Control: refined cereal foods Description of dietary intervention: Additionally, both groups were asked to eat 5 servings of fruits and vegetables, 3 servings of low‐fat dairy products, and 2 servings of lean meat, fish, or poultry, per day, based on 2005 dietary guidelines for Americans. The target macronutrient composition was 55% of energy as carbohydrate, 30% of energy as fat (with an emphasis on unsaturated fats), and 15% of energy as protein. Incentives: not reported Co‐interventions in both groups: participants in both groups were encouraged to engage in moderate physical activity for 30 min per session 3 times/wk. Assessment of dietary adherence: 3‐day diet record (and a diet satisfaction questionnaire) Was the diet energy reduced? yes (target energy deficit ~500 kilocalories/d) Comparability of diet composition: yes. Energy intake decreased (P < 0.001) from baseline in both diet groups (as both were weight loss diets). The percentage of energy from carbohydrate and protein increased (P < 0.01), and from fat decreased (P < 0.001) in both diet groups compared with baseline. Participants in the whole grain group increased their intake of total, insoluble, and soluble fibre by 50%, 52%, and 47%, respectively, and those in the refined grain group increased their intakes by 7%, 5%, and 14%, respectively. (See Table 1.) Change in diet over time: as above | |
| Outcomes | Systolic and diastolic BP; lipids (LDL cholesterol, HDL cholesterol, triacylglycerol); anthropometric measures, including weight and BMI; apolipoprotein A1/B; glycaemic measures; satisfaction with diet. | |
| Funding/conflicts of interest | General Mills Bell Institute of Health and Human Nutrition, grant no. K24 HD01476 and M01 RR10732 from the National Institutes of Health, and construction grant no. C06 RR016499 (to the General Clinical Research Center of The Pennsylvania State University). | |
| Notes | ||
| Risk of bias | ||
| Bias | Authors' judgement | Support for judgement |
| Random sequence generation (selection bias) | Low risk | "Participants were assigned to either a whole grain or refined‐grain hypocaloric diet with the use of a stratified randomization scheme" |
| Allocation concealment (selection bias) | Unclear risk | Not reported |
| Blinding of outcome assessment (detection bias) | Unclear risk | Not reported |
| Incomplete outcome data (attrition bias) | Low risk | Attrition and reasons for loss to follow‐up fully reported. |
| Intention to treat analysis | Unclear risk | Analysis only reported for completers. |
| Selective reporting (reporting bias) | Unclear risk | All outcomes fully reported, but not enough information to judge. |
| Groups comparable at baseline | Unclear risk | Yes, except for systolic BP and the percentage of the LDL‐III subclass, which were higher (P=0.03) at baseline in the refined grain group than in the whole grain group; however, there were no other differences at baseline between the groups. |
| Other bias | Unclear risk | Power calculations used weight as outcome variable (not a primary outcome of this review), which required a sample size of 50. This was met, but power relevant to measuring changes in lipids or blood pressure not reported. |
| Study characteristics | ||
| Methods | Setting: Denmark (Copenhagen) Design: parallel‐group RCT Dates: not reported Intervention duration: 12 weeks (after a 2‐week run‐in period) Follow‐up: no postintervention follow‐up Focus: to compare energy‐restricted diets based on whole grain wheat compared to refined grain wheat in overweight or obese postmenopausal women. | |
| Participants | N: 79 were randomised after the run‐in period, and a total of 72 women completed the study (38/42 in the whole grain wheat group and 34/37 in the refined grain wheat group). Inclusion criteria: BMI 27 to 37 kg/m2, age 45 to 70 years, and 1‐year postmenopausal (self reported). Exclusion criteria: smoking, chronic illnesses (diabetes or CVD), untreated hypertension Age (years): 45 to 70 years, otherwise not reported. Sex (% men): 0% (all female) Ethnicity: Danish (ethnic composition not reported) Baseline cardiovascular risk status: The study reports there was no difference in any of the baseline characteristics. BMI (kg/m2): whole grain intervention: 30.0 (SEM 0.4); control: 30.4 (SEM 0.6) Total cholesterol (mmol/L): whole grain intervention: 5.57 (SEM 0.16); control: 5.61 (SEM 0.14) HDL cholesterol (mmol/L): whole grain intervention: 1.24 (0.04 SEM); control: 1.28 (0.04 SEM) LDL cholesterol (mmol/L): whole grain intervention: 3.75 (0.16 SEM); control: 3.75 (0.13 SEM) Systolic blood pressure (mmHg): whole grain intervention: 133 (2 SEM); control: 138 (4 SEM) Diastolic blood pressure (mmHg): whole grain intervention: 85.5 (1.4 SEM); control: 87.3 (1.6 SEM) Medications used: 10 women in each group used antihypertensive medications. | |
| Interventions | Whole grain diet group: whole grain wheat Control: refined wheat foods Description of dietary intervention: whole grain wheat foods as part of an energy‐restricted diet to provide 105 g of whole grains daily. The whole grain or refined grain foods were intended to replace ~2 MJ of the participants' habitual diet, and both groups were asked to consume 62 g of bread, 60 g pasta (uncooked), and 28 g of biscuits daily. There was no restriction on consumption of other cereal products. Both groups were asked to consume an energy‐restricted diet with a deficit of at least 1250 kJ/d but not less than 5000 kJ/d, with minimum protein intake of 60 g/d. The participants met with a dietitian at least 5 times during the study. Food provided biweekly. Incentives: not reported Co‐interventions in both groups: none Assessment of dietary adherence: food diary (self reported) (note only 57 of 72 women who completed the study kept food diaries eligible for data analysis). Was the diet energy reduced? yes (~1250 kJ/d deficit) Comparability of diet composition: total self reported energy intake similar at weeks 1 to 6: whole grain 5830 kJ/d (SEM 190) and refined grain 5900 kJ/d (SEM 280), but higher in refined grain group for weeks 7 to 12: whole grain 6060 kJ/d (SEM 150) and refined grain 6330 (SEM 180) kJ/d. Carbohydrate also appears to be higher in the refined grain group, but SEM and P values not reported. (See Table 1.) Change in diet over time: reported at 4, 8, 12 weeks. (See Table 1.) | |
| Outcomes | Systolic and diastolic blood pressure, total cholesterol, LDL cholesterol, HDL cholesterol, triglycerides, glucose, insulin, HOMA‐IR, glycated haemoglobin, hsCRP, IL‐6, body weight, BMI, waist circumference, FFM. | |
| Funding/conflicts of interest | European Commission in the Communities 6th Framework Programme, Project HEALTHGRAIN (FOOD‐CT‐2005‐514008), the University of Copenhagen, Faculty of Life Sciences and LMC FOOD Research School. Authors M Petronio and G Riboldi are employed by Barilla, and AB Ross is employed by Nestle. | |
| Notes | There was a concomitant increase in energy intake and carbohydrate intake in the refined grain group. Authors report that non‐compliance in the refined grain group did not reflect a lack of intake of refined grain foods, but instead was due to high intake of whole grain products other than the foods provided. | |
| Risk of bias | ||
| Bias | Authors' judgement | Support for judgement |
| Random sequence generation (selection bias) | Low risk | "participants were randomly allocated", but method not reported |
| Allocation concealment (selection bias) | Unclear risk | Not reported |
| Blinding of outcome assessment (detection bias) | Unclear risk | Not reported |
| Incomplete outcome data (attrition bias) | Unclear risk | Loss to follow‐up and reasons for dropout similar in both groups. Whole grain 4/42 lost, refined grain 3/37 lost. However, only 57 of 72 food diaries eligible for analysis, reasons not reported. |
| Intention to treat analysis | Unclear risk | Intention‐to‐treat analysis performed for anthropometric outcomes, no differences in ITT analysis compared to completers. Intention‐to‐treat analysis not done for lipids and blood pressure outcomes. |
| Selective reporting (reporting bias) | Unclear risk | Only 57 of 72 food diaries eligible for analysis, reasons not reported. |
| Groups comparable at baseline | Low risk | States no difference. |
| Other bias | Unclear risk | Power calculations used weight as outcome variable (not a primary outcome of this review), which required a sample size of 72 (36 in each group). This was met, but power relevant to measuring changes in lipids or blood pressure not reported. |
| Study characteristics | ||
| Methods | Setting: Finland Design: parallel‐group RCT Dates: recruitment and screening October 2007 to November 2008, intervention periods were carried out during January 2008 to June 2009. Intervention duration: 12 weeks Follow‐up: no postintervention follow‐up Focus: to investigate the effects of whole grain, fish, and bilberries on serum metabolic profile and lipid transfer protein activities in people with metabolic syndrome. | |
| Participants | N: 131 were randomised (34/42 completers in the whole grain intervention and 35/45 completers in the control group). Inclusion criteria: 40 to 70 years of age, impaired glucose metabolism (FPG 5.6 to 6.9 mmol/L) or in OGTT 2 hour (plasma glucose 7.8 to 11.0 mmol/L) and 2 of the following: BMI 26 to 39 kg/m2, waist circumference > 102 cm in men and > 88 cm in women, serum TG > 1.7 mmol/L, HDL < 1.0 mmol/L in men and < 1.3 mmol/L in women, or blood pressure >= 130 or >= 85 mmHg. Exclusion criteria: BMI > 40 kg/m2; fasting serum triglyceride concentration > 3.5 mmol/L; fasting serum cholesterol > 8 mmol/L; type 1 or 2 diabetes; abnormal liver, kidney, or thyroid function; large alcohol intake (women > 16, men > 24 doses (4 cL liquor or equivalent) during week); inflammatory bowel disease; disease that prevents participation; neuroleptic cortisone medication. Age (years): 40 to 70 years; mean age in whole grain enriched diet group 58 (SD 8) and in control group 59 (SD 7). Sex (% men): whole grain intervention: 50%, control: 51% Ethnicity: Caucasian (understood to be white) Baseline cardiovascular risk status: The study reports there was no difference in any of the baseline characteristics. BMI (kg/m2): whole grain intervention: 31.4 (SD 3.4); control: 31.0 (SD 3.6) Total cholesterol (mmol/L): whole grain intervention: 5.1 (SD 1.0); control: 5.4 (SD 1.0) HDL cholesterol (mmol/L): whole grain intervention: 1.2 (SD 0.4); control: 1.3 (SD 0.3) LDL cholesterol (mmol/L): whole grain intervention: 3.2 (SD 0.8); control: 3.4 (SD 0.8) Systolic blood pressure (mmHg): whole grain intervention: 135 (SD 16); control: 139 (SD 12) Diastolic blood pressure (mmHg): whole grain intervention: 86 (SD 8); control: 88 (SD 7) Medications used: Statins: 10/34 (29%) intervention; 9/35 (26%) control Hormonal replacement therapy: 4/34 (11%) intervention; 3/34 (9%) control Beta‐blocker or diuretics: 12/34 (35%) intervention; 9/35 (25.7%) control | |
| Interventions | Whole grain diet group: whole grain wheat and rye bread Control: refined wheat foods Description of dietary intervention: the whole grain group replaced their habitual grain products with whole grain breads and a bread with low postprandial insulin response. Products covered 20% to 25% of total energy intake and were delivered to the participants. The fibre contents of the breads were 6.9% (endosperm rye bread), 6.4% (whole grain wheat bread), and 10% to 14% (commercial whole grain rye breads). 1 portion of habitually used grain product, e.g. a slice of low‐fibre wheat bread, was allowed daily to increase compliance. Pasta with a fiber content of 6% was also delivered and was instructed to be consumed at the dose equal to 3.5 dL of uncooked pasta per week. Participants were given whole grain oat biscuits of which they were allowed to consume 1 portion per day on a voluntary basis. Biscuits contained 8 to 8.5 g/100 g of dietary fibre and 16 to 18 g/100 g of fat, of which 4.3 to 7.7 g was saturated. The control group replaced their habitually used breads with refined wheat breads (dietary fiber 3 to 4.3 g/100 g) and other cereal products, e.g. pasta, with low‐fibre products (< 6 g/100 g dietary fibre). Participants were allowed to eat a maximum of 1 to 2 portions of rye products per day. Incentives: not reported Co‐interventions in both groups: none Assessment of dietary adherence: 4‐day food record at baseline, three 4‐day food records at weeks 3, 7, and 11. Was the diet energy reduced? no Comparability of diet composition: yes. In the whole grain group, the intake of total fat decreased, but there was no change in the quality of dietary fat. Fibre intake increased in the whole grain group, whereas it decreased in the control group. (See Table 1.) Change in diet over time: reported at baseline, 12 weeks. (See Table 1.) | |
| Outcomes | Gene expression, glucose metabolism, plasma lipidomic profiles | |
| Funding/conflicts of interest | Funding was provided by Academy of Finland (The Research Program on Nutrition, Foods and Health (ELVIRA), Decision number 117844 for MU and 117996 for MO), European Commission in the Communities 6th Framework Programme, Project HEALTHGRAIN (FOOD‐CT‐2005‐514008, for HM and KP), Sigrid Juselius Foundation, The Finnish Diabetes Research Foundation, Nordic Centre of Excellence on Systems Biology in Controlled Dietary Interventions and Cohort Studies (SYSDIET, 070014), TEKES 70103/06, The EVO‐fund of Kuopio University Hospital (5254), Fazer bakeries Oy, Vaasan & Vaasan Oy, KE Leipa¨ Oy, Leipomo Ruista¨hka¨, Leipomo Koskelonseutu, Raisio Oyj, Pakkasmarja Oy, Joswola Oy. The funders had no role in study design, data collection and analysis, decision to publish, or preparation of the manuscript. | |
| Notes | This was a 3‐arm RCT (HealthyDiet, not relevant to this review: whole grain and low postprandial insulin response grain products, fatty fish 3 times a week, and bilberries 3 portions per day; whole grain: whole grain and low postprandial insulin response grain products; control: refined wheat breads and cereal products). | |
| Risk of bias | ||
| Bias | Authors' judgement | Support for judgement |
| Random sequence generation (selection bias) | Low risk | "The randomisation was conducted based on a randomisation table" |
| Allocation concealment (selection bias) | Unclear risk | "Participants were randomly assigned by the study nurse to one of the following groups: HealthyDiet, wholegrain or control" |
| Blinding of outcome assessment (detection bias) | Unclear risk | Not stated. In the CONSORT checklist they mention N/A. |
| Incomplete outcome data (attrition bias) | Low risk | Reasons for attrition were reported and numbers provided: 24.4% in the control and 19% in the intervention. |
| Intention to treat analysis | Unclear risk | Analysis only reported for completers. |
| Selective reporting (reporting bias) | Low risk | All outcomes intended to measure in the protocol were reported. |
| Groups comparable at baseline | Low risk | Yes. "There were no significant differences in the characteristics between the groups at baseline" |
| Other bias | Unclear risk | Power calculations used glucose metabolism as outcome variable (not a primary outcome of this review), which required a sample size of 111 (37 in each group). This was nearly met, but power relevant to measuring changes in lipids or blood pressure not reported. |
| Study characteristics | ||
| Methods | Setting: USA (Bloomington, IN and St Petersburg, FL) Design: randomised parallel‐arm controlled trial Dates: trial dates not reported Intervention duration: 12 weeks Follow‐up: no postintervention follow‐up Focus: to compare the effect on LDL cholesterol and other cardiovascular disease markers of whole grain oat ready‐to‐eat cereal compared to energy‐matched low‐fibre foods as part of a dietary program for weight loss in overweight and obese adults. | |
| Participants | N: 204 randomised, 80/101 completed in whole grain oat ready‐to‐eat cereal group; 73/103 completed in the control group. Inclusion criteria: free‐living overweight and obese adults, BMI 25 to 40 kg/m2 with baseline LDL cholesterol 3.4 to 5.2 mmol/L, aged 20 to 65 years. Exclusion criteria: participants who reported a weight change of 4.5 kg during the previous 2 months; use of weight loss medications within 2 months before screening or supplements, programs, or meal replacement products within 2 weeks before screening; use of drugs (within 4 weeks before screening), supplements, or foods (within 2 weeks before screening) known to alter lipid levels; use of fibre‐containing supplements within 2 weeks before screening; daily consumption of oat or barley products (e.g. ready‐to‐eat oat‐based cereals, oatmeal, or oat bran) or frequent consumption of foods rich in viscous fibre within 2 weeks of screening; clinically significant abnormal laboratory test results (e.g. triglycerides >/= 4.5 mmol/L, glucose >/= 7.0 mmol/L, creatinine >/= 114.4 μmol/L, and alanine aminotransferase and aspartate aminotransferase levels 1.5 times the upper limit of normal), uncontrolled hypertension (systolic/diastolic blood pressures >/= 160/100 mmHg); a history of cardiac, renal, hepatic, endocrine, pulmonary, biliary, pancreatic, gastrointestinal, or neurologic disorders, or cancer in the past 2 years; known sensitivity to any of the ingredients in the study foods; a history of weight‐reducing surgery; a history of eating disorders or alcohol abuse; or use of thyroid hormones (except stable dose replacement therapy) or systemic corticosteroids. Age (years): whole grain oat group: 50.1 (SEM); control: 47.5 (SEM 1.3) Sex (% men): whole grain oat group: 24.7%; control: 17.9% Ethnicity: US:
Baseline cardiovascular risk status: BMI (kg/m2): whole grain intervention: 32.2 (SEM 0.6); control: 32.0 (SEM 0.5) Total cholesterol (mmol/L): whole grain intervention: 6.00 (SEM 0.08); control: 5.92 (SEM 0.08) HDL cholesterol (mmol/L): whole grain intervention: 1.24 (0.03); control: 1.24 (0.04) LDL cholesterol (mmol/L): whole grain intervention: 4.02 (0.05); control: 4.00 (0.06) Triglyceride (mmol/L): whole grain intervention: 1.65 (SEM 0.0.9); control: 1.48 (SEM 0.0.8) Systolic blood pressure (mmHg): whole grain intervention: 127.2 (SEM 1.2); control: 122.6 (SEM 1.3) (P = 0.01) Diastolic blood pressure (mmHg): whole grain intervention: 79.4 (0.9); control: 78.3 (1.00) Medications used: not reported | |
| Interventions | Whole grain diet group: whole grain oat ready‐to‐eat cereal Control: low‐fibre cereal foods Description of dietary intervention: 2 portions per day of whole grain ready‐to‐eat oat cereal or energy‐matched low‐fibre foods (control) such as corn cereals, white toast, plain bagels, English muffins, pretzels, soda crackers, or rice cakes, as part of a reduced‐energy (~500 kilocalories/day deficit) dietary program that encouraged limiting consumption of foods high in energy and fat, portion control, and regular physical activity. All participants were asked to avoid foods rich in viscous soluble fibre such as barley, oatmeal and oat bran products except for the study products provided to the whole grain oat cereal group. The whole grain oat ready‐to‐eat cereal (Cheerios, General Mills, Minneapolis, MN) was packaged in ~40 g portions by the manufacturer. A registered dietitian met biweekly with participants to monitor and reinforce dietary changes. Incentives: not reported Co‐interventions in both groups: regular physical activity (30 to 60 min/day) was encouraged in both groups as part of the intervention. Physical activity was assessed using a 7‐day recall questionnaire. At baseline, the mean activity scores above resting were 118.4 (SEM 7.6) metabolic equivalent hours in the whole grain oat group and 118.3 (SEM 10.0) in the control group. Physical activity scores increased by 9.1% (SEM 4%) in the whole grain group and 15% (SEM 5.2%) (P = 0.710) in the control group. Assessment of dietary adherence: 3‐day self reported diaries recording compliance with provided foods, participant interview, and review of unused foods. The whole grain oat group consumed 96.8% (SEM 0.6) of the expected servings of study foods, and the control group consumed 95.7% (SEM 0.7) (P = 0.202). Was the diet energy reduced? yes (~500 kilocalories/day deficit) Comparability of diet composition: (See Table 1.) As designed, both groups reduced energy intakes; there was no difference between groups at week 12, although the control group showed a larger reduction in energy intake at week 4. The percentage of total daily energy intake from carbohydrate was greater at week 12 in the whole grain oat group than in the control group (P = 0.017). Total and soluble fibre increased as expected. Change in diet over time: as above for energy. (See Table 1.) | |
| Outcomes | Total cholesterol, LDL cholesterol, HDL cholesterol, non‐HDL cholesterol, triglycerides, BMI, waist circumference, midarm circumference, triceps skinfold thickness | |
| Funding/conflicts of interest | General Mills Bell Institute of Health and Nutrition, Minneapolis, MN. 3 of the authors are employees of General Mills, 3 authors are employees of Provident Clinical Research and received research grant support from General Mills to conduct the study. 1 author is an employee of Meridien Research and received research grant support from General Mills. | |
| Notes | Adverse effects: the frequencies of adverse events (of any type, whether related to the study products or not) were reported to be similar between groups (59.8% for the whole grain group and 52.4% for the control group, P = 0.321). The most common adverse events in both groups were respiratory tract infection, sinusitis, and pharyngitis. Most adverse events were mild and not related to the study product. Adverse events the authors considered related to the study products were nausea (2 people in the whole grain oat group), flatulence (2 people in the whole grain oat group), gastroenteritis (1 person in the control group), gastroesophageal reflux (1 person in the control group), and vomiting (1 person in the control group). Adverse events that led to drop out from the study were an infectious cyst (1 control) and spinal stenosis (1 control), but the study authors did not consider these to be related to the study product. | |
| Risk of bias | ||
| Bias | Authors' judgement | Support for judgement |
| Random sequence generation (selection bias) | Unclear risk | "participants were randomly assigned"; method of randomisation not reported |
| Allocation concealment (selection bias) | Unclear risk | Not reported |
| Blinding of outcome assessment (detection bias) | Unclear risk | Not reported for anthropometry or lab measurements |
| Incomplete outcome data (attrition bias) | High risk | More participants completed study in whole grain oat group than in control group. 20 withdrew consent in control group, 11 in whole grain oat group; both groups lost n = 7 to follow‐up; 2 in control group reported adverse events; 1 in WG group reported product too filling. There was differential dropout between groups. |
| Intention to treat analysis | Unclear risk | Modified intention‐to‐treat analyses done. Of 101 participants randomised to whole grain oat group, 86 were included in MITT analysis (15 were excluded as they did not have at least 1 postrandomisation lipid value or the blood draw was invalid). Of 103 randomised to control group, 87 were included in MITT analysis (16 were excluded as they did not have at least 1 postrandomisation lipid value or the blood draw was invalid). Sensitivity analyses conducted using MITT and completers data. Results also presented as per‐protocol subset of MITT. |
| Selective reporting (reporting bias) | Unclear risk | Blood pressure data not fully reported; no outcome data given. |
| Groups comparable at baseline | Unclear risk | Yes, for all reported measures, except for systolic blood pressure, which was higher in the whole grain oat group compared to control (127.2 SEM 1.2 vs 122.6 SEM 1.3). However, outcome data not reported for systolic blood pressure. Reported only for the per‐protocol subset. |
| Other bias | Low risk | Power calculations: a sample size of 128 (64 per arm) was expected to provide 80% power to detect a difference of 5% between groups in the per cent change from baseline in LDL cholesterol, assuming a 10% pooled standard deviation for the LDL cholesterol response. This sample size was achieved in both the analysis on completers and the MITT analysis. |
| Study characteristics | ||
| Methods | Setting: UK (Aberdeen, Scotland) Design: parallel‐group RCT, stratified by sex, age, and BMI Dates: September 2005 to December 2008 Intervention duration: 12 weeks (following 4‐week run‐in) Follow‐up: no postintervention follow‐up Focus: to assess the effects of consumption of 3 daily portions of whole grains (2 intervention groups: wheat only or a mixture of wheat and oats) compared to refined grains on markers of cardiovascular disease risk in people at relatively high risk. | |
| Participants | N: 226 randomised (73/77 completers in the whole grain wheat intervention group; 70/73 in the whole grain wheat and oats group; and 63/76 in the control group). Inclusion criteria: male and female, aged 40 to 65 years with a BMI between 18.5 and 35. Sedentary or moderately active (< 2 aerobic sessions/wk) people or those with signs of metabolic syndrome or moderate hypercholesterolaemia. Exclusion criteria: people with CVD, diabetes, fasting blood glucose > 7.0 mmol/L, asthma, systolic BP > 160 mmHg and diastolic BP > 99 mmHg, thyroid conditions, eating disorders, high intake of whole grain foods, or taking regular medication or supplements known to affect any of the outcomes. Age (years): 40 to 65 years recruited: whole grain wheat group mean age 51.6 (SEM 0.8); whole grain wheat + oats: 52.1 (SEM 0.9); refined grain (control group): 51.8 (SEM 0.8). Sex (% men): whole grain wheat group: 52%; whole grain wheat + oats: 51%; refined grain (control group): 48%. Ethnicity: Scottish (ethnic composition not reported) Baseline cardiovascular risk status: BMI (kg/m2): whole grain wheat group: 28.0 (SEM 0.5); whole grain wheat + oats: 27.0 (SEM 0.4); control: 28.0 (SEM 0.5); P = 0.221 Total cholesterol (mmol/L): whole grain wheat group: 5.46 (SEM 0.14); whole grain wheat + oats: 5.57 (SEM 0.12); control: 5.94 (SEM 0.14); P = 0.087 HDL cholesterol (mmol/L): whole grain wheat group: 1.55 (SEM 0.04); whole grain wheat + oats: 1.62 (SEM 0.05); control: 1.62 (SEM 0.06); P = 0.506 LDL cholesterol (mmol/L): whole grain wheat group: 3.45 (SEM 0.11); whole grain wheat + oats: 3.45 (SEM 0.11); control: 3.66 (SEM 0.12); P = 0.365 Triglycerides (TAG): whole grain wheat group: 1.27 (SEM 0.08); whole grain wheat + oats: 2 (SEM 0.06); control: 1.49 (SEM 0.11); P = 0.012 Systolic blood pressure (mmHg): whole grain wheat group: 125.9 (SEM 1.4); whole grain wheat + oats: 131.7 (SEM 1.4); control: 131.2 (SEM 1.4); P = 0.019 Diastolic blood pressure (mmHg): whole grain wheat group: 75.7 (SEM 0.8); whole grain wheat + oats: 78.4 (SEM 0.8); control: 79.1 (SEM 0.8); P = 0.26 Medications used: monitored but not reported | |
| Interventions | Whole grain diet group: 2 intervention groups: whole grain wheat and whole grain wheat and oats Control: refined grain foods Description of dietary intervention: after a 4‐week run‐in period on the refined grain diet, the intervention groups had 3 servings/d of refined cereal foods replaced by either 3 servings of whole wheat foods (70 to 80 g wholemeal bread and 30 to 40 g whole grain cereals) or with 1 serving of whole wheat foods and 2 servings of oats. The study foods, both refined and whole grain, were products widely available from UK food retailers. Apart from the whole grain foods supplied, participants selected their own foods to eat and advice on which foods to replace with whole grain servings was standardised to each participant's regular diet. Incentives: not reported Co‐interventions in both groups: none Assessment of dietary adherence: 7‐day food diaries, 3 times during the intervention. Was the diet energy reduced? no Comparability of diet composition: no differences in macronutrients, except for fibre (as expected). (See Table 1.) Change in diet over time: reported at baseline and week 12. (See Table 1.) | |
| Outcomes | Total cholesterol, triglycerides (TAG), HDL cholesterol, LDL cholesterol, Apo A‐I, Apo B, BMI waist circumference, systolic BP, diastolic BP, pulse pressure, heart rate, stiffness index, insulin, glucose, HOMA‐IR, revised QUICKI, h CRP, IL‐6 | |
| Funding/conflicts of interest | UK Food Standards Agency (grant NO2035), Scottish government (Rural and Environment Research and Analysis Directorate). Oat cakes were supplied by Paterson Arran Ltd. | |
| Notes | ||
| Risk of bias | ||
| Bias | Authors' judgement | Support for judgement |
| Random sequence generation (selection bias) | Low risk | Web‐based randomisation system, random permuted blocks stratified by age, gender, and BMI |
| Allocation concealment (selection bias) | Low risk | Off‐site allocation |
| Blinding of outcome assessment (detection bias) | Low risk | Outcome assessors blind. |
| Incomplete outcome data (attrition bias) | High risk | Loss to follow‐up higher in control group: 63/76 completers, 11 voluntarily withdrew, 2 excluded; whole grain wheat group 73/77 completers, 4 voluntarily withdrew; whole grain wheat + oats group 70/73 completers, 2 voluntarily withdrew, 1 excluded. Reasons for higher withdrawal in control group not clear. |
| Intention to treat analysis | Unclear risk | Not reported |
| Selective reporting (reporting bias) | Unclear risk | Blood pressure outcomes provided by author as not reported in publications except graphically. Unclear if all variables reported at baseline are outcomes. |
| Groups comparable at baseline | Unclear risk | Yes, except for both systolic and diastolic blood pressure, which were lower in the whole grain wheat group than in the whole grain wheat + oats group and the control group |
| Other bias | Low risk | Sample size was based on total cholesterol and LDL cholesterol. Power calculations indicated 60 participants per group would give sufficient power to detect effects of 5% to 7%. This was met. |
| Study characteristics | ||
| Methods | See above | |
| Participants | See above | |
| Interventions | See above | |
| Outcomes | See above | |
| Funding/conflicts of interest | See above | |
| Notes | See above | |
| Risk of bias | ||
| Bias | Authors' judgement | Support for judgement |
| Random sequence generation (selection bias) | Low risk | See above |
| Allocation concealment (selection bias) | Low risk | See above |
| Blinding of outcome assessment (detection bias) | Low risk | See above |
| Incomplete outcome data (attrition bias) | High risk | See above |
| Intention to treat analysis | Unclear risk | See above |
| Selective reporting (reporting bias) | Unclear risk | See above |
| Groups comparable at baseline | Unclear risk | See above |
| Other bias | Low risk | See above |
| Study characteristics | ||
| Methods | Setting: China Design: parallel‐group RCT (stratified by sex and 5‐year age category) Dates: 2009 onwards (initial screening conducted in 2009) Intervention duration: 16 weeks Follow‐up: no postintervention follow‐up Focus: to compare the effects of replacing white rice with brown rice in the diets of middle‐aged Chinese men and women with diabetes or a high risk for diabetes. | |
| Participants | Faculty and staff of a large university in Shanghai who had metabolic syndrome. N: 202 randomised (to 2 groups); 193 completed overall. 98/101 completers in brown rice group; 95/101 completers in white rice group. Inclusion criteria: people with MetS defined as presenting with at least 3 of the following components:
Exclusion criteria: history of severe kidney disease, cardiovascular disease, stroke, cancer, or psychological disorders as well as pregnant or lactating women were excluded. Age (years): white rice group: 49.8 SD 7.1; brown rice group: 49.6 SD 6.7 Sex (% men): white rice group: 53.5%; brown rice group: 53.5% Ethnicity: Chinese Baseline cardiovascular risk status: mean (SD) or (95% confidence interval (CI)) BMI (kg/m2): white rice: 25.4 SD 2.5; brown rice: 25.9 SD 3.4; P = 0.22 Total cholesterol (mmol/L): white rice: 5.55 SD 1.33; brown rice: 5.44 SD 1.27; P = 0.55 HDL cholesterol (mmol/L): white rice: 1.31 SD 0.38; brown rice: 1.22 SD 0.34; P = 0.08 LDL cholesterol (mmol/L): white rice: 3.93 SD 8; brown rice: 3.81 SD 1; P = 0.46 Triglycerides (mmol/L): white rice: 1.78 (95% CI 1.21 to 2.39); brown rice: 1.81 (95% CI 1.30 to 2.53); P = 0.48 Systolic blood pressure (mmHg): white rice: 129 SD 15; brown rice: 129 SD 16; P = 0.82 Diastolic blood pressure (mmHg): white rice: 85 SD 10; brown rice: 86 SD 10; P = 0.42 Medications used: antihypertensive agents (% using): white rice: 44.6; brown rice: 29.7; P = 0.03 hypoglycaemic agents (% using): white rice: 5.0; brown rice: 4.0; P = 0.73 lipid‐lowering agents (% using): white rice: 3.0; brown rice: 3.0; P = 1.00 | |
| Interventions | White rice: the 2 types of rice in the study were from the same batch; the white rice was produced by further milling the brown rice. Both types of rice were cooked in the same steam box under the same conditions. Brown rice: from the same batch as the white rice as described above. Description of dietary intervention: the cooked rice was packaged into 225 g servings (equivalent to 100 g cooked rice) and provided to participants at designated university campus cafeterias during the lunch hour from Monday to Fridays. Participants took cooked rice home for dinner and meals on Saturdays. They were encouraged to eat ad libitum and were permitted to consume other staple foods only on Sundays. They were instructed to maintain their usual dietary pattern regarding other food selections. Incentives: not reported Co‐interventions in both groups: none Assessment of dietary adherence: compliance was monitored by researchers weighing leftovers in the cafeteria and was calculated as the frequency of consumption of the prescribed type of rice divided by the frequency of consumption of total staple carbohydrates throughout the intervention. Participants recorded the amount of rice they consumed at home using electronic scales provided by the researchers. Dietary intake measured using a 3‐day diet record was obtained at baseline and every 4 weeks during follow‐up. Was the diet energy reduced? no Comparability of diet composition: adherence to diets was high: mean adherence 90.0 +/‐ 17.1% in the white rice group and 88.7 +/‐ 23.3% in the brown rice group; P for difference = 0.20. There was no difference in energy intake between groups over the intervention period, but lower intake of carbohydrates (P = 0.03) and dairy products in the brown rice group (P = 0.02). There was no difference in protein, fat, dietary cholesterol, vegetables, fruits, red meat, poultry, or seafood. Dietary fibre was higher in the brown rice group, as would be expected (P < 0.0001). (See Table 1.) Change in diet over time: reported at weeks 4, 8, 12, and 16. (See Table 1.) | |
| Outcomes | BMI, waist circumference, systolic blood pressure, diastolic blood pressure, total cholesterol, LDL cholesterol, HDL cholesterol, total:HDL cholesterol ratio, triglycerides, glucose, insulin, HOMA‐IR | |
| Funding/conflicts of interest | Supported by Chief Scientist Program of Shanghai Institutes for Biological Sciences, Chinese Academy of Sciences, National Basic Research Program of China, National Natural Science Foundation of China. | |
| Notes | No between‐group differences were found for any markers except serum LDL concentration, which decreased more in the white rice group that in the brown rice group (P = 0.02). However, this effect was only observed among participants with diabetes (n = 47). Among participants with diabetes, a greater reduction in diastolic blood pressure was observed in the brown rice group than in the white rice group (P = 0.02). | |
| Risk of bias | ||
| Bias | Authors' judgement | Support for judgement |
| Random sequence generation (selection bias) | Unclear risk | "randomly assigned (stratified by sex and 5y age category)", but method of randomisation not reported |
| Allocation concealment (selection bias) | Unclear risk | Not reported |
| Blinding of outcome assessment (detection bias) | Low risk | All researchers not directly in contact with study participants (dietitians, laboratory technicians, and statisticians) were unaware of group allocations. Not possible for participants to be unaware of their group assignment due to differences in appearance and texture of the brown and white rice. |
| Incomplete outcome data (attrition bias) | Low risk | 98/101 completers in brown rice group; 95/101 completers in white rice group. The 6 withdrawals in the white rice group were due to busy schedule (n = 4); loss of interest (n = 1); or stroke unrelated to intervention. The 3 withdrawals in the brown rice group were due to a busy schedule or heart disease unrelated to the intervention. |
| Intention to treat analysis | Low risk | Intention‐to‐treat analysis done for all relevant outcomes. |
| Selective reporting (reporting bias) | Unclear risk | All outcomes of relevance to this review that were reported at baseline were reported at follow‐up. |
| Groups comparable at baseline | Unclear risk | Higher proportion of participants with diabetes (P = 0.03) and participants on antihypertensive medication (P = 0.03) in the white rice group at baseline |
| Other bias | Unclear risk | Sample size calculation based on fasting glucose outcome, which is not a relevant outcome for this review. |
% E: percentage energy
ALT/AST: alanine transaminase/aspartate transaminase
BMI: body mass index
BP: blood pressure
CVD: cardiovascular disease
FFQ: Food Frequency Questionnaire
FPG: fasting plasma glucose
FSIGT: frequently sampled intravenous glucose tolerance test
HDL: high‐density lipoprotein
ITT: intention‐to‐treat
LDL: low‐density lipoprotein
MITT: modified intention‐to‐treat
NEFA: non‐esterified fatty acids
OGTT: oral glucose tolerance test
PUFA: polyunsaturated fatty acid
RCT: randomised controlled trial
SD: standard deviation
SEM: standard error of the mean
TAG: triacylglyceride
TC/HDL: total cholesterol/HDL cholesterol
TG: triglycerides
WG: whole grain
Characteristics of excluded studies [ordered by study ID]
| Study | Reason for exclusion |
| Not a primary study | |
| Short‐term intervention | |
| Not specifically whole grain | |
| Not specifically whole grain | |
| Not RCT | |
| Intervention < 12 weeks | |
| Not specifically whole grain | |
| Cannot separate effect of whole grain | |
| Not whole grain | |
| Cannot isolate the effect of whole grain. (Intervention groups are barley, barley and whole grain, or whole grain. Not clear if all the barley‐based foods are whole grain, but any comparison would be whole grain versus whole grain.) | |
| Cannot isolate the effect of whole grain. (Intervention groups are barley, barley and whole grain, or whole grain. Not clear if all the barley‐based foods are whole grain, but any comparison would be whole grain versus whole grain.) | |
| All 3 diets are whole grain, so comparison is one type of whole grain against another. | |
| Inpatients | |
| From translation of paper, both the intervention and control groups were given products containing oat bran, which did not meet the definition of whole grain for this review. | |
| Not whole grain | |
| Only 3‐week intervention | |
| Not whole grain | |
| Not whole grain | |
| Postprandial study only | |
| Not lipid or blood pressure outcomes. Main outcomes are reported in Brownlee 2010, which is an included study. This study reports longer‐term effects of the intervention on whole grain consumption. | |
| Not whole grain | |
| Not whole grain | |
| Not specifically whole grain | |
| Not RCT | |
| Not specifically whole grain | |
| Not RCT | |
| Not specifically whole grain | |
| Not whole grain | |
| Intervention < 4 weeks | |
| Not specifically whole grain | |
| Macronutrients not reported. | |
| Intervention < 12 weeks | |
| Not whole grain | |
| Not whole grain, mixture of different carbohydrates including corn and soya | |
| Not whole grain (guar gum, bran) | |
| Intervention < 4 weeks | |
| Not specifically whole grain | |
| Not whole grain | |
| Relevant study, RCT, relevant outcomes, but only 6‐week intervention | |
| < 4 weeks, outcomes not relevant | |
| Not whole grain | |
| Not whole grain | |
| Intervention < 4 weeks | |
| Not RCT | |
| Intervention < 12 weeks | |
| Comparison is whole grain versus whole grain; cannot isolate effect of whole grain. | |
| Cannot isolate the effect of whole grain | |
| Not whole grain | |
| Does not report lipid or BP outcomes | |
| Only 3‐week intervention | |
| Not RCT | |
| Not specifically whole grain | |
| Not whole grain | |
| Not RCT | |
| Outcomes not relevant, < 12 weeks | |
| Intervention is whole grain and bran. 4‐week intervention | |
| Product is described as a whole wheat protein isolate. We contacted the authors but were unable to obtain any further information on the nature of the product. | |
| Not RCT | |
| Intervention < 4 weeks | |
| Not specifically whole grain | |
| Not whole grain | |
| Intervention < 4 weeks | |
| Not specifically whole grain | |
| Not RCT | |
| Participants not diagnosed with CHD or risk factors. | |
| Not specifically whole grain | |
| Not specifically whole grain | |
| Not whole grain | |
| Outcome is serum enterolactone, which was not a specified outcome for this review. | |
| Not specifically whole grain | |
| Not specifically whole grain | |
| Not specifically whole grain | |
| Comparison is high cereal fibre vs low glycaemic index, but not all differences due to whole grain. | |
| Intervention < 12 weeks | |
| Cannot isolate effect of whole grains | |
| Intervention < 4 weeks | |
| Intervention group consumed wholemeal rye bread enriched with rye bran; cannot isolate the effect of whole grain. | |
| Cannot isolate the effect of whole grain | |
| Relevant study, RCT, relevant outcomes, but only 6‐week intervention | |
| Not specifically whole grain | |
| Intervention < 12 weeks (6 weeks) | |
| Cannot isolate the effect of whole grain | |
| Intervention < 4 weeks | |
| Not whole grain | |
| Not specifically whole grain | |
| Intervention < 12 weeks | |
| Not specifically whole grain | |
| Intervention < 12 weeks | |
| Relevant study, RCT, relevant outcomes, but only 8‐week intervention | |
| Not whole grain | |
| Not specifically whole grain | |
| Intervention < 4 weeks | |
| Compares 2 diets containing whole grain, but whole grain not the only component, so cannot identify effect of whole grain | |
| Intervention < 4 weeks | |
| Intervention < 12 weeks | |
| Not RCT | |
| Not specifically whole grain | |
| Comparison is WG sourdough versus refined white (not equivalent comparison). Intervention < 12 weeks | |
| Not whole grain | |
| Cannot isolate effect of whole grain | |
| Oat β‐glucan but not whole grain | |
| Intervention is the effect of whole grain plus the withdrawal of refined sugars; cannot isolate effect of whole grain. | |
| Not specifically whole grain | |
| Intervention < 12 weeks | |
| Cannot specifically isolate the effect of whole grain | |
| No included outcomes. Intervention < 12 weeks | |
| No included outcomes | |
| Relevant study, RCT, lipid outcomes, but 6‐week intervention | |
| Comparison is whole grain vs whole grain. | |
| Not RCT | |
| Not whole grain | |
| Dietary intakes not reported, and compliance unclear | |
| Not whole grain cereal | |
| Not RCT | |
| No lipid or blood pressure outcomes. The primary outcomes of this study relate to insulin sensitivity. As there is now a separate published review on whole grains and diabetes outcomes in which this study was included (Priebe 2008), it has now been excluded from the present review, for which the main outcomes relate to CVD and lipid and blood pressure outcomes. | |
| Excluded due to a lack of clarity about the relative macronutrient content of the diets. There is a reference to the macronutrient data in the paper (Table reference T2) to the journal website. However, the data were not available there, so we attempted to contact the authors, but were unable to find up‐to‐date contact details.
In the original version of this review this study was included as it aimed for the same macronutrient content in both arms. It was marked as awaiting further information. We have been unable to verify the relative macronutrient of the diets (as above), so the study is now excluded. | |
| Cannot isolate the effect of whole grain | |
| Not relevant comparison ‐ whole grain vs nutrient replacement product | |
| Abstract only ‐ no full paper found | |
| Intervention < 12 weeks | |
| Not whole grain | |
| Outcomes not relevant ‐ reports plasma alkylresorcinols | |
| Not RCT | |
| High fibre versus low fibre; not specifically whole grain | |
| Not specifically whole grain | |
| Not all participants free‐living | |
| 6‐week intervention | |
| Not whole grain | |
| Not whole grain barley: "administered in various forms, including pearled barley, barley | |
| Same study as Tighe 2010, relevant results reported in Tighe 2010 (included study) | |
| Comparison is rolled oats versus wheat, but it is not clear from the paper whether the wheat products used in the comparison were whole grain or refined grain. We contacted the authors but obtained no further details. | |
| Comparison is rolled oats versus wheat, but it is not clear from the paper whether the wheat products used in the comparison were whole grain or refined grain. We contacted the authors but obtained no further details. | |
| 4‐week intervention; comparison is wholemeal rye versus low‐fibre wheat, which is not an equivalent comparison | |
| 6‐week intervention. Intervention is oatmeal and oat bran. | |
| Intervention < 12 weeks | |
| Intervention < 12 weeks | |
| Cannot isolate the effects of whole grain (intervention is oats and oat bran) | |
| 8‐week intervention only | |
| Does not report energy intake or macronutrients | |
| Participants not free‐living | |
| Not specifically whole grain | |
| Oat β‐glucan rather than WG, 4‐week intervention only | |
| Intervention not specifically whole grain | |
| Not specifically whole grain | |
| Intervention < 12 weeks (6 weeks) |
BP: blood pressure
CCT: controlled clinical trial
CHD: coronary heart disease
CVD: cardiovascular disease
RCT: randomised controlled trial
WG: whole grain
Characteristics of studies awaiting classification [ordered by study ID]
| Methods | Randomised controlled trial |
| Participants | Unclear if free‐living ‐ 100 people with impaired fasting glucose |
| Interventions | Oatmeal vs barley flake, 3 months |
| Outcomes | Reduction in total cholesterol and LDL cholesterol (P < 0.001 and P = 0.002, respectively) |
| Notes | Unsure if barley flake is from pearl barley or whole grain barley, and unclear if free‐living participants were involved. Contacted authors on 19 August 2016, but have received no response. |
| Methods | Randomised controlled trial |
| Participants | 298 overweight participants with type 2 diabetes mellitus |
| Interventions | 30‐day centralised intervention, then participants returned home and and were asked to continue with their diet. Participants were randomly allocated to 1 of the following 4 groups.
|
| Outcomes | Anthropometric measurements, glucose profile, lipid profile |
| Notes | To be included in the update of this review |
LDL: low‐density lipoprotein
Characteristics of ongoing studies [ordered by study ID]
| Study name | An investigation of the effects of consuming oatcakes containing 4 g of oat beta‐glucan on physiological parameters in individuals at risk of developing metabolic syndrome |
| Methods | Intervention study, double‐blind, parallel assignment |
| Participants | ‐ |
| Interventions | The effects of beta‐glucan enriched oatcake consumption on metabolic disease risk factors |
| Outcomes |
Secondary outcome measures: Blood pressure [ Time Frame: 6 weeks ] |
| Starting date | ‐ |
| Contact information | Suzanne Zaremba, Queen Margaret University |
| Notes | 6‐week intervention only proposed ‐ monitor |
| Study name | ‐ |
| Methods | RCT non‐blinded, cross‐over design |
| Participants | South Indian adults Inclusion: age 25 to 65 years, BMI >= 23 kg/m2, waist >= 90 cm in men or >= 80 cm in women, daily rice intake >= 100 g/day Exclusion: fasting glucose >= 126 mg/dL, postprandial glucose >= 200 mg/dL, having any chronic disease |
| Interventions | Brown rice vs white rice |
| Outcomes | Anthropometrics, glucose profile, lipid profile, blood pressure, dietary intake, and physical activity |
| Starting date | ‐ |
| Contact information | |
| Notes |
BMI: body mass index
HDL: high‐density lipoprotein
RCT: randomised controlled trial
Data and analyses
| Outcome or subgroup title | No. of studies | No. of participants | Statistical method | Effect size |
| 1.1 Body weight change (kg) Show forest plot | 5 | 439 | Mean Difference (IV, Fixed, 95% CI) | ‐0.41 [‐1.04, 0.23] |
| Analysis 1.1  Comparison 1: Whole grain versus control, Outcome 1: Body weight change (kg) | ||||
| 1.2 BMI change Show forest plot | 5 | 516 | Mean Difference (IV, Fixed, 95% CI) | ‐0.12 [‐0.24, 0.01] |
| Analysis 1.2  Comparison 1: Whole grain versus control, Outcome 2: BMI change | ||||
| 1.3 Total cholesterol change (mmol/L) Show forest plot | 7 | 722 | Mean Difference (IV, Fixed, 95% CI) | 0.07 [‐0.07, 0.21] |
| Analysis 1.3  Comparison 1: Whole grain versus control, Outcome 3: Total cholesterol change (mmol/L) | ||||
| 1.4 LDL cholesterol change (mmol/L) Show forest plot | 8 | 770 | Mean Difference (IV, Fixed, 95% CI) | 0.06 [‐0.05, 0.16] |
| Analysis 1.4  Comparison 1: Whole grain versus control, Outcome 4: LDL cholesterol change (mmol/L) | ||||
| 1.5 HDL cholesterol change (mmol/L) Show forest plot | 8 | 772 | Mean Difference (IV, Fixed, 95% CI) | ‐0.02 [‐0.05, 0.01] |
| Analysis 1.5  Comparison 1: Whole grain versus control, Outcome 5: HDL cholesterol change (mmol/L) | ||||
| 1.6 Triglycerides change (mmol/L) Show forest plot | 8 | 771 | Mean Difference (IV, Fixed, 95% CI) | 0.03 [‐0.08, 0.13] |
| Analysis 1.6  Comparison 1: Whole grain versus control, Outcome 6: Triglycerides change (mmol/L) | ||||
| 1.7 Systolic blood pressure change (mmHg) Show forest plot | 8 | 768 | Mean Difference (IV, Fixed, 95% CI) | 0.04 [‐1.67, 1.75] |
| Analysis 1.7  Comparison 1: Whole grain versus control, Outcome 7: Systolic blood pressure change (mmHg) | ||||
| 1.8 Diastolic blood pressure (mmHg) Show forest plot | 8 | 768 | Mean Difference (IV, Fixed, 95% CI) | 0.16 [‐0.89, 1.21] |
| Analysis 1.8  Comparison 1: Whole grain versus control, Outcome 8: Diastolic blood pressure (mmHg) | ||||
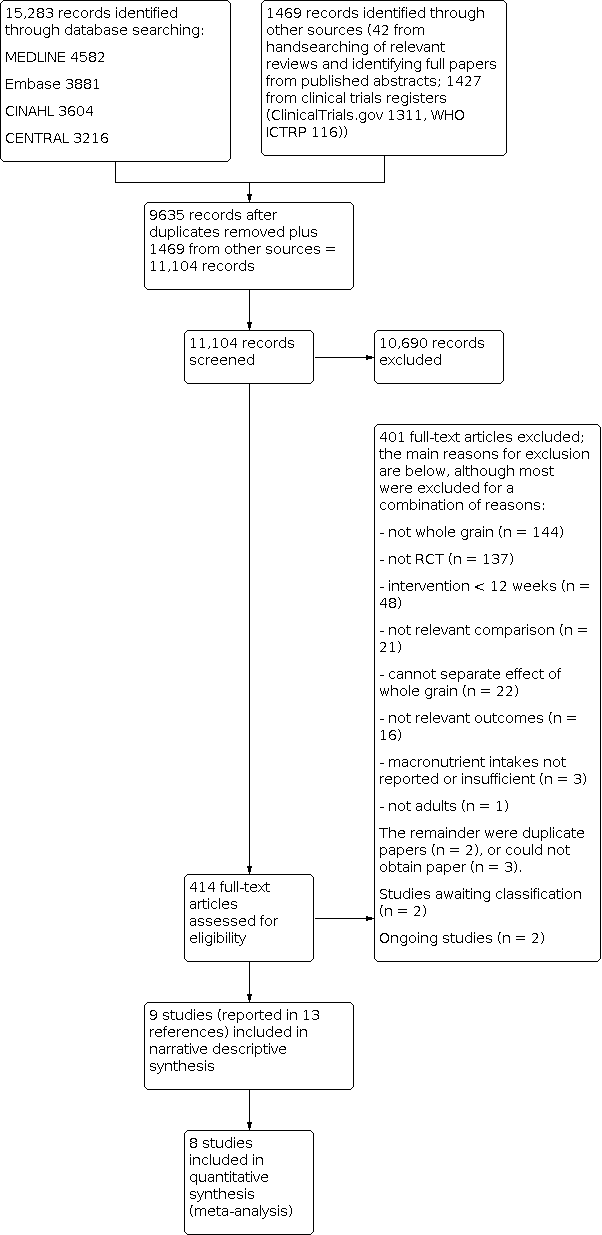
Study flow diagram for updated searches 2016.

Risk of bias graph: review authors' judgements about each risk of bias item presented as percentages across all included studies.

Risk of bias summary: review authors' judgements about each risk of bias item for each included study.

Comparison 1: Whole grain versus control, Outcome 1: Body weight change (kg)

Comparison 1: Whole grain versus control, Outcome 2: BMI change

Comparison 1: Whole grain versus control, Outcome 3: Total cholesterol change (mmol/L)

Comparison 1: Whole grain versus control, Outcome 4: LDL cholesterol change (mmol/L)

Comparison 1: Whole grain versus control, Outcome 5: HDL cholesterol change (mmol/L)

Comparison 1: Whole grain versus control, Outcome 6: Triglycerides change (mmol/L)

Comparison 1: Whole grain versus control, Outcome 7: Systolic blood pressure change (mmHg)

Comparison 1: Whole grain versus control, Outcome 8: Diastolic blood pressure (mmHg)
| Whole grain cereals for the primary prevention of cardiovascular disease (no studies were available to examine secondary prevention) | ||||||
| Patient or population: Free‐living adults who were healthy, had established cardiovascular disease or risk factors for cardiovascular disease Control: Refined grains or lower levels of wholegrain | ||||||
| Outcomes | Illustrative comparative risks (95% CI) | Relative effect | No. of participants | Quality of the evidence | Comments | |
|---|---|---|---|---|---|---|
| Assumed risk | Corresponding risk | |||||
| Refined grains or lower levels of whole grain dietary intake | Refined grains or higher levels of whole grain dietary intake | |||||
| Total cardiovascular mortality | See comment | See comment | See comment | See comment | See comment | No trials reported total CVD mortality for the primary prevention of CVD. |
| Fatal and non‐fatal myocardial infarction | See comment | See comment | See comment | See comment | See comment | No trials reported total myocardial infarction for the primary prevention of CVD. |
| Unstable angina | See comment | See comment | See comment | See comment | See comment | No trials reported unstable angina for the primary prevention of CVD. |
| Coronary artery bypass graft surgery | See comment | See comment | See comment | See comment | See comment | No trials reported coronary artery bypass graft surgery for the primary prevention of CVD. |
| Percutaneous transluminal coronary angioplasty | See comment | See comment | See comment | See comment | See comment | No trials reported percutaneous transluminal coronary angioplasty for the primary prevention of CVD. |
| Stroke | See comment | See comment | See comment | See comment | See comment | No trials reported total stroke for the primary prevention of CVD. |
| Total cholesterol change (mmol/L) Follow‐up: 12 to 16 weeks | The mean total cholesterol change ranged across lower levels of whole grain dietary intake groups from ‐0.4 to 0.3. | The mean total cholesterol change (mmol/L) in the intervention groups was 0.07 higher | ‐ | 722 | ⊕⊕⊝⊝ | See Appendix 1 for total cholesterol change checklist. |
| Abbreviations: CI: confidence interval; CVD: cardiovascular disease | ||||||
| GRADE Working Group grades of evidence | ||||||
| 1The term 'whole grain' includes foods based on milled whole grains, such as wholemeal or oatmeal. | ||||||
| Study ID | Dietary component | Whole grain | Control | P value |
|---|---|---|---|---|
| Energy (kJ/day) | Baseline: Not reported Data are change from baseline. Intervention 1 (lower WG) Wk 8: 379 (SD/SEM NR) Wk 16: 387 (SD/SEM NR) Intervention 2 (higher WG) Wk 8: ‐399 (SD/SEM NR) Wk 16: 587 (SD/SEM NR) | Baseline: Not reported Data are change from baseline. Wk 8: ‐430 (SD/SEM NR) Wk 16: ‐679 (SD/SEM NR) | Intervention 1 (lower WG) Wk 8: 0.015 Wk 16: NS Intervention 2 (higher WG) Wk 8: 0.32 Wk 16: 0.005 | |
| Carbohydrate (g/day) | Baseline: Not reported Data are change from baseline. Intervention 1 (lower WG) Wk 8: 22.6 (SD/SEM NR) Wk 16: 37.1 (SD/SEM NR) Intervention 2 (higher WG) Wk 8: 14.8 (SD/SEM NR) Wk 16: 53.8 (SD/SEM NR) | Baseline: Not reported Data are change from baseline. Wk 8: ‐1.97 (SD/SEM NR) Wk 16: ‐14.8 (SD/SEM NR) | Intervention 1 (lower WG) 0.004 0.007 Intervention 2 (higher WG) 0.026 < 0.001 | |
| Fat (g/day) | Baseline: Not reported Data are change from baseline. Intervention 1 (lower WG) Wk 8: 0.245 (SD/SEM NR) Wk 16: ‐2.96 (SD/SEM NR) Intervention 2 (higher WG) Wk 8: ‐8.12 (SD/SEM NR) Wk 16: ‐1.63 (SD/SEM NR) | Baseline: Not reported Data are change from baseline. Wk 8: ‐2.87 (SD/SEM NR) Wk 16: ‐4.05 (SD/SEM NR) | Intervention 1 (lower WG) NS NS Intervention 2 (higher WG) NS NS | |
| Protein (g/day) | Baseline: Not reported Data are change from baseline. Intervention 1 (lower WG) Wk 8: 6.15 (SD/SEM NR) Wk 16: 5.05 (SD/SEM NR) Intervention 2 (higher WG) Wk 8: 1.75 (SD/SEM NR) Wk 16: 6.99 (SD/SEM NR) | Baseline: Not reported Data are change from baseline. Wk 8: ‐3.17 (SD/SEM NR) Wk 16: ‐4.25 (SD/SEM NR) | Intervention 1 (lower WG) NS NS Intervention 2 (higher WG) NS NS | |
| NSP/fibre (g/day) | Baseline: Not reported Data are change from baseline. Intervention 1 (lower WG) Wk 8: 4.69 (SD/SEM NR) Wk 16: 5.70 (SD/SEM NR) Intervention 2 (higher WG) Wk 8: 6.23 (SD/SEM NR) Wk 16: 11.0 (SD/SEM NR) | Baseline: Not reported Data are change from baseline. Wk 8: ‐0.144 (SD/SEM NR) Wk 16: ‐0.438 (SD/SEM NR) | Intervention 1 (lower WG) < 0.001 < 0.001 Intervention 2 (higher WG) < 0.001 < 0.001 | |
| Whole grain (g/day) | Working definition of whole grain product: commercially available whole grain products readily available in the UK, ranging from 34 to 80.8 g/100 g dry weight or 11.2 g cooked weight of whole grain Data approximated from graph; SD/SEM not available. Intervention 1 (lower WG) (mean intake g/day) Wk 8: 75 Wk 16: 70 Intervention 2 (higher WG) (mean intake g/day) Wk 8: 80 Wk 16: 115 | Data taken from graph; SD/SEM not available. < 20 g/day (mean intake g/day) | NR NR | |
| Energy (kilocalories/day) | Baseline: 1702 (SEM 62) Wk 12: 1900 (SEM 57) | Baseline: 1719 (SEM 63) Wk 12: 1965 (SEM 57) | NR NS | |
| Carbohydrate (% E) | Baseline: 46 (SEM 0.6) Wk 12: 48 (SEM 0.6) | Baseline: 48 (SEM 0.7) Wk 12: 49 (SEM 0.6) | NR NS | |
| Fat (% E) | Baseline: 33.5 (SEM 0.6) Wk 12: 31 (SEM 0.7) | Baseline: 31.8 (SEM 0.6) Wk 12: 30.8 (SEM 0.7) | NR NS | |
| Protein (% E) | Baseline: 18 (SEM 0.4) Wk 12: 18.7 (SEM 0.3) | Baseline: 18 (SEM 0.4) Wk 12: 17.8 (SEM 0.3) | NR < 0.05 | |
| Fibre (g/day) | Total fibre Baseline: 22.7 (SEM 0.8) Wk 12: 32.6 (SEM 0.7) Cereal fibre Baseline: 11.9 (SEM 0.8) Wk 12: 24.3 (SEM 0.9) | Total fibre Baseline: 21.6 (SEM 0.8) Wk 12: 19.8 (SEM 0.7) Cereal fibre Baseline: 11.4 (SEM 0.6) Wk 12: 10.4 (SEM 0.3) | NR < 0.05 NR < 0.05 | |
| Whole grain (g/day) Whole grain level (plasma total alkylresorcinol concentration nmol/L) | Study states that Working definition of whole grain: 51% whole grain per day, dry weight was used according to HealthGrain forum definition and analysis of whole grain but no data reported for wholegrain levels. However plasma total alkylresorcinol as a proxy for wholegrain content was reported as below: | NR ‐19.7 (n = 26) | NR 88.3 (n = 28) | |
| Energy (kilocalories/day) | Calculated from menus. All food provided. 86% compliance reported. Mean/day 2079 | Mean/day 2023 | NR | |
| Carbohydrate (g/day) | 299 | 280 | NR | |
| Fat (g/day) | 62 | 64 | NR | |
| Protein (g/day) | 97 | 90 | NR | |
| Fibre (g/day) | 38 | 22 | NR | |
| Whole grain (g/day) | Working definition of whole grain: whole grain products made from milled flour were required to have > 51% of dry weight from whole grain flour. When possible, whole grain products with the 100% whole grain stamp were selected, which indicated that each grain serving contained at least 16 g whole grain and used 100% whole grain flour. Whole grain content of diets ranged from 163 to 301 g/day, as energy content of diets were adjusted for individual requirements. Energy of diets was 1600 to 3600 kilocalories/day. Based on energy intake of 2100 kilocalories/day, typical whole grains supplied were 187 g/day (7 servings/day). | 0 servings/day 0 g/day | NR NR | |
| Energy (kilocalories/day) | Baseline: 1967 (SD 545) Wk 4: 1812 (SD 505) Wk 8: 1744 (SD 533) Wk 12: 1611 (SD 377) | Baseline: 2265 (SD 744) Wk 4: 1616 (SD 468) Wk 8: 1562 (SD 398) Wk 12: 1575 (SD 500) | NS | |
| Carbohydrate (% E) | Baseline: 47.8 (SD 8.3) Wk 4: 54.0 (SD 7.1) Wk 8: 53.9 (SD 9.1) Wk 12: 54.6 (SD 6.8) | Baseline: 47.5 (SD 8.7) Wk 4: 49.6 (SD 10.7) Wk 8: 47.5 (SD 10.2) Wk 12: 49.9 (SD 9.7) | NS | |
| Fat (% E) | Baseline: 35.4 (SD 5.9) Wk 4: 28.7 (SD 6.6) Wk 8: 29.6 (SD 7.2) Wk 12: 27.8 (SD 6.9) | Baseline: 36.2 (SD 6.8) Wk 4: 32.3 (SD 8.4) Wk 8: 33.8 (SD 8.5) Wk 12: 30.5 (SD 8.0) | NS | |
| Protein (% E) | Baseline: 16.9 (SD 3.2) Wk 4: 18.2 (SD 2.7) Wk 8: 18.4 (SD 3.4) Wk 12: 19.1 (SD 4.3) | Baseline: 16.5 (SD 3.2) Wk 4: 18.7 (SD 4.5) Wk 8: 19.2 (SD 4.8) Wk 12: 20.0 (SD 4.8) | NS | |
| Fibre (g/1000 kilocalories) | Baseline: 8.6 (SD 3.7) Wk 4: 12.6 (SD 3.2) Wk 8: 13.3 (SD 3.4) Wk 12: 12.9 (SD 2.2) | Baseline: 9.1 (SD 3.7) Wk 4: 10.0 (SD 3.0) Wk 8: 9.5 (SD 2.0) Wk 12: 9.7 (SD 3.5) | Significant difference between WG and RG at wks 8 and 12 (P < 0.05) | |
| Whole grain (g/day) | Definition of whole grain product: "grain product was identified as a wholegrain if a wholegrain was listed as the first ingredient on the food label". Data taken from graph so approximate: 1 serving whole grain equivalent to 1 slice wholemeal bread, or 28 g (1 oz ready‐to‐eat cereal), or 1/2 cup cooked cereal, rice, or pasta (2005 dietary guidelines for Americans). Baseline: 1.5 servings/day Wk 12: 5 servings/day | Baseline: ~1.5 servings/day Week 12: 0.2 servings/day | NR | |
| Energy (kJ/day) | Wks 1 to 6: 5830 (SEM 190) Wks 7 to 12: 6060 (SEM 150) | Wks 1 to 6: 5900 (SEM 280) Wks 7 to 12: 6330 (SEM 180) | NR NR | |
| Carbohydrate (g/day) | 86.8 | 95.8 | NR | |
| Fat (g/day) | 6.8 | 6.6 | NR | |
| Protein (g/day) | 16.6 | 16.0 | NR | |
| Fibre (g/day) | 11.0 | 4.5 | NR | |
| Whole grain (g/day) Alkylresorcinol (mg/day) | Working definition of whole grain: mean whole grain intake: 105 g/day 25.5 | Mean whole grain intake: 0 g/day AR: 3.1 | NR | |
| Energy (kJ/day) | Baseline: 6995 ± 2373 Wk 12: 7654 ± 2395 | Baseline: 7282 ± 2011 Wk 12: 8533 ± 1693 | 0.119 | |
| Carbohydrate (% E/day) | Baseline: 45.6 ± 6.3 Wk 12: 47.2 ± 7.5 | Baseline: 47.8 ± 5.6 Wk 12: 47.3 ± 5.1 | 0.268 | |
| Fat (% E/day) | Baseline: 33.6 ± 5.2 Wk 12: 3 ± 6.3 | Baseline: 31.3 ± 5.3 Wk 12: 31.9 ± 5.9 | 0.012 | |
| Protein (% E/day) | Baseline: 19.1 ± 3.2 Wk 12: 18.8 ± 2.5 | Baseline: 18.8 ± 3.7 Wk 12: 18.3 ± 2.5 | 0.950 | |
| Fibre (g/day) | Baseline: 24.6 ± 7.0 Wk 12: 26.5 ± 5.4 | Baseline: 22.5 ± 7.0 Wk 12: 18.0 ± 4.2 | 2.7x10⁷ | |
| Whole grain (g/day) | Working definition of whole grain: whole grain breads and a bread with low glycaemic index products covered 20% to 25% of total energy intake and were delivered to the participants. The fibre contents of the breads were 6.9% (endosperm rye bread), 6.4% (whole grain wheat bread), and 10% to 14% (commercial whole grain rye breads). Wholemeal pasta. | Refined wheat breads and other cereal products with low fibre. Participants were allowed to eat maximum of 1 to 2 portions of rye products per day. | ‐ | |
| Energy (kilocalories/day) | Baseline: 1939 (SEM 97) Wk 4: 1563 (SEM 50) Wk 12: 1529 (SEM 44) | Baseline: 1853 (SEM 70) Wk 4: 1395 (SEM 44) Wk 12: 1443 (SEM 45) | 0.690 0.009 0.256 | |
| Carbohydrate (% E) | Baseline: 44.8 (SEM 0.9) Wk 4: 50.6 (SEM 0.9) Wk 12: 52.2 (SEM 0.9) | Baseline: 45.6 (SEM 1.2) Wk 4: 49.8 (SEM 1.0) Wk 12: 49.8 (SEM 1.0) | 0.660 0.625 0.017 | |
| Total fat (% E) | Baseline: 36.9 (SEM 0.8) Wk 4: 30.4 (SEM 0.9) Wk 12: 29.6 (SEM 0.8) | Baseline: 35.6 (SEM 0.8) Wk 4: 30.0 (SEM 0.8) Wk 12: 29.8 (SEM 0.7) | 0.297 0.697 0.718 | |
| Protein (% E) | Baseline: 18.2 (SEM 0.5) Wk 4: 20.1 (SEM 0.5) Wk 12: 19.7 (SEM 0.5) | Baseline: 17.9 (SEM 0.6) Wk 4: 20.0 (SEM 0.6) Wk 12: 20.1 (SEM 0.6) | 0.330 0.971 0.623 | |
| Fibre (g/day) | Baseline: 15.8 (SEM 1.0) Wk 4: 21.0 (SEM 0.5) Wk 12: 21.7 (SEM 0.5) | Baseline: 14.8 (SEM 0.8) Wk 4: 11.8 (SEM 0.6) Wk 12: 12.7 (SEM 0.6) | 0.612 < 0.001 < 0.001 | |
| Whole grain (g/day) | Working definition of whole grain: the whole grain used was a whole grain oat ready‐to‐eat cereal (Cheerios, General Mills, Minneapolis, MN), 2 portions per day (approximately 80 g/day), containing equivalent of 3 g oat β‐glucan. | ‐ | ‐ | |
| Energy (kilocalories/day) | Whole grain wheat group Baseline: 2115 (SEM 64) Wk 12: 2121 (SEM 75) Whole grain wheat + oats group Baseline: 2115 (SEM 58) Wk 12: 2142 (SEM 69) | Baseline: 2036 (SEM 79) Wk 12: 2080 (SEM 83) | Baseline: 0.650 Wk 12: 0.843 | |
| Carbohydrate (g/day) | Whole grain wheat group Baseline: 256 (SEM 9) Wk 12: 253 (SEM 9) Whole grain wheat + oats group Baseline: 252 (SEM 7) Wk 12: 243 (SEM 8) | Baseline: 238 (SEM 10) Wk 12: 245 (SEM 10) | Baseline: 0.324 Wk 12: 0.633 | |
| Fat (g/day) | Whole grain wheat group Baseline: 80.8 (SEM 2.8) Wk 12: 79.7 (SEM 3.3) Whole grain wheat + oats group Baseline: 78.6 (SEM 2.9) Wk 12: 82.1 (SEM 3.5) | Baseline: 78.7 (SEM 3.6) Wk 12: 79.9 (SEM 4.3) | Baseline: 0.847 Wk 12: 0.871 | |
| Protein (g/day) | Whole grain wheat group Baseline: 85.2 (SEM 3.0) Wk 12: 89.1 (SEM 3.5) Whole grain wheat + oats group Baseline: 83.1 (SEM 2.4) Wk 12: 87.0 (SEM 2.8) | Baseline: 81.3 (SEM 2.9) Wk 12: 84.0 (SEM 2.4) | Baseline: 0.627 Wk 12: 0.496 | |
| Fibre (NSP) (g/day) | Whole grain wheat group Baseline: 12.3 (SEM 0.4) Wk 12: 18.5 (SEM 0.5) Whole grain wheat + oats group Baseline: 12.4 (SEM 0.4) Wk 12: 16.8 (SEM 0.5) | Baseline: 10.9 (SEM 0.5) Wk 12: 11.3 (SEM 0.4) | Baseline: 0.049 Wk 12: < 0.001 | |
| Whole grain (g/day) | Working definition of whole grain: not reported Whole grain wheat group 3 servings whole grain foods: 70 to 80 g wholemeal bread and 30 to 40 g whole grain cereals/day Whole grain wheat + oats group 3 servings whole grain foods: 1 serving whole grain wheat products and 2 servings whole grain oat foods/day | ‐ | ‐ | |
| Energy (MJ/day) | Brown rice Baseline: 8.72 (SD 2.30) Wk 4: 8.31 (SD 1.75) Wk 8: 8.05 (SD 1.89) Wk 12: 8.00 (SD 1.86) Wk 16: 8.22 (SD 1.80) | White rice Baseline: 8.65 (SD 2.38) Wk 4: 8.16 (SD 2.23) Wk 8: 8.25 (SD 2.01) Wk 12: 8.46 (SD 2.04) Wk 16: 8.60 (SD 2.01) | ‐ | |
| Carbohydrate (% E) | Brown rice Baseline: 53.9 (SD 7.3) Wk 4: 53.3 (SD 6.5) Wk 8: 52.9 (SD 5.5) Wk 12: 51.8 (SD 7.0) Wk 16: 51.6 (SD 7.3) | White rice Baseline: 54.9 (SD 7.2) Wk 4: 51.8 (SD 6.4) Wk 8: 53.8 (SD 6.3) Wk 12: 52.8 (SD 5.8) Wk 16: 53.3 (SD 6.8) | ‐ | |
| Fat (% E) | Brown rice Baseline: 32.5 (SD 6.7) Wk 4: 32.3 (SD 5.9) Wk 8: 33.0 (SD 4.5) Wk 12: 34.2 (SD 6.4) Wk 16: 35.0 (SD 6.4) | White rice Baseline: 31.7 (SD 6.4) Wk 4: 33.1 (SD 6.2) Wk 8: 31.5 (SD 5.8) Wk 12: 32.7 (SD 5.7) Wk 16: 32.7 (SD 6.6) | ‐ | |
| Protein (% E) | Brown rice Baseline: 15.8 (SD 2.8) Wk 4: 17.2 (SD 2.8) Wk 8: 17.0 (SD 3.1) Wk 12: 16.8 (SD 2.7) Wk 16: 16.1 (SD 2.8) | White rice Baseline: 15.7 (SD 2.7) Wk 4: 17.4 (SD 2.8) Wk 8: 17.0 (SD 2.7) Wk 12: 16.7 (SD 2.4) Wk 16: 16.0 (SD 2.2) | ‐ | |
| Fibre (g/1000 kJ) | Brown rice Baseline: 1.34 (SD 0.49) Wk 4: 1.65 (SD 0.40) Wk 8: 1.69 (SD 0.42) Wk 12: 1.64 (SD 0.42) Wk 16: 1.57 (SD 0.51) | White rice Baseline: 1.32 (SD 0.38) Wk 4: 1.34 (SD 0.42) Wk 8: 1.37 (SD 0.49) Wk 12: 1.28 (SD 0.39) Wk 16: 1.20 (SD 0.39) | ‐ | |
| Whole grain (g/day) | Authors stated that the brown rice was a whole grain in the paper, and Table 1 of the paper reports nutrient comparison of the brown rice versus the white rice used in the study. | ‐ | ‐ | |
| % E: percentage energy | ||||
| Outcome or subgroup title | No. of studies | No. of participants | Statistical method | Effect size |
| 1.1 Body weight change (kg) Show forest plot | 5 | 439 | Mean Difference (IV, Fixed, 95% CI) | ‐0.41 [‐1.04, 0.23] |
| 1.2 BMI change Show forest plot | 5 | 516 | Mean Difference (IV, Fixed, 95% CI) | ‐0.12 [‐0.24, 0.01] |
| 1.3 Total cholesterol change (mmol/L) Show forest plot | 7 | 722 | Mean Difference (IV, Fixed, 95% CI) | 0.07 [‐0.07, 0.21] |
| 1.4 LDL cholesterol change (mmol/L) Show forest plot | 8 | 770 | Mean Difference (IV, Fixed, 95% CI) | 0.06 [‐0.05, 0.16] |
| 1.5 HDL cholesterol change (mmol/L) Show forest plot | 8 | 772 | Mean Difference (IV, Fixed, 95% CI) | ‐0.02 [‐0.05, 0.01] |
| 1.6 Triglycerides change (mmol/L) Show forest plot | 8 | 771 | Mean Difference (IV, Fixed, 95% CI) | 0.03 [‐0.08, 0.13] |
| 1.7 Systolic blood pressure change (mmHg) Show forest plot | 8 | 768 | Mean Difference (IV, Fixed, 95% CI) | 0.04 [‐1.67, 1.75] |
| 1.8 Diastolic blood pressure (mmHg) Show forest plot | 8 | 768 | Mean Difference (IV, Fixed, 95% CI) | 0.16 [‐0.89, 1.21] |