Cereales integrales para la prevención primaria o secundaria de las enfermedades cardiovasculares
Información
- DOI:
- https://doi.org/10.1002/14651858.CD005051.pub3Copiar DOI

- Base de datos:
-
- Cochrane Database of Systematic Reviews
- Versión publicada:
-
- 24 agosto 2017see what's new
- Tipo:
-
- Intervention
- Etapa:
-
- Review
- Grupo Editorial Cochrane:
-
Grupo Cochrane de Corazón
- Copyright:
-
- Copyright © 2017 The Cochrane Collaboration. Published by John Wiley & Sons, Ltd.
Cifras del artículo
Altmetric:
Citado por:
Autores
Contributions of authors
SK, LH, CC, RG, HL, and HJ screened titles and abstracts and assessed studies for formal inclusion and exclusion.
SK, LA, EL, and JC abstracted data and assessed methodological rigour.
Analyses were conducted by EL and LA and checked by JC and KR.
SK wrote the first draft of the review, which was updated by EL, KR, LA, and SK.
LA retrieved trial records and conducted GRADE assessment and 'Summary of findings' table, which was checked by SK.
GF critically read the final draft.
Sources of support
Internal sources
-
Warwick Medical School, University of Warwick, UK
-
University of Teesside, Middlesbrough, UK
Supported the original version of the review
-
Hammersmith Hospital, UK
Supported the original version of the review
External sources
-
NIHR Cochrane Programme Grant, UK
-
Lena Al‐Khudairy and Helen M Jones are supported by the National Institute for Health Research (NIHR) Collaboration for Leadership in Applied Health Research and Care West Midlands at University Hospitals Birmingham NHS Foundation Trust, UK
Declarations of interest
SK: None known.
LH: None known.
EL: None known.
JC: None known.
HJ: None known.
LA: None known.
CC: None known.
RG: None known.
HL: None known.
GF: None of the relationships described are felt to be a conflict of interest regarding this publication. Consultancy for appetite regulation with Unilever; grant application to Nestle on modified cereal fibre and glycaemic control (awaiting outcome); patent on compounds and their effects on appetite control and insulin sensitivity (WO2014020344 A1).
KR: None known.
Acknowledgements
Current update
We are grateful to Nicole Martin for conducting the searches for this review. With thanks also to Dr Frank Thies for providing additional data for the trial on which he was an author (Tighe 2010‐W; Tighe 2010‐WO).
Previous versions of this review
Margaret Burke, Cochrane Heart Group for advice on the search strategy and for assistance with translation of a paper.
Lone Gale for assistance with translation of a paper.
We acknowledge the contribution of Carolyn Summerbell, Audrey Brynes, and Victoria Whittaker to the previous versions of this review.
Version history
| Published | Title | Stage | Authors | Version |
| 2017 Aug 24 | Whole grain cereals for the primary or secondary prevention of cardiovascular disease | Review | Sarah AM Kelly, Louise Hartley, Emma Loveman, Jill L Colquitt, Helen M Jones, Lena Al-Khudairy, Christine Clar, Roberta Germanò, Hannah R Lunn, Gary Frost, Karen Rees | |
| 2007 Apr 18 | Wholegrain cereals for coronary heart disease | Review | Sarah AM Kelly, Carolyn D Summerbell, Audrey Brynes, Victoria Whittaker, Gary Frost | |
| 2004 Oct 18 | Wholegrain cereals for coronary heart disease | Protocol | Sarah A.M. Kelly, Audrey Brynes, Gary Frost, Rebecca Lang, Vicki Whittaker, Carolyn D Summerbell | |
Differences between protocol and review
We expanded the inclusion criteria for this review to include the primary and secondary prevention of coronary heart disease. Since the last update of this review in 2007, a separate Cochrane Review has been published focusing on the effects of whole grain foods for the prevention of type 2 diabetes mellitus (Priebe 2008). Hence, we excluded studies with diabetes as an outcome or changes in related risk factors including impaired glucose tolerance, insulin resistance or sensitivity, glucose or insulin outcomes. We excluded studies reporting weight, body mass index, and other anthropometric outcomes if they did not also measure lipids or blood pressure. As more trials are currently available, we have excluded short‐term studies and included only those of at least 12 weeks' duration. We specified an eligible participant age of inclusion of 18 years or older (previously ≥ 16 years).
Keywords
MeSH
Medical Subject Headings (MeSH) Keywords
Medical Subject Headings Check Words
Adult; Aged; Humans; Middle Aged;
PICO
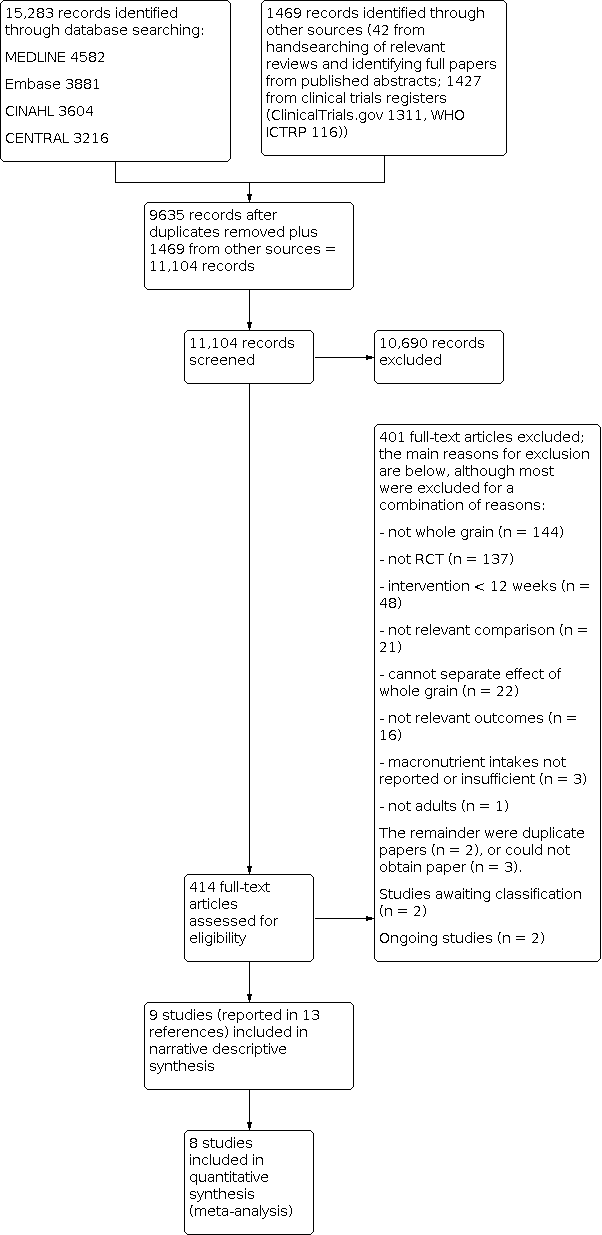
Study flow diagram for updated searches 2016.

Risk of bias graph: review authors' judgements about each risk of bias item presented as percentages across all included studies.

Risk of bias summary: review authors' judgements about each risk of bias item for each included study.

Comparison 1: Whole grain versus control, Outcome 1: Body weight change (kg)

Comparison 1: Whole grain versus control, Outcome 2: BMI change

Comparison 1: Whole grain versus control, Outcome 3: Total cholesterol change (mmol/L)

Comparison 1: Whole grain versus control, Outcome 4: LDL cholesterol change (mmol/L)

Comparison 1: Whole grain versus control, Outcome 5: HDL cholesterol change (mmol/L)

Comparison 1: Whole grain versus control, Outcome 6: Triglycerides change (mmol/L)

Comparison 1: Whole grain versus control, Outcome 7: Systolic blood pressure change (mmHg)

Comparison 1: Whole grain versus control, Outcome 8: Diastolic blood pressure (mmHg)
| Whole grain cereals for the primary prevention of cardiovascular disease (no studies were available to examine secondary prevention) | ||||||
| Patient or population: Free‐living adults who were healthy, had established cardiovascular disease or risk factors for cardiovascular disease Control: Refined grains or lower levels of wholegrain | ||||||
| Outcomes | Illustrative comparative risks (95% CI) | Relative effect | No. of participants | Quality of the evidence | Comments | |
|---|---|---|---|---|---|---|
| Assumed risk | Corresponding risk | |||||
| Refined grains or lower levels of whole grain dietary intake | Refined grains or higher levels of whole grain dietary intake | |||||
| Total cardiovascular mortality | See comment | See comment | See comment | See comment | See comment | No trials reported total CVD mortality for the primary prevention of CVD. |
| Fatal and non‐fatal myocardial infarction | See comment | See comment | See comment | See comment | See comment | No trials reported total myocardial infarction for the primary prevention of CVD. |
| Unstable angina | See comment | See comment | See comment | See comment | See comment | No trials reported unstable angina for the primary prevention of CVD. |
| Coronary artery bypass graft surgery | See comment | See comment | See comment | See comment | See comment | No trials reported coronary artery bypass graft surgery for the primary prevention of CVD. |
| Percutaneous transluminal coronary angioplasty | See comment | See comment | See comment | See comment | See comment | No trials reported percutaneous transluminal coronary angioplasty for the primary prevention of CVD. |
| Stroke | See comment | See comment | See comment | See comment | See comment | No trials reported total stroke for the primary prevention of CVD. |
| Total cholesterol change (mmol/L) Follow‐up: 12 to 16 weeks | The mean total cholesterol change ranged across lower levels of whole grain dietary intake groups from ‐0.4 to 0.3. | The mean total cholesterol change (mmol/L) in the intervention groups was 0.07 higher | ‐ | 722 | ⊕⊕⊝⊝ | See Appendix 1 for total cholesterol change checklist. |
| Abbreviations: CI: confidence interval; CVD: cardiovascular disease | ||||||
| GRADE Working Group grades of evidence | ||||||
| 1The term 'whole grain' includes foods based on milled whole grains, such as wholemeal or oatmeal. | ||||||
| Study ID | Dietary component | Whole grain | Control | P value |
|---|---|---|---|---|
| Energy (kJ/day) | Baseline: Not reported Data are change from baseline. Intervention 1 (lower WG) Wk 8: 379 (SD/SEM NR) Wk 16: 387 (SD/SEM NR) Intervention 2 (higher WG) Wk 8: ‐399 (SD/SEM NR) Wk 16: 587 (SD/SEM NR) | Baseline: Not reported Data are change from baseline. Wk 8: ‐430 (SD/SEM NR) Wk 16: ‐679 (SD/SEM NR) | Intervention 1 (lower WG) Wk 8: 0.015 Wk 16: NS Intervention 2 (higher WG) Wk 8: 0.32 Wk 16: 0.005 | |
| Carbohydrate (g/day) | Baseline: Not reported Data are change from baseline. Intervention 1 (lower WG) Wk 8: 22.6 (SD/SEM NR) Wk 16: 37.1 (SD/SEM NR) Intervention 2 (higher WG) Wk 8: 14.8 (SD/SEM NR) Wk 16: 53.8 (SD/SEM NR) | Baseline: Not reported Data are change from baseline. Wk 8: ‐1.97 (SD/SEM NR) Wk 16: ‐14.8 (SD/SEM NR) | Intervention 1 (lower WG) 0.004 0.007 Intervention 2 (higher WG) 0.026 < 0.001 | |
| Fat (g/day) | Baseline: Not reported Data are change from baseline. Intervention 1 (lower WG) Wk 8: 0.245 (SD/SEM NR) Wk 16: ‐2.96 (SD/SEM NR) Intervention 2 (higher WG) Wk 8: ‐8.12 (SD/SEM NR) Wk 16: ‐1.63 (SD/SEM NR) | Baseline: Not reported Data are change from baseline. Wk 8: ‐2.87 (SD/SEM NR) Wk 16: ‐4.05 (SD/SEM NR) | Intervention 1 (lower WG) NS NS Intervention 2 (higher WG) NS NS | |
| Protein (g/day) | Baseline: Not reported Data are change from baseline. Intervention 1 (lower WG) Wk 8: 6.15 (SD/SEM NR) Wk 16: 5.05 (SD/SEM NR) Intervention 2 (higher WG) Wk 8: 1.75 (SD/SEM NR) Wk 16: 6.99 (SD/SEM NR) | Baseline: Not reported Data are change from baseline. Wk 8: ‐3.17 (SD/SEM NR) Wk 16: ‐4.25 (SD/SEM NR) | Intervention 1 (lower WG) NS NS Intervention 2 (higher WG) NS NS | |
| NSP/fibre (g/day) | Baseline: Not reported Data are change from baseline. Intervention 1 (lower WG) Wk 8: 4.69 (SD/SEM NR) Wk 16: 5.70 (SD/SEM NR) Intervention 2 (higher WG) Wk 8: 6.23 (SD/SEM NR) Wk 16: 11.0 (SD/SEM NR) | Baseline: Not reported Data are change from baseline. Wk 8: ‐0.144 (SD/SEM NR) Wk 16: ‐0.438 (SD/SEM NR) | Intervention 1 (lower WG) < 0.001 < 0.001 Intervention 2 (higher WG) < 0.001 < 0.001 | |
| Whole grain (g/day) | Working definition of whole grain product: commercially available whole grain products readily available in the UK, ranging from 34 to 80.8 g/100 g dry weight or 11.2 g cooked weight of whole grain Data approximated from graph; SD/SEM not available. Intervention 1 (lower WG) (mean intake g/day) Wk 8: 75 Wk 16: 70 Intervention 2 (higher WG) (mean intake g/day) Wk 8: 80 Wk 16: 115 | Data taken from graph; SD/SEM not available. < 20 g/day (mean intake g/day) | NR NR | |
| Energy (kilocalories/day) | Baseline: 1702 (SEM 62) Wk 12: 1900 (SEM 57) | Baseline: 1719 (SEM 63) Wk 12: 1965 (SEM 57) | NR NS | |
| Carbohydrate (% E) | Baseline: 46 (SEM 0.6) Wk 12: 48 (SEM 0.6) | Baseline: 48 (SEM 0.7) Wk 12: 49 (SEM 0.6) | NR NS | |
| Fat (% E) | Baseline: 33.5 (SEM 0.6) Wk 12: 31 (SEM 0.7) | Baseline: 31.8 (SEM 0.6) Wk 12: 30.8 (SEM 0.7) | NR NS | |
| Protein (% E) | Baseline: 18 (SEM 0.4) Wk 12: 18.7 (SEM 0.3) | Baseline: 18 (SEM 0.4) Wk 12: 17.8 (SEM 0.3) | NR < 0.05 | |
| Fibre (g/day) | Total fibre Baseline: 22.7 (SEM 0.8) Wk 12: 32.6 (SEM 0.7) Cereal fibre Baseline: 11.9 (SEM 0.8) Wk 12: 24.3 (SEM 0.9) | Total fibre Baseline: 21.6 (SEM 0.8) Wk 12: 19.8 (SEM 0.7) Cereal fibre Baseline: 11.4 (SEM 0.6) Wk 12: 10.4 (SEM 0.3) | NR < 0.05 NR < 0.05 | |
| Whole grain (g/day) Whole grain level (plasma total alkylresorcinol concentration nmol/L) | Study states that Working definition of whole grain: 51% whole grain per day, dry weight was used according to HealthGrain forum definition and analysis of whole grain but no data reported for wholegrain levels. However plasma total alkylresorcinol as a proxy for wholegrain content was reported as below: | NR ‐19.7 (n = 26) | NR 88.3 (n = 28) | |
| Energy (kilocalories/day) | Calculated from menus. All food provided. 86% compliance reported. Mean/day 2079 | Mean/day 2023 | NR | |
| Carbohydrate (g/day) | 299 | 280 | NR | |
| Fat (g/day) | 62 | 64 | NR | |
| Protein (g/day) | 97 | 90 | NR | |
| Fibre (g/day) | 38 | 22 | NR | |
| Whole grain (g/day) | Working definition of whole grain: whole grain products made from milled flour were required to have > 51% of dry weight from whole grain flour. When possible, whole grain products with the 100% whole grain stamp were selected, which indicated that each grain serving contained at least 16 g whole grain and used 100% whole grain flour. Whole grain content of diets ranged from 163 to 301 g/day, as energy content of diets were adjusted for individual requirements. Energy of diets was 1600 to 3600 kilocalories/day. Based on energy intake of 2100 kilocalories/day, typical whole grains supplied were 187 g/day (7 servings/day). | 0 servings/day 0 g/day | NR NR | |
| Energy (kilocalories/day) | Baseline: 1967 (SD 545) Wk 4: 1812 (SD 505) Wk 8: 1744 (SD 533) Wk 12: 1611 (SD 377) | Baseline: 2265 (SD 744) Wk 4: 1616 (SD 468) Wk 8: 1562 (SD 398) Wk 12: 1575 (SD 500) | NS | |
| Carbohydrate (% E) | Baseline: 47.8 (SD 8.3) Wk 4: 54.0 (SD 7.1) Wk 8: 53.9 (SD 9.1) Wk 12: 54.6 (SD 6.8) | Baseline: 47.5 (SD 8.7) Wk 4: 49.6 (SD 10.7) Wk 8: 47.5 (SD 10.2) Wk 12: 49.9 (SD 9.7) | NS | |
| Fat (% E) | Baseline: 35.4 (SD 5.9) Wk 4: 28.7 (SD 6.6) Wk 8: 29.6 (SD 7.2) Wk 12: 27.8 (SD 6.9) | Baseline: 36.2 (SD 6.8) Wk 4: 32.3 (SD 8.4) Wk 8: 33.8 (SD 8.5) Wk 12: 30.5 (SD 8.0) | NS | |
| Protein (% E) | Baseline: 16.9 (SD 3.2) Wk 4: 18.2 (SD 2.7) Wk 8: 18.4 (SD 3.4) Wk 12: 19.1 (SD 4.3) | Baseline: 16.5 (SD 3.2) Wk 4: 18.7 (SD 4.5) Wk 8: 19.2 (SD 4.8) Wk 12: 20.0 (SD 4.8) | NS | |
| Fibre (g/1000 kilocalories) | Baseline: 8.6 (SD 3.7) Wk 4: 12.6 (SD 3.2) Wk 8: 13.3 (SD 3.4) Wk 12: 12.9 (SD 2.2) | Baseline: 9.1 (SD 3.7) Wk 4: 10.0 (SD 3.0) Wk 8: 9.5 (SD 2.0) Wk 12: 9.7 (SD 3.5) | Significant difference between WG and RG at wks 8 and 12 (P < 0.05) | |
| Whole grain (g/day) | Definition of whole grain product: "grain product was identified as a wholegrain if a wholegrain was listed as the first ingredient on the food label". Data taken from graph so approximate: 1 serving whole grain equivalent to 1 slice wholemeal bread, or 28 g (1 oz ready‐to‐eat cereal), or 1/2 cup cooked cereal, rice, or pasta (2005 dietary guidelines for Americans). Baseline: 1.5 servings/day Wk 12: 5 servings/day | Baseline: ~1.5 servings/day Week 12: 0.2 servings/day | NR | |
| Energy (kJ/day) | Wks 1 to 6: 5830 (SEM 190) Wks 7 to 12: 6060 (SEM 150) | Wks 1 to 6: 5900 (SEM 280) Wks 7 to 12: 6330 (SEM 180) | NR NR | |
| Carbohydrate (g/day) | 86.8 | 95.8 | NR | |
| Fat (g/day) | 6.8 | 6.6 | NR | |
| Protein (g/day) | 16.6 | 16.0 | NR | |
| Fibre (g/day) | 11.0 | 4.5 | NR | |
| Whole grain (g/day) Alkylresorcinol (mg/day) | Working definition of whole grain: mean whole grain intake: 105 g/day 25.5 | Mean whole grain intake: 0 g/day AR: 3.1 | NR | |
| Energy (kJ/day) | Baseline: 6995 ± 2373 Wk 12: 7654 ± 2395 | Baseline: 7282 ± 2011 Wk 12: 8533 ± 1693 | 0.119 | |
| Carbohydrate (% E/day) | Baseline: 45.6 ± 6.3 Wk 12: 47.2 ± 7.5 | Baseline: 47.8 ± 5.6 Wk 12: 47.3 ± 5.1 | 0.268 | |
| Fat (% E/day) | Baseline: 33.6 ± 5.2 Wk 12: 3 ± 6.3 | Baseline: 31.3 ± 5.3 Wk 12: 31.9 ± 5.9 | 0.012 | |
| Protein (% E/day) | Baseline: 19.1 ± 3.2 Wk 12: 18.8 ± 2.5 | Baseline: 18.8 ± 3.7 Wk 12: 18.3 ± 2.5 | 0.950 | |
| Fibre (g/day) | Baseline: 24.6 ± 7.0 Wk 12: 26.5 ± 5.4 | Baseline: 22.5 ± 7.0 Wk 12: 18.0 ± 4.2 | 2.7x10⁷ | |
| Whole grain (g/day) | Working definition of whole grain: whole grain breads and a bread with low glycaemic index products covered 20% to 25% of total energy intake and were delivered to the participants. The fibre contents of the breads were 6.9% (endosperm rye bread), 6.4% (whole grain wheat bread), and 10% to 14% (commercial whole grain rye breads). Wholemeal pasta. | Refined wheat breads and other cereal products with low fibre. Participants were allowed to eat maximum of 1 to 2 portions of rye products per day. | ‐ | |
| Energy (kilocalories/day) | Baseline: 1939 (SEM 97) Wk 4: 1563 (SEM 50) Wk 12: 1529 (SEM 44) | Baseline: 1853 (SEM 70) Wk 4: 1395 (SEM 44) Wk 12: 1443 (SEM 45) | 0.690 0.009 0.256 | |
| Carbohydrate (% E) | Baseline: 44.8 (SEM 0.9) Wk 4: 50.6 (SEM 0.9) Wk 12: 52.2 (SEM 0.9) | Baseline: 45.6 (SEM 1.2) Wk 4: 49.8 (SEM 1.0) Wk 12: 49.8 (SEM 1.0) | 0.660 0.625 0.017 | |
| Total fat (% E) | Baseline: 36.9 (SEM 0.8) Wk 4: 30.4 (SEM 0.9) Wk 12: 29.6 (SEM 0.8) | Baseline: 35.6 (SEM 0.8) Wk 4: 30.0 (SEM 0.8) Wk 12: 29.8 (SEM 0.7) | 0.297 0.697 0.718 | |
| Protein (% E) | Baseline: 18.2 (SEM 0.5) Wk 4: 20.1 (SEM 0.5) Wk 12: 19.7 (SEM 0.5) | Baseline: 17.9 (SEM 0.6) Wk 4: 20.0 (SEM 0.6) Wk 12: 20.1 (SEM 0.6) | 0.330 0.971 0.623 | |
| Fibre (g/day) | Baseline: 15.8 (SEM 1.0) Wk 4: 21.0 (SEM 0.5) Wk 12: 21.7 (SEM 0.5) | Baseline: 14.8 (SEM 0.8) Wk 4: 11.8 (SEM 0.6) Wk 12: 12.7 (SEM 0.6) | 0.612 < 0.001 < 0.001 | |
| Whole grain (g/day) | Working definition of whole grain: the whole grain used was a whole grain oat ready‐to‐eat cereal (Cheerios, General Mills, Minneapolis, MN), 2 portions per day (approximately 80 g/day), containing equivalent of 3 g oat β‐glucan. | ‐ | ‐ | |
| Energy (kilocalories/day) | Whole grain wheat group Baseline: 2115 (SEM 64) Wk 12: 2121 (SEM 75) Whole grain wheat + oats group Baseline: 2115 (SEM 58) Wk 12: 2142 (SEM 69) | Baseline: 2036 (SEM 79) Wk 12: 2080 (SEM 83) | Baseline: 0.650 Wk 12: 0.843 | |
| Carbohydrate (g/day) | Whole grain wheat group Baseline: 256 (SEM 9) Wk 12: 253 (SEM 9) Whole grain wheat + oats group Baseline: 252 (SEM 7) Wk 12: 243 (SEM 8) | Baseline: 238 (SEM 10) Wk 12: 245 (SEM 10) | Baseline: 0.324 Wk 12: 0.633 | |
| Fat (g/day) | Whole grain wheat group Baseline: 80.8 (SEM 2.8) Wk 12: 79.7 (SEM 3.3) Whole grain wheat + oats group Baseline: 78.6 (SEM 2.9) Wk 12: 82.1 (SEM 3.5) | Baseline: 78.7 (SEM 3.6) Wk 12: 79.9 (SEM 4.3) | Baseline: 0.847 Wk 12: 0.871 | |
| Protein (g/day) | Whole grain wheat group Baseline: 85.2 (SEM 3.0) Wk 12: 89.1 (SEM 3.5) Whole grain wheat + oats group Baseline: 83.1 (SEM 2.4) Wk 12: 87.0 (SEM 2.8) | Baseline: 81.3 (SEM 2.9) Wk 12: 84.0 (SEM 2.4) | Baseline: 0.627 Wk 12: 0.496 | |
| Fibre (NSP) (g/day) | Whole grain wheat group Baseline: 12.3 (SEM 0.4) Wk 12: 18.5 (SEM 0.5) Whole grain wheat + oats group Baseline: 12.4 (SEM 0.4) Wk 12: 16.8 (SEM 0.5) | Baseline: 10.9 (SEM 0.5) Wk 12: 11.3 (SEM 0.4) | Baseline: 0.049 Wk 12: < 0.001 | |
| Whole grain (g/day) | Working definition of whole grain: not reported Whole grain wheat group 3 servings whole grain foods: 70 to 80 g wholemeal bread and 30 to 40 g whole grain cereals/day Whole grain wheat + oats group 3 servings whole grain foods: 1 serving whole grain wheat products and 2 servings whole grain oat foods/day | ‐ | ‐ | |
| Energy (MJ/day) | Brown rice Baseline: 8.72 (SD 2.30) Wk 4: 8.31 (SD 1.75) Wk 8: 8.05 (SD 1.89) Wk 12: 8.00 (SD 1.86) Wk 16: 8.22 (SD 1.80) | White rice Baseline: 8.65 (SD 2.38) Wk 4: 8.16 (SD 2.23) Wk 8: 8.25 (SD 2.01) Wk 12: 8.46 (SD 2.04) Wk 16: 8.60 (SD 2.01) | ‐ | |
| Carbohydrate (% E) | Brown rice Baseline: 53.9 (SD 7.3) Wk 4: 53.3 (SD 6.5) Wk 8: 52.9 (SD 5.5) Wk 12: 51.8 (SD 7.0) Wk 16: 51.6 (SD 7.3) | White rice Baseline: 54.9 (SD 7.2) Wk 4: 51.8 (SD 6.4) Wk 8: 53.8 (SD 6.3) Wk 12: 52.8 (SD 5.8) Wk 16: 53.3 (SD 6.8) | ‐ | |
| Fat (% E) | Brown rice Baseline: 32.5 (SD 6.7) Wk 4: 32.3 (SD 5.9) Wk 8: 33.0 (SD 4.5) Wk 12: 34.2 (SD 6.4) Wk 16: 35.0 (SD 6.4) | White rice Baseline: 31.7 (SD 6.4) Wk 4: 33.1 (SD 6.2) Wk 8: 31.5 (SD 5.8) Wk 12: 32.7 (SD 5.7) Wk 16: 32.7 (SD 6.6) | ‐ | |
| Protein (% E) | Brown rice Baseline: 15.8 (SD 2.8) Wk 4: 17.2 (SD 2.8) Wk 8: 17.0 (SD 3.1) Wk 12: 16.8 (SD 2.7) Wk 16: 16.1 (SD 2.8) | White rice Baseline: 15.7 (SD 2.7) Wk 4: 17.4 (SD 2.8) Wk 8: 17.0 (SD 2.7) Wk 12: 16.7 (SD 2.4) Wk 16: 16.0 (SD 2.2) | ‐ | |
| Fibre (g/1000 kJ) | Brown rice Baseline: 1.34 (SD 0.49) Wk 4: 1.65 (SD 0.40) Wk 8: 1.69 (SD 0.42) Wk 12: 1.64 (SD 0.42) Wk 16: 1.57 (SD 0.51) | White rice Baseline: 1.32 (SD 0.38) Wk 4: 1.34 (SD 0.42) Wk 8: 1.37 (SD 0.49) Wk 12: 1.28 (SD 0.39) Wk 16: 1.20 (SD 0.39) | ‐ | |
| Whole grain (g/day) | Authors stated that the brown rice was a whole grain in the paper, and Table 1 of the paper reports nutrient comparison of the brown rice versus the white rice used in the study. | ‐ | ‐ | |
| % E: percentage energy | ||||
| Outcome or subgroup title | No. of studies | No. of participants | Statistical method | Effect size |
| 1.1 Body weight change (kg) Show forest plot | 5 | 439 | Mean Difference (IV, Fixed, 95% CI) | ‐0.41 [‐1.04, 0.23] |
| 1.2 BMI change Show forest plot | 5 | 516 | Mean Difference (IV, Fixed, 95% CI) | ‐0.12 [‐0.24, 0.01] |
| 1.3 Total cholesterol change (mmol/L) Show forest plot | 7 | 722 | Mean Difference (IV, Fixed, 95% CI) | 0.07 [‐0.07, 0.21] |
| 1.4 LDL cholesterol change (mmol/L) Show forest plot | 8 | 770 | Mean Difference (IV, Fixed, 95% CI) | 0.06 [‐0.05, 0.16] |
| 1.5 HDL cholesterol change (mmol/L) Show forest plot | 8 | 772 | Mean Difference (IV, Fixed, 95% CI) | ‐0.02 [‐0.05, 0.01] |
| 1.6 Triglycerides change (mmol/L) Show forest plot | 8 | 771 | Mean Difference (IV, Fixed, 95% CI) | 0.03 [‐0.08, 0.13] |
| 1.7 Systolic blood pressure change (mmHg) Show forest plot | 8 | 768 | Mean Difference (IV, Fixed, 95% CI) | 0.04 [‐1.67, 1.75] |
| 1.8 Diastolic blood pressure (mmHg) Show forest plot | 8 | 768 | Mean Difference (IV, Fixed, 95% CI) | 0.16 [‐0.89, 1.21] |