Les céréales complètes pour la prévention primaire ou secondaire des maladies cardiovasculaires
Résumé scientifique
Contexte
Il existe des preuves issues d'études observationnelles que les céréales complètes peuvent avoir un effet bénéfique sur le risque de maladies cardiovasculaires (MCV). Les versions précédentes de cette revue avaient principalement trouvé des études d'intervention à court terme. Des essais contrôlés randomisés (ECR) à plus long terme sont aujourd'hui disponibles. Ceci est une mise à jour et une version étendue de la revue originale réalisée en 2007.
Objectifs
L'objectif de cette revue systématique était d'évaluer l'effet des aliments ou régimes à base de céréales complètes sur la mortalité totale, les événements cardiovasculaires, et les facteurs de risque cardiovasculaire (lipides sanguins, pression artérielle) chez des personnes en bonne santé ou des personnes présentant des maladies cardiovasculaires établies ou des facteurs de risque liés, à l'aide de tous les ECR éligibles.
Stratégie de recherche documentaire
Nous avons effectué des recherches dans CENTRAL (numéro 8, 2016) dans la Bibliothèque Cochrane, MEDLINE (de 1946 au 31 août 2016), Embase (de 1980 à la semaine 35 de 2016) et CINAHL Plus (de 1937 au 31 août 2016) le 31 août 2016. Nous avons également consulté ClinicalTrials.gov le 5 juillet 2017 et le système d'enregistrement international des essais cliniques (ICTRP) de l'Organisation mondiale de la Santé (OMS) le 6 juillet 2017. Nous avons examiné les références bibliographiques des articles pertinents et nous n'avons appliqué aucune restriction concernant la langue.
Critères de sélection
Nous avons sélectionné les ECR évaluant les effets des aliments à base de céréales complètes ou des régimes contenant des céréales complètes par rapport à des aliments ou régimes de composition similaires, pendant une durée minimale de 12 semaines, sur les maladies cardiovasculaires et les facteurs de risque liés. Les adultes en bonne santé, les adultes présentant un risque accru de MCV, ou ceux présentant un diagnostic de MCV étaient éligibles pour l'inclusion.
Recueil et analyse des données
Deux auteurs de la revue ont indépendamment sélectionné les études. Les données ont été extraites et leur qualité vérifiée par un auteur de la revue puis elles ont été vérifiées par un deuxième auteur de la revue. Un deuxième auteur de la revue a vérifié les analyses. L'effet du traitement a été évalué à l'aide de la différence moyenne dans un modèle à effets fixes et l'hétérogénéité à l'aide de la statistique I2 et du test d'hétérogénéité Chi2. Nous avons évalué la qualité globale des preuves en utilisant le système GRADE avec le logiciel GRADEpro.
Résultats principaux
Nous avons inclus neuf ECR qui randomisaient 1414 participants (âgés de 24 à 70 ans ; âge moyen de 45 à 59 ans, lorsque cela était rapporté) dans des groupes consommant un régime contenant des céréales complètes, un régime contenant moins de céréales complètes ou un régime témoin contenant des céréales raffinées. Nous n'avons trouvé aucune étude qui rendait compte de l'effet des régimes contenant des céréales complètes sur la mortalité cardiovasculaire totale ou le nombre total d'événements cardiovasculaires (infarctus du myocarde, angor instable, pontage aorto‐coronarien, angioplastie coronaire transluminale percutanée, AVC). Toutes les études incluses rapportaient les effets des régimes contenant des céréales complètes sur les facteurs de risque de maladies cardiovasculaires, y compris le taux de lipides sanguins et la pression artérielle. Toutes les études étaient réalisées dans des populations suivies en prévention primaire et présentaient un risque de biais incertain ou élevé, et toutes les études avaient des interventions d'une durée inférieure à 16 semaines.
Dans l'ensemble, nous n'avons trouvé aucune différence entre les groupes suivant un régime contenant des céréales complètes et les groupes témoins en matière de taux de cholestérol total (différence moyenne 0,07, intervalle de confiance à 95 % ‐0,07 à 0,21 ; 6 études (7 comparaisons) ; 722 participants ; preuves de faible qualité).
En utilisant le système GRADE, nous avons évalué la qualité globale des preuves disponibles sur le cholestérol comme étant faible. Quatre études étaient financées par des agences de financement indépendantes gouvernementales et nationales, tandis que les autres études déclaraient un financement complet ou partiel par des organisations ayant des intérêts commerciaux dans les céréales.
Conclusions des auteurs
Il n'existe pas suffisamment de preuves issues d'ECR d'un effet des régimes contenant des céréales complètes sur les issues cardiovasculaires ou sur les principaux facteurs de risque cardiovasculaire tels que le taux de lipides sanguins et la pression artérielle. Les essais avaient un risque de biais incertain ou élevé avec des échantillons de petite taille et des interventions à relativement court terme, et la qualité globale des preuves était faible. Des ECR bien conçus ayant une puissance adéquate et des durées plus longues évaluant les événements cardiovasculaires ainsi que les facteurs de risque cardiovasculaire sont nécessaires.
PICO
Résumé simplifié
Céréales complètes dans la maladie cardiovasculaire
Contexte
Les aliments à base de céréales complètes englobent une large gamme de produits et comprennent le blé complet, le riz complet, le maïs complet, et l'avoine complète. Le terme « complet » comprend aussi les farines complètes telles que la farine d'avoine complète et la farine de blé complet.
Caractéristiques de l'étude
Nous avons évalué neuf études randomisées évaluant les effets des régimes contenant des céréales complètes par rapport aux régimes contenant des céréales raffinées ou à un régime habituel sur le taux de cholestérol dans le sang ou sur la pression artérielle (principaux facteurs de risque de maladies cardiovasculaires, notamment les crises cardiaques ou les accidents vasculaires cérébraux [AVC]). Les preuves sont à jour en août 2016.
Résultats principaux
Les régimes étaient suivis pendant au moins 12 semaines, mais la plupart des études présentaient des limitations méthodologiques, le nombre de participants était petit et la qualité globale des preuves était faible. Nous n'avons trouvé aucune étude rendant compte de l'effet des céréales complètes sur les décès de maladies cardiovasculaires ou les événements cardiovasculaires. Les neuf études incluses rendaient compte des effets des régimes à base de céréales complètes sur le taux de cholestérol dans le sang ou la pression artérielle. Nous n'avons trouvé aucun effet sur le taux de cholestérol dans le sang ou la pression artérielle en faveur des régimes contenant des céréales complètes. Quatre études étaient financées par des agences de financement indépendantes gouvernementales et nationales, tandis que les autres études déclaraient un financement complet ou partiel par des organisations ayant des intérêts commerciaux dans les céréales.
Conclusion
Il n'existe pas suffisamment de preuves issues d'essais contrôlés randomisés à ce jour pour recommander la consommation de régimes à base de céréales complètes pour réduire le risque de maladies cardiovasculaires, ou abaisser le taux de cholestérol dans le sang, ou la pression artérielle.
Authors' conclusions
Summary of findings
| Whole grain cereals for the primary prevention of cardiovascular disease (no studies were available to examine secondary prevention) | ||||||
| Patient or population: Free‐living adults who were healthy, had established cardiovascular disease or risk factors for cardiovascular disease Control: Refined grains or lower levels of wholegrain | ||||||
| Outcomes | Illustrative comparative risks (95% CI) | Relative effect | No. of participants | Quality of the evidence | Comments | |
|---|---|---|---|---|---|---|
| Assumed risk | Corresponding risk | |||||
| Refined grains or lower levels of whole grain dietary intake | Refined grains or higher levels of whole grain dietary intake | |||||
| Total cardiovascular mortality | See comment | See comment | See comment | See comment | See comment | No trials reported total CVD mortality for the primary prevention of CVD. |
| Fatal and non‐fatal myocardial infarction | See comment | See comment | See comment | See comment | See comment | No trials reported total myocardial infarction for the primary prevention of CVD. |
| Unstable angina | See comment | See comment | See comment | See comment | See comment | No trials reported unstable angina for the primary prevention of CVD. |
| Coronary artery bypass graft surgery | See comment | See comment | See comment | See comment | See comment | No trials reported coronary artery bypass graft surgery for the primary prevention of CVD. |
| Percutaneous transluminal coronary angioplasty | See comment | See comment | See comment | See comment | See comment | No trials reported percutaneous transluminal coronary angioplasty for the primary prevention of CVD. |
| Stroke | See comment | See comment | See comment | See comment | See comment | No trials reported total stroke for the primary prevention of CVD. |
| Total cholesterol change (mmol/L) Follow‐up: 12 to 16 weeks | The mean total cholesterol change ranged across lower levels of whole grain dietary intake groups from ‐0.4 to 0.3. | The mean total cholesterol change (mmol/L) in the intervention groups was 0.07 higher | ‐ | 722 | ⊕⊕⊝⊝ | See Appendix 1 for total cholesterol change checklist. |
| Abbreviations: CI: confidence interval; CVD: cardiovascular disease | ||||||
| GRADE Working Group grades of evidence | ||||||
| 1The term 'whole grain' includes foods based on milled whole grains, such as wholemeal or oatmeal. | ||||||
Background
This was an update and expansion of the original review published in 2007 (Kelly 2007).
Description of the condition
Cardiovascular diseases (CVD) are a group of conditions that affect the heart and blood vessels and include coronary heart disease, cerebrovascular disease, and peripheral arterial disease (WHO 2013). One of the main mechanisms thought to cause CVD is atherosclerosis, where the arteries become clogged by atheromas or plaques (NHS 2012). Cardiovascular disease occurs when the arteries are completely blocked or when blood flow is restricted by a narrowed artery, limiting the amount of blood and oxygen delivered to organs or tissue (BHF 2014). Arteries may naturally become harder and narrower with age, although this process may be accelerated by such factors as a sedentary lifestyle, obesity, ethnicity, smoking, high cholesterol, and high blood pressure (NHS 2012). Another cause of CVD is unstable plaque rupturing. It is thought that unstable plaques activate an inflammatory response in the body that causes the structure of atherosclerotic plaque to weaken and rupture, leading to the formation of blood clots (Spagnoli 2007).
Cardiovascular disease is the number one cause of death and disability globally (WHO 2013). Around 30% of total global deaths can be attributed to CVD (WHO 2013), and it is estimated to cause 17 million deaths per year (Bovet 2012). The World Health Organization reports that by 2030, CVDs will account for almost 23.3 million deaths per year (WHO 2013). This burden is set to increase as a consequence of ageing populations and increasing levels of sedentary lifestyles and obesity.
One key public health priority in the prevention of CVD is targeting modifiable risk factors. One such risk factor is diet, which plays a major role in the aetiology of many chronic conditions, including CVD. Indeed, a number of dietary factors have been found to be associated with a decrease in CVD risk, such as a low sodium intake (Aburto 2013), a low‐carbohydrate diet (Hu 2014), intake of whole grains (Ye 2012), and a high consumption of fruits and vegetables (Oude 2010). Such factors are important, not only because they have been linked to CVD development, but also because they can be modified. This makes them one of the main targets for interventions aimed at primary prevention and management of CVD.
Description of the intervention
A whole grain contains the entire edible parts of a natural grain kernel. The structure of all whole grains is similar and includes the endosperm, germ, and bran. Whole grains are rich in dietary fibre, antioxidants, resistant starch, phyto‐oestrogens, and other important micronutrients such as vitamins and folic acid (Slavin 2003). In the grain‐refining process, most of the bran and some of the germ is removed, resulting in the loss of dietary fibre, vitamins, minerals, lignans, phyto‐oestrogens, phenolic compounds, and phytic acid. The remaining starchy endosperm is ground to produce refined white flours.
Important grains in the Western diet include wheat, rice, maize, oats, barley, and rye. Wholemeal foods are made from whole grains that have been milled to a finer texture rather than leaving them whole in the final product. Both whole grain and wholemeal cereal foods are grain foods that include the outer layers of the grain, including the bran and germ. The EU HEALTHGRAIN consortium definition of whole grain is "whole grains shall consist of the intact, ground, cracked or flaked kernel after the removal of inedible parts such as the hull and husk. The principal anatomical components ‐ the starchy endosperm, germ and bran ‐ are present in the same relative proportions as they exist in the intact kernel" (van der Kamp 2014). This definition also allows for small losses of components during processing. The HEALTHGRAIN definition also lists specific grains included as whole grain. Research has shown that such processing of whole grains does not remove biologically important compounds (Slavin 2001). Nutritionally, whole grain and wholemeal foods are similar.
For foods made from whole grain such as breads, breakfast cereals, pasta, biscuits, and grain‐based snack foods, a standard definition for what constitutes a whole grain food has been recommended as a minimum of 8 g whole grains/30 g serving (27 g/100 g) (Ferruzzi 2014). This was in response to a lack of consistency in previous definitions of whole grain foods across "countries, governments, regulatory agencies, private and commercial organisations" (Ferruzzi 2014).
A recent comprehensive systematic review and meta‐analysis of prospective studies of the relationship between whole grain intake and cardiovascular disease found significant reductions in risk for cardiovascular disease, stroke, and coronary heart disease per 90 g/day (3 servings) increase of whole grain intake (Aune 2016). Evidence from two different meta‐analyses of observational cohort studies suggests that those consuming 48 to 80 g/day (3 to 5 servings/day) compared to lower consumers of whole grains (Ye 2012), or 2.5 servings/day compared to 0.2 servings/day have a 21% lower risk of CVD (Mellen 2008). The 10‐year Nurses' Health Study, a large prospective study of 75,521 women aged 38 to 63, found that increased whole grain intake was associated with decreased risk of coronary heart disease (Liu 1999). The lower risk associated with higher whole grain intake was not fully explained by the contribution of the diet to intakes of dietary fibre, folate, vitamin B6, and vitamin E. The Atherosclerosis Risk in Communities (ARIC) study found a beneficial relationship between whole grain consumption and the risk of total mortality and incidence of coronary artery disease but not the risk of ischaemic stroke (Steffen 2003). The study followed 15,792 people aged 45 to 64 for 11 years. A review of the relationship between whole grains and CVD risk concluded that there is an increasing body of evidence (Seal 2006), including from observational studies, suggesting a strong inverse relationship between increased consumption of whole grain foods and CVD risk. Associations between whole grain consumption and risk factors for coronary heart disease have also been reported. In the Framingham Offspring study, diets rich in whole grains were inversely associated with total cholesterol, low‐density lipoprotein (LDL) cholesterol and body mass index (McKeown 2002).
While cereal fibre has been associated with reduced risk of CVD (Rimm 1996; Wolk 1999), the relative effects of fibre or other components of whole grains such as phytochemicals and micronutrients, Fardet 2010; Okarter 2010, on CVD and risk factors is unclear (Ferruzzi 2014). A recent systematic review of RCTs found no effect of whole grains on body weight outcomes, although there was some evidence of small changes in body fat (Pol 2013). A systematic review of the effect of whole grains on type 2 diabetes and risk factors, Priebe 2008, found only one relevant randomised trial relating to a small improvement in insulin sensitivity (Pereira 2002).
Why it is important to do this review
Recent meta‐analyses examining whole grains and CVD events included only prospective cohort studies. Evidence seems to suggest a benefit of foods and diets containing whole grain on CVD risk factors. However, evidence has come largely from observational studies, which may be prone to confounding and other biases. We undertook this systematic review to examine the evidence of the effects of whole grains on CVD events and major risk factors from RCTs.
Objectives
The aim of this systematic review was to assess the effect of whole grain foods or diets on total mortality, cardiovascular events, and cardiovascular risk factors (blood lipids, blood pressure) in healthy people or people who have established cardiovascular disease or related risk factors, using all eligible RCTs.
Methods
Criteria for considering studies for this review
Types of studies
Randomised controlled trials. Cross‐over and parallel‐group study designs were eligible for inclusion. Minimum study duration for inclusion was 12 weeks.
Types of participants
Free‐living adults (age 18 years or older) were eligible for inclusion if they were healthy, had established cardiovascular disease, or one or more of the following risk factors: abnormal blood lipid levels (high‐density lipoprotein (HDL) and LDL cholesterol, triglycerides, and total cholesterol), raised blood pressure/hypertension, overweight (body mass index (BMI) > 25 kg/m2) or obesity (BMI > 30 kg/m2), metabolic syndrome, or diabetes.
Types of interventions
We included studies if they compared the effect of individual whole grain foods or diets high in whole grain foods with other diets or foods with lower levels or no whole grains. Comparisons were between diets with similar overall macronutrient (energy, carbohydrate, fat, and protein) levels. For the purposes of this review, the term 'whole grain' includes foods based on milled whole grains, such as wholemeal or oatmeal. Studies had to have a minimum 12‐week intervention period (or follow‐up period following dietary advice).
We did not include studies if they were multiple‐component interventions, or interventions that incorporated factors other than whole grain foods or diets, unless the effect of whole grain foods or diets could be separated from the other factors. We did not include studies on foods that were based only on individual components (e.g. bran, germ, or other components) of the grain. We did not include studies that examined the effect of high fibre, dietary fibre, or cereal fibre where the specific effect of whole grain foods or diets could not be distinguished.
Types of outcome measures
Primary outcomes
-
Total cardiovascular mortality.
-
Cardiovascular events (e.g. fatal and non‐fatal myocardial infarction, unstable angina, coronary artery bypass graft surgery, percutaneous transluminal coronary angioplasty, stroke).
Secondary outcomes
-
Blood lipid levels (total cholesterol, HDL cholesterol, LDL cholesterol, triglycerides).
-
Blood pressure.
-
Quality of life.
-
Adverse events (e.g. bloating, nausea, weight gain, difficulty in eating out).
Body weight data and BMI were recorded as potential parameters that might influence the above outcomes, but studies that reported only weight or BMI outcomes (without cardiovascular, lipid, or blood pressure outcomes) were not included.
Since the last update of this review, a separate Cochrane Review has been published focusing on the effects of whole grain foods for the prevention of type 2 diabetes mellitus (Priebe 2008). Hence, we excluded studies with diabetes as an outcome or changes in related risk factors including impaired glucose tolerance, insulin resistance or sensitivity, glucose or insulin outcomes or weight, BMI, and other anthropometric outcomes if they did not also measure lipids or blood pressure.
Search methods for identification of studies
Electronic searches
We updated and ran the searches on 31 August 2016 in the following databases; the Cochrane Central Register of Controlled Trials (CENTRAL, Issue 8, 2016) in the Cochrane Library, MEDLINE (Ovid, 1946 to 31 August 2016), Embase (Ovid, 1980 to week 35, 2016), and CINAHL Plus (EBSCO, 1937 to 31 August 2016).
We also searched ClinicalTrials.gov (www.clinicaltrials.gov, 5 July 2017) and the World Health Organization International Clinical Trials Registry Platform (WHO ICTRP) (apps.who.int/trialsearch/, 6 July 2017).
We amended the searches from the previous review (Appendix 2) to account for the broader inclusion criteria of this update. We ran the updated search strategies (Appendix 3) without date limits and applied no language restrictions. The Cochrane sensitivity‐maximising RCT filter was applied to MEDLINE and terms as recommended in the Cochrane Handbook for Systematic Reviews of Interventions were applied to Embase (Lefebvre 2011).
Searching other resources
We checked the reference lists of all relevant studies. We also sought relevant published reviews as a source of RCTs.
Data collection and analysis
Selection of studies
Two review authors (SK and LH/HL/CC/LA/HJ) independently scanned the titles and abstracts of retrieved records and rejected only those that the review author definitively determined did not meet the inclusion criteria. We obtained full texts for any studies that could not be rejected with certainty. Two review authors (SK and RG/HL/HJ/LA) then independently assessed each paper. We used an in/out form to assess the inclusion (or otherwise) of full papers into the review. If a trial was excluded after the full paper was obtained, the study and its reason for exclusion were recorded. Differences in selection were resolved by discussion or by consulting a third review author (KR).
Data extraction and management
One review author (SK, JC, or LA) extracted original reports of trial results, which a second review author (KR or EL) checked. Differences between review authors' extraction results were resolved by discussion and, when necessary, by consulting a third review author.
We extracted data as follows, which are reported in the Characteristics of included studies table.
-
General information: published/unpublished, title, authors, source, country, year of publication, trial dates, additional publications.
-
Trial characteristics: design, setting, duration, randomisation (and method), allocation concealment (and method), blinding (outcome assessors), check of blinding, funding/conflict of interest.
-
Participants: inclusion criteria, exclusion criteria, total number and number in comparison groups, sex/age, ethnicity, BMI, lipid levels, blood pressure, similarity of groups at baseline, withdrawals/losses to follow‐up, assessment of adherence, medications used, smoking status when provided.
-
Intervention: dietary information/diet provided, length of intervention, comparison interventions, macronutrient composition of diets.
-
Outcomes: outcomes as specified above, the main outcome assessed in the study, other events, length of follow‐up.
-
Results: for outcomes and times of assessment.
Assessment of risk of bias in included studies
We assessed risk of bias of included studies by examining the random sequence generation and allocation concealment, description of dropouts and withdrawals, blinding (outcome assessment), and selective outcome reporting. We based assessment on the Cochrane 'Risk of bias' tool (Higgins 2011), however we did not assess blinding of participants, as it is difficult to blind participants to their intervention arm in this type of dietary trial. We additionally assessed whether intention‐to‐treat analysis was conducted. We categorised risk of bias as 'low', 'unclear', or 'high'. One review author (SK or LA) assessed the risk of bias, which a second review author (EL) checked. Any disagreements were resolved by a third review author (KR).
We did not exclude studies on the basis of risk of bias. In particular, we examined the following factors.
-
Method of randomisation
-
Allocation concealment
-
Blinding of outcome assessment (detection bias)
-
Incomplete outcome data (attrition bias)
-
Intention‐to‐treat analysis
-
Selective reporting (reporting bias)
-
Groups comparable at baseline
-
Other (e.g. power analysis, analysis issues)
Measures of treatment effect
We processed data in accordance with the Cochrane Handbook for Systematic Reviews of Interventions (Higgins 2011). For continuous outcomes, we compared net changes (i.e. intervention group minus control group differences) and calculated a mean difference (MD) and 95% CI for each study.
Cholesterol and triglyceride levels were expressed as mmol/L (and converted from mg/dL by multiplying by conversion factors of 0.0259 for total, HDL, and LDL cholesterol, and by 0.0113 for triglycerides where necessary) (JAMA 2004).
We converted standard errors to standard deviations by the equation given in the Cochrane Handbook where necessary.
We included studies reporting multiple comparison groups in this review. Where this was the case, we used the data for the control group for each intervention group comparison and reduced the weight assigned to the control group by dividing the control group N by the number of intervention groups. We included two studies that had two interventions. One did not provide mean values and could not be included in the meta‐analysis (Brownlee 2010), and the control group N of the second study was halved (Tighe 2010‐W).
We aimed to include cluster‐randomised trials in this review by using the unit of randomisation (cluster) as the number of observations. Where necessary, we would have utilised individual‐level means and standard deviations adjusted for clustering together with the number of clusters in the denominator, in order to weight the trials appropriately. We found no trials where participants were randomised by cluster/groups.
We entered data presented as a scale with a consistent direction of effect, with the exception of HDL cholesterol, where an increase in this outcome is a positive finding.
Assessment of heterogeneity
For each outcome, we conducted tests of heterogeneity using the Chi2 test of heterogeneity and the I2 statistic. Where heterogeneity was low, we performed a fixed‐effect meta‐analysis. If we detected substantial heterogeneity (I2 of 50% or greater), we looked for possible explanations (e.g. participants and intervention). If we were unable to explain the source of heterogeneity, we considered the following options: provide a narrative overview and not aggregate the studies at all, or use a random‐effects model with appropriate cautious interpretation.
Data synthesis
We carried out statistical analysis using Cochrane's statistical software, Review Manager 5 (RevMan 2014). We entered continuous data as the change in means and standard deviations from baseline to follow‐up measurements.
We aimed to categorise studies into two subgroups: primary‐prevention populations (healthy individuals or those at high risk of CVD) or secondary‐prevention populations (those with a pre‐existing diagnosis of CVD). However, we identified no studies in secondary‐prevention populations.
Studies reported results either as absolute values at the endpoint or as change from baseline. For the pooled analysis, we reported change from baseline values. Where papers did not report results as change from baseline, we calculated this and for the standard deviation differences followed the methods presented in Section 16.1.3.2 of the Cochrane Handbook for Systematic Reviews of Interventions for imputing these (Higgins 2011), and assumed a correlation of 0.5 between baseline and follow‐up measures as suggested by Follman (Follmann 1992).
We planned to use sensitivity analysis to take into account the influence of various factors, for example (a) risk of bias, and (b) exclusion of particularly small and underpowered trials. However, all studies were of similar risk of bias and size, and therefore no sensitivity analyses were undertaken. We also planned to undertake assessment of funnel plots and tests of asymmetry to assess possible publication bias, but there were insufficient studies included in the review (Egger 1997).
Quality of the evidence
We presented the overall quality of the evidence for each outcome according to the GRADE approach, which takes into account issues not only related to internal validity (risk of bias, inconsistency, imprecision, publication bias) but also to external validity, such as directness of results. Two review authors (LA, SK) rated the quality for each outcome. We presented a summary of the evidence in a 'Summary of findings' table, which provides key information about the best estimate of the magnitude of the effect, in relative terms and absolute differences for each relevant comparison of alternative management strategies, numbers of participants and trials addressing each important outcome, and the rating of the overall confidence in effect estimates for each outcome. We created the 'Summary of findings' table based on the methods described in the Cochrane Handbook for Systematic Reviews of Interventions (Higgins 2011). We presented results on the outcomes as described in Types of outcome measures.
In addition, we established an appendix 'Checklist to aid consistency and reproducibility of GRADE assessments' to help with standardisation of the 'Summary of findings' table (Appendix 1) (Meader 2014).
Results
Description of studies
Results of the search
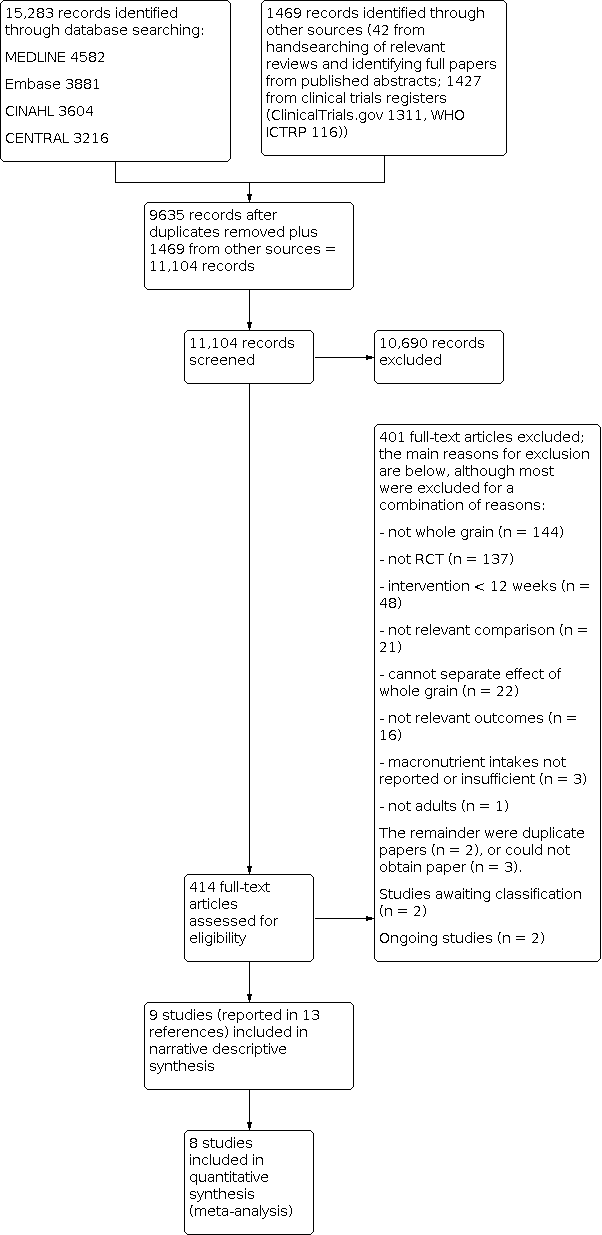
The updated searches identified 15,283 potentially relevant records. Records from the databases were imported into EndNote reference management software and combined. The combined articles were then de‐duplicated using the EndNote software, leaving 9635 combined hits. A further 42 potentially relevant records were identified from handsearching relevant reviews, and 1427 from searching clinical trials registers. A total of 414 full‐text articles were assessed for eligibility, and 9 studies (reported in 13 references) were included in the review, of which 8 were included in meta‐analysis.
For full details of the searches and selection of trials for the review, see Figure 1 (Moher 2009).

Study flow diagram for updated searches 2016.
Included studies
Details of the studies included in the review are shown in the Characteristics of included studies table.
We identified nine different studies that met the inclusion criteria for this review (the study by Tighe reported two different relevant intervention arms in the same paper) (Brownlee 2010; Giacco 2013; Harris 2014; Katcher 2008; Kristensen 2012; Lankinen 2014; Maki 2010; Tighe 2010‐W; Tighe 2010‐WO; Zhang 2011). We found no studies that reported the effect of whole grain foods or diets on CVD mortality or CVD events and morbidity (total myocardial infarction, unstable angina, coronary artery bypass graft surgery, percutaneous transluminal coronary angioplasty, total stroke). All nine included studies reported the effect of whole grain foods or diets on major risk factors for CVD (lipids and blood pressure) according to the inclusion criteria for this review outlined in Types of outcome measures. All nine studies were parallel RCTs. The nine included studies involved a total of 1414 participants. Four of the nine studies had total sample sizes below 100 participants (Giacco 2013; Harris 2014; Katcher 2008; Kristensen 2012).
In four studies, both the whole grain and control diets were energy‐restricted weight loss diets (Harris 2014; Katcher 2008; Kristensen 2012; Maki 2010).
In one study, the whole grain was oats (Maki 2010). In five studies, the diets included a range of whole grain foods mainly based on wheat (Brownlee 2010; Harris 2014; Katcher 2008; Kristensen 2012; Lankinen 2014); one study used a mixture of rye and wheat products (Giacco 2013); one study used whole grain brown rice (Zhang 2011); and one study had two intervention arms, one based on whole grain wheat products and the other a mixture of whole grain wheat and oats (Tighe 2010‐W).
Seven studies described their control group diet as refined foods; one study described the control diet as usual diet (Brownlee 2010); and in the remaining study the control was white rice (Zhang 2011).
The length of the intervention was 12 weeks in seven studies and 16 weeks in two studies (Brownlee 2010; Zhang 2011).
Population and setting
Three studies included participants who were overweight or obese (Brownlee 2010; Kristensen 2012; Maki 2010); two studies included participants with metabolic syndrome (Giacco 2013; Lankinen 2014); one study included participants who were overweight or obese and had metabolic syndrome (Katcher 2008); and one study included participants who had risk factors for metabolic syndrome (Harris 2014), including obesity. One study recruited participants with BMI from 18.5 to 35 kg/m2 or with signs of metabolic syndrome or moderate hypercholesterolaemia (Tighe 2010‐W). One study included participants with metabolic syndrome or diabetes (Zhang 2011).
Three studies were conducted in the USA (Harris 2014; Katcher 2008; Maki 2010), two in the UK (one in Scotland, Tighe 2010‐W, and one in England, Brownlee 2010), one in Finland (Lankinen 2014), one in Denmark (Kristensen 2012), one in both Italy and Finland (Giacco 2013), and one in China (Zhang 2011).
Intervention
The interventions in eight of the nine studies included the provision of whole grain foods to the study participants (Brownlee 2010; Giacco 2013; Harris 2014; Kristensen 2012; Lankinen 2014; Maki 2010; Tighe 2010‐W; Zhang 2011). In the remaining study the participants were given a list and description of foods and a daily serving of whole grain foods to aim for depending on individualised energy requirements set out by a study dietitian (Katcher 2008). In two studies (Brownlee 2010; Kristensen 2012), a range of foods were available, and the studies aimed to allow participants to choose their whole grain foods. The Giacco 2013 study prespecified a proportion of whole grain that was required to be in the form of bread (this differed slightly between the two different study centres), and participants were also provided with oat biscuits for snacks. In the study by Harris 2014, a range of grain types were provided including wheat, oats and rice, with 77% from wheat products. In this study prepared meals and snacks were provided to the study participants. The study by Maki 2010 also provided ready‐to‐eat cereals. In the study by Tighe 2010‐W, participants had three food servings replaced by study foods (either whole grain wheat or whole grain wheat and oats). In all studies except Brownlee 2010, control participants also received like‐for‐like food or advice but with refined products.
Three studies reported that participants also received advice from a dietitian (Katcher 2008; Kristensen 2012; Maki 2010), and two studies encouraged participants to undertake a prescribed amount of physical activity each week (Katcher 2008; Maki 2010).
All nine trials reported daily dietary components of the intervention diets. One study reported daily intake of energy as a change from baseline (Brownlee 2010), where the energy intake increased in the two intervention groups but decreased in the control group. In the four studies that aimed to reduce energy intake as part of their intervention (Harris 2014; Katcher 2008; Kristensen 2012; Maki 2010), only two reported baseline and end‐of‐study daily energy, where as expected results showed a reduction in energy consumption (Katcher 2008; Maki 2010). Of the remaining studies, there was an increase in energy consumption in both groups by the end of the intervention in the study by Giacco 2013 and no difference in energy intake across or between groups in the studies by Tighe 2010‐W, Lankinen 2014, and Zhang 2011. As can be seen in Table 1, most studies reported similar dietary components between intervention and control groups (or did not report the statistical significance, but data appear to be similar). There was a difference in carbohydrates and fibre (g/day) between the whole grain groups and the control groups in two studies (Brownlee 2010; Kristensen 2012), but no other dietary components differed. In the Giacco 2013 study, a difference in protein intake was seen between those in the whole grain group and those in the control group. Zhang 2011 reported lower intake of carbohydrates (P = 0.03) and dairy products in the brown rice group (P = 0.02), and Lankinen 2014 reported that total fat decreased in the whole grain group.
| Study ID | Dietary component | Whole grain | Control | P value |
|---|---|---|---|---|
| Energy (kJ/day) | Baseline: Not reported Data are change from baseline. Intervention 1 (lower WG) Wk 8: 379 (SD/SEM NR) Wk 16: 387 (SD/SEM NR) Intervention 2 (higher WG) Wk 8: ‐399 (SD/SEM NR) Wk 16: 587 (SD/SEM NR) | Baseline: Not reported Data are change from baseline. Wk 8: ‐430 (SD/SEM NR) Wk 16: ‐679 (SD/SEM NR) | Intervention 1 (lower WG) Wk 8: 0.015 Wk 16: NS Intervention 2 (higher WG) Wk 8: 0.32 Wk 16: 0.005 | |
| Carbohydrate (g/day) | Baseline: Not reported Data are change from baseline. Intervention 1 (lower WG) Wk 8: 22.6 (SD/SEM NR) Wk 16: 37.1 (SD/SEM NR) Intervention 2 (higher WG) Wk 8: 14.8 (SD/SEM NR) Wk 16: 53.8 (SD/SEM NR) | Baseline: Not reported Data are change from baseline. Wk 8: ‐1.97 (SD/SEM NR) Wk 16: ‐14.8 (SD/SEM NR) | Intervention 1 (lower WG) 0.004 0.007 Intervention 2 (higher WG) 0.026 < 0.001 | |
| Fat (g/day) | Baseline: Not reported Data are change from baseline. Intervention 1 (lower WG) Wk 8: 0.245 (SD/SEM NR) Wk 16: ‐2.96 (SD/SEM NR) Intervention 2 (higher WG) Wk 8: ‐8.12 (SD/SEM NR) Wk 16: ‐1.63 (SD/SEM NR) | Baseline: Not reported Data are change from baseline. Wk 8: ‐2.87 (SD/SEM NR) Wk 16: ‐4.05 (SD/SEM NR) | Intervention 1 (lower WG) NS NS Intervention 2 (higher WG) NS NS | |
| Protein (g/day) | Baseline: Not reported Data are change from baseline. Intervention 1 (lower WG) Wk 8: 6.15 (SD/SEM NR) Wk 16: 5.05 (SD/SEM NR) Intervention 2 (higher WG) Wk 8: 1.75 (SD/SEM NR) Wk 16: 6.99 (SD/SEM NR) | Baseline: Not reported Data are change from baseline. Wk 8: ‐3.17 (SD/SEM NR) Wk 16: ‐4.25 (SD/SEM NR) | Intervention 1 (lower WG) NS NS Intervention 2 (higher WG) NS NS | |
| NSP/fibre (g/day) | Baseline: Not reported Data are change from baseline. Intervention 1 (lower WG) Wk 8: 4.69 (SD/SEM NR) Wk 16: 5.70 (SD/SEM NR) Intervention 2 (higher WG) Wk 8: 6.23 (SD/SEM NR) Wk 16: 11.0 (SD/SEM NR) | Baseline: Not reported Data are change from baseline. Wk 8: ‐0.144 (SD/SEM NR) Wk 16: ‐0.438 (SD/SEM NR) | Intervention 1 (lower WG) < 0.001 < 0.001 Intervention 2 (higher WG) < 0.001 < 0.001 | |
| Whole grain (g/day) | Working definition of whole grain product: commercially available whole grain products readily available in the UK, ranging from 34 to 80.8 g/100 g dry weight or 11.2 g cooked weight of whole grain Data approximated from graph; SD/SEM not available. Intervention 1 (lower WG) (mean intake g/day) Wk 8: 75 Wk 16: 70 Intervention 2 (higher WG) (mean intake g/day) Wk 8: 80 Wk 16: 115 | Data taken from graph; SD/SEM not available. < 20 g/day (mean intake g/day) | NR NR | |
| Energy (kilocalories/day) | Baseline: 1702 (SEM 62) Wk 12: 1900 (SEM 57) | Baseline: 1719 (SEM 63) Wk 12: 1965 (SEM 57) | NR NS | |
| Carbohydrate (% E) | Baseline: 46 (SEM 0.6) Wk 12: 48 (SEM 0.6) | Baseline: 48 (SEM 0.7) Wk 12: 49 (SEM 0.6) | NR NS | |
| Fat (% E) | Baseline: 33.5 (SEM 0.6) Wk 12: 31 (SEM 0.7) | Baseline: 31.8 (SEM 0.6) Wk 12: 30.8 (SEM 0.7) | NR NS | |
| Protein (% E) | Baseline: 18 (SEM 0.4) Wk 12: 18.7 (SEM 0.3) | Baseline: 18 (SEM 0.4) Wk 12: 17.8 (SEM 0.3) | NR < 0.05 | |
| Fibre (g/day) | Total fibre Baseline: 22.7 (SEM 0.8) Wk 12: 32.6 (SEM 0.7) Cereal fibre Baseline: 11.9 (SEM 0.8) Wk 12: 24.3 (SEM 0.9) | Total fibre Baseline: 21.6 (SEM 0.8) Wk 12: 19.8 (SEM 0.7) Cereal fibre Baseline: 11.4 (SEM 0.6) Wk 12: 10.4 (SEM 0.3) | NR < 0.05 NR < 0.05 | |
| Whole grain (g/day) Whole grain level (plasma total alkylresorcinol concentration nmol/L) | Study states that Working definition of whole grain: 51% whole grain per day, dry weight was used according to HealthGrain forum definition and analysis of whole grain but no data reported for wholegrain levels. However plasma total alkylresorcinol as a proxy for wholegrain content was reported as below: | NR ‐19.7 (n = 26) | NR 88.3 (n = 28) | |
| Energy (kilocalories/day) | Calculated from menus. All food provided. 86% compliance reported. Mean/day 2079 | Mean/day 2023 | NR | |
| Carbohydrate (g/day) | 299 | 280 | NR | |
| Fat (g/day) | 62 | 64 | NR | |
| Protein (g/day) | 97 | 90 | NR | |
| Fibre (g/day) | 38 | 22 | NR | |
| Whole grain (g/day) | Working definition of whole grain: whole grain products made from milled flour were required to have > 51% of dry weight from whole grain flour. When possible, whole grain products with the 100% whole grain stamp were selected, which indicated that each grain serving contained at least 16 g whole grain and used 100% whole grain flour. Whole grain content of diets ranged from 163 to 301 g/day, as energy content of diets were adjusted for individual requirements. Energy of diets was 1600 to 3600 kilocalories/day. Based on energy intake of 2100 kilocalories/day, typical whole grains supplied were 187 g/day (7 servings/day). | 0 servings/day 0 g/day | NR NR | |
| Energy (kilocalories/day) | Baseline: 1967 (SD 545) Wk 4: 1812 (SD 505) Wk 8: 1744 (SD 533) Wk 12: 1611 (SD 377) | Baseline: 2265 (SD 744) Wk 4: 1616 (SD 468) Wk 8: 1562 (SD 398) Wk 12: 1575 (SD 500) | NS | |
| Carbohydrate (% E) | Baseline: 47.8 (SD 8.3) Wk 4: 54.0 (SD 7.1) Wk 8: 53.9 (SD 9.1) Wk 12: 54.6 (SD 6.8) | Baseline: 47.5 (SD 8.7) Wk 4: 49.6 (SD 10.7) Wk 8: 47.5 (SD 10.2) Wk 12: 49.9 (SD 9.7) | NS | |
| Fat (% E) | Baseline: 35.4 (SD 5.9) Wk 4: 28.7 (SD 6.6) Wk 8: 29.6 (SD 7.2) Wk 12: 27.8 (SD 6.9) | Baseline: 36.2 (SD 6.8) Wk 4: 32.3 (SD 8.4) Wk 8: 33.8 (SD 8.5) Wk 12: 30.5 (SD 8.0) | NS | |
| Protein (% E) | Baseline: 16.9 (SD 3.2) Wk 4: 18.2 (SD 2.7) Wk 8: 18.4 (SD 3.4) Wk 12: 19.1 (SD 4.3) | Baseline: 16.5 (SD 3.2) Wk 4: 18.7 (SD 4.5) Wk 8: 19.2 (SD 4.8) Wk 12: 20.0 (SD 4.8) | NS | |
| Fibre (g/1000 kilocalories) | Baseline: 8.6 (SD 3.7) Wk 4: 12.6 (SD 3.2) Wk 8: 13.3 (SD 3.4) Wk 12: 12.9 (SD 2.2) | Baseline: 9.1 (SD 3.7) Wk 4: 10.0 (SD 3.0) Wk 8: 9.5 (SD 2.0) Wk 12: 9.7 (SD 3.5) | Significant difference between WG and RG at wks 8 and 12 (P < 0.05) | |
| Whole grain (g/day) | Definition of whole grain product: "grain product was identified as a wholegrain if a wholegrain was listed as the first ingredient on the food label". Data taken from graph so approximate: 1 serving whole grain equivalent to 1 slice wholemeal bread, or 28 g (1 oz ready‐to‐eat cereal), or 1/2 cup cooked cereal, rice, or pasta (2005 dietary guidelines for Americans). Baseline: 1.5 servings/day Wk 12: 5 servings/day | Baseline: ~1.5 servings/day Week 12: 0.2 servings/day | NR | |
| Energy (kJ/day) | Wks 1 to 6: 5830 (SEM 190) Wks 7 to 12: 6060 (SEM 150) | Wks 1 to 6: 5900 (SEM 280) Wks 7 to 12: 6330 (SEM 180) | NR NR | |
| Carbohydrate (g/day) | 86.8 | 95.8 | NR | |
| Fat (g/day) | 6.8 | 6.6 | NR | |
| Protein (g/day) | 16.6 | 16.0 | NR | |
| Fibre (g/day) | 11.0 | 4.5 | NR | |
| Whole grain (g/day) Alkylresorcinol (mg/day) | Working definition of whole grain: mean whole grain intake: 105 g/day 25.5 | Mean whole grain intake: 0 g/day AR: 3.1 | NR | |
| Energy (kJ/day) | Baseline: 6995 ± 2373 Wk 12: 7654 ± 2395 | Baseline: 7282 ± 2011 Wk 12: 8533 ± 1693 | 0.119 | |
| Carbohydrate (% E/day) | Baseline: 45.6 ± 6.3 Wk 12: 47.2 ± 7.5 | Baseline: 47.8 ± 5.6 Wk 12: 47.3 ± 5.1 | 0.268 | |
| Fat (% E/day) | Baseline: 33.6 ± 5.2 Wk 12: 3 ± 6.3 | Baseline: 31.3 ± 5.3 Wk 12: 31.9 ± 5.9 | 0.012 | |
| Protein (% E/day) | Baseline: 19.1 ± 3.2 Wk 12: 18.8 ± 2.5 | Baseline: 18.8 ± 3.7 Wk 12: 18.3 ± 2.5 | 0.950 | |
| Fibre (g/day) | Baseline: 24.6 ± 7.0 Wk 12: 26.5 ± 5.4 | Baseline: 22.5 ± 7.0 Wk 12: 18.0 ± 4.2 | 2.7x10⁷ | |
| Whole grain (g/day) | Working definition of whole grain: whole grain breads and a bread with low glycaemic index products covered 20% to 25% of total energy intake and were delivered to the participants. The fibre contents of the breads were 6.9% (endosperm rye bread), 6.4% (whole grain wheat bread), and 10% to 14% (commercial whole grain rye breads). Wholemeal pasta. | Refined wheat breads and other cereal products with low fibre. Participants were allowed to eat maximum of 1 to 2 portions of rye products per day. | ‐ | |
| Energy (kilocalories/day) | Baseline: 1939 (SEM 97) Wk 4: 1563 (SEM 50) Wk 12: 1529 (SEM 44) | Baseline: 1853 (SEM 70) Wk 4: 1395 (SEM 44) Wk 12: 1443 (SEM 45) | 0.690 0.009 0.256 | |
| Carbohydrate (% E) | Baseline: 44.8 (SEM 0.9) Wk 4: 50.6 (SEM 0.9) Wk 12: 52.2 (SEM 0.9) | Baseline: 45.6 (SEM 1.2) Wk 4: 49.8 (SEM 1.0) Wk 12: 49.8 (SEM 1.0) | 0.660 0.625 0.017 | |
| Total fat (% E) | Baseline: 36.9 (SEM 0.8) Wk 4: 30.4 (SEM 0.9) Wk 12: 29.6 (SEM 0.8) | Baseline: 35.6 (SEM 0.8) Wk 4: 30.0 (SEM 0.8) Wk 12: 29.8 (SEM 0.7) | 0.297 0.697 0.718 | |
| Protein (% E) | Baseline: 18.2 (SEM 0.5) Wk 4: 20.1 (SEM 0.5) Wk 12: 19.7 (SEM 0.5) | Baseline: 17.9 (SEM 0.6) Wk 4: 20.0 (SEM 0.6) Wk 12: 20.1 (SEM 0.6) | 0.330 0.971 0.623 | |
| Fibre (g/day) | Baseline: 15.8 (SEM 1.0) Wk 4: 21.0 (SEM 0.5) Wk 12: 21.7 (SEM 0.5) | Baseline: 14.8 (SEM 0.8) Wk 4: 11.8 (SEM 0.6) Wk 12: 12.7 (SEM 0.6) | 0.612 < 0.001 < 0.001 | |
| Whole grain (g/day) | Working definition of whole grain: the whole grain used was a whole grain oat ready‐to‐eat cereal (Cheerios, General Mills, Minneapolis, MN), 2 portions per day (approximately 80 g/day), containing equivalent of 3 g oat β‐glucan. | ‐ | ‐ | |
| Energy (kilocalories/day) | Whole grain wheat group Baseline: 2115 (SEM 64) Wk 12: 2121 (SEM 75) Whole grain wheat + oats group Baseline: 2115 (SEM 58) Wk 12: 2142 (SEM 69) | Baseline: 2036 (SEM 79) Wk 12: 2080 (SEM 83) | Baseline: 0.650 Wk 12: 0.843 | |
| Carbohydrate (g/day) | Whole grain wheat group Baseline: 256 (SEM 9) Wk 12: 253 (SEM 9) Whole grain wheat + oats group Baseline: 252 (SEM 7) Wk 12: 243 (SEM 8) | Baseline: 238 (SEM 10) Wk 12: 245 (SEM 10) | Baseline: 0.324 Wk 12: 0.633 | |
| Fat (g/day) | Whole grain wheat group Baseline: 80.8 (SEM 2.8) Wk 12: 79.7 (SEM 3.3) Whole grain wheat + oats group Baseline: 78.6 (SEM 2.9) Wk 12: 82.1 (SEM 3.5) | Baseline: 78.7 (SEM 3.6) Wk 12: 79.9 (SEM 4.3) | Baseline: 0.847 Wk 12: 0.871 | |
| Protein (g/day) | Whole grain wheat group Baseline: 85.2 (SEM 3.0) Wk 12: 89.1 (SEM 3.5) Whole grain wheat + oats group Baseline: 83.1 (SEM 2.4) Wk 12: 87.0 (SEM 2.8) | Baseline: 81.3 (SEM 2.9) Wk 12: 84.0 (SEM 2.4) | Baseline: 0.627 Wk 12: 0.496 | |
| Fibre (NSP) (g/day) | Whole grain wheat group Baseline: 12.3 (SEM 0.4) Wk 12: 18.5 (SEM 0.5) Whole grain wheat + oats group Baseline: 12.4 (SEM 0.4) Wk 12: 16.8 (SEM 0.5) | Baseline: 10.9 (SEM 0.5) Wk 12: 11.3 (SEM 0.4) | Baseline: 0.049 Wk 12: < 0.001 | |
| Whole grain (g/day) | Working definition of whole grain: not reported Whole grain wheat group 3 servings whole grain foods: 70 to 80 g wholemeal bread and 30 to 40 g whole grain cereals/day Whole grain wheat + oats group 3 servings whole grain foods: 1 serving whole grain wheat products and 2 servings whole grain oat foods/day | ‐ | ‐ | |
| Energy (MJ/day) | Brown rice Baseline: 8.72 (SD 2.30) Wk 4: 8.31 (SD 1.75) Wk 8: 8.05 (SD 1.89) Wk 12: 8.00 (SD 1.86) Wk 16: 8.22 (SD 1.80) | White rice Baseline: 8.65 (SD 2.38) Wk 4: 8.16 (SD 2.23) Wk 8: 8.25 (SD 2.01) Wk 12: 8.46 (SD 2.04) Wk 16: 8.60 (SD 2.01) | ‐ | |
| Carbohydrate (% E) | Brown rice Baseline: 53.9 (SD 7.3) Wk 4: 53.3 (SD 6.5) Wk 8: 52.9 (SD 5.5) Wk 12: 51.8 (SD 7.0) Wk 16: 51.6 (SD 7.3) | White rice Baseline: 54.9 (SD 7.2) Wk 4: 51.8 (SD 6.4) Wk 8: 53.8 (SD 6.3) Wk 12: 52.8 (SD 5.8) Wk 16: 53.3 (SD 6.8) | ‐ | |
| Fat (% E) | Brown rice Baseline: 32.5 (SD 6.7) Wk 4: 32.3 (SD 5.9) Wk 8: 33.0 (SD 4.5) Wk 12: 34.2 (SD 6.4) Wk 16: 35.0 (SD 6.4) | White rice Baseline: 31.7 (SD 6.4) Wk 4: 33.1 (SD 6.2) Wk 8: 31.5 (SD 5.8) Wk 12: 32.7 (SD 5.7) Wk 16: 32.7 (SD 6.6) | ‐ | |
| Protein (% E) | Brown rice Baseline: 15.8 (SD 2.8) Wk 4: 17.2 (SD 2.8) Wk 8: 17.0 (SD 3.1) Wk 12: 16.8 (SD 2.7) Wk 16: 16.1 (SD 2.8) | White rice Baseline: 15.7 (SD 2.7) Wk 4: 17.4 (SD 2.8) Wk 8: 17.0 (SD 2.7) Wk 12: 16.7 (SD 2.4) Wk 16: 16.0 (SD 2.2) | ‐ | |
| Fibre (g/1000 kJ) | Brown rice Baseline: 1.34 (SD 0.49) Wk 4: 1.65 (SD 0.40) Wk 8: 1.69 (SD 0.42) Wk 12: 1.64 (SD 0.42) Wk 16: 1.57 (SD 0.51) | White rice Baseline: 1.32 (SD 0.38) Wk 4: 1.34 (SD 0.42) Wk 8: 1.37 (SD 0.49) Wk 12: 1.28 (SD 0.39) Wk 16: 1.20 (SD 0.39) | ‐ | |
| Whole grain (g/day) | Authors stated that the brown rice was a whole grain in the paper, and Table 1 of the paper reports nutrient comparison of the brown rice versus the white rice used in the study. | ‐ | ‐ |
% E: percentage energy
NR: Not reported
NS: Not statistically significant
NSP: non‐starch polysaccharide
RG: refined grains
SD: standard deviation
SEM: standard error of the mean
WG: whole grains
We relied on the study authors' definition of whole grain for this review. Definitions and level of whole grain in the diets where reported are shown in Table 1. This varied between studies. In two studies a whole grain product was defined as at least 51% whole grain by dry weight (Giacco 2013; Harris 2014); in one study it was 50% by dry weight (Kristensen 2012); in one study the whole grain content of commercially available whole grain foods used ranged from 34 to 80.8 g per 100 g dry weight (and one product was included with 11.2 g per 100 g cooked weight) (Brownlee 2010); and in one study products were identified as whole grain if a whole grain was listed as the first ingredient on the food label (Katcher 2008). Two studies did not report the definition of whole grain used (Lankinen 2014; Tighe 2010‐W), but one of these did report the number of servings (Tighe 2010‐W). One study used exclusively whole grain oats (Maki 2010), and another study defined the brown rice used as whole grain (Zhang 2011).
Funding
Four studies were funded wholly by independent sources, two by the UK Food Standards Agency (Brownlee 2010; Tighe 2010‐W), one by a European Commission grant (Giacco 2013), and one through Chinese national funding organisations (Zhang 2011), although in three of these studies some of the test foods were supplied by commercial companies (Brownlee 2010; Giacco 2013; Tighe 2010‐W). All of the other five studies reported funding or some partial funding by organisations with interests in cereals.
Excluded studies
We excluded two studies because the macronutrient content of the diets was not reported adequately (Chang 2013; Wang 2013). We excluded 13 studies because the length of the intervention was less than 12 weeks (Charlton 2012; Davidson 1991; Johnston 1998; Karmally 2005; Keenan 2002; Kim 2008; Leinonen 2000; McGeoch 2013; Reynolds 2000; Van Horn 1988; Van Horn 1991; Vitaglione 2015; Zhang 2012). This update of the review only included studies with an intervention length of 12 weeks or longer. We also excluded studies that only reported outcomes related to diabetes and measures of glucose and insulin or body weight alone that did not also report lipid or blood pressure outcomes. Consequently, we have excluded some short‐term studies that we included in the original version of this review (Kelly 2007): Davidson 1991, Johnston 1998, Karmally 2005, Keenan 2002, Leinonen 2000, Reynolds 2000, Van Horn 1988, and Van Horn 1991. Additionally, one study in the original review no longer met the inclusion criteria as it did not report relevant outcomes (Pereira 2002). We excluded a further study because reporting of macronutrient intake was insufficient to determine if the diet composition was similar in the intervention and control groups (Pins 2002); this was marked as unclear in the original review, but as we were unable to obtain any further data from the reported supplementary table or from the authors, this study has been excluded for this update. These changes mean that none of the studies in the original review, Kelly 2007, are included in this update.
Risk of bias in included studies
Overview
The reporting of methods was poor, therefore we rated the risk of bias as unclear in the majority of studies (Figure 2; Figure 3).

Risk of bias graph: review authors' judgements about each risk of bias item presented as percentages across all included studies.

Risk of bias summary: review authors' judgements about each risk of bias item for each included study.
Allocation
Seven studies reported an adequate method of randomisation (Brownlee 2010; Giacco 2013; Harris 2014; Katcher 2008; Kristensen 2012; Lankinen 2014; Tighe 2010‐W), but only two of these also clearly reported concealment of allocation to treatment groups (Giacco 2013; Tighe 2010‐W). The remaining studies did not provide information on allocation process.
Blinding
Only three studies reported adequate blinding of outcome assessment (Katcher 2008; Tighe 2010‐W; Zhang 2011). We rated all of the remaining studies as unclear for this domain as no information was provided.
Incomplete outcome data
A number of studies had high levels of dropouts/losses to follow‐up, and reporting of the details of these dropouts was poor. Three studies fully reported numbers and reasons for incomplete data (Katcher 2008; Lankinen 2014; Zhang 2011), whereas five studies had differential dropouts between treatment groups and were therefore rated as at high risk of attrition bias (Brownlee 2010; Giacco 2013; Harris 2014; Maki 2010; Tighe 2010‐W). One study reported an adequate intention‐to‐treat analysis for outcomes of interest to this review (Zhang 2011). One further study provided some data as a modified intention‐to‐treat population, but did not provide this in a format that was useable for the review (baseline values for this population were not reported) (Maki 2010).
Selective reporting
While all studies appeared to report all outcomes as intended, not enough information was available to judge the potential risk of selective reporting bias. Of the nine included studies, eight reported that the study protocol was registered, and one did not report if a protocol was registered (Maki 2010).
Other potential sources of bias
Power
We rated three studies as being at low risk of other sources of bias (Brownlee 2010; Maki 2010; Tighe 2010‐W), as the power calculations were based on relevant outcomes (LDL cholesterol or total cholesterol, or both), and the predicated sample size was met. We rated all of the other studies as unclear on this factor. The remaining six studies based their power calculations on outcomes that were not relevant to this review (Giacco 2013; Harris 2014; Katcher 2008; Kristensen 2012; Lankinen 2014; Zhang 2011), and it is therefore uncertain if they were fully powered to detect a difference in the key outcomes of relevance here.
Compliance to diet
None of the studies specifically reported any problems with compliance to the diets. In one study (Kristensen 2012), the authors reported high compliance with the diet, but this was only reported in 57 of 72 female participants who completed food diaries. The Zhang 2011 study reported mean adherence 90.0 +/‐ 17.1% in the white rice group and 88.7 +/‐ 23.3% in the brown rice group. However, a number of studies reported high levels of dropouts and losses to follow‐up, and full details of reasons for dropout were not fully reported.
Comparability at baseline
Five studies had comparable groups at baseline (Brownlee 2010; Giacco 2013; Harris 2014; Kristensen 2012; Lankinen 2014). The remaining four studies reported some differences between intervention and control for some baseline variables (Katcher 2008; Maki 2010; Tighe 2010‐W; Zhang 2011); it was unclear whether these were of any significance, as they may have occurred by chance. Details are reported in the 'Risk of bias' table in Characteristics of included studies for each study.
Potential confounders
Body weight
Differential changes in body weight between intervention and control groups could lead to differences in lipid levels between groups. However, we found no evidence of differences in body weight between intervention and control groups. Six included studies reported data on body weight, and five of these could be summarised in a meta‐analysis (see Analysis 1.1). The four studies with energy‐restricted diets all showed weight loss in both arms of their studies. In three studies this was greater in the intervention arm (Harris 2014; Kristensen 2012; Maki 2010), and in the fourth study this was greater in the control arm (Katcher 2008). The remaining studies did not show any clear pattern of weight loss between intervention and control groups. There was no difference between groups in the pooled study estimate of weight loss (mean difference (MD) ‐0.41, 95% confidence interval (CI) ‐1.04 to 0.23). In the study that could not be pooled (Brownlee 2010), the median weight change in the whole grain intervention group was a gain of 0.2 (standard deviation (SD) 13.1) kg compared to a zero weight change (SD 13.9) in the control arm. Five studies reported data on the BMI of participants, and there was no difference between groups in the pooled study estimate (MD ‐0.12, 95% CI ‐0.24 to 0.01) (Analysis 1.2).
Dietary fibre
Any reported differences in dietary fibre content between the treatment and control groups have been reported in Table 1. The focus of this review was to assess whether whole grain diets have a beneficial effect on CVD and major risk factors for CVD in order to inform recommendations as to whether more whole grain foods should be included in the diets of the general public. All whole grains contain dietary fibre. Dietary fibre content may potentially be a contributing factor to any differences between whole grain diets and the control diets, but it was not the primary focus of this review.
Effects of interventions
Primary outcomes
We found no studies that reported the effect of whole grain foods or diets on:
-
total cardiovascular mortality; or
-
cardiovascular events (e.g. fatal and non‐fatal myocardial infarction, unstable angina, coronary artery bypass graft surgery, percutaneous transluminal coronary angioplasty, stroke).
Secondary outcomes
Blood lipids
Total cholesterol
Eight studies reported total cholesterol, and data from six studies (seven comparisons) could be summarised in a meta‐analysis (Analysis 1.3). The pooled analysis showed no effect on total cholesterol (MD 0.07, 95% CI ‐0.07 to 0.21; 722 participants; 6 studies (7 comparisons); low‐quality evidence). There was no substantial heterogeneity.
Two studies could not be summarised in the meta‐analysis. In one study this was because data were presented as medians only. In this study there was no difference in total cholesterol between participants in the two whole grain groups and participants in the control group (Brownlee 2010). The remaining study reported percentage change in total cholesterol levels rather than absolute levels, and data were aggregated over all follow‐up points (from 4 to 12 weeks). The data in this study were reported for a per‐protocol population with approximately 24% of participants in the whole grain arm and 35% in the control arm excluded from the analysis (fewer than reported to have completed the study). The authors of this study found that the total cholesterol level was reduced more with whole grain ready‐to‐eat oat cereal than with control (5.4% (standard error (SE) 0.8%) versus 2.9% (SE 0.9%), P = 0.038) during the treatment period (Maki 2010).
LDL cholesterol
Nine studies reported LDL cholesterol, and data from seven studies (eight comparators) could be summarised in a meta‐analysis (Analysis 1.4). The pooled analysis showed that there was no effect on LDL cholesterol (MD 0.06, 95% CI ‐0.05 to 0.16; 770 participants). There was no substantial heterogeneity.
Two studies could not be summarised in the meta‐analysis. In one study this was because data were presented as medians only. In this study there was no difference in LDL cholesterol between participants in the two whole grain groups and participants in the control group (Brownlee 2010). The remaining study reported percentage change in LDL cholesterol levels rather than absolute levels, and data were aggregated over all follow‐up points (from 4 to 12 weeks). The data in this study were reported for a per‐protocol population with approximately 24% of participants in the whole grain arm and 35% in the control arm excluded from the analysis (fewer than reported to have completed the study). The authors of this study found that LDL cholesterol level was reduced more with whole grain ready‐to‐eat oat cereal than with control (8.7% (SE 1.0%) versus 4.3% (SE 1.1%), P = 0.005) during the treatment period (Maki 2010).
HDL cholesterol
Eight studies reported HDL cholesterol, and data from seven studies (eight comparators) could be summarised in a meta‐analysis (Analysis 1.5). The pooled analysis showed no effect on HDL cholesterol (MD ‐0.02, 95% CI ‐0.05 to 0.01; 772 participants). There was no substantial heterogeneity. In the one study that could not be summarised in the meta‐analysis, there were no differences in HDL cholesterol between the whole grain groups and the control group (Brownlee 2010).
Triglycerides
Eight studies reported triglyceride levels, and data from seven studies (eight comparators) could be summarised in a meta‐analysis (Analysis 1.6). The pooled analysis showed no effect on triglycerides (MD 0.03, 95% CI ‐0.08 to 0.13; 771 participants). There was no heterogeneity. In the one study that could not be summarised in the meta‐analysis, there were no differences in triglyceride levels between the whole grain groups and the control group (Brownlee 2010)..
Blood pressure
Systolic blood pressure
Eight studies reported systolic blood pressure, and data from seven studies (eight comparators) could be summarised in a meta‐analysis (Analysis 1.7).The pooled analysis showed no effect on systolic blood pressure (MD 0.04, 95% CI ‐1.67 to 1.75; 768 participants). There was no substantial heterogeneity. In the study that could not be included in the meta‐analysis (Brownlee 2010), there were no effects of whole grain foods compared with the control group.
Diastolic blood pressure
Eight studies reported diastolic blood pressure, and data from seven studies (eight comparators) could be summarised in a meta‐analysis (Analysis 1.8). The pooled analysis showed no effect on diastolic blood pressure (MD 0.16, 95% CI ‐0.89 to 1.21; 768 participants). There was no heterogeneity. In the study that could not be included in the meta‐analysis (Brownlee 2010), there were no effects of whole grain foods compared with the control group.
Quality of life
No studies reported quality of life as an outcome measure, although one study did report measures of satisfaction with the diets (Katcher 2008). There were no differences between intervention and control groups for "sense of a healthy lifestyle", "convenience", "family dynamics", "preoccupation with food", and "negative feelings", but those participants on the whole grain diets did report more (P = 0.04) difficulty with meal planning and preparation.
Adverse events
Two studies reported adverse events. In one study (Maki 2010), the frequencies of adverse events of any type (whether related to the study products or not) were reported to be similar between groups (59.8% for the whole grain group and 52.4% for the control group, P = 0.321). The most common adverse events in both groups were respiratory tract infection, sinusitis, and pharyngitis. Adverse events the authors considered to be related to the study products were: nausea (2 participants in the whole grain oat group), flatulence (2 participants in the whole grain oat group), gastroenteritis (1 participant in the control group), gastroesophageal reflux (1 participant in the control group), and vomiting (1 participant in the control group). Adverse events that led to drop out from the study were an infectious cyst (1 control) and spinal stenosis (1 control), but the study authors did not consider these to be related to the study product. In the Brownlee 2010 study, 3 participants in both whole grain groups (different levels of whole grain) and no participants in the control group reported intolerance to study foods.
Discussion
Summary of main results
This systematic review summarised nine RCTs examining the effect of whole grain foods or diets compared with refined grain foods or a usual diet control on risk factors for cardiovascular disease over 12 weeks or longer. All studies were conducted in primary‐prevention populations. None of the studies reported on our primary outcomes of mortality (total or cardiovascular) or cardiovascular events. The nine included studies reported the effect of whole grain diets on the secondary outcomes of this review, that is lipids or blood pressure, or both. We assessed all included studies as being at high or unclear risk of bias. The duration of the interventions in the included studies ranged from 12 to 16 weeks.
Overall, our meta‐analysis found no differences between whole grain and control groups for any lipid or blood pressure outcomes, with similar macronutrient contents between whole grain and control groups. Weight or BMI (as potential confounders) also did not differ between groups. Heterogeneity was low or non‐substantial.
Overall completeness and applicability of evidence
While there is growing evidence from observational studies that whole grains have benefits for cardiovascular disease, we found insufficient evidence from RCTs of a duration of 12 weeks or longer to draw any conclusions.
We found no studies on the effect of whole grains on CVD mortality or events. The included studies reported lipid and blood pressure outcomes. Only a few trials reported quality of life or adverse events.
We included studies in this review if there was a comparison between a whole grain food or diet and a diet or food containing no whole grains or fewer whole grains. We did not aim to assess the effects of dietary fibre, although any beneficial effects of whole grains may well be associated with the dietary fibre content (Brown 1999). We have reported the dietary fibre content of the foods or diets in Table 1, and, as would be expected, it is consistently higher in the whole grain diets than in the control diets.
Most of the studies reported the effect of predominantly whole grain wheat, with one study reporting oats (Maki 2010), one brown rice (Zhang 2011), and one study reporting the effect of combined whole grain wheat and oats (Tighe 2010‐WO). There is a lack of evidence to date from longer‐term studies (> 12 weeks) of the effect of wholegrain oats. The one trial that studied oats exclusively found reductions in total and LDL cholesterol with whole grain oat cereal compared to the control (Maki 2010). Oats (and barley) also typically contain soluble non‐starch polysaccharide such as β‐glucan, which has been associated with a cholesterol‐lowering effect of oats (Whitehead 2014). Due to the presence of β‐glucan, it is possible that whole grain oats may have differential effects than other whole grains. There is a need for more studies of longer duration on the effect of whole grain oats on CVD and cardiovascular risk factors (the review by Whitehead 2014 included β‐glucan in a range of different forms, not just as whole grain oats). Regarding studies that examined whole grain wheat, there were no differences between whole grain and control groups for individual studies or when studies were pooled in meta‐analysis (Analysis 1.3; Analysis 1.4).
It is possible that body weight change may account for any observed changes in cardiovascular risk factors. While we have reported weight data in this review, most of the studies had insufficient power to measure small changes in weight. We also included studies in the review if the only difference in dietary composition was substitution of refined grains by whole grains, and therefore the macronutrient contents and the overall energy intake of the diets were similar.
Quality of the evidence
Most of the included studies had a number of methodological uncertainties, and all of the included studies were at high or unclear risk of bias. However, heterogeneity was low or non‐substantial. The duration of interventions included in the review was short, sample sizes were small, and many trials had a large number of dropouts. Adverse events were generally not reported. These factors make overall interpretation of the findings of the review difficult.
We aimed to assess the overall quality of the evidence for each primary outcome according to the GRADE approach, which takes into account issues not only related to internal validity (risk of bias, inconsistency, imprecision, publication bias) but also to external validity, such as directness of results. The included studies were RCTs, but they did not report the primary outcomes (n = 6) of this review, therefore we could not assess the overall quality (summary of findings Table 1). For secondary outcomes, we assessed total cholesterol, which we downgraded by two levels: for inconsistency due to variability in the direction of effect (Appendix 1), and for imprecision because "clinical action would differ if the upper versus the lower boundary of the confidence interval represented the truth" (Guyatt 2011)
Potential biases in the review process
We carried out a comprehensive search across major databases for interventions involving whole grains for this review. In addition, we screened the reference lists of systematic reviews and contacted authors for information when needed. Two review authors carried out all screening, inclusion and exclusion, and data abstraction, and one review author conducted analyses, which a second review author checked.
We excluded a number of trials of short duration (< 12 weeks), as we were interested in the sustained and longer‐term effects of increased whole grain intake, which are more relevant to public health interventions. However, this did limit the number of trials eligible for inclusion.
Agreements and disagreements with other studies or reviews
Evidence from two different meta‐analyses of observational cohort studies suggests that those consuming 48 to 80 g/day (3 to 5 servings/day) compared to rare consumers of whole grains (Ye 2012), or 2.5 servings/day compared to 0.2 servings/day, have a 21% lower risk of CVD (Mellen 2008). However, observational studies can be confounded by variables that cannot be controlled or that remain unaccounted for, which can impact on the results. However, to our knowledge there are no previous systematic reviews of RCTs examining the effects of whole grains on CVD risk factors and clinical events. The intervention length in the studies included in this review ranged from 12 to 16 weeks. In contrast, many of the observational studies that report beneficial effects of whole grains have follow‐up periods of many years (Ye 2012).
The current review is limited in its findings. All trials were short term and hence none reported clinical events, and there was insufficient information on CVD risk factors to be able to draw any conclusions about the effect of whole grain diets on cardiovascular health.
Short‐term trials (< 6 weeks) have reported beneficial effects of whole grain oats on lipids (Johnston 1998; Karmally 2005), but these are very short‐term studies, and it is unclear if such effects are sustained over the long term.
Study flow diagram for updated searches 2016.

Risk of bias graph: review authors' judgements about each risk of bias item presented as percentages across all included studies.

Risk of bias summary: review authors' judgements about each risk of bias item for each included study.

Comparison 1: Whole grain versus control, Outcome 1: Body weight change (kg)

Comparison 1: Whole grain versus control, Outcome 2: BMI change

Comparison 1: Whole grain versus control, Outcome 3: Total cholesterol change (mmol/L)

Comparison 1: Whole grain versus control, Outcome 4: LDL cholesterol change (mmol/L)

Comparison 1: Whole grain versus control, Outcome 5: HDL cholesterol change (mmol/L)

Comparison 1: Whole grain versus control, Outcome 6: Triglycerides change (mmol/L)

Comparison 1: Whole grain versus control, Outcome 7: Systolic blood pressure change (mmHg)

Comparison 1: Whole grain versus control, Outcome 8: Diastolic blood pressure (mmHg)
| Whole grain cereals for the primary prevention of cardiovascular disease (no studies were available to examine secondary prevention) | ||||||
| Patient or population: Free‐living adults who were healthy, had established cardiovascular disease or risk factors for cardiovascular disease Control: Refined grains or lower levels of wholegrain | ||||||
| Outcomes | Illustrative comparative risks (95% CI) | Relative effect | No. of participants | Quality of the evidence | Comments | |
|---|---|---|---|---|---|---|
| Assumed risk | Corresponding risk | |||||
| Refined grains or lower levels of whole grain dietary intake | Refined grains or higher levels of whole grain dietary intake | |||||
| Total cardiovascular mortality | See comment | See comment | See comment | See comment | See comment | No trials reported total CVD mortality for the primary prevention of CVD. |
| Fatal and non‐fatal myocardial infarction | See comment | See comment | See comment | See comment | See comment | No trials reported total myocardial infarction for the primary prevention of CVD. |
| Unstable angina | See comment | See comment | See comment | See comment | See comment | No trials reported unstable angina for the primary prevention of CVD. |
| Coronary artery bypass graft surgery | See comment | See comment | See comment | See comment | See comment | No trials reported coronary artery bypass graft surgery for the primary prevention of CVD. |
| Percutaneous transluminal coronary angioplasty | See comment | See comment | See comment | See comment | See comment | No trials reported percutaneous transluminal coronary angioplasty for the primary prevention of CVD. |
| Stroke | See comment | See comment | See comment | See comment | See comment | No trials reported total stroke for the primary prevention of CVD. |
| Total cholesterol change (mmol/L) Follow‐up: 12 to 16 weeks | The mean total cholesterol change ranged across lower levels of whole grain dietary intake groups from ‐0.4 to 0.3. | The mean total cholesterol change (mmol/L) in the intervention groups was 0.07 higher | ‐ | 722 | ⊕⊕⊝⊝ | See Appendix 1 for total cholesterol change checklist. |
| Abbreviations: CI: confidence interval; CVD: cardiovascular disease | ||||||
| GRADE Working Group grades of evidence | ||||||
| 1The term 'whole grain' includes foods based on milled whole grains, such as wholemeal or oatmeal. | ||||||
| Study ID | Dietary component | Whole grain | Control | P value |
|---|---|---|---|---|
| Energy (kJ/day) | Baseline: Not reported Data are change from baseline. Intervention 1 (lower WG) Wk 8: 379 (SD/SEM NR) Wk 16: 387 (SD/SEM NR) Intervention 2 (higher WG) Wk 8: ‐399 (SD/SEM NR) Wk 16: 587 (SD/SEM NR) | Baseline: Not reported Data are change from baseline. Wk 8: ‐430 (SD/SEM NR) Wk 16: ‐679 (SD/SEM NR) | Intervention 1 (lower WG) Wk 8: 0.015 Wk 16: NS Intervention 2 (higher WG) Wk 8: 0.32 Wk 16: 0.005 | |
| Carbohydrate (g/day) | Baseline: Not reported Data are change from baseline. Intervention 1 (lower WG) Wk 8: 22.6 (SD/SEM NR) Wk 16: 37.1 (SD/SEM NR) Intervention 2 (higher WG) Wk 8: 14.8 (SD/SEM NR) Wk 16: 53.8 (SD/SEM NR) | Baseline: Not reported Data are change from baseline. Wk 8: ‐1.97 (SD/SEM NR) Wk 16: ‐14.8 (SD/SEM NR) | Intervention 1 (lower WG) 0.004 0.007 Intervention 2 (higher WG) 0.026 < 0.001 | |
| Fat (g/day) | Baseline: Not reported Data are change from baseline. Intervention 1 (lower WG) Wk 8: 0.245 (SD/SEM NR) Wk 16: ‐2.96 (SD/SEM NR) Intervention 2 (higher WG) Wk 8: ‐8.12 (SD/SEM NR) Wk 16: ‐1.63 (SD/SEM NR) | Baseline: Not reported Data are change from baseline. Wk 8: ‐2.87 (SD/SEM NR) Wk 16: ‐4.05 (SD/SEM NR) | Intervention 1 (lower WG) NS NS Intervention 2 (higher WG) NS NS | |
| Protein (g/day) | Baseline: Not reported Data are change from baseline. Intervention 1 (lower WG) Wk 8: 6.15 (SD/SEM NR) Wk 16: 5.05 (SD/SEM NR) Intervention 2 (higher WG) Wk 8: 1.75 (SD/SEM NR) Wk 16: 6.99 (SD/SEM NR) | Baseline: Not reported Data are change from baseline. Wk 8: ‐3.17 (SD/SEM NR) Wk 16: ‐4.25 (SD/SEM NR) | Intervention 1 (lower WG) NS NS Intervention 2 (higher WG) NS NS | |
| NSP/fibre (g/day) | Baseline: Not reported Data are change from baseline. Intervention 1 (lower WG) Wk 8: 4.69 (SD/SEM NR) Wk 16: 5.70 (SD/SEM NR) Intervention 2 (higher WG) Wk 8: 6.23 (SD/SEM NR) Wk 16: 11.0 (SD/SEM NR) | Baseline: Not reported Data are change from baseline. Wk 8: ‐0.144 (SD/SEM NR) Wk 16: ‐0.438 (SD/SEM NR) | Intervention 1 (lower WG) < 0.001 < 0.001 Intervention 2 (higher WG) < 0.001 < 0.001 | |
| Whole grain (g/day) | Working definition of whole grain product: commercially available whole grain products readily available in the UK, ranging from 34 to 80.8 g/100 g dry weight or 11.2 g cooked weight of whole grain Data approximated from graph; SD/SEM not available. Intervention 1 (lower WG) (mean intake g/day) Wk 8: 75 Wk 16: 70 Intervention 2 (higher WG) (mean intake g/day) Wk 8: 80 Wk 16: 115 | Data taken from graph; SD/SEM not available. < 20 g/day (mean intake g/day) | NR NR | |
| Energy (kilocalories/day) | Baseline: 1702 (SEM 62) Wk 12: 1900 (SEM 57) | Baseline: 1719 (SEM 63) Wk 12: 1965 (SEM 57) | NR NS | |
| Carbohydrate (% E) | Baseline: 46 (SEM 0.6) Wk 12: 48 (SEM 0.6) | Baseline: 48 (SEM 0.7) Wk 12: 49 (SEM 0.6) | NR NS | |
| Fat (% E) | Baseline: 33.5 (SEM 0.6) Wk 12: 31 (SEM 0.7) | Baseline: 31.8 (SEM 0.6) Wk 12: 30.8 (SEM 0.7) | NR NS | |
| Protein (% E) | Baseline: 18 (SEM 0.4) Wk 12: 18.7 (SEM 0.3) | Baseline: 18 (SEM 0.4) Wk 12: 17.8 (SEM 0.3) | NR < 0.05 | |
| Fibre (g/day) | Total fibre Baseline: 22.7 (SEM 0.8) Wk 12: 32.6 (SEM 0.7) Cereal fibre Baseline: 11.9 (SEM 0.8) Wk 12: 24.3 (SEM 0.9) | Total fibre Baseline: 21.6 (SEM 0.8) Wk 12: 19.8 (SEM 0.7) Cereal fibre Baseline: 11.4 (SEM 0.6) Wk 12: 10.4 (SEM 0.3) | NR < 0.05 NR < 0.05 | |
| Whole grain (g/day) Whole grain level (plasma total alkylresorcinol concentration nmol/L) | Study states that Working definition of whole grain: 51% whole grain per day, dry weight was used according to HealthGrain forum definition and analysis of whole grain but no data reported for wholegrain levels. However plasma total alkylresorcinol as a proxy for wholegrain content was reported as below: | NR ‐19.7 (n = 26) | NR 88.3 (n = 28) | |
| Energy (kilocalories/day) | Calculated from menus. All food provided. 86% compliance reported. Mean/day 2079 | Mean/day 2023 | NR | |
| Carbohydrate (g/day) | 299 | 280 | NR | |
| Fat (g/day) | 62 | 64 | NR | |
| Protein (g/day) | 97 | 90 | NR | |
| Fibre (g/day) | 38 | 22 | NR | |
| Whole grain (g/day) | Working definition of whole grain: whole grain products made from milled flour were required to have > 51% of dry weight from whole grain flour. When possible, whole grain products with the 100% whole grain stamp were selected, which indicated that each grain serving contained at least 16 g whole grain and used 100% whole grain flour. Whole grain content of diets ranged from 163 to 301 g/day, as energy content of diets were adjusted for individual requirements. Energy of diets was 1600 to 3600 kilocalories/day. Based on energy intake of 2100 kilocalories/day, typical whole grains supplied were 187 g/day (7 servings/day). | 0 servings/day 0 g/day | NR NR | |
| Energy (kilocalories/day) | Baseline: 1967 (SD 545) Wk 4: 1812 (SD 505) Wk 8: 1744 (SD 533) Wk 12: 1611 (SD 377) | Baseline: 2265 (SD 744) Wk 4: 1616 (SD 468) Wk 8: 1562 (SD 398) Wk 12: 1575 (SD 500) | NS | |
| Carbohydrate (% E) | Baseline: 47.8 (SD 8.3) Wk 4: 54.0 (SD 7.1) Wk 8: 53.9 (SD 9.1) Wk 12: 54.6 (SD 6.8) | Baseline: 47.5 (SD 8.7) Wk 4: 49.6 (SD 10.7) Wk 8: 47.5 (SD 10.2) Wk 12: 49.9 (SD 9.7) | NS | |
| Fat (% E) | Baseline: 35.4 (SD 5.9) Wk 4: 28.7 (SD 6.6) Wk 8: 29.6 (SD 7.2) Wk 12: 27.8 (SD 6.9) | Baseline: 36.2 (SD 6.8) Wk 4: 32.3 (SD 8.4) Wk 8: 33.8 (SD 8.5) Wk 12: 30.5 (SD 8.0) | NS | |
| Protein (% E) | Baseline: 16.9 (SD 3.2) Wk 4: 18.2 (SD 2.7) Wk 8: 18.4 (SD 3.4) Wk 12: 19.1 (SD 4.3) | Baseline: 16.5 (SD 3.2) Wk 4: 18.7 (SD 4.5) Wk 8: 19.2 (SD 4.8) Wk 12: 20.0 (SD 4.8) | NS | |
| Fibre (g/1000 kilocalories) | Baseline: 8.6 (SD 3.7) Wk 4: 12.6 (SD 3.2) Wk 8: 13.3 (SD 3.4) Wk 12: 12.9 (SD 2.2) | Baseline: 9.1 (SD 3.7) Wk 4: 10.0 (SD 3.0) Wk 8: 9.5 (SD 2.0) Wk 12: 9.7 (SD 3.5) | Significant difference between WG and RG at wks 8 and 12 (P < 0.05) | |
| Whole grain (g/day) | Definition of whole grain product: "grain product was identified as a wholegrain if a wholegrain was listed as the first ingredient on the food label". Data taken from graph so approximate: 1 serving whole grain equivalent to 1 slice wholemeal bread, or 28 g (1 oz ready‐to‐eat cereal), or 1/2 cup cooked cereal, rice, or pasta (2005 dietary guidelines for Americans). Baseline: 1.5 servings/day Wk 12: 5 servings/day | Baseline: ~1.5 servings/day Week 12: 0.2 servings/day | NR | |
| Energy (kJ/day) | Wks 1 to 6: 5830 (SEM 190) Wks 7 to 12: 6060 (SEM 150) | Wks 1 to 6: 5900 (SEM 280) Wks 7 to 12: 6330 (SEM 180) | NR NR | |
| Carbohydrate (g/day) | 86.8 | 95.8 | NR | |
| Fat (g/day) | 6.8 | 6.6 | NR | |
| Protein (g/day) | 16.6 | 16.0 | NR | |
| Fibre (g/day) | 11.0 | 4.5 | NR | |
| Whole grain (g/day) Alkylresorcinol (mg/day) | Working definition of whole grain: mean whole grain intake: 105 g/day 25.5 | Mean whole grain intake: 0 g/day AR: 3.1 | NR | |
| Energy (kJ/day) | Baseline: 6995 ± 2373 Wk 12: 7654 ± 2395 | Baseline: 7282 ± 2011 Wk 12: 8533 ± 1693 | 0.119 | |
| Carbohydrate (% E/day) | Baseline: 45.6 ± 6.3 Wk 12: 47.2 ± 7.5 | Baseline: 47.8 ± 5.6 Wk 12: 47.3 ± 5.1 | 0.268 | |
| Fat (% E/day) | Baseline: 33.6 ± 5.2 Wk 12: 3 ± 6.3 | Baseline: 31.3 ± 5.3 Wk 12: 31.9 ± 5.9 | 0.012 | |
| Protein (% E/day) | Baseline: 19.1 ± 3.2 Wk 12: 18.8 ± 2.5 | Baseline: 18.8 ± 3.7 Wk 12: 18.3 ± 2.5 | 0.950 | |
| Fibre (g/day) | Baseline: 24.6 ± 7.0 Wk 12: 26.5 ± 5.4 | Baseline: 22.5 ± 7.0 Wk 12: 18.0 ± 4.2 | 2.7x10⁷ | |
| Whole grain (g/day) | Working definition of whole grain: whole grain breads and a bread with low glycaemic index products covered 20% to 25% of total energy intake and were delivered to the participants. The fibre contents of the breads were 6.9% (endosperm rye bread), 6.4% (whole grain wheat bread), and 10% to 14% (commercial whole grain rye breads). Wholemeal pasta. | Refined wheat breads and other cereal products with low fibre. Participants were allowed to eat maximum of 1 to 2 portions of rye products per day. | ‐ | |
| Energy (kilocalories/day) | Baseline: 1939 (SEM 97) Wk 4: 1563 (SEM 50) Wk 12: 1529 (SEM 44) | Baseline: 1853 (SEM 70) Wk 4: 1395 (SEM 44) Wk 12: 1443 (SEM 45) | 0.690 0.009 0.256 | |
| Carbohydrate (% E) | Baseline: 44.8 (SEM 0.9) Wk 4: 50.6 (SEM 0.9) Wk 12: 52.2 (SEM 0.9) | Baseline: 45.6 (SEM 1.2) Wk 4: 49.8 (SEM 1.0) Wk 12: 49.8 (SEM 1.0) | 0.660 0.625 0.017 | |
| Total fat (% E) | Baseline: 36.9 (SEM 0.8) Wk 4: 30.4 (SEM 0.9) Wk 12: 29.6 (SEM 0.8) | Baseline: 35.6 (SEM 0.8) Wk 4: 30.0 (SEM 0.8) Wk 12: 29.8 (SEM 0.7) | 0.297 0.697 0.718 | |
| Protein (% E) | Baseline: 18.2 (SEM 0.5) Wk 4: 20.1 (SEM 0.5) Wk 12: 19.7 (SEM 0.5) | Baseline: 17.9 (SEM 0.6) Wk 4: 20.0 (SEM 0.6) Wk 12: 20.1 (SEM 0.6) | 0.330 0.971 0.623 | |
| Fibre (g/day) | Baseline: 15.8 (SEM 1.0) Wk 4: 21.0 (SEM 0.5) Wk 12: 21.7 (SEM 0.5) | Baseline: 14.8 (SEM 0.8) Wk 4: 11.8 (SEM 0.6) Wk 12: 12.7 (SEM 0.6) | 0.612 < 0.001 < 0.001 | |
| Whole grain (g/day) | Working definition of whole grain: the whole grain used was a whole grain oat ready‐to‐eat cereal (Cheerios, General Mills, Minneapolis, MN), 2 portions per day (approximately 80 g/day), containing equivalent of 3 g oat β‐glucan. | ‐ | ‐ | |
| Energy (kilocalories/day) | Whole grain wheat group Baseline: 2115 (SEM 64) Wk 12: 2121 (SEM 75) Whole grain wheat + oats group Baseline: 2115 (SEM 58) Wk 12: 2142 (SEM 69) | Baseline: 2036 (SEM 79) Wk 12: 2080 (SEM 83) | Baseline: 0.650 Wk 12: 0.843 | |
| Carbohydrate (g/day) | Whole grain wheat group Baseline: 256 (SEM 9) Wk 12: 253 (SEM 9) Whole grain wheat + oats group Baseline: 252 (SEM 7) Wk 12: 243 (SEM 8) | Baseline: 238 (SEM 10) Wk 12: 245 (SEM 10) | Baseline: 0.324 Wk 12: 0.633 | |
| Fat (g/day) | Whole grain wheat group Baseline: 80.8 (SEM 2.8) Wk 12: 79.7 (SEM 3.3) Whole grain wheat + oats group Baseline: 78.6 (SEM 2.9) Wk 12: 82.1 (SEM 3.5) | Baseline: 78.7 (SEM 3.6) Wk 12: 79.9 (SEM 4.3) | Baseline: 0.847 Wk 12: 0.871 | |
| Protein (g/day) | Whole grain wheat group Baseline: 85.2 (SEM 3.0) Wk 12: 89.1 (SEM 3.5) Whole grain wheat + oats group Baseline: 83.1 (SEM 2.4) Wk 12: 87.0 (SEM 2.8) | Baseline: 81.3 (SEM 2.9) Wk 12: 84.0 (SEM 2.4) | Baseline: 0.627 Wk 12: 0.496 | |
| Fibre (NSP) (g/day) | Whole grain wheat group Baseline: 12.3 (SEM 0.4) Wk 12: 18.5 (SEM 0.5) Whole grain wheat + oats group Baseline: 12.4 (SEM 0.4) Wk 12: 16.8 (SEM 0.5) | Baseline: 10.9 (SEM 0.5) Wk 12: 11.3 (SEM 0.4) | Baseline: 0.049 Wk 12: < 0.001 | |
| Whole grain (g/day) | Working definition of whole grain: not reported Whole grain wheat group 3 servings whole grain foods: 70 to 80 g wholemeal bread and 30 to 40 g whole grain cereals/day Whole grain wheat + oats group 3 servings whole grain foods: 1 serving whole grain wheat products and 2 servings whole grain oat foods/day | ‐ | ‐ | |
| Energy (MJ/day) | Brown rice Baseline: 8.72 (SD 2.30) Wk 4: 8.31 (SD 1.75) Wk 8: 8.05 (SD 1.89) Wk 12: 8.00 (SD 1.86) Wk 16: 8.22 (SD 1.80) | White rice Baseline: 8.65 (SD 2.38) Wk 4: 8.16 (SD 2.23) Wk 8: 8.25 (SD 2.01) Wk 12: 8.46 (SD 2.04) Wk 16: 8.60 (SD 2.01) | ‐ | |
| Carbohydrate (% E) | Brown rice Baseline: 53.9 (SD 7.3) Wk 4: 53.3 (SD 6.5) Wk 8: 52.9 (SD 5.5) Wk 12: 51.8 (SD 7.0) Wk 16: 51.6 (SD 7.3) | White rice Baseline: 54.9 (SD 7.2) Wk 4: 51.8 (SD 6.4) Wk 8: 53.8 (SD 6.3) Wk 12: 52.8 (SD 5.8) Wk 16: 53.3 (SD 6.8) | ‐ | |
| Fat (% E) | Brown rice Baseline: 32.5 (SD 6.7) Wk 4: 32.3 (SD 5.9) Wk 8: 33.0 (SD 4.5) Wk 12: 34.2 (SD 6.4) Wk 16: 35.0 (SD 6.4) | White rice Baseline: 31.7 (SD 6.4) Wk 4: 33.1 (SD 6.2) Wk 8: 31.5 (SD 5.8) Wk 12: 32.7 (SD 5.7) Wk 16: 32.7 (SD 6.6) | ‐ | |
| Protein (% E) | Brown rice Baseline: 15.8 (SD 2.8) Wk 4: 17.2 (SD 2.8) Wk 8: 17.0 (SD 3.1) Wk 12: 16.8 (SD 2.7) Wk 16: 16.1 (SD 2.8) | White rice Baseline: 15.7 (SD 2.7) Wk 4: 17.4 (SD 2.8) Wk 8: 17.0 (SD 2.7) Wk 12: 16.7 (SD 2.4) Wk 16: 16.0 (SD 2.2) | ‐ | |
| Fibre (g/1000 kJ) | Brown rice Baseline: 1.34 (SD 0.49) Wk 4: 1.65 (SD 0.40) Wk 8: 1.69 (SD 0.42) Wk 12: 1.64 (SD 0.42) Wk 16: 1.57 (SD 0.51) | White rice Baseline: 1.32 (SD 0.38) Wk 4: 1.34 (SD 0.42) Wk 8: 1.37 (SD 0.49) Wk 12: 1.28 (SD 0.39) Wk 16: 1.20 (SD 0.39) | ‐ | |
| Whole grain (g/day) | Authors stated that the brown rice was a whole grain in the paper, and Table 1 of the paper reports nutrient comparison of the brown rice versus the white rice used in the study. | ‐ | ‐ | |
| % E: percentage energy | ||||
| Outcome or subgroup title | No. of studies | No. of participants | Statistical method | Effect size |
| 1.1 Body weight change (kg) Show forest plot | 5 | 439 | Mean Difference (IV, Fixed, 95% CI) | ‐0.41 [‐1.04, 0.23] |
| 1.2 BMI change Show forest plot | 5 | 516 | Mean Difference (IV, Fixed, 95% CI) | ‐0.12 [‐0.24, 0.01] |
| 1.3 Total cholesterol change (mmol/L) Show forest plot | 7 | 722 | Mean Difference (IV, Fixed, 95% CI) | 0.07 [‐0.07, 0.21] |
| 1.4 LDL cholesterol change (mmol/L) Show forest plot | 8 | 770 | Mean Difference (IV, Fixed, 95% CI) | 0.06 [‐0.05, 0.16] |
| 1.5 HDL cholesterol change (mmol/L) Show forest plot | 8 | 772 | Mean Difference (IV, Fixed, 95% CI) | ‐0.02 [‐0.05, 0.01] |
| 1.6 Triglycerides change (mmol/L) Show forest plot | 8 | 771 | Mean Difference (IV, Fixed, 95% CI) | 0.03 [‐0.08, 0.13] |
| 1.7 Systolic blood pressure change (mmHg) Show forest plot | 8 | 768 | Mean Difference (IV, Fixed, 95% CI) | 0.04 [‐1.67, 1.75] |
| 1.8 Diastolic blood pressure (mmHg) Show forest plot | 8 | 768 | Mean Difference (IV, Fixed, 95% CI) | 0.16 [‐0.89, 1.21] |