Antiarrítmicos para el mantenimiento del ritmo sinusal después de la cardioversión de la fibrilación auricular
Resumen
Antecedentes
La fibrilación auricular es la arritmia sostenida más frecuente. A menudo se observa la recurrencia de la fibrilación auricular después del restablecimiento del ritmo sinusal normal. Los fármacos antiarrítmicos se han utilizado ampliamente para prevenir la recurrencia. Esta es una actualización de una revisión publicada anteriormente, en 2006, 2012 y 2015.
Objetivos
Determinar los efectos del tratamiento a largo plazo con fármacos antiarrítmicos sobre la muerte, el accidente cerebrovascular, los efectos adversos del fármaco y la recurrencia de la fibrilación auricular en pacientes que han recuperado el ritmo sinusal después de presentar fibrilación auricular.
Métodos de búsqueda
Se actualizaron las búsquedas en CENTRAL, MEDLINE y Embase en enero de 2019; y en ClinicalTrials.gov y WHO ICTRP en febrero de 2019. Se comprobaron listas de referencias de artículos recuperados, revisiones y metanálisis recientes.
Criterios de selección
Dos autores seleccionaron de forma independiente los ensayos controlados aleatorios (ECA) que comparaban cualquier fármaco antiarrítmico con un control (ningún tratamiento, placebo, fármacos para el control de la frecuencia cardíaca) o con otro fármaco antiarrítmico en adultos que presentaban fibrilación auricular y en los que se había restaurado el ritmo sinusal, de forma espontánea o mediante cualquier intervención. Se excluyó la fibrilación auricular posoperatoria.
Obtención y análisis de los datos
Dos autores, de forma independiente, evaluaron la calidad y extrajeron los datos. Se agruparon los estudios, cuando fue apropiado, mediante el uso de los cocientes de riesgos (CR) de Mantel‐Haenszel, con intervalos de confianza (IC) del 95%. Todos los resultados se calcularon al año de seguimiento o en el momento más cercano.
Resultados principales
Esta actualización incluyó un estudio nuevo (100 participantes) y excluyó un estudio previamente incluido debido a la doble publicación. Finalmente, se incluyeron 59 ECA con 20 981 participantes que estudiaron quinidina, disopiramida, propafenona, flecainida, metoprolol, amiodarona, dofetilida, dronedarona y sotalol. En general, la media del seguimiento fue de 10,2 meses.
Mortalidad por todas las causas
La evidencia de alta certeza de cinco ECA indicó que el tratamiento con sotalol se asoció con una tasa mayor de mortalidad por todas las causas en comparación con placebo o ningún tratamiento (CR 2,23; IC del 95%: 1,03 a 4,81; participantes = 1 882). El número necesario a tratar para lograr un resultado perjudicial adicional (NNTD) para el sotalol fue de 102 participantes tratados durante un año para tener una muerte adicional. La evidencia de baja certeza de seis ECA indicó que el riesgo de mortalidad puede ser mayor en los pacientes que reciben quinidina (CR 2,01; IC del 95%: 0,84 a 4,77; participantes = 1 646). La evidencia de certeza moderada mostró un aumento del CR para la mortalidad, aunque con IC muy amplios para el metoprolol (CR 2,02; IC del 95%: 0,37 a 11,05; dos ECA; participantes = 562) y la amiodarona (CR 1,66; IC del 95%: 0,55 a 4,99; dos ECA; participantes = 444), en comparación con placebo.
Se encontró poca o ninguna diferencia en la mortalidad con dofetilida (CR 0,98; IC del 95%: 0,76 a 1,27; evidencia de certeza moderada) o dronedarona (CR 0,86; IC del 95%: 0,68 a 1,09; evidencia de certeza alta) en comparación con placebo o ningún tratamiento. Hubo pocos datos sobre la mortalidad en cuanto a la disopiramida, la flecainida y la propafenona, lo que imposibilitó una estimación fiable para dichos fármacos.
Retiro debidos a eventos adversos
Todos los fármacos analizados aumentaron los retiros debidos a efectos adversos en comparación con placebo o ningún tratamiento (quinidina: CR 1,56; IC del 95%: 0,87 a 2,78; disopiramida: CR 3,68; IC del 95%: 0,95 a 14,24; propafenona: CR 1,62; IC del 95%: 1,07 a 2,46; flecainida: CR 15,41; IC del 95%: 0,91 a 260,19; metoprolol: CR 3,47; IC del 95%: 1,48 a 8,15; amiodarona: CR 6,70; IC del 95%: 1,91 a 23,45; dofetilida: CR 1,77; IC del 95%: 0,75 a 4,18; dronedarona: CR 1,58; IC del 95%: 1,34 a 1,85; sotalol: CR 1,95; IC del 95%: 1,23 a 3,11). La certeza de la evidencia para este resultado fue baja para la disopiramida, la amiodarona, la dofetilida y la flecainida; de moderada a alta para los fármacos restantes.
Proarritmia
Prácticamente todos los antiarrítmicos estudiados mostraron un aumento de los efectos proarrítmicos (contando tanto las taquiarritmias como las bradiarritmias atribuibles al tratamiento) (quinidina: CR 2,05; IC del 95%: 0,95 a 4,41; disopiramida: ningún dato; flecainida: CR 4,80; IC del 95%: 1,30 a 17,77; metoprolol: CR 18,14; IC del 95%: 2,42 a 135,66; amiodarona: CR 2,22; IC del 95%: 0,71 a 6,96; dofetilida: CR 5,50; IC del 95%: 1,33 a 22,76; dronedarona: CR 1,95; IC del 95%: 0,77 a 4,98; sotalol: CR 3,55; IC del 95%: 2,16 a 5,83); con la excepción de la propafenona (CR 1,32; IC del 95%: 0,39 a 4,47) para la cual la certeza de la evidencia fue muy baja y no hubo certeza sobre el efecto. La certeza de la evidencia para este resultado para los otros fármacos fue de moderada a alta.
Accidente cerebrovascular
Once estudios informaron los resultados del accidente cerebrovascular con quinidina, disopiramida, flecainida, amiodarona, dronedarona y sotalol. La evidencia de alta certeza de dos ECA indicó que la dronedarona puede asociarse con un menor riesgo de accidente cerebrovascular (CR 0,66; IC del 95%: 0,47 a 0,95; participantes = 5 872). Este resultado se atribuye a un estudio que domina el metanálisis y aún no se ha reproducido en otros estudios. No hubo efectos aparentes sobre las tasas de accidentes cerebrovasculares con los otros antiarrítmicos.
Recurrencia de la fibrilación auricular
La evidencia de certeza moderada a alta, con la excepción de la disopiramida, para la cual hubo evidencia de baja certeza, mostró que todos los fármacos analizados, incluido el metoprolol, redujeron la recurrencia de la fibrilación auricular (quinidina: CR 0,83; IC del 95%: 0,78 a 0,88; disopiramida: CR 0,77; IC del 95%: 0,59 a 1,01; propafenona: CR 0,67; IC del 95%: 0,61 a 0,74; flecainida: CR 0,65; IC del 95%: 0,55 a 0,77; metoprolol: CR 0,83; IC del 95%: 0,68 a 1,02; amiodarona: CR 0,52; IC del 95%: 0,46 a 0,58; dofetilida: CR 0,72; IC del 95%: 0,61 a 0,85; dronedarona: CR 0,85; IC del 95%: 0,80 a 0,91; sotalol: CR 0,83; IC del 95%: 0,80 a 0,87). A pesar de esta reducción, aún se observó la recurrencia de la fibrilación auricular en el 43% al 67% de los pacientes tratados con antiarrítmicos.
Conclusiones de los autores
Existe evidencia de alta certeza de un aumento de la mortalidad asociada con el tratamiento con sotalol, y evidencia de baja certeza que indica un aumento de la mortalidad con quinidina, cuando se utiliza para mantener el ritmo sinusal en los pacientes con fibrilación auricular. Se encontraron pocos datos sobre la mortalidad en los pacientes que recibieron disopiramida, flecainida y propafenona, por lo que no fue posible realizar una estimación fiable del riesgo de mortalidad para estos fármacos. Sin embargo, se encontró evidencia de certeza moderada de aumentos marcados en la proarritmia y de efectos adversos con flecainida.
En general, hay evidencia que indica que los fármacos antiarrítmicos aumentan los eventos adversos, aumentan los eventos proarrítmicos y algunos antiarrítmicos pueden aumentar la mortalidad. Por el contrario, aunque reducen las recurrencias de la fibrilación auricular, no hay evidencia de ningún beneficio en otros resultados clínicos, en comparación con placebo o ningún tratamiento.
PICO
Resumen en términos sencillos
Antiarrítmicos para mantener el ritmo sinusal (latidos cardíacos normales) después de revertir la fibrilación auricular (corrección de un latido cardíaco irregular)
Pregunta de la revisión
Se examinó la evidencia acerca del efecto de los fármacos antiarrítmicos sobre la mortalidad (muerte), el accidente cerebrovascular, los efectos secundarios que dan lugar a que los pacientes dejen de tomar el medicamento y las recurrencias de latidos cardíacos irregulares, en pacientes que habían recuperado el ritmo cardíaco normal después de haber presentado fibrilación auricular (un tipo de latido cardíaco irregular).
Antecedentes
La fibrilación auricular es una enfermedad en la que el ritmo cardíaco es irregular (llamado arritmia) y a menudo, aunque no siempre, demasiado rápido. La fibrilación auricular puede producir complicaciones, ya sea en el corazón (insuficiencia cardíaca, desmayos) o en otros órganos al causar embolias. Las embolias son coágulos de sangre que se forman en las cavidades del corazón y que luego pueden trasladarse a otros lugares, por ejemplo al cerebro.
La fibrilación auricular puede revertirse, con restitución del ritmo cardíaco normal, mediante el uso de fármacos o un choque eléctrico controlado. Sin embargo, un problema importante es que la fibrilación auricular reaparece con frecuencia. Se ha utilizado una variedad de medicamentos para evitar estas recurrencias y mantener el ritmo cardíaco normal.
Características de los estudios
Esta es una actualización de una revisión publicada previamente en 2006; 2012 y 2015; e incluye los resultados de una búsqueda de nuevos estudios en enero de 2019. Se encontraron 59 estudios que evaluaron diversos fármacos antiarrítmicos y que incluían a 20 981 participantes. La edad promedio de los participantes fue de 65 años. Las enfermedades más frecuentes fueron la hipertensión (presión arterial alta) y las enfermedades de las arterias y las válvulas del corazón. Se encontraron estudios para nueve medicamentos: quinidina, disopiramida, propafenona, flecainida, metoprolol, amiodarona, dofetilida, dronedarona y sotalol.
Resultados clave y certeza de la evidencia
La evidencia de alta certeza de cinco estudios encontró que las muertes por cualquier causa fueron dos veces mayores en los pacientes que recibieron sotalol en comparación con los pacientes que recibieron placebo (tratamiento simulado) o ningún tratamiento. Se calcula que una persona extra moriría por cada 102 pacientes que reciben sotalol durante un año. La evidencia para la quinidina fue de baja certeza, aunque el efecto promedio a través de seis estudios indicó que los pacientes que recibieron quinidina pueden tener un mayor riesgo de muerte en comparación con los pacientes que recibieron ningún tratamiento o placebo. Sin embargo, la evidencia no fue lo suficientemente sólida para descartar la posibilidad de que no hubiera un mayor riesgo de muerte con quinidina. Se encontraron pocos datos sobre la mortalidad en cuanto a la disopiramida, la flecainida y la propafenona, lo que significa que no se conoce el efecto de estos fármacos sobre la mortalidad. No se encontró evidencia clara de que los otros fármacos estudiados tuvieran algún efecto sobre el riesgo de muerte.
Se encontró que los pacientes que recibieron cualquiera de estos fármacos fueron más propensos a dejar de tomarlos debido a los efectos secundarios, en comparación con los pacientes que no los recibieron. Existe menos certeza en cuanto a los resultados para la disopiramida, la amiodarona, la dofetilida y la flecainida debido a que la evidencia de baja certeza proviene principalmente de estudios pequeños con limitaciones de diseño. La evidencia fue moderada o alta para los otros fármacos.
Un efecto secundario particular de los medicamentos antiarrítmicos es la proarritmia, que significa que los pacientes tienen problemas nuevos o más frecuentes que incluyen latidos irregulares del corazón. Se encontró evidencia de alta certeza de que los pacientes que recibieron quinidina o metoprolol tuvieron un riesgo mayor de proarritmia que los pacientes que recibieron ningún tratamiento o placebo. La evidencia de certeza moderada indicó un aumento similar del riesgo en cuanto a la flecainida, la amiodarona, la dofetilida, la dronedarona y el sotalol. La evidencia de estos estudios fue de certeza moderada debido a problemas con las limitaciones del estudio, el tamaño más pequeño o los resultados imprecisos. No se conoce el efecto de la propafenona sobre la proarritmia, debido a que solo se dispone de evidencia de muy baja certeza para este fármaco. Ninguno de los estudios de la disopiramida informó cuántos pacientes tenían proarritmia.
Se encontró evidencia de alta certeza de que la dronedarona puede reducir el riesgo de accidente cerebrovascular. No hubo evidencia de un efecto del sotalol (evidencia de certeza moderada); la amiodarona, la flecainida, la quinidina (evidencia de certeza baja) o la disopiramida (evidencia de certeza muy baja) sobre el riesgo de accidente cerebrovascular. Ningún estudio informó del riesgo de accidente cerebrovascular con propafenona, metoprolol o dofetilida.
La evidencia de certeza moderada a alta, excepto por la de la disopiramida, que fue de baja certeza, mostró que todos los fármacos que se evaluaron redujeron la recurrencia de la fibrilación auricular, en comparación con ningún tratamiento o un placebo. Sin embargo, aún se observó la recurrencia de la fibrilación auricular en aproximadamente la mitad de los participantes (43% a 67%) tratados con antiarrítmicos.
En general, no está claro si el tratamiento a largo plazo con medicamentos antiarrítmicos tiene beneficios que superen los riesgos para este grupo de pacientes.
Authors' conclusions
Summary of findings
| Quinidine compared to placebo or no treatment for maintaining sinus rhythm after cardioversion of atrial fibrillation | ||||||
| Patient or population: adults in sinus rhythm after cardioversion of atrial fibrillation | ||||||
| Outcomes | Anticipated absolute effects* (95% CI) | Relative effect | № of participants | Certainty of the evidence | Comments | |
| Risk with placebo or no treatment | Risk with quinidine | |||||
| All‐cause mortality | Study population | RR 2.01 | 1646 | ⊕⊕⊝⊝ | — | |
| 8 per 1000 | 15 per 1000 | |||||
| Withdrawals due to adverse effects | Study population | RR 1.56 (0.87 to 2.78) | 1669 | ⊕⊕⊕⊝ | Heterogeneity was high for the main analysis (I2 = 67%), but the test for subgroup differences indicated that the RR was higher in older studies which used a higher dose. | |
| 163 per 1000 | 254 per 1000 (142 to 452) | |||||
| Proarrhythmia | Study population | RR 2.05 | 1676 | ⊕⊕⊕⊕ | — | |
| 11 per 1000 | 22 per 1000 | |||||
| Stroke | Study population | RR 0.97 | 1107 | ⊕⊕⊝⊝ | — | |
| 5 per 1000 | 5 per 1000 | |||||
| Recurrence of atrial fibrillation | Study population | RR 0.83 | 1624 | ⊕⊕⊕⊕ | — | |
| 80.5 per 100 | 66.8 per 100 | |||||
| *The risk in the intervention group (and its 95% confidence interval) is based on the assumed risk in the comparison group and the relative effect of the intervention (and its 95% CI). CI: confidence interval; RCT: randomised controlled trial; RR: risk ratio. | ||||||
| GRADE Working Group grades of evidence | ||||||
| aDowngraded one level for study limitations: majority of studies were at low or unclear risk of bias for at least one of the key domains (allocation concealment, blinding, incomplete outcome data). | ||||||
| Disopyramide compared to placebo or no treatment for maintaining sinus rhythm after cardioversion of atrial fibrillation | ||||||
| Patient or population: adults in sinus rhythm after cardioversion of atrial fibrillation | ||||||
| Outcomes | Anticipated absolute effects* (95% CI) | Relative effect | № of participants | Certainty of the evidence | Comments | |
| Risk with placebo or no treatment | Risk with disopyramide | |||||
| All‐cause mortality | Study population | RR 5.00 | 92 | ⊕⊝⊝⊝ | Anticipated absolute effects per 1000 could not be calculated because there were no deaths in the control group. Risks were the data from the RCT. | |
| 0/71 | 5/75 | |||||
| Withdrawals due to adverse effects | Study population | RR 3.68 | 146 | ⊕⊕⊝⊝ | — | |
| 28 per 1000 | 104 per 1000 | |||||
| Proarrhythmia | — | — | — | — | — | Not reported |
| Stroke | Study population | RR 0.31 | 146 | ⊕⊝⊝⊝ | — | |
| 28 per 1000 | 9 per 1000 | |||||
| Recurrence of atrial fibrillation | Study population | RR 0.77 | 146 | ⊕⊕⊝⊝ | — | |
| 69.0 per 100 | 53.1 per 100 | |||||
| *The risk in the intervention group (and its 95% confidence interval) is based on the assumed risk in the comparison group and the relative effect of the intervention (and its 95% CI). CI: confidence interval; RCT: randomised controlled trial; RR: risk ratio. | ||||||
| GRADE Working Group grades of evidence | ||||||
| aDowngraded one level for study limitations: both studies had unclear risk of bias for one of the key domains. | ||||||
| Propafenone compared to placebo or no treatment for maintaining sinus rhythm after cardioversion of atrial fibrillation | ||||||
| Patient or population: adults in sinus rhythm after cardioversion of atrial fibrillation | ||||||
| Outcomes | Anticipated absolute effects* (95% CI) | Relative effect | № of participants | Certainty of the evidence | Comments | |
| Risk with placebo or no treatment | Risk with propafenone | |||||
| All‐cause mortality | Study population | RR 0.19 | 212 | ⊕⊝⊝⊝ | Very few data available for this outcome: only 2 deaths reported in 5 included RCTs. | |
| 26 per 1000 | 5 per 1000 | |||||
| Withdrawals due to adverse effects | Study population | RR 1.62 | 1098 | ⊕⊕⊕⊝ | — | |
| 61 per 1000 | 99 per 1000 | |||||
| Proarrhythmia | Study population | RR 1.32 | 381 | ⊕⊝⊝⊝ | — | |
| 13 per 1000 | 17 per 1000 | |||||
| Stroke | — | — | — | — | — | Not reported |
| Recurrence of atrial fibrillation | Study population | RR 0.67 | 1098 | ⊕⊕⊕⊝ | — | |
| 73.0 per 100 | 48.9 per 100 | |||||
| *The risk in the intervention group (and its 95% confidence interval) is based on the assumed risk in the comparison group and the relative effect of the intervention (and its 95% CI). CI: confidence interval; RCT: randomised controlled trial; RR: risk ratio. | ||||||
| GRADE Working Group grades of evidence | ||||||
| aDowngraded one level for study limitations. All studies had unclear or high risk of bias in at least one of the three key domains (allocation concealment, blinding, incomplete outcome data). | ||||||
| Flecainide compared to placebo or no treatment for maintaining sinus rhythm after cardioversion of atrial fibrillation | ||||||
| Patient or population: adults in sinus rhythm after cardioversion of atrial fibrillation | ||||||
| Outcomes | Anticipated absolute effects* (95% CI) | Relative effect | № of participants | Certainty of the evidence | Comments | |
| Risk with placebo or no treatment | Risk with flecainide | |||||
| All‐cause mortality | — | — | — | — | — | Not reported |
| Withdrawals due to adverse effects | Study population | RR 15.41 | 73 | ⊕⊕⊝⊝ | Anticipated absolute effects per 1000 could not be calculated because there were no withdrawals in the control group. Risks were the data from the RCT. | |
| 0/37 | 7/36 | |||||
| Proarrhythmia | Study population | RR 4.80 | 511 | ⊕⊕⊕⊝ | — | |
| 6 per 1000 | 30 per 1000 | |||||
| Stroke | Study population | RR 2.04 | 362 | ⊕⊕⊝⊝ | Anticipated absolute effects per 1000 could not be calculated because there were no strokes in the control group. Risks were the data from the RCT. | |
| 0/81 | 3/281 | |||||
| Recurrence of atrial fibrillation | Study population | RR 0.65 | 511 | ⊕⊕⊕⊕ | — | |
| 69.8 per 100 | 45.4 per 100 | |||||
| *The risk in the intervention group (and its 95% confidence interval) is based on the assumed risk in the comparison group and the relative effect of the intervention (and its 95% CI). CI: confidence interval; RCT: randomised controlled trial; RR: risk ratio. | ||||||
| GRADE Working Group grades of evidence | ||||||
| aNot downgraded for study limitations. the only included study was at high risk of bias for blinding (less relevant for this outcome) but low risk for other key domains. | ||||||
| Metoprolol compared to placebo or no treatment for maintaining sinus rhythm after cardioversion of atrial fibrillation | ||||||
| Patient or population: adults in sinus rhythm after cardioversion of atrial fibrillation | ||||||
| Outcomes | Anticipated absolute effects* (95% CI) | Relative effect | № of participants | Certainty of the evidence | Comments | |
| Risk with placebo or no treatment | Risk with Metoprolol | |||||
| All‐cause mortality | Study population | RR 2.02 | 562 | ⊕⊕⊕⊝ | — | |
| 4 per 1000 | 7 per 1000 | |||||
| Withdrawals due to adverse effects | Study population | RR 3.47 | 562 | ⊕⊕⊕⊕ | — | |
| 21 per 1000 | 74 per 1000 | |||||
| Proarrhythmia | Study population | RR 18.14 | 562 | ⊕⊕⊕⊕ | Anticipated absolute effects per 1000 could not be calculated because there were no events in the control group. Risks are the data from the RCTs. | |
| 0 / 282 | 17 / 280 | |||||
| Stroke | — | — | — | — | — | Not reported |
| Recurrence of atrial fibrillation | Study population | RR 0.83 (0.68 to 1.02) | 562 | ⊕⊕⊕⊝ | — | |
| 72.0 per 100 | 59.7 per 100 | |||||
| *The risk in the intervention group (and its 95% confidence interval) is based on the assumed risk in the comparison group and the relative effect of the intervention (and its 95% CI). CI: confidence interval; RCT: randomised controlled trial; RR: risk ratio. | ||||||
| GRADE Working Group grades of evidence | ||||||
| aDowngraded one level for imprecision. Confidence intervals included both possible harm and possible benefit. | ||||||
| Amiodarone compared to placebo or no treatment for maintaining sinus rhythm after cardioversion of atrial fibrillation | ||||||
| Patient or population: adults in sinus rhythm after cardioversion of atrial fibrillation | ||||||
| Outcomes | Anticipated absolute effects* (95% CI) | Relative effect | № of participants | Certainty of the evidence | Comments | |
| Risk with placebo or no treatment | Risk with amiodarone | |||||
| All‐cause mortality | Study population | RR 1.66 | 444 | ⊕⊕⊕⊝ | — | |
| 26 per 1000 | 43 per 1000 | |||||
| Withdrawals due to adverse effects | Study population | RR 6.70 | 319 | ⊕⊕⊝⊝ | — | |
| 7 per 1000 | 49 per 1000 | |||||
| Proarrhythmia | Study population | RR 2.22 | 673 | ⊕⊕⊕⊝ | — | |
| 8 per 1000 | 18 per 1000 | |||||
| Stroke | Study population | RR 1.15 | 399 | ⊕⊕⊝⊝ | — | |
| 23 per 1000 | 26 per 1000 | |||||
| Recurrence of atrial fibrillation | Study population | RR 0.52 | 812 | ⊕⊕⊕⊕ | — | |
| 81.2 per 100 | 42.2 per 100 | |||||
| *The risk in the intervention group (and its 95% confidence interval) is based on the assumed risk in the comparison group and the relative effect of the intervention (and its 95% CI). CI: confidence interval; RCT: randomised controlled trial; RR: risk ratio. | ||||||
| GRADE Working Group grades of evidence | ||||||
| aDowngraded one level for imprecision: confidence interval included both possible benefit and harm. | ||||||
| Dofetilide compared to placebo or no treatment for maintaining sinus rhythm after cardioversion of atrial fibrillation | ||||||
| Patient or population: adults in sinus rhythm after cardioversion of atrial fibrillation | ||||||
| Outcomes | Anticipated absolute effects* (95% CI) | Relative effect | № of participants | Certainty of the evidence | Comments | |
| Risk with placebo or no treatment | Risk with dofetilide | |||||
| All‐cause mortality | Study population | RR 0.98 | 1183 | ⊕⊕⊕⊝ | — | |
| 193 per 1000 | 189 per 1000 | |||||
| Withdrawals due to adverse effects | Study population | RR 1.77 | 677 | ⊕⊕⊝⊝ | — | |
| 34 per 1000 | 61 per 1000 | |||||
| Proarrhythmia | Study population | RR 5.50 | 1183 | ⊕⊕⊕⊝ | — | |
| 2 per 1000 | 13 per 1000 | |||||
| Stroke | — | — | — | — | — | Not reported |
| Recurrence of atrial fibrillation | Study population | RR 0.72 (0.61 to 0.85) | 1183 | ⊕⊕⊕⊝ | — | |
| 84.2 per 100 | 60.6 per 100 | |||||
| *The risk in the intervention group (and its 95% confidence interval) is based on the assumed risk in the comparison group and the relative effect of the intervention (and its 95% CI). CI: confidence interval; RCT: randomised controlled trial; RR: risk ratio. | ||||||
| GRADE Working Group grades of evidence | ||||||
| aDowngraded one level for study limitations: majority of studies had unclear risk of selection bias. | ||||||
| Dronedarone compared to placebo or no treatment for maintaining sinus rhythm after cardioversion of atrial fibrillation | ||||||
| Patient or population: adults in sinus rhythm after cardioversion of atrial fibrillation | ||||||
| Outcomes | Anticipated absolute effects* (95% CI) | Relative effect | № of participants | Certainty of the evidence | Comments | |
| Risk with placebo or no treatment | Risk with dronedarone | |||||
| All‐cause mortality | Study population | RR 0.86 | 6071 | ⊕⊕⊕⊕ | — | |
| 51 per 1000 | 44 per 1000 | |||||
| Withdrawals due to adverse effects | Study population | RR 1.58 | 6071 | ⊕⊕⊕⊝ | — | |
| 77 per 1000 | 122 per 1000 | |||||
| Proarrhythmia | Study population | RR 1.95 (0.77 to 4.98) | 5872 | ⊕⊕⊕⊝ | — | |
| 18 per 1000 | 36 per 1000 | |||||
| Stroke | Study population | RR 0.66 | 5872 | ⊕⊕⊕⊕ | — | |
| 27 per 1000 | 18 per 1000 | |||||
| Recurrence of atrial fibrillation | Study population | RR 0.85 | 1443 | ⊕⊕⊕⊝ | — | |
| 76.6 per 100 | 65.1 per 100 | |||||
| *The risk in the intervention group (and its 95% confidence interval) is based on the assumed risk in the comparison group and the relative effect of the intervention (and its 95% CI). CI: confidence interval; RCT: randomised controlled trial; RR: risk ratio. | ||||||
| GRADE Working Group grades of evidence | ||||||
| aDowngraded one level for study limitations: 83% of weight came from a study with unclear blinding, which could be relevant to this outcome. | ||||||
| Sotalol compared to placebo or no treatment for maintaining sinus rhythm after cardioversion of atrial fibrillation | ||||||
| Patient or population: adults in sinus rhythm after cardioversion of atrial fibrillation | ||||||
| Outcomes | Anticipated absolute effects* (95% CI) | Relative effect | № of participants | Certainty of the evidence | Comments | |
| Risk with placebo or no treatment | Risk with sotalol | |||||
| All‐cause mortality | Study population | RR 2.23 | 1882 | ⊕⊕⊕⊕ | — | |
| 8 per 1000 | 19 per 1000 | |||||
| Withdrawals due to adverse effects | Study population | RR 1.95 (1.23 to 3.11) | 2688 | ⊕⊕⊕⊝ | Heterogeneity was high for the main analysis (I2 = 56%), but the test for subgroup differences indicated that the RR was higher in older studies with sotalol. | |
| 94 per 1000 | 183 per 1000 | |||||
| Proarrhythmia | Study population | RR 3.55 | 2989 | ⊕⊕⊕⊝ | — | |
| 12 per 1000 | 41 per 1000 | |||||
| Stroke | Study population | RR 1.47 | 1161 | ⊕⊕⊕⊝ | — | |
| 7 per 1000 | 10 per 1000 | |||||
| Recurrence of atrial fibrillation | Study population | RR 0.83 | 3179 | ⊕⊕⊕⊕ | — | |
| 78.8 per 100 | 65.4 per 100 | |||||
| *The risk in the intervention group (and its 95% confidence interval) is based on the assumed risk in the comparison group and the relative effect of the intervention (and its 95% CI). CI: confidence interval; RCT: randomised controlled trial; RR: risk ratio. | ||||||
| GRADE Working Group grades of evidence | ||||||
| aNot downgraded for study limitations. Although the majority of studies had unclear or high risk of bias in at least one of the key domains, the majority of the weight was from studies at low risk of bias in key domains. | ||||||
Background
Description of the condition
Atrial fibrillation is the most common sustained arrhythmia and its incidence increases substantially with age (Go 2001; Knuiman 2014; Ruigomez 2002). Atrial fibrillation is associated with increased morbidity and mortality, due to stroke, other embolic complications and heart failure (Benjamin 1998; Heeringa 2006; Krahn 1995; Stewart 2002). In high‐income countries, atrial fibrillation has grown progressively since the 1990s as a contributing cause of hospitalisation and death (Ayala 2003; Chugh 2014; Wattigney 2003).
In people who have atrial fibrillation, normal sinus rhythm is interrupted by periods of atrial fibrillation that may be either symptomatic or asymptomatic. Symptoms can be mild (e.g. palpitations, breathlessness or reduced effort capacity) or severe, causing syncope, heart failure or acute coronary syndrome. Many of the symptoms caused by atrial fibrillation are related to the degree of tachycardia and can be improved by either controlling heart rate (rate control strategy) or converting atrial fibrillation to normal sinus rhythm by electrical or pharmacological means (rhythm control strategy).
Most patients alternate between atrial fibrillation and sinus rhythm. The frequency and duration of atrial fibrillation are highly variable, both within patients and between patients, and are employed to classify this arrhythmia (AHA/ACC/HRS 2014; ESC 2016; NICE 2014). If the arrhythmia terminates spontaneously, atrial fibrillation is designated as 'paroxysmal', and it may or may not recur. When atrial fibrillation is sustained beyond seven days, it is designated as 'persistent'. Termination with pharmacological or electrical intervention does not change the designation. When atrial fibrillation is first detected, and it is not known if it will resolve or persist, it is designated 'recent‐onset' or simply 'first‐detected' atrial fibrillation. Finally, 'permanent' atrial fibrillation refers to persistent atrial fibrillation where cardioversion has failed or has not been attempted because it is considered that there is no possibility to restore sinus rhythm. An individual patient can show different classes of atrial fibrillation over time.
Description of the intervention
Many patients recover sinus rhythm spontaneously after an episode of recent‐onset atrial fibrillation, as many as 70% in some studies (Geleris 2001). Electrical and pharmacological cardioversion are very effective in restoring sinus rhythm, even in long‐standing persistent atrial fibrillation. However, one major problem is that recurrence of atrial fibrillation occurs frequently. The risk of recurrence of atrial fibrillation is dependent on age, duration of the atrial fibrillation, and the existence and severity of underlying heart disease (Flaker 1995; Frick 2001). The overall rate of recurrence of atrial fibrillation without treatment is high; of patients who have converted to sinus rhythm, only 20% to 30% will have remained in sinus rhythm one year later (AFFIRM 2002; Golzari 1996; Van Gelder 1996).
Long‐term antiarrhythmic therapy has been widely used to prevent the recurrence of atrial fibrillation. Antiarrhythmic drugs are usually grouped into four classes following the classification by Vaughan Williams (Vaughan Williams 1984). Class I drugs are those with a direct membrane action (sodium channel blockade), subdivided to Ia, Ib and Ic depending on specific effects on conduction and repolarisation; class II drugs are beta‐blockers; class III drugs are those that prolong repolarisation; and class IV drugs are calcium channel blockers. There is evidence that several class I, class III and maybe class II antiarrhythmic drugs are more effective than placebo for maintaining sinus rhythm (Miller 2000; Nichol 2002). However, some questions remain concerning the long‐term use of antiarrhythmic drugs.
How the intervention might work
It has been assumed that keeping patients in sinus rhythm would improve their quality of life and reduce the risks of embolism, stroke, heart failure or increased mortality that are associated with atrial fibrillation (Anter 2009). However, this has not been confirmed and, unfortunately, many of the trials with antiarrhythmic drugs have focused only on maintenance of sinus rhythm and have not assessed other relevant outcomes (Connolly 2000). Overall, rhythm control strategy, using antiarrhythmics to maintain sinus rhythm, has shown no clear benefit on clinical outcomes (e.g. mortality or stroke) in randomised controlled trials (RCTs) compared to a rate control strategy (Caldeira 2012; Chatterjee 2013; Sethi 2017).
Chronic treatment with antiarrhythmic drugs can be associated with severe adverse effects, including the potential induction of life‐threatening arrhythmias (a phenomenon called proarrhythmia). Adverse effects could compromise any benefits of maintaining sinus rhythm, or even outweigh them, leading to worse outcomes overall. In fact, the results of some trials show increased mortality associated with the long‐term use of some antiarrhythmics, as in the case with quinidine (Coplen 1990; SPAF 1992), or flecainide (CAST 1991). Finally, it is not known if all antiarrhythmic drugs are equivalent in their effectiveness and safety in the treatment of atrial fibrillation.
Why it is important to do this review
Many trials have studied long‐term treatment with diverse antiarrhythmic drugs for maintaining sinus rhythm, sometimes compared to placebo and sometimes compared to other antiarrhythmic drugs. Attempts to summarise this evidence in systematic reviews of trials or meta‐analyses have been incomplete. They were combined in one narrative review (Golzari 1996); trials using different antiarrhythmics and with very dissimilar lengths of treatment were pooled together (Nichol 2002); and outcomes other than sinus rhythm maintenance were not evaluated (Miller 2000). Consequently, we planned to conduct a more exhaustive systematic review of RCTs studying the long‐term use of antiarrhythmic drugs to maintain sinus rhythm and aimed to determine their effects not only on the recurrence of atrial fibrillation but also on other important clinical outcomes.
After the first publication of this review, another meta‐analysis on the same subject was published by Freemantle and colleagues (Freemantle 2011). The meta‐analysis employed a mixed treatment comparison method, combining the estimates obtained from direct and indirect comparisons in a network of trials. Network meta‐analysis represents an interesting extension of traditional pair‐wise meta‐analyses and can potentially provide a more complete overview of a health set. However, appropriate use of these methods requires strict assumptions and standardisation (Caldwell 2015). Although assumptions underlying classical pair‐wise meta‐analyses are well understood, the conduction of network meta‐analysis still poses multiple challenges that should be carefully considered when using such methods (Cipriani 2013; Tonin 2017).
In any case, after the first publication of this review in 2007 and the publication of the meta‐analysis by Freemantle 2011, several new RCTs have been published. We have systematically searched, assessed and, when found adequate, included any new trial in this domain in the successive updates of this review.
Objectives
To determine the effects of long‐term treatment with antiarrhythmic drugs on death, stroke, drug adverse effects and recurrence of atrial fibrillation in people who have recovered sinus rhythm after having atrial fibrillation.
The primary aim was to assess the effects of any antiarrhythmic drug compared with no antiarrhythmic treatment, that is, no treatment, placebo or treatment for rate control. If several antiarrhythmic drugs appeared to be effective the secondary aim was to compare them.
Methods
Criteria for considering studies for this review
Types of studies
RCTs with concealed allocation of participants to intervention or placebo. We excluded studies that were not randomised or that used an overt allocation method, where future assignments could be anticipated (e.g. by date, by entry number, alternating or rotating). We also excluded cross‐over studies (as the recurrence rate of atrial fibrillation is not uniform over time), cluster‐randomised studies (more prone to selection bias and to local variations in other intervention applied to people with atrial fibrillation) and studies where duration of follow‐up was less than six months.
Types of participants
Adults (aged more than 16 years) who had atrial fibrillation of any type and duration and in whom sinus rhythm had been restored, spontaneously or by any therapeutic intervention.
We excluded people with atrial fibrillation following cardiac surgery and people with any condition causing a life expectancy of less than 12 months.
Types of interventions
To be included, studies must have randomly allocated participants to an intervention group or a control group. The intervention group must have received oral long‐term treatment with any available antiarrhythmic drug, at an appropriate dosing regimen, aimed at preventing new episodes of atrial fibrillation and maintaining sinus rhythm.
For the primary comparison of the review, the control group was no active treatment, this is, any of the following: placebo, no treatment or drugs for rate control (digoxin, calcium channel blockers, beta‐blockers).
For the secondary objective of evaluating differences between antiarrhythmic drugs, the control group could have been any of the other antiarrhythmic drugs that have shown effectiveness compared to no antiarrhythmic treatment.
Both groups, intervention and control, had to be similar with regard to cardiac disease (frequency, type and severity) and type of atrial fibrillation (especially duration). Also, both groups must have been treated similarly apart from the experimental therapy, that is:
-
the guidelines used to manage initiation, discontinuation, dose and surveillance of anticoagulation had to be the same in both the intervention and control groups;
-
management and drugs used for hypertension and heart failure had to be similar.
Types of outcome measures
Primary outcomes
-
All‐cause mortality
-
Adverse effects: withdrawals from taking the study drug caused by adverse events.
-
Adverse effects: proarrhythmia, including any of the following: sudden death, any new symptomatic arrhythmia (including symptomatic bradycardia), aggravation of existing arrhythmias (i.e. rapid atrial fibrillation) and new appearance on electrocardiogram (ECG) of QRS or QT widening that led to stopping treatment (Friedman 1998).
-
Stroke, all types.
Secondary outcomes
-
Recurrence of atrial fibrillation (number of participants who had a recurrence of atrial fibrillation during follow‐up).
-
Use of anticoagulation (number of participants started on long‐term treatment with anticoagulants at the end of follow‐up).
-
Heart failure.
We analysed all outcomes at 12 months. If a trial did not measure outcomes at this exact time point then we used the nearest measure point (e.g. at six, nine or 15 months instead of 12 months).
Search methods for identification of studies
Electronic searches
We updated the searches from 2005 (Appendix 1), 2010 (Appendix 2), and 2014 (Appendix 3) and reran them on 31 January 2019 (Appendix 4).
We searched the Cochrane Central Register of Controlled Trials (CENTRAL) in the Cochrane Library (2019, Issue 1 of 12), MEDLINE (Ovid, 1946 to 28 January 2019) and Embase (Ovid, 1980 to 2019 week 4).
We also searched two clinical trials registers; ClinicalTrials.gov (www.clinicaltrials.gov) (up to 7 February 2019) and the World Health Organization International Clinical Trials Registry Platform (ICTRP) (apps.who.int/trialsearch/) (up to 7 February 2019).
We applied the RCT filter for MEDLINE was the Cochrane sensitivity‐maximising RCT filter, and for Embase, terms as recommended in the Cochrane Handbook for Systematic Reviews of Interventions (Lefebvre 2011).
Searching other resources
In addition, we checked the reference lists of retrieved studies and the reference lists of recent guidelines, meta‐analyses and general reviews on atrial fibrillation.
We applied no language restrictions.
Data collection and analysis
Selection of studies
Any of the authors read the titles (and abstracts where available) and retrieved any publication that seemed to possibly meet the inclusion criteria. Two authors independently read the full texts of the studies that were retrieved and selected the trials that met the criteria for inclusion. We developed and used a predefined form for this task. We compared the selected trials and resolved any discrepancy by discussion and consensus between the authors. We checked the articles that were finally selected for the review to avoid duplication of data. We kept records of the selection process and prepared a PRISMA flowchart (PRISMA 2009).
Data extraction and management
Two authors (from LV, WJ, JB, CLL) extracted data independently using a data collection form specifically developed for this task. When necessary, we contacted the authors of primary studies for additional information. We checked the completed data forms for agreement and resolved any differences by discussion and consensus.
In addition to data relating to the outcomes of the review, we collected information on the following.
-
Study methods and design (randomisation, allocation concealment and blinding).
-
Baseline characteristics of participants (age, gender, frequency and type of heart disease, echocardiographic measures, duration and type of atrial fibrillation, as defined in each study and knowing that definitions employed were not always consistent).
-
Details of treatments (method of cardioversion employed, time interval between conversion to sinus rhythm and initiation of intervention, antiarrhythmic drugs used and dose, treatment used in control group, concomitant treatments (beta‐blockers, angiotensin‐converting enzyme inhibitors, antiplatelets and warfarin)).
-
Follow‐up duration, participants lost to follow‐up and withdrawals.
Assessment of risk of bias in included studies
Two authors (from LV, EA, WJ, JB, CLL) independently assessed the risk of bias of the selected studies across the following domains recommended in the Cochrane Handbook for Systematic Reviews of Interventions (Higgins 2017): random sequence generation, blinding of participants and personnel, blinding of outcome assessment, incomplete outcome data, selective reporting and any other source of bias.
We resolved any differences of opinion by discussion and consensus.
Measures of treatment effect
We determined the risk ratio (RR) with 95% confidence intervals (CI) for all outcomes as they were all dichotomous variables. If evidence of an effect appeared for any outcome and the control group rates of the outcomes were broadly similar, we calculated the number needed to treat for an additional beneficial outcome (NNTB) or number needed to treat for an additional harmful outcome (NNTH) to prevent or produce, respectively, one adverse outcome for the specified duration of treatment. We used the pooled RR and the pooled rate from the control groups.
Unit of analysis issues
The review includes no cross‐over trials or cluster randomised trials. For trials with multiple time points, we included only data at one year (or the nearest time point). For trials comparing two antiarrhythmics and placebo or no treatment, we divided the placebo (or no treatment) group into two groups with smaller sample size, to include two different comparisons.
Dealing with missing data
We analysed the data on the basis of intention‐to‐treat. By default, we considered missing participants not to have experienced an event and we used the randomised number of participants as the denominator. Nevertheless, we also carried out the worst‐case scenario intention‐to‐treat‐analysis for all outcomes as a sensitivity analysis.
Assessment of heterogeneity
We tested heterogeneity using the Mantel‐Haenszel Chi2 test and the I2 statistic (Higgins 2011). If we found important heterogeneity, we searched for an explanation based on the differences in clinical characteristics of the included studies. If the studies were clinically very dissimilar, they were not statistically combined.
Assessment of reporting biases
We used funnel plots to test for the presence of publication bias, based on the data for each primary and secondary outcome.
Data synthesis
We pooled data using Review Manager 5 (Review Manager 2014). If there was no heterogeneity, we calculated Mantel‐Haenszel RRs for all outcomes using a fixed‐effect model. If there was heterogeneity between studies, we calculated RRs using a random‐effects model.
We pooled data for all antiarrhythmic drugs and analysed them individually (for each specific drug).
'Summary of findings' table
We created 'Summary of findings' tables using the following outcomes: all‐cause mortality, withdrawals due to adverse effects, proarrhythmia, stroke and recurrence of atrial fibrillation. We used the five GRADE considerations (study limitations, consistency of effect, imprecision, indirectness and publication bias) to assess the certainty of a body of evidence as it related to the studies which contributed data to the meta‐analyses for the prespecified outcomes. We used methods and recommendations described in Section 8.5 and Chapter 12 of the Cochrane Handbook for Systematic Reviews of Interventions (Higgins 2011) using GRADEpro GDT. We prepared a separate 'Summary of findings' table for each drug. We justified all decisions to downgrade the certainty of studies using footnotes and we made comments to aid reader's understanding of the review where necessary.
Two authors (AT, CLL) made GRADE assessments and justified, documented and incorporated their judgements into reporting of results for each outcome.
Subgroup analysis and investigation of heterogeneity
Predefined subgroup analyses were:
-
paroxysmal atrial fibrillation and persistent atrial fibrillation;
-
people with heart failure compared to people who had never developed heart failure;
-
studies where warfarin was mandatory versus studies where warfarin was discretionary; and
-
people with a structurally normal heart ('lone' atrial fibrillation).
Sensitivity analysis
Sensitivity analyses were performed by selectively pooling:
-
studies having low risk of bias in the following domains: allocation concealment, blinding and incomplete outcome data; and
-
studies including more than 200 participants.
In addition, we carried out the worst‐case scenario intention‐to‐treat‐analysis (i.e. considering all missing participants as having events) for all outcomes to test if any potential difference might have arisen due to losses to follow‐up.
Results
Description of studies
Results of the search
We found 6332 references and assessed 205 articles in more detail for the previous publication of this review (Lafuente‐Lafuente 2015). We retrieved, translated, when needed, and assessed articles in Chinese, English, French, German, Italian, Spanish and Swedish. Finally, 59 studies fulfilled the inclusion criteria and had useable data. They comprised 20,981 participants in total.
Compared with the previous publication of this review in 2015, which searched the medical literature until January 2014, we read 2185 additional references (LV, CLL, AT), assessed in detail 22 new articles (LV, EA, CLL, WJ), included one new RCT (Chun 2014), and identified one ongoing study (Park 2017). The new included trial compared dronedarone and propafenone, added 100 more participants and reported only atrial fibrillation recurrence rates, but not mortality or adverse events.
During our process of checking papers for duplicate publications, we became aware that the data from one study we had previously included by the SVA‐4 Investigators (SVA‐4 2008a), was already reported in another included publication (ASAP 2003). Therefore, we removed this study from the analysis, and listed it with the main ASAP 2003 reference in the list of Included studies.
Figure 1 illustrates the selection of articles, following the PRISMA model. Agreement between authors was good for both selecting studies and extracting the data. Details of each included study are shown in the Characteristics of included studies table, and the reasons for exclusion are shown in the Characteristics of excluded studies table.

Selection of studies for inclusion. AF: atrial fibrillation.
Included studies
Participants
Entry criteria differed between studies in several aspects. In some trials, atrial fibrillation was documented in the history but participants were in sinus rhythm at the time of inclusion, while in other trials, participants were in atrial fibrillation and needed to be converted to sinus rhythm (only those converted were included in the review). The duration of atrial fibrillation when persistent, or the time from the last documented episode of atrial fibrillation when paroxysmal, was highly variable (from one month to one year, or no time limit in some studies). Some of the studies required atrial fibrillation to be symptomatic while others did not. Six studies enrolled both people with atrial fibrillation and people with atrial flutter. When available, we used only data from people with atrial fibrillation.
Regarding the type of atrial fibrillation, eight studies included exclusively paroxysmal or recent‐onset atrial fibrillation, 28 studies included only persistent atrial fibrillation (i.e. lasting more than seven days), and the remaining 23 studies included both types. Overall, 48% of the pooled population had persistent or permanent atrial fibrillation.
The mean age of participants varied from 46 to 72 years in the included studies and was 65 years in the pooled population. The proportion of participants having underlying heart disease varied widely, from 29% to 100%, with only one study selectively including people without structural heart disease (FAPIS 1996). The most frequent diseases were coronary artery disease (5% to 50% of participants), hypertension, and valvular abnormalities (less frequent in recent studies). The mean left ventricle ejection fraction was greater than 50% in almost all trials (exceptions being DIAMOND 2001; Kalusche 1994; Nergårdh 2007; Plewan 2001; Vijayalakshmi 2006).
Interventions
Twenty‐nine trials (with 13,443 participants) compared an antiarrhythmic with a control, 12 trials (4536 participants) compared two different antiarrhythmics and a control, and 18 trials (3,002 participants) compared two or more antiarrhythmics with each other. The comparator used in the 41 trials with control groups was a placebo in 32 trials, a beta‐blocker in two trials (DAPHNE 2008; Plewan 2001), digoxin in one trial (Steinbeck 1988), and no treatment in six trials (Flec‐SL 2012; Hillestad 1971; Santas 2012; Sodermark 1975; Van Gelder 1989; Vijayalakshmi 2006).
Drugs included in this review, for which there was at least one well‐designed RCT, were class IA: quinidine, disopyramide; class IC: flecainide, propafenone; class II (beta‐blockers): metoprolol; and class III: amiodarone, dofetilide, dronedarone and sotalol.
Follow‐up
The most frequent length of follow‐up was one year. It was shorter in 17 trials (six to nine months) and longer in six trials (15 to 19 months). Five trials followed participants for two years or more (AFFIRM Substudy 2003; ATHENA 2009; Kochiadakis 2000; Kochiadakis 2004a; Kochiadakis 2004b). We extracted and pooled all outcomes at one year of follow‐up or the nearest time point available. For studies with shorter duration of follow‐up, we used the last observation available. Overall, the mean follow‐up of the pooled population analysed was 10.2 months.
Excluded studies
Main reasons for exclusion of studies were not being controlled or randomised (43 studies), having a follow‐up shorter than six months (16 studies) and including in the control group participants who did not revert to sinus rhythm (10 studies). Additional details on excluded studies are given in the Characteristics of excluded studies table.
Risk of bias in included studies
There was asymmetry in the funnel plot of withdrawals because of adverse effects on treatment with sotalol (Figure 2). It showed fewer small studies on the left side (i.e. there were more small studies showing a trend to more withdrawals on active treatment). However, funnel plots for other outcomes with sotalol were symmetric, so we think the risk of substantial publication bias was low. Funnel plots for the remaining drugs were symmetric.

Funnel plot of comparison: 9 Sotalol versus placebo/no treatment, outcome: 9.6 Withdrawals due to adverse effects – main analysis.
The results of the assessment of the risk of bias of included studies across different domains are showed in Figure 3 and Figure 4.

Risk of bias graph: review authors' judgements about each risk of bias item presented as percentages across all included studies.

Risk of bias summary: review authors' judgements about each risk of bias item for each included study.
Allocation
All included studies were described as RCTs. However, only a minority detailed how the random number sequence was generated (18 studies, 30.5%) or how the allocation of participants was concealed (17 studies, 28.8%). Because of lack of details, the risk of bias on these items was unclear for the remaining studies.
Blinding
The majority of trials comparing an antiarrhythmic versus a control were described as blinded (of 41 trials: 25 were double‐blind and five single‐blind, the remaining 11 were open‐label). In contrast, most trials comparing two or more different antiarrhythmics were open‐label (15 out of 18). However, only 17 of the 25 studies said to be double‐blind adequately reported the method of blinding (and it was adequate in all cases). Nonetheless, we think that the risk of bias associated to this lack of adequate blinding is not very high because: 1. most outcomes assessed in this review were objective ones: recurrence of atrial fibrillation and proarrhythmia were established by ECG records, mortality and stroke are objective outcomes; 2. results from adequately double‐blind studies and open‐label studies were very consistent; 3. well described, adequate blinding was more frequent in studies comparing an active drug with no active treatment, which is the main comparison of the review.
Incomplete outcome data
Most studies adequately reported withdrawals and dropouts. The percentage of participants lost to follow‐up was detailed in 47 of the 59 included trials, was small (5% to 10%) and was well balanced across arms. However, virtually all studies only followed participants until atrial fibrillation recurred or until treatment was stopped for any reason. Therefore, data for some outcomes, such as mortality, were not extensive.
Selective reporting
All studies but three (Chun 2014; DAPHNE 2008; Santas 2012) had data on all‐cause mortality, all but two (ASAP 2003; PITAGORA 2008) on atrial fibrillation recurrence rates, and all but three (AFIB 1997; Chun 2014; Santas 2012) presented data for adverse effects, either withdrawals or proarrhythmia (Table 1). Other outcomes were less frequently reported: in studies with a placebo or no treatment arm, 11 trials reported stroke, to trials reported heart failure and none reported the actual frequency of anticoagulation. All studies reported the outcomes they had prespecified in the way they had prespecified.
| Primary outcomes | n trials reporting (n participants) | n trials NOT reporting (n participants) |
| All‐cause mortality | 39 (17,586) | 3a (393) |
| Cardiovascular mortality | Same as total mortality | Same as total mortality |
| Stroke | 11 (9139) | 30 (8840) |
| Adverse effects (proarrhythmia and withdrawals due to adverse effects) | 39 (16,558) | 3b (1421) |
Out of 41 studies comparing an active drug with a control group receiving no antiarrhythmic (total 17,979 participants).
aChun 2014; DAPHNE 2008; Santas 2012.
bAFIB 1997; Chun 2014; Santas 2012. Others studies did not reported proarrhythmia but reported withdrawals (DAPHNE 2008; Niu 2006; Villani 1992).
Other potential sources of bias
Conflict of interest could exist as almost all the studies included in the review were funded by the company manufacturing the antiarrhythmic drug tested.
Effects of interventions
See: Summary of findings for the main comparison Quinidine compared to placebo or no treatment for maintaining sinus rhythm after cardioversion of atrial fibrillation; Summary of findings 2 Disopyramide compared to placebo or no treatment for maintaining sinus rhythm after cardioversion of atrial fibrillation; Summary of findings 3 Propafenone compared to placebo or no treatment for maintaining sinus rhythm after cardioversion of atrial fibrillation; Summary of findings 4 Flecainide compared to placebo or no treatment for maintaining sinus rhythm after cardioversion of atrial fibrillation; Summary of findings 5 Metoprolol compared to placebo or no treatment for maintaining sinus rhythm after cardioversion of atrial fibrillation; Summary of findings 6 Amiodarone compared to placebo or no treatment for maintaining sinus rhythm after cardioversion of atrial fibrillation; Summary of findings 7 Dofetilide compared to placebo or no treatment for maintaining sinus rhythm after cardioversion of atrial fibrillation; Summary of findings 8 Dronedarone compared to placebo or no treatment for maintaining sinus rhythm after cardioversion of atrial fibrillation; Summary of findings 9 Sotalol compared to placebo or no treatment for maintaining sinus rhythm after cardioversion of atrial fibrillation
We calculated all outcomes at one year of follow‐up or the nearest time point (overall mean follow‐up: 10.2 months).
Imputing missing participants as events (the worst‐case intention‐to‐treat scenario) generally did not modify the results, so we reported the best‐case intention‐to‐treat analysis (missing participants counted as being free of events) as the default; where differences existed, we reported details.
See summary of findings Table for the main comparison; summary of findings Table 2; summary of findings Table 3; summary of findings Table 4; summary of findings Table 5; summary of findings Table 6; summary of findings Table 7; summary of findings Table 8; summary of findings Table 9.
All‐cause mortality
The all‐cause mortality rate was low (0% to 5.1% at one year). The only exception to this generally low mortality rate was the DIAMOND study (DIAMOND 2001). This trial recruited people with advanced heart failure and had an overall all‐cause mortality of 31% at one year.
The quantity and quality of data on mortality varied markedly between drugs. We found no data on mortality with flecainide and very few data with disopyramide and propafenone.
More data were available for other drugs. We found evidence suggesting an increase in the risk of death with two drugs, quinidine and sotalol. For the remaining drugs studied, available evidence show no apparent effect in mortality.
There was no important heterogeneity between studies for all‐cause mortality for any of the drugs studied.
Drugs with very few or no data on mortality
Disopyramide
Only one study reported all‐cause mortality in people receiving disopyramide compared with placebo or no treatment. It included only 92 participants and had a very wide CIs for mortality that included both possible benefits and harms (RR 5.00, 95% CI 0.25 to 101.37; I2 = 0%; very low‐certainty evidence; Analysis 2.1).
Counting missing participants as having died did not change this finding (Analysis 2.2). No other sensitivity analysis could be carried out.
Propafenone
Of the five included trials (998 participants), only two studies reported any deaths (one each). The CIs were wide, including both possible benefits and harms, and the results varied markedly between the main analysis (RR 0.19, 95% CI 0.02 to 1.68; studies = 2, participants = 212; I2 = 0%; Analysis 3.1) and the sensitivity analysis which treated missing participants as having died (RR 1.28, 95% CI 0.45 to 3.62; studies = 3, participants = 406; I2 = 19%; Analysis 3.2). Restricting the analysis to the only study at low risk of bias did not differ from the main analysis (Analysis 3.3).
Overall, the evidence for this outcome was very low‐certainty, meaning that we were uncertain of the effect of propafenone on mortality.
Flecainide
None of the four trials studying flecainide (511 participants in total) reported any death from any cause.
Drugs associated with an increase in mortality
Quinidine
Six studies that compared quinidine with placebo or no treatment reported all‐cause mortality. The GRADE rating was low‐certainty for this outcome. The pooled RR suggested that risk of mortality was higher in people receiving quinidine compared with placebo or no treatment, although the CIs also included the possibility of a lower or similar mortality rate (RR 2.01, 95% CI 0.84 to 4.77; studies = 6, participants = 1646; I2 = 0%; Analysis 1.1). This corresponded to 8 deaths per 1000 people in the control group and 15 (95% CI 6 to 36) per 1000 people in the quinidine group.
Sensitivity analysis which treated missing participants as having died increased the RR slightly, but was not substantially different to the main analysis (RR 2.12, 95% CI 0.96 to 4.67; studies = 6, participants = 1646; I2 = 0%; Analysis 1.2).
Conversely, sensitivity analysis of quinidine studies at low risk of bias (Analysis 1.5), or studies with more than 200 participants (Analysis 1.6), left only two studies (PAFAC 2004; SOPAT 2004). There was no evidence of a difference in all‐cause mortality compared with controls (RR 1.29, 95% CI 0.34 to 4.92; studies = 2, participants = 1234; I2 = 0%). These two trials were more recent, employed a lower dose of quinidine (320 mg/day to 480 mg/day) than other studies (800 mg/day to 1800 mg/day) and combined quinidine with verapamil. However, when comparing those two studies against older, higher‐dose studies, the test for subgroup differences did not indicate that the effect differed between those two groups (P = 0.4; Analysis 1.3).
The other sensitivity analysis did not differ from the main analysis (Analysis 1.4: persistent atrial fibrillation).
Sotalol
High‐certainty evidence from five RCTs indicated that people receiving sotalol had a higher all‐cause mortality rate than those with placebo or no treatment (RR 2.23, 95% CI 1.03 to 4.81; studies = 5, participants = 1882; I2 = 0%; Analysis 9.1; Figure 5). This corresponded to 8 deaths per 1000 people in the control group and 19 (95% CI 9 to 40) deaths per 1000 people in the sotalol group. The NNTH for sotalol was 102 (95% CI 33 to 4167) participants treated for one year to have one additional death, with a wide CI.

All‐cause mortality with sotalol compared with placebo/no treatment: main analysis.
This association with increased mortality persisted in all sensitivity analyses undertaken, either counting missing participants as deaths (RR 2.02, 95% CI 1.28 to 3.20; studies = 10, participants = 2757; I2 = 0%; Analysis 9.2), restricting to those studies at low risk of bias (RR 2.51, 95% CI 1.06 to 5.98; studies = 3, participants = 1311; I2 = 0%; Analysis 9.4), or which included only persistent atrial fibrillation (RR 2.51, 95% CI 1.06 to 5.98; studies = 3, participants = 1311; I2 = 0%; Analysis 9.3). There was an even larger effect when restricting the analysis to just those studies with at least 200 participants (RR 2.65, 95% CI 1.16 to 6.09; studies = 4, participants = 1826; I2 = 0%; Analysis 9.5).
Drugs with no apparent effect on mortality
For the remaining drugs studied, available evidence showed no apparent difference in mortality with respect to placebo or no treatment. However, data for mortality were rarely extensive and the data obtained could have been underpowered to detect mild differences in mortality for several of the drugs studied.
Metoprolol
Moderate‐certainty evidence from two studies comparing metoprolol with placebo or no treatment produced very wide CIs (RR 2.02, 95% CI 0.37 to 11.05; studies = 2, participants = 562; I2 = 47%; Analysis 5.1). Results did not change in any of the sensitivity analyses (Analysis 5.2; Analysis 5.3; Analysis 5.4; Analysis 5.5).
Amiodarone
Moderate‐certainty evidence from two studies comparing amiodarone with placebo or no treatment produced wide CIs (RR 1.66, 95% CI 0.55 to 4.99; studies = 2, participants = 444; I2 = 10%; Analysis 6.1). This finding did not change in any of the sensitivity analyses (Analysis 6.2; Analysis 6.3).
Dofetilide
Moderate‐certainty evidence from three RCTs found no evidence of a difference in all‐cause mortality rate between dofetilide and placebo or no treatment groups (RR 0.98, 95% CI 0.76 to 1.27; studies = 3, participants = 1183; I2 = 0%; Analysis 7.1). Sensitivity analyses did not differ substantially from the main analysis (Analysis 7.2; Analysis 7.3; Analysis 7.4; Analysis 7.5).
Dronedarone
High‐certainty evidence from three RCTs showed no clear difference in all‐cause mortality between dronedarone and placebo or no treatment (RR 0.86, 95% CI 0.68 to 1.09; studies = 3, participants = 6071; I2 = 0%; Analysis 8.1). The ATHENA 2009 study dominated this analysis, with 97% of the weight in the meta‐analysis.
There was very little difference between this main result and the different sensitivity analyses (Analysis 8.2; Analysis 8.3; Analysis 8.4; Analysis 8.5).
Head‐to‐head comparisons
In direct comparisons between antiarrhythmics, there were no differences in mortality (Table 2).
| Drug 1 vs drug 2 | Drug 1 | Drug 2 | RR (95% CI) | ||
| Events | Total | Events | Total | ||
| Disopyramide vs other class I drugs | |||||
| 0 | 29 | 2 | 28 | 0.19 (0.01 to 3.86) | |
| 1 | 31 | 0 | 25 | 2.44 (0.10 to 57.37) | |
| Quinidine vs other class I drugs | |||||
| 2 | 28 | 0 | 29 | 5.17 (0.26 to 103.18) | |
| 0 | 98 | 2 | 102 | 0.21 (0.01 to 4.28) | |
| Quinidine vs sotalol | |||||
| 1 | 85 | 1 | 98 | 1.15 (0.07 to 18.15) | |
| 1 | 41 | 0 | 41 | 3.00 (0.13 to 71.56) | |
| 9 | 377 | 13 | 383 | 0.70 (0.30 to 1.63) | |
| 0 | 63 | 1 | 58 | 0.31 (0.01 to 7.40) | |
| 2 | 518 | 2 | 264 | 0.51 (0.07 to 3.60) | |
| Flecainide vs propafenone | |||||
| 0 | 48 | 1 | 49 | 0.34 (0.01 to 8.15) | |
| Amiodarone vs class I drugs | |||||
| 10 | 106 | 26 | 116 | 0.42 (0.21 to 0.83) | |
| 6 | 70 | 2 | 75 | 3.21 (0.67 to 15.40) | |
| Amiodarone vs dronedarone | |||||
| 5 | 255 | 2 | 249 | 2.44 (0.48 to 12.47) | |
| Amiodarone vs sotalol | |||||
| 15 | 131 | 24 | 125 | 0.60 (0.33 to 1.08) | |
| 6 | 70 | 0 | 31 | 5.86 (0.34 to 100.89) | |
| 13 | 267 | 15 | 261 | 0.85 (0.41 to 1.75) | |
| Sotalol vs class I drugs other than quinidine | |||||
| 13 | 88 | 17 | 95 | 0.83 (0.43 to 1.60) | |
| 2 | 50 | 0 | 50 | 5.00 (0.25 to 101.58) | |
| Sotalol vs dofetilide | |||||
| 0 | 108 | 1 | 321 | 0.98 (0.04 to 23.99) | |
CI: confidence interval; RR: risk ratio.
Withdrawals due to adverse effects
Withdrawals due to adverse effects were more frequent with all studied drugs, compared with placebo or no treatment:
Quinidine
Moderate‐certainty evidence suggested a higher number of withdrawals due to adverse events in the quinidine group than in the placebo or no treatment group, although the CIs included the possibilities of a slightly smaller number of withdrawals and also of no difference between groups (RR 1.56, 95% CI 0.87 to 2.78; studies = 7, participants = 1669; I2 = 67%; Analysis 1.7). This corresponded to 163 withdrawals per 1000 people in the control group and 254 (95% CI 142 to 452) per 1000 people in the quinidine group.
There was high heterogeneity in the main analysis, which seemed to be related to two more recent studies that employed lower doses of quinidine and combined it with verapamil (PAFAC 2004; SOPAT 2004). A subgroup analysis based on the dose used and age of the studies suggested there was a real difference between these two studies and older studies which employed a higher dose of quinidine (test for subgroup differences, P = 0.009; Analysis 1.8). In older, higher‐dose studies, approximately three times more people withdrew due to adverse effects, compared to placebo or no treatment (RR 3.05, 95% CI 1.29 to 7.22; studies = 5, participants = 435; I2 = 29%). In more‐recent, lower‐dose studies, there was no evidence of a difference in withdrawals (RR 0.88, 95% CI 0.61 to 1.27; studies = 2, participants = 1234; I2 = 51%).
The results of sensitivity analysis varied depending on whether they included mostly older studies, as for the analysis of studies on permanent atrial fibrillation, which showed an increase of withdrawals with quinidine (Analysis 1.9), or whether they included mainly the two more‐recent studies, which showed no difference with controls (Analysis 1.10; Analysis 1.11).
Disopyramide
Low‐certainty evidence from two RCTs indicated a more than three‐fold higher risk of withdrawal due to adverse events among people receiving disopyramide compared with placebo or no treatment, although the CIs included the possibility of similar risks of withdrawal due to adverse events (RR 3.68, 95% CI 0.95 to 14.24; studies = 2, participants = 146; I2 = 0%; Analysis 2.3). This corresponded to 28 withdrawals per 1000 people in the control group and 104 (95% CI 27 to 401) per 1000 people in the disopyramide group. The result of the sensitivity analysis was identical to the main analysis (Analysis 2.4). No further sensitivity analyses were possible.
Propafenone
Moderate‐certainty evidence indicated a higher risk of withdrawals due to adverse events in people receiving propafenone compared with people receiving placebo or no treatment (RR 1.62, 95% CI 1.07 to 2.46; studies = 5, participants = 1098; I2 = 0%; Analysis 3.4). Corresponding numbers of withdrawals due to adverse events were 61 per 1000 people in the control group and 99 (95% CI 65 to 150) per 1000 people in the propafenone group. The NNTH for propafenone was 26 (95% CI 11 to 234) participants treated for one year to have one additional withdrawal.
Restricting the analysis to the only study with more than 200 participants indicated a lack of evidence for a difference between groups (RR 1.29, 95% CI 0.79 to 2.11; studies = 1, participants = 523; Analysis 3.5).
Flecainide
Only one very small RCT reported withdrawals due to adverse events (RR 15.41, 95% CI 0.91 to 260.19; studies = 1, participants = 73; low‐certainty evidence; Analysis 4.1) (Van Gelder 1989). Seven people receiving flecainide withdrew due to adverse events, compared with none in the control arm. The RR reflected a higher risk of withdrawal due to adverse events when receiving flecainide, but the CIs were wide enough to include no difference between groups and even a small chance of a lower risk, but the very small number of people in this analysis limited the usefulness of this result.
Metoprolol
High‐certainty evidence from two RCTs found that the risk of withdrawing due to adverse events was more than three times higher among people receiving metoprolol than people receiving placebo or no treatment (RR 3.47, 95% CI 1.48 to 8.15; studies = 2, participants = 562; I2 = 0%; Analysis 5.6). This represented 21 per 1000 people receiving placebo or no treatment withdrawing due to adverse effects compared with 74 (95% CI 31 to 173) per 1000 people receiving metoprolol. The NNTH was 19 (95% CI 7 to 99) participants treated for one year to have one additional withdrawal.
All sensitivity analyses were similar to the main results (Analysis 5.7; Analysis 5.8; Analysis 5.9).
Amiodarone
Pooled analysis of four RCTs found low‐certainty evidence that the risk of withdrawing due to an adverse event was more than six times higher for people receiving amiodarone than for people receiving placebo or no treatment (RR 6.70, 95% CI 1.91 to 23.45; studies = 4, participants = 319; I2 = 0%; Analysis 6.4). This corresponded to seven people out of 1000 people receiving placebo or no treatment withdrawing, compared with 49 (95% CI 14 to 172) per 1000 people receiving amiodarone. The NNTH for amiodarone was 25 (95% CI 6 to 157) participants treated for one year to have one additional withdrawal.
Sensitivity analysis restricted to the only study at low risk of bias had very wide CIs (RR 4.98, 95% CI 0.65 to 38.29; studies = 1, participants = 99; Analysis 6.5).
Dofetilide
Low‐certainty evidence from two RCTs suggested withdrawals due to adverse effects may have been higher in people receiving dofetilide, but the wide CIs also included the possibility that there was the same risk (or a lower risk) as for people receiving placebo or no treatment (RR 1.77, 95% CI 0.75 to 4.18; studies = 2, participants = 677; I2 = 0%; Analysis 7.6). The risk was 34 per 1000 people in the placebo or no treatment group compared with 61 (95% CI 26 to 144) per 1000 people in the dofetilide group. Sensitivity analyses were identical to the main result (Analysis 7.7; Analysis 7.8).
Dronedarone
Three RCTs showed moderate‐certainty evidence of a higher risk of withdrawals due to adverse effects among people receiving dronedarone (RR 1.58, 95% CI 1.34 to 1.85; studies = 3, participants = 6071; I2 = 31%; Analysis 8.6). This corresponded to a risk of 77 withdrawals per 1000 people in the placebo or no treatment group and 122 (95% CI 104 to 143) withdrawals per 1000 people in the dronedarone group. The NNTH was 22 (95% CI 15 to 38) participants treated for one year to have one additional withdrawal.
The ATHENA 2009 study had 82.5% of the weight in the main meta‐analysis, so the sensitivity analyses were heavily influenced by this large study. When it was included, they were very similar to the main analysis (Analysis 8.8; Analysis 8.9). The analysis of studies on permanent atrial fibrillation did not include the ATHENA trial and had a very wide CIs (RR 14.51, 95% CI 0.90 to 234.74; Analysis 8.7).
Sotalol
The risk of withdrawing due to an adverse event was almost twice as high in people receiving sotalol as in people receiving placebo or no treatment (RR 1.95, 95% CI 1.23 to 3.11; studies = 12, participants = 2688; I2 = 56%; Analysis 9.6). The risk was 94 withdrawals per 1000 people in the control group and 183 (95% CI 116 to 293) per 1000 people in the sotalol group. The corresponding NNTH was 11 (95% CI 5 to 46) participants treated for one year to have one additional withdrawal.
Evidence was rated as moderate‐certainty due to suspected publication bias. Although there was an I2 statistic of 56%, we did not downgrade for heterogeneity, because subgroup analysis showed a difference between a subgroup containing the PAFAC 2004 and SOPAT 2004 studies, and a subgroup containing the other studies (P = 0.009 from test for subgroup differences; Analysis 9.7).
Sensitivity analyses all showed an increase in withdrawals on sotalol, giving estimates which were very similar to the main analysis (permanent atrial fibrillation: Analysis 9.8), lower (low risk of bias studies: RR 1.27, 95% CI 1.00 to 1.60; studies = 4, participants = 1686; I2 = 78%; Analysis 9.9), or slightly lower (studies with at least 200 participants: RR 1.81, 95% CI 0.97 to 3.35; studies = 5, participants = 1900; I2 = 79%; Analysis 9.10).
Head‐to‐head comparisons
In direct comparisons between antiarrhythmics (Table 3), quinidine appeared to cause more withdrawals than flecainide or other class I drugs. Amiodarone seemed to produce fewer withdrawals than class I drugs combined, but showed no difference compared with dronedarone or sotalol. Sotalol caused more withdrawals than dofetilide or beta‐blockers.
| Drug 1 vs drug 2 | Drug 1 | Drug 2 | RR (95% CI) | ||
| Events | Total | Events | Total | ||
| Disopyramide vs other class I drugs | |||||
| 2 | 29 | 4 | 28 | 0.48 (0.10 to 2.43) | |
| 4 | 31 | 8 | 25 | 0.40 (0.14 to 1.19) | |
| Quinidine vs flecainide | |||||
| 35 | 117 | 22 | 122 | 1.66 (1.04 to 2.65) | |
| 2 | 15 | 0 | 15 | 5.00 (0.26 to 96.13) | |
| Quinidine vs other class I drugs | |||||
| 4 | 28 | 2 | 29 | 2.07 (0.41 to 10.43) | |
| 35 | 117 | 22 | 122 | 1.66 (1.04 to 2.65) | |
| 23 | 98 | 10 | 102 | 2.39 (1.20 to 4.77) | |
| 2 | 15 | 0 | 15 | 5.00 (0.26 to 96.13) | |
| Quinidine vs sotalol | |||||
| 10 | 25 | 1 | 25 | 10.00 (1.38 to 72.39) | |
| 22 | 85 | 11 | 98 | 2.31 (1.19 to 4.47) | |
| 7 | 41 | 3 | 41 | 2.33 (0.65 to 8.40) | |
| 94 | 377 | 96 | 383 | 0.99 (0.78 to 1.27) | |
| 10 | 63 | 7 | 58 | 1.32 (0.54 to 3.23) | |
| 87 | 518 | 53 | 264 | 0.84 (0.62 to 1.14) | |
| Flecainide vs propafenone | |||||
| 2 | 48 | 9 | 49 | 0.23 (0.05 to 1.00) | |
| 10 | 97 | 9 | 103 | 1.18 (0.50 to 2.78) | |
| Amiodarone vs class I drugs | |||||
| 20 | 154 | 47 | 121 | 0.33 (0.21 to 0.53) | |
| 17 | 72 | 2 | 74 | 8.74 (2.09 to 36.46) | |
| 5 | 70 | 2 | 31 | 1.11 (0.23 to 5.40) | |
| 3 | 35 | 10 | 41 | 0.35 (0.10 to 1.18) | |
| 1 | 28 | 1 | 26 | 0.93 (0.06 to 14.09) | |
| Amiodarone vs dronedarone | |||||
| 45 | 255 | 32 | 249 | 1.37 (0.90 to 2.09) | |
| Amiodarone vs sotalol | |||||
| 20 | 154 | 21 | 135 | 0.83 (0.47 to 1.47) | |
| 11 | 65 | 3 | 61 | 3.44 (1.01 to 11.75) | |
| 5 | 51 | 7 | 51 | 0.71 (0.24 to 2.10) | |
| 6 | 70 | 0 | 31 | 5.86 (0.34 to 100.89) | |
| 1 | 22 | 4 | 33 | 0.38 (0.04 to 3.14) | |
| Sotalol vs class I drugs other than quinidine | |||||
| 21 | 135 | 47 | 121 | 0.40 (0.25 to 0.63) | |
| 5 | 85 | 5 | 86 | 1.01 (0.30 to 3.37) | |
| 6 | 50 | 4 | 50 | 1.50 (0.45 to 4.99) | |
| Sotalol vs dofetilide | |||||
| 16 | 108 | 22 | 321 | 2.16 (1.18 to 3.96) | |
| Sotalol vs other beta‐blockers | |||||
| 11 | 69 | 2 | 66 | 5.26 (1.21 to 22.84) | |
| 4 | 64 | 3 | 64 | 1.33 (0.31 to 5.72) | |
CI: confidence interval; RR: risk ratio.
Proarrhythmia
Virtually all studied antiarrhythmics showed increased proarrhythmic effects (counting both bradyarrhythmias and tachyarrhythmias attributable to treatment).
Ventricular arrhythmias (torsades, ventricular tachycardia, ventricular fibrillation, widening QRS or QT leading to stopping treatment, sudden death or unexplained syncope) were the most frequent proarrhythmic events reported with dofetilide (100% of all proarrhythmic events), quinidine (94%) and flecainide (69%), while symptomatic bradyarrhythmias (sinus bradycardia leading to stopping treatment; atrio‐ventricular block) were more frequent with metoprolol (94% of all events) and amiodarone (69%). Other drugs demonstrated both types of proarrhythmic events: propafenone (63% ventricular events, 39% bradycardia), sotalol (61% ventricular events, 39% bradycardia) and dronedarone (41% ventricular events, 59% bradycardia).
Quinidine
High‐certainty evidence from seven RCTs showed that the risk of proarrhythmia was twice as high in people the quinidine group compared with people in the placebo or no treatment group, although the CIs did not exclude the possibility of no difference between groups (RR 2.05, 95% CI 0.95 to 4.41; studies = 7, participants = 1676; I2 = 0%; Analysis 1.12). This represented 11 cases per 1000 people in the control group and 22 (95% CI 10 to 48) cases per 1000 people in the quinidine group.
In a way very similar to the analysis of withdrawals due to adverse effects, the results of sensitivity analysis varied depending whether they included mostly older, higher‐dose studies, as the analysis of studies on permanent atrial fibrillation, which showed an increase of proarrhythmia with quinidine (Analysis 1.14); or whether they included mainly the two more recent, lower‐dose studies (PAFAC 2004; SOPAT 2004), which showed no difference compared with controls (Analysis 1.15; Analysis 1.16). However, a subgroup analysis comparing older studies with more‐recent ones found no difference between groups for this outcome (test for difference between subgroups P = 0.41; Analysis 1.3).
Disopyramide
We found no disopyramide studies reporting proarrhythmia.
Propafenone
Three RCTs reported proarrhythmia, but the very low‐certainty evidence and wide CIs meant that we were uncertain of the effect of propafenone on this outcome (RR 1.32, 95% CI 0.39 to 4.47; studies = 3, participants = 381; studies = 3; I2 = 8%; Analysis 3.6). Sensitivity analysis restricted to the only study at low risk of bias showed a lack of evidence for a difference between groups (RR 0.49, 95% CI 0.09 to 2.75; studies = 1, participants = 102; Analysis 3.7).
Flecainide
Risk of proarrhythmia was over four times higher among people receiving flecainide than placebo or no treatment (RR 4.80, 95% CI 1.30 to 17.77; studies = 4, participants = 511; I2 = 0%; moderate‐certainty evidence; Analysis 4.2). This corresponded to a risk of 6 per 1000 among people in the placebo or no treatment group compared with a risk of 30 (95% CI 8 to 112) per 1000 people in the flecainide group. The NNTH for flecainide was 44 (95% CI 10 to 556) participants treated for one year to have one additional proarrhythmic event.
All sensitivity analyses suggested an increased risk of proarrhythmia with flecainide, but their CIs were wider and included the possibility of no difference between groups (Analysis 4.3; Analysis 4.4; Analysis 4.5).
Metoprolol
High‐certainty evidence showed an important increase of proarrhythmia with metoprolol compared to placebo due mainly to symptomatic bradyarrhythmias (94% of all proarrhythmic events) (RR 18.14, 95% CI 2.42 to 135.66; studies = 2, participants = 562; I2 = 0%; Analysis 5.10). In the pooled population, proarrhythmic events were reported in no participants in the placebo group and in 60 participants per 1000 people in the metoprolol group. The corresponding NNTH was 19 (95% CI 2 to 235) participants treated for one year to have one additional bradyarrhythmia.
All sensitivity analyses showed results similar to the main analysis (Analysis 5.11; Analysis 5.12; Analysis 5.13).
Amiodarone
Moderate‐certainty evidence suggested an increase in proarrhythmia with amiodarone compared to placebo or no treatment, but the CIs included the possibility of no difference (or even a reduction) (RR 2.22, 95% CI 0.71 to 6.96; studies = 4, participants = 673; I2 = 0%; Analysis 6.6). This corresponded to a risk of 8 per 1000 per people with placebo or no treatment and 18 (95% CI 6 to 57) per 1000 people with amiodarone. Symptomatic bradyarrhythmias represented 69% of events with amiodarone.
Sensitivity analyses gave similar results, the only difference was that they pooled fewer studies and the CIs were wider (Analysis 6.7; Analysis 6.8; Analysis 6.9).
Dofetilide
Moderate‐certainty evidence found a five‐fold increase in proarrhythmic events with dofetilide compared to placebo or no treatment (RR 5.50, 95% CI 1.33 to 22.76; studies = 3, participants = 1183; I2 = 0%; Analysis 7.9). This corresponded to 2 cases per 1000 people in the control group and 13 (95% CI 3 to 53) cases per 1000 people in the dofetilide group. The NNTH for dofetilide was 111 (95% CI 23 to 1515) participants treated for one year to have one additional proarrhythmic event.
Sensitivity analyses did not differ from the main analysis (Analysis 7.10; Analysis 7.11; Analysis 7.12).
Dronedarone
Moderate‐certainty evidence from two RCTs suggested an increase of proarrhythmia with dronedarone compared with placebo, but the CIs included the possibility of no difference or even a benefit on this outcome (RR 1.95, 95% CI 0.77 to 4.98; studies = 2, participants = 5872; I2 = 78%; Analysis 8.6). This represented 18 cases per 1000 people in the placebo group and 36 (95% CI 14 to 91) cases per 1000 people in the dronedarone group.
In sensitivity analysis, there was only one study rated at low risk of bias or including more than 200 participants (ATHENA 2009). This study found an increased risk of proarrhythmia with dronedarone compared to placebo (RR 2.94, 95% CI 2.08 to 4.15, participants = 4628; Analysis 8.11; Analysis 8.12).
Sotalol
Moderate‐certainty evidence showed increased proarrhythmia rates on sotalol compared to placebo or no treatment (RR 3.55, 95% CI 2.16 to 5.83; studies = 12, participants = 2989; I2 = 20%; Analysis 9.11). This corresponded to 12 cases per 1000 people in the control group and 41 (95% CI 25 to 68) cases per 1000 people in the sotalol group. The corresponding NNTH was 33 (95% CI 17 to 72) participants treated for one year to have one additional proarrhythmic event.
All sensitivity analyses were very similar to the main analysis (Analysis 9.13; Analysis 9.14; Analysis 9.15).
Head‐to‐head comparisons
In direct comparisons between antiarrhythmics (Table 4), amiodarone seemed to produce fewer proarrhythmic events than class I drugs combined, but showed no clear differences compared with dronedarone or sotalol. There were no other differences between drugs.
| Drug 1 vs drug 2 | Drug 1 | Drug 2 | RR (95% CI) | ||
| Events | Total | Events | Total | ||
| Disopyramide vs other class I drugs | |||||
| 0 | 29 | 1 | 28 | 0.32 (0.01 to 7.59) | |
| 1 | 31 | 1 | 25 | 0.81 (0.05 to 12.26) | |
| Quinidine vs flecainide | |||||
| 10 | 117 | 7 | 122 | 1.49 (0.59 to 3.78) | |
| 2 | 15 | 1 | 15 | 2.00 (0.20 to 19.78) | |
| Quinidine vs other class I drugs | |||||
| 1 | 28 | 0 | 29 | 3.10 (0.13 to 73.12) | |
| 10 | 117 | 7 | 122 | 1.49 (0.59 to 3.78) | |
| 2 | 98 | 2 | 102 | 1.04 (0.15 to 7.24) | |
| 2 | 15 | 1 | 15 | 2.00 (0.20 to 19.78) | |
| Quinidine vs sotalol | |||||
| 3 | 25 | 1 | 25 | 3.00 (0.33 to 26.92) | |
| 1 | 85 | 1 | 98 | 1.15 (0.07 to 18.15) | |
| 1 | 41 | 2 | 41 | 0.50 (0.05 to 5.30) | |
| 17 | 377 | 20 | 383 | 0.86 (0.46 to 1.62) | |
| 2 | 63 | 3 | 58 | 0.61 (0.11 to 3.54) | |
| 8 | 518 | 2 | 264 | 2.04 (0.44 to 9.53) | |
| Flecainide vs propafenone | |||||
| 0 | 48 | 4 | 49 | 0.11 (0.01 to 2.05) | |
| 2 | 97 | 1 | 103 | 2.12 (0.20 to 23.05) | |
| Amiodarone vs class I drugs | |||||
| 5 | 154 | 20 | 121 | 0.20 (0.08 to 0.51) | |
| 2 | 72 | 2 | 74 | 1.03 (0.15 to 7.10) | |
| 1 | 28 | 1 | 26 | 0.93 (0.06 to 14.09) | |
| Amiodarone vs dronedarone | |||||
| 4 | 255 | 2 | 249 | 1.95 (0.36 to 10.57) | |
| Amiodarone vs sotalol | |||||
| 5 | 154 | 9 | 135 | 0.49 (0.17 to 1.42) | |
| 2 | 65 | 2 | 61 | 0.94 (0.14 to 6.46) | |
| 6 | 267 | 9 | 261 | 0.65 (0.24 to 1.81) | |
| Sotalol vs class I drugs other than quinidine | |||||
| 9 | 135 | 20 | 121 | 0.40 (0.19 to 0.85) | |
| 5 | 20 | 3 | 20 | 1.67 (0.46 to 6.06) | |
| 3 | 85 | 2 | 86 | 1.52 (0.26 to 8.86) | |
| 9 | 50 | 6 | 50 | 1.50 (0.58 to 3.90) | |
| Sotalol vs dofetilide | |||||
| 2 | 108 | 7 | 321 | 0.85 (0.18 to 4.03) | |
| Sotalol vs other beta‐blockers | |||||
| 4 | 64 | 3 | 64 | 1.33 (0.31 to 5.72) | |
CI: confidence interval; RR: risk ratio.
Stroke
There were limited data for stroke. Only 11 of 41 studies with a control group (placebo or no treatment arm) reported stroke outcomes (ATHENA 2009; Benditt 1999; Carunchio 1995; EURIDIS ADONIS 2007; Flec‐SL 2012; Hillestad 1971; Karlson 1988; Lloyd 1984; SAFE‐T 2005; Sodermark 1975; SOPAT 2004), and we were uncertain that reporting of stroke was complete. The reported stroke rate was very low (1% to 2% at one year).
Drugs with no data on stroke
None of the studies of propafenone, metoprolol or dofetilide reported data on stroke.
Drugs with no apparent effect on stroke
Low‐ to very low‐certainty evidence showed no apparent effect on stroke rates, compared to placebo or no treatment, with the following drugs:
-
quinidine (RR 0.97, 95% CI 0.25 to 3.83; studies = 4, participants = 1107; I2 = 0%; Analysis 1.17);
-
disopyramide (RR 0.31, 95% CI 0.03 to 2.91; studies = 2, participants = 146; I2 = 0%; Analysis 2.5);
-
flecainide (RR 2.04, 95% CI 0.11 to 39.00; studies = 1, participants = 362; I2 = 0%; Analysis 4.6);
-
amiodarone (RR 1.15, 95% CI 0.30 to 4.39; studies = 1, participants = 399; I2 = 0%; Analysis 6.10).
Moderate‐certainty evidence showed no apparent effect on stroke rates compared to placebo or no treatment with sotalol (RR 1.47, 95% CI 0.48 to 4.51; studies = 3, participants = 1161; I2 = 0%; Analysis 9.16).
The corresponding sensitivity analyses, when these were possible, showed no notable difference with the main analyses.
Drugs with an effect on stroke
Dronedarone
High‐certainty evidence from two RCTs suggested that dronedarone may be associated with reduced risk of stroke (RR 0.66, 95% CI 0.47 to 0.95; studies = 2, participants = 5872; I2 = 0%; Analysis 8.13). This corresponded to a risk of stroke of 27 per 1000 people in the placebo group and 18 per 1000 (13 to 25) people in the dronedarone group. The corresponding NNTB was 109 (95% CI 70 to 741) participants treated for one year to prevent one stroke.
However, this result was due to one large study, which accounted for 94.6% of the weight in the meta‐analysis (ATHENA 2009). Sensitivity analysis restricted to studies with more than 200 participants included the same two studies so produced identical results (Analysis 8.14).
Recurrence of atrial fibrillation
All antiarrhythmic drugs included in this review, including metoprolol, reduced the risk of recurrence of atrial fibrillation. Recurrence rates of atrial fibrillation at one year were high: 69% to 84% in the control group not receiving antiarrhythmic treatment, reduced to 43% to 67% in participants in the antiarrhythmic group.
Quinidine
High‐certainty evidence showed a reduction in atrial fibrillation recurrences with quinidine (RR 0.83, 95% CI 0.78 to 0.88; studies = 7, participants = 1624; I2 = 0%; Analysis 1.21). Recurrence rates at one year were 80.5% in participants in the placebo or no treatment group and 66.8% (62.8% to 70.8%) in participants in the quinidine group. The NNTB for quinidine was 7 (95% CI 6 to 10) participants treated for one year to avoid one recurrence.
Results of sensitivity analyses did not differ from the main analysis (Analysis 1.22; Analysis 1.23; Analysis 1.24).
Disopyramide
Evidence for disopyramide was low‐certainty because it consisted of two small RCTs with unclear risk of bias. It suggested disopyramide reduced recurrences of atrial fibrillation (RR 0.77, 95% CI 0.59 to 1.01; studies = 2, participants = 146; I2 = 0%; Analysis 2.7). This corresponded to a recurrence rate, at six months to one year, of 69.0% in the control group and 53.1% (95% CI 40.7% to 69.7%) in the disopyramide group. Both studies included only people with permanent atrial fibrillation (Analysis 2.8), and no other sensitivity analysis was possible.
Propafenone
Moderate‐certainty evidence from five RCTs indicated that propafenone reduced atrial fibrillation recurrences by about a third (RR 0.67, 95% CI 0.61 to 0.74; studies = 5, participants = 1098; I2 = 0%; Analysis 3.8). Recurrence rate was 73.0% in the control group and 48.9% (44.5% to 54.0%) in the propafenone group. The corresponding NNTB was 4 (95% CI 3 to 5) participants treated for one year to avoid one recurrence.
Results from sensitivity analyses were very similar (Analysis 3.9; Analysis 3.10).
Flecainide
High‐certainty evidence showed that flecainide reduced atrial fibrillation recurrences by about a third (RR 0.65, 95% CI 0.55 to 0.77; studies = 4, participants = 511; I2 = 29%; Analysis 4.10). That corresponded to a recurrence rate of 69.8% in people not treated or receiving placebo and 45.4% (38.4% to 53.8%) in people receiving flecainide. The NNTB for flecainide was 4 (95% CI 3 to 6) participants treated for one year to avoid one recurrence.
Results from sensitivity analyses did not differ substantially (Analysis 4.11; Analysis 4.12; Analysis 4.13).
Metoprolol
Moderate‐certainty evidence from two RCTs suggested that metoprolol reduced recurrences of atrial fibrillation, compared with placebo, but the CI included the possibility of no difference (RR 0.83, 95% CI 0.68 to 1.02; studies = 2, participants = 562; I2 = 59%; Analysis 5.14). The corresponding recurrence rates were 72.0% in people receiving placebo and 59.7% (49.0% to 73.4%) in people receiving metoprolol. All sensitivity analyses included the same two trials so obtained identical results (Analysis 5.12; Analysis 5.15), except the analysis restricted to studies including more than 200 participants, which included only one study and showed no difference between metoprolol and placebo (Analysis 4.13).
Amiodarone
High‐certainty evidence showed a reduction of atrial fibrillation recurrences with amiodarone of about a half, compared to placebo or no treatment (RR 0.52, 95% CI 0.46 to 0.58; studies = 6, participants = 812; I2 = 33%; Analysis 6.13). This corresponded to a recurrence rate of 81.2% in people not receiving active treatment and 42.2% (95% CI 37.3% to 47.1%) in people receiving amiodarone. The NNTB for amiodarone was 3 (95% CI 2 to 4) participants treated for one year to avoid one recurrence.
All sensitivity analyses obtained very similar results (Analysis 6.14; Analysis 6.15; Analysis 6.16).
Dofetilide
Moderate‐certainty evidence indicated that dofetilide reduced recurrences of atrial fibrillation, compared to placebo, by about a quarter (RR 0.72, 95% CI 0.61 to 0.85; studies = 3, participants = 1183; I2 = 79%; Analysis 7.13). Recurrence rates were 84.2% in people receiving placebo and 60.6% (95% CI 51.4% to 71.6%) in people receiving dofetilide. The corresponding NNTB was 4 (95% CI 3 to 8) participants treated for one year to avoid one recurrence.
There was substantial heterogeneity between studies on dofetilide for this outcome (I2 = 79%, P = 0.008). All studies showed the same direction of effect (i.e. a reduction of atrial fibrillation recurrences) and the heterogeneity was probably caused by differences in the characteristics of recruited participants.
Sensitivity analyses did not differ from the main analysis (Analysis 7.14; Analysis 7.15; Analysis 7.16).
Dronedarone
Moderate‐certainty evidence from two RCTs showed a reduction of recurrences of atrial fibrillation with dronedarone of about 15% (RR 0.85, 95% CI 0.80 to 0.91; studies = 2, participants = 1443; I2 = 0%; Analysis 8.15). This corresponded to a recurrence rate of 76.6% in people treated with placebo and 65.1% (95% CI 61.3% to 69.7%) in people treated with dronedarone. The NNTB for dronedarone was 9 (95% CI 7 to 15) participants treated for one year to avoid one recurrence.
Results from sensitivity analyses were quasi‐identical (Analysis 8.16; Analysis 8.17).
Sotalol
High‐certainty evidence found a reduction of atrial fibrillation recurrences of about a fifth with sotalol compared with placebo or no treatment (RR 0.83, 95% CI 0.80 to 0.87; studies = 14, participants = 3179; I2 = 54%; Analysis 9.20). The corresponding recurrence rates were 78.8% in participants not receiving an antiarrhythmic and 65.4% (95% CI 63.1% to 68.6%) in participants receiving sotalol. The NNTB for sotalol was 7 (95% CI 6 to 10) participants treated for one year to avoid one recurrence.
There were no substantial difference with the main analysis in any of the sensitivity analyses (Analysis 9.21; Analysis 9.22; Analysis 9.23).
Head‐to‐head comparisons
In direct comparisons between antiarrhythmics (Table 5), amiodarone appeared to reduce the recurrence of atrial fibrillation more than the combined class I drugs, more than dronedarone and more than sotalol. There were no other differences in head‐to‐head comparisons between antiarrhythmics.
| Drug 1 vs drug 2 | Drug 1 | Drug 2 | RR (95% CI) | ||
| Events | Total | Events | Total | ||
| Disopyramide vs other class I drugs | |||||
| 16 | 29 | 16 | 28 | 0.97 (0.61 to 1.53) | |
| 10 | 31 | 11 | 25 | 0.73 (0.37 to 1.44) | |
| Quinidine vs flecainide | |||||
| 93 | 117 | 93 | 122 | 1.04 (0.91 to 1.19) | |
| 10 | 15 | 6 | 15 | 1.67 (0.81 to 3.41) | |
| Quinidine vs other class I drugs | |||||
| 16 | 28 | 16 | 29 | 1.04 (0.65 to 1.64) | |
| 93 | 117 | 93 | 122 | 1.04 (0.91 to 1.19) | |
| 57 | 98 | 53 | 102 | 1.12 (0.87 to 1.44) | |
| 10 | 15 | 6 | 15 | 1.67 (0.81 to 3.41) | |
| Quinidine vs sotalol | |||||
| 7 | 25 | 12 | 25 | 0.58 (0.28 to 1.23) | |
| 49 | 85 | 50 | 98 | 1.13 (0.87 to 1.47) | |
| 15 | 41 | 21 | 41 | 0.71 (0.43 to 1.18) | |
| 244 | 377 | 255 | 383 | 0.97 (0.88 to 1.08) | |
| 25 | 63 | 20 | 58 | 1.15 (0.72 to 1.84) | |
| 375 | 518 | 198 | 264 | 0.97 (0.88 to 1.05) | |
| Flecainide vs propafenone | |||||
| 19 | 48 | 26 | 49 | 0.75 (0.48 to 1.16) | |
| 30 | 97 | 30 | 103 | 1.06 (0.70 to 1.62) | |
| Amiodarone vs class I drugs | |||||
| 60 | 106 | 99 | 116 | 0.66 (0.55 to 0.80) | |
| 20 | 72 | 32 | 74 | 0.64 (0.41 to 1.01) | |
| 42 | 70 | 54 | 75 | 0.83 (0.66 to 1.06) | |
| 14 | 35 | 30 | 41 | 0.55 (0.35 to 0.85) | |
| 6 | 28 | 14 | 26 | 0.40 (0.18 to 0.88) | |
| Amiodarone vs dronedarone | |||||
| 116 | 255 | 163 | 249 | 0.69 (0.59 to 0.82) | |
| Amiodarone vs sotalol | |||||
| 58 | 131 | 81 | 125 | 0.68 (0.54 to 0.86) | |
| 27 | 65 | 39 | 61 | 0.65 (0.46 to 0.92) | |
| 24 | 51 | 36 | 51 | 0.67 (0.47 to 0.94) | |
| 42 | 70 | 24 | 31 | 0.78 (0.59 to 1.01) | |
| 133 | 267 | 183 | 261 | 0.71 (0.62 to 0.82) | |
| 3 | 11 | 10 | 17 | 0.46 (0.16 to 1.32) | |
| Dronedarone vs propafenone | |||||
| 36 | 50 | 37 | 50 | 0.97 (0.77 to 1.24) | |
| Sotalol vs class I drugs other than quinidine | |||||
| 67 | 88 | 81 | 95 | 0.89 (0.77 to 1.03) | |
| 8 | 20 | 6 | 20 | 1.33 (0.57 to 3.14) | |
| 43 | 85 | 35 | 86 | 1.24 (0.89 to 1.73) | |
| 32 | 50 | 35 | 50 | 0.91 (0.69 to 1.20) | |
| Sotalol vs dofetilide | |||||
| 74 | 108 | 196 | 321 | 1.12 (0.96 to 1.31) | |
| Sotalol vs beta‐blockers | |||||
| 57 | 69 | 54 | 66 | 1.01 (0.86 to 1.18) | |
| 31 | 64 | 29 | 64 | 1.07 (0.74 to 1.55) | |
CI: confidence interval; RR: risk ratio.
Other outcomes
Chronic anticoagulation with warfarin was mandatory (i.e. every participant received anticoagulation therapy throughout the whole follow‐up period) in only three studies (Channer 2004; Hillestad 1971; Van Gelder 1989). In the rest of the studies, the decision on anticoagulation use was left to the judgement of the attending physician. Unfortunately, no trial reported the actual frequency of anticoagulation in the different treatment groups during follow‐up.
Seven trials reported some data on the incidence of heart failure, which was low (ATHENA 2009; DIONYSOS 2010; FAPIS 1996; Hohnloser 1995; Kuhlkamp 2000; PRODIS 1996; Reimold 1993). There were no differences in those trials between participants receiving antiarrhythmics and participants receiving placebo or no treatment.
Subgroup analysis
Twenty‐three of the studies with a control group (placebo or no treatment) included only people with persistent atrial fibrillation. The mean duration of atrial fibrillation in those studies varied greatly, from three to 36 months. Only four studies exclusively included people with paroxysmal atrial fibrillation. The remaining studies included people with both paroxysmal and persistent atrial fibrillation; none reported outcomes separately by type of atrial fibrillation.
It was not possible to compare subgroups of people with permanent and paroxysmal atrial fibrillation for any given antiarrhythmic drug. Therefore, we analysed people with permanent atrial fibrillation separately, for the outcomes and drugs that was possible, but as a sensitivity analysis.
Other planned subgroup analyses (people with heart failure, studies where warfarin was mandatory versus those where it was discretionary, people with a structurally normal heart) were not possible as separate data for each group of participants were seldom available. A more detailed analysis by left ventricular function or by the New York Heart Association (NYHA) class was not possible either, for the same reason.
Discussion
In the third update of this systematic review, we found and included just one new RCT which added little additional information (100 participants, reported only atrial fibrillation recurrence rates). We excluded a previously included study as we become aware its data were already reported in another included study. Additionally, we restructured the analysis of the review to treat each drug separately, in order to present all analyses and results in a clearer way. In the end, some of the results regarding specific antiarrhythmics and conclusions of the review have changed.
Summary of main results
The primary aim of this review was to determine if long‐term treatment with antiarrhythmics carried any clinical benefit to participants in addition to maintenance of sinus rhythm. Consequently, we focused on all‐cause mortality, stroke and potential adverse effects of treatment as the main outcomes.
Concerning all‐cause mortality, we found that no antiarrhythmic drug produced a benefit on mortality and that some antiarrhythmics, sotalol and very probably quinidine, were actually associated with an increase in all‐cause mortality. Results for sotalol were particularly strong and the certainty of evidence was high: included studies had a low risk of bias for this outcome; results were consistent in all sensitivity analyses, replicating the results of the main analysis and indicating a clear association with increased mortality. The mortality rate in the pooled population was low, 0.8% in control participants (placebo or no treatment), but it was doubled in participants receiving sotalol. The mean NNTH was estimated at 102 participants treated for one year to have one additional death.
The results suggesting an increase in mortality also with quinidine were less solid. The CIs included the possibility of no difference and when the analysis was restricted to more recent, larger and higher‐certainty studies, two studies remained that showed no increase in all‐cause mortality in the active treatment groups (PAFAC 2004; SOPAT 2004). A possible explanation is that both studies used a lower dose of quinidine than earlier trials and that quinidine was combined with verapamil, which has been shown to reduce some of the proarrhythmic effects of quinidine, such as accelerated atrio‐ventricular conduction. Finally, the proportion of participants having structural heart disease was lower in the PAFAC 2004 and SOPAT 2004 studies than in earlier trials. Therefore, the certainty of the evidence pointing to increased all‐cause mortality with quinidine was low.
It is important to note that our data do not allow us to exclude a small increase in mortality with other antiarrhythmics, similar to those observed with quinidine and sotalol. Pooled data for other drugs included fewer studies and participants than for quinidine or sotalol and could be underpowered to detect effects that are of small size. In particular, we found very few data on mortality with flecainide. This is concerning because this drug has been shown to induce an excess of mortality in some trials (CAST 1991), and it showed a high risk of proarrhythmia in our review, similar to that of sotalol. The combined flecainide data had only a fifth of the participants included for sotalol and, despite the fact that several of the included studies stated that they analysed mortality, there were no deaths in any treatment group. Thus, we are very unsure about what the effect of long‐term treatment with flecainide on mortality might be. Similarly, the combined data for amiodarone for this outcome included four times fewer participants than with sotalol, so our power to detect small increases in mortality was very limited. Amiodarone has a well‐known high toxicity profile, it showed in our analysis one of the highest risk of withdrawing treatment due to adverse effects (RR 6.70, 95% CI 1.91 to 23.45) and was associated, in other meta‐analyses employing different methods, to a possible increase in mortality (Freemantle 2011; Piccini 2009) (see below: Agreements and disagreements with other studies or reviews).
With respect to adverse effects, virtually all the antiarrhythmics showed more withdrawals from treatment due to adverse effects and were associated with increased proarrhythmic events, compared with participants receiving placebo or no treatment. It is important to remember that we employed an extended definition of proarrhythmia that included severe, symptomatic bradycardia and AV blocks. Metoprolol was associated with an increase in proarrhythmia, precisely because of an increased incidence of severe bradycardias. Of all antiarrhythmics, quinidine at higher doses and sotalol appeared to be the drugs with more withdrawals because of adverse events both compared to controls and to other antiarrhythmics. Withdrawal rates with quinidine were as high as 25% in the pooled population analysed. Amiodarone, even if it compared favourably with class I drugs combined, had a very high RR (6.70) for increasing withdrawals compared to placebo. Moreover, these were the results at one‐year follow‐up, and the adverse effects of amiodarone are known to increase in frequency over time (Harris 1983; Lafuente‐Lafuente 2009).
Regarding other outcomes, our results showed that all the antiarrhythmic drugs studied reduced the recurrence of atrial fibrillation. However, the effectiveness of antiarrhythmics was limited: they reduced recurrences by 20% to 50% compared to controls, which meant that atrial fibrillation still recurred in many participants (43% to 67%) treated with antiarrhythmics at one year. Amiodarone seemed to be the most effective drug in preventing recurrences as it had the lowest RR and in head‐to‐head comparisons it was better than combined class I drugs, dronedarone or sotalol. In spite of this, atrial fibrillation recurred at one year in 43% of participants treated with amiodarone.
Above all, we did not find evidence of any clinical benefit derived from this reduction of recurrences of atrial fibrillation. The results on mortality showed no benefit with any drug, rather the contrary, as we have already discussed. Fewer data existed on stroke or heart failure, but what data we found showed no difference between participants receiving active antiarrhythmic treatment and those not receiving it. The only exception was a single study in which the stroke rate was lower in the dronedarone arm than in the placebo arm (ATHENA 2009). This finding was not confirmed by other studies of dronedarone. This lack of observable clinical benefit from the reduction of atrial fibrillation recurrences could have several explanations: 1. any potential benefit obtained with antiarrhythmics might be erased by the associated toxicity and increased proarrhythmic events; 2. clinical evolution and prognosis might be determined in many participants mostly by their underlying heart disease, rather than by atrial fibrillation itself.
An interesting result of this review was that metoprolol, a beta‐blocker, also showed a reduction in atrial fibrillation recurrence, based on the pooled data from two high‐certainty RCTs (Kuhlkamp 2000; Nergårdh 2007). Besides, there was no difference in preventing recurrences between beta‐blockers and sotalol in two other trials (DAPHNE 2008 comparing sotalol against metoprolol or atenolol, and Plewan 2001 against bisoprolol). The effect of beta‐blockers in reducing the recurrence of atrial fibrillation could be due to their ability to suppress atrial extrasystoles, known to be a frequent precipitant of paroxysmal atrial fibrillation (Haïssaguerre 1998). Beta‐blocker effects might also relate to antihypertensive and anti‐ischaemic actions or to their effect in reducing cardiac remodelling associated with coronary artery disease or heart failure. Like most of the active drugs we studied, metoprolol was associated with increased withdrawals due to adverse effects and increased cases of severe, symptomatic bradycardia.
Overall completeness and applicability of evidence
Most of the included trials reported data on all‐cause mortality, recurrence of atrial fibrillation and main adverse drug events. We also intended to analyse other clinically relevant outcomes such as the frequency of systemic embolism and use of long‐term anticoagulation, or the influence of heart failure and structural heart disease in the response to treatment. Unfortunately data on those outcomes were sparse, if reported at all. In the few trials where they were reported, the frequencies of stroke and heart failure were very low, perhaps because the populations that were included were low risk. The frequency of use of anticoagulants during follow‐up was not reported in any study.
Similarly, we wanted to analyse the influence of structural heart disease on effectiveness, especially with respect to left ventricular ejection fraction and left atrial size, and the influence of duration of atrial fibrillation before cardioversion. These are factors well known to influence the risk of recurrence of atrial fibrillation. Unfortunately this analysis was not possible as separate data were not available for those participants subgroups.
This lack of data for some clinical outcomes was the main limitation of our review. Another limitation could be that in many studies participants were followed up until atrial fibrillation recurred, and not thereafter, hence additional events between that point and the complete one year of follow‐up might have been missed. Also, the populations included in most studies were at low risk of events, the mean age of included participants was 64 years old and most of them had a normal left ventricular ejection fraction. We do not know if our results can be extrapolated to other patient populations, especially older people and those with a reduced left ventricular ejection fraction.
Finally, it is important to remember that maintaining sinus rhythm using long‐term antiarrhythmic drugs is only one possible step in the more general 'rhythm control' strategy, and antiarrhythmic drugs should be put within the perspective of the global strategy chosen for the patient (AHA/ACC/HRS 2014; NICE 2014). Other therapies have proven useful to prevent or reduce recurrence of atrial fibrillation in selected patients, especially catheter ablation (APAF 2006; Oral 2006; Terasawa 2009); and antiarrhythmics have been occasionally used for terminating recurrences (Alboni 2004). However, the effects of these therapies on the important clinical endpoints of all‐cause mortality, stroke and incidence of heart failure are still not well known. A different Cochrane Review has studied the effectiveness of catheter ablation for paroxysmal and persistent atrial fibrillation (Chen 2012).
Quality of the evidence
Two areas of concern regarding the risk of bias of included studies were present: 1. a lack of details, in about 70% of studies, on the procedures followed for randomisation and for concealing the allocation of participants; and 2. a lack of double‐blinding in approximately 60% of studies. The lack of details on the randomisation and concealing procedures can probably be explained, at least partly, by the fact that many of the studies were conducted in the 1980s and 1990s, when the standards for reporting research methods were less developed. Also, it was very difficult to obtain additional data from authors for studies so old. The lack of blinding particularly concerned studies comparing two antiarrhythmics and much less so those studies comparing an antiarrhythmic with no active treatment. Nevertheless, these concerns did not allow us to consider the evidence as 'high certainty'.
In addition to the risk of bias of included studies, another problem was that few data were available for some outcomes, causing imprecision, as analysis produced wide CIs including both the possibility of significant benefit and harm. This problem was more frequent with older drugs (e.g. quinidine, disopyramide, propafenone and flecainide) than newer ones (e.g. metoprolol, dronedarone and sotalol) and affected particularly mortality and, above all, stroke, outcomes that had a low frequency in the studied population. There was occasional inconsistency between studies for some outcomes (e.g. the effect on withdrawals with quinidine and sotalol), but was rare.
However, despite those potential limitations, there were two characteristics that increased our confidence in the results of the review. 1. Consistency of results: for each analysis, there were always several studies available and results were very consistent across individual studies, despite their differences in blinding or in the description of the allocation procedures. 2. Objective outcomes: with the only exception of withdrawals because of adverse effects, the outcomes analysed were measured objectively (ECG records) or were objective outcomes (stroke, mortality), which reduced the risk of bias associated to the lack of blinding.
In the end, we judged the available evidence for most analysed outcomes (all‐cause mortality, withdrawals due to adverse effects, proarrhythmia and recurrence of atrial fibrillation) as moderate certainty.
Potential biases in the review process
There was asymmetry in the funnel plot of one isolated outcome with sotalol (withdrawals because of adverse effects) but not for the other outcomes or with other drugs. Thus, we think the risk of substantial publication bias was low.
There were very few disagreements between authors regarding the inclusion and exclusion of candidate studies. There were also few disagreements regarding the data extracted from included studies. Disagreements were easily resolved by discussion and consensus in all cases.
Conflicts of interest could exist as most studies included in the review were funded by the company manufacturing the antiarrhythmic drug tested.
Agreements and disagreements with other studies or reviews
A previous meta‐analysis by Coplen 1990 found that quinidine increased all‐cause mortality. A meta‐analysis by Nichol 2002 found no difference in all‐cause mortality with any antiarrhythmic, but most of the trials that they pooled had very short follow‐up periods.
A more recent network meta‐analysis, using a mixed treatment comparison method (where the estimates obtained from direct and indirect comparisons are combined in a network of trials), also found an increase in all‐cause mortality associated with sotalol (Freemantle 2011). This meta‐analysis, as well as a different meta‐analysis that compared amiodarone and dronedarone (Piccini 2009), raised the possibility of an increase in mortality associated with amiodarone treatment compared with placebo. However, this result appeared in exploratory analysis (restricted to inclusion of larger studies) and not in the main analysis. Freemantle 2011 did not study quinidine in the meta‐analysis.
Another systematic review, published in 2013, employed different methods to ours (RCTs with follow‐up of three months or more, different statistical methods) but found very similar results: antiarrhythmic drugs reduced atrial fibrillation recurrences but increased withdrawals due to adverse effects, serious adverse effects and proarrhythmia (Sullivan 2013). This study also found, compared to placebo, an increased mortality in participants receiving sotalol and a trend to increased mortality with amiodarone. It did not study quinidine.
Two meta‐analysis, conducted by separate teams but using the same methods, focused on dronedarone and included people with atrial fibrillation but also with heart failure (Chatterjee 2012; De Vecchis 2019). Both found a trend to increased all‐cause and cardiovascular mortality with dronedarone, compared to placebo, in this population.

Selection of studies for inclusion. AF: atrial fibrillation.

Funnel plot of comparison: 9 Sotalol versus placebo/no treatment, outcome: 9.6 Withdrawals due to adverse effects – main analysis.

Risk of bias graph: review authors' judgements about each risk of bias item presented as percentages across all included studies.

Risk of bias summary: review authors' judgements about each risk of bias item for each included study.

All‐cause mortality with sotalol compared with placebo/no treatment: main analysis.

Comparison 1 Quinidine versus placebo or no treatment, Outcome 1 All‐cause mortality – main analysis.

Comparison 1 Quinidine versus placebo or no treatment, Outcome 2 All‐cause mortality – sensitivity analysis intention to treat (ITT) worse case: missing participants counted as events.

Comparison 1 Quinidine versus placebo or no treatment, Outcome 3 All‐cause mortality – subgroup analysis: older and recent studies.

Comparison 1 Quinidine versus placebo or no treatment, Outcome 4 All‐cause mortality – sensitivity analysis: persistent atrial fibrillation.

Comparison 1 Quinidine versus placebo or no treatment, Outcome 5 All‐cause mortality – sensitivity analysis: low risk of bias studies.

Comparison 1 Quinidine versus placebo or no treatment, Outcome 6 All‐cause mortality – sensitivity analysis: studies > 200 participants.

Comparison 1 Quinidine versus placebo or no treatment, Outcome 7 Withdrawals due to adverse effects – main analysis.

Comparison 1 Quinidine versus placebo or no treatment, Outcome 8 Withdrawals due to adverse effects – subgroup analysis: older and recent studies.

Comparison 1 Quinidine versus placebo or no treatment, Outcome 9 Withdrawals due to adverse effects – sensitivity analysis: persistent atrial fibrillation.

Comparison 1 Quinidine versus placebo or no treatment, Outcome 10 Withdrawals due to adverse effects – sensitivity analysis: low risk of bias studies.

Comparison 1 Quinidine versus placebo or no treatment, Outcome 11 Withdrawals due to adverse effects – sensitivity analysis: studies > 200 participants.

Comparison 1 Quinidine versus placebo or no treatment, Outcome 12 Proarrhythmia – main analysis.

Comparison 1 Quinidine versus placebo or no treatment, Outcome 13 Proarrhythmia – subgroup analysis: older and recent studies.

Comparison 1 Quinidine versus placebo or no treatment, Outcome 14 Proarrhythmia – sensitivity analysis: persistent atrial fibrillation.

Comparison 1 Quinidine versus placebo or no treatment, Outcome 15 Proarrhythmia – sensitivity analysis: low risk of bias studies.

Comparison 1 Quinidine versus placebo or no treatment, Outcome 16 Proarrhythmia – sensitivity analysis: studies > 200 participants.

Comparison 1 Quinidine versus placebo or no treatment, Outcome 17 Stroke – main analysis.

Comparison 1 Quinidine versus placebo or no treatment, Outcome 18 Stroke – sensitivity analysis: persistent atrial fibrillation.

Comparison 1 Quinidine versus placebo or no treatment, Outcome 19 Stroke – sensitivity analysis: low risk of bias studies.

Comparison 1 Quinidine versus placebo or no treatment, Outcome 20 Stroke – sensitivity analysis: studies > 200 participants.

Comparison 1 Quinidine versus placebo or no treatment, Outcome 21 Atrial fibrillation recurrence – main analysis.

Comparison 1 Quinidine versus placebo or no treatment, Outcome 22 Atrial fibrillation recurrence – sensitivity analysis: persistent atrial fibrillation.

Comparison 1 Quinidine versus placebo or no treatment, Outcome 23 Atrial fibrillation recurrence – sensitivity analysis: low risk of bias studies.

Comparison 1 Quinidine versus placebo or no treatment, Outcome 24 Atrial fibrillation recurrence – sensitivity analysis: studies > 200 participants.

Comparison 2 Disopyramide versus placebo or no treatment, Outcome 1 All‐cause mortality – main analysis.

Comparison 2 Disopyramide versus placebo or no treatment, Outcome 2 All‐cause mortality – intention to treat (ITT) worse case: missing participants counted as events.

Comparison 2 Disopyramide versus placebo or no treatment, Outcome 3 Withdrawals due to adverse effects – main analysis.

Comparison 2 Disopyramide versus placebo or no treatment, Outcome 4 Withdrawals due to adverse effects – sensitivity analysis: persistent atrial fibrillation.

Comparison 2 Disopyramide versus placebo or no treatment, Outcome 5 Stroke – main analysis.

Comparison 2 Disopyramide versus placebo or no treatment, Outcome 6 Stroke – subgroup analysis: persistent atrial fibrillation.

Comparison 2 Disopyramide versus placebo or no treatment, Outcome 7 Atrial fibrillation recurrence – main analysis.

Comparison 2 Disopyramide versus placebo or no treatment, Outcome 8 Atrial fibrillation recurrence – sensitivity analysis: persistent atrial fibrillation.

Comparison 3 Propafenone versus placebo or no treatment, Outcome 1 All‐cause mortality – main analysis.

Comparison 3 Propafenone versus placebo or no treatment, Outcome 2 All‐cause mortality – intention to treat (ITT) worse case: missing participants counted as events.

Comparison 3 Propafenone versus placebo or no treatment, Outcome 3 All‐cause mortality – sensitivity analysis: low risk of bias studies.

Comparison 3 Propafenone versus placebo or no treatment, Outcome 4 Withdrawals due to adverse effects – main analysis.

Comparison 3 Propafenone versus placebo or no treatment, Outcome 5 Withdrawals due to adverse effects – sensitivity analysis: studies > 200 participants.

Comparison 3 Propafenone versus placebo or no treatment, Outcome 6 Proarrhythmia – main analysis.

Comparison 3 Propafenone versus placebo or no treatment, Outcome 7 Proarrhythmia – sensitivity analysis: low risk of bias studies.

Comparison 3 Propafenone versus placebo or no treatment, Outcome 8 Atrial fibrillation recurrence – main analysis.

Comparison 3 Propafenone versus placebo or no treatment, Outcome 9 Atrial fibrillation recurrence – sensitivity analysis: low risk of bias studies.

Comparison 3 Propafenone versus placebo or no treatment, Outcome 10 Atrial fibrillation recurrence – sensitivity analysis: studies > 200 participants.

Comparison 4 Flecainide versus placebo or no treatment, Outcome 1 Withdrawals due to adverse effects – main analysis.

Comparison 4 Flecainide versus placebo or no treatment, Outcome 2 Proarrhythmia – main analysis.

Comparison 4 Flecainide versus placebo or no treatment, Outcome 3 Proarrhythmia – sensitivity analysis: persistent atrial fibrillation.

Comparison 4 Flecainide versus placebo or no treatment, Outcome 4 Proarrhythmia – sensitivity analysis: low risk of bias studies.

Comparison 4 Flecainide versus placebo or no treatment, Outcome 5 Proarrhythmia – sensitivity analysis: studies > 200 participants.

Comparison 4 Flecainide versus placebo or no treatment, Outcome 6 Stroke – main analysis.

Comparison 4 Flecainide versus placebo or no treatment, Outcome 7 Stroke – subgroup analysis: persistent atrial fibrillation.

Comparison 4 Flecainide versus placebo or no treatment, Outcome 8 Stroke – sensitivity analysis: low risk of bias studies.

Comparison 4 Flecainide versus placebo or no treatment, Outcome 9 Stroke – sensitivity analysis: studies > 200 participants.

Comparison 4 Flecainide versus placebo or no treatment, Outcome 10 Atrial fibrillation recurrence – main analysis.

Comparison 4 Flecainide versus placebo or no treatment, Outcome 11 Atrial fibrillation recurrence – sensitivity analysis: persistent atrial fibrillation.

Comparison 4 Flecainide versus placebo or no treatment, Outcome 12 Atrial fibrillation recurrence – sensitivity analysis: low risk of bias studies.

Comparison 4 Flecainide versus placebo or no treatment, Outcome 13 Atrial fibrillation recurrence – sensitivity analysis: studies > 200 participants.

Comparison 5 Metoprolol versus placebo or no treatment, Outcome 1 All‐cause mortality – main analysis.

Comparison 5 Metoprolol versus placebo or no treatment, Outcome 2 All‐cause mortality – intention to treat (ITT) worse case: missing participants counted as events.

Comparison 5 Metoprolol versus placebo or no treatment, Outcome 3 All‐cause mortality – sensitivity analysis: persistent atrial fibrillation.

Comparison 5 Metoprolol versus placebo or no treatment, Outcome 4 All‐cause mortality – sensitivity analysis: low risk of bias studies.

Comparison 5 Metoprolol versus placebo or no treatment, Outcome 5 All‐cause mortality – sensitivity analysis: studies > 200 participants.

Comparison 5 Metoprolol versus placebo or no treatment, Outcome 6 Withdrawals due to adverse effects – main analysis.

Comparison 5 Metoprolol versus placebo or no treatment, Outcome 7 Withdrawals due to adverse effects – sensitivity analysis: persistent atrial fibrillation.

Comparison 5 Metoprolol versus placebo or no treatment, Outcome 8 Withdrawals due to adverse effects – sensitivity analysis: low risk of bias studies.

Comparison 5 Metoprolol versus placebo or no treatment, Outcome 9 Withdrawals due to adverse effects – sensitivity analysis: studies > 200 participants.

Comparison 5 Metoprolol versus placebo or no treatment, Outcome 10 Proarrhythmia – main analysis.

Comparison 5 Metoprolol versus placebo or no treatment, Outcome 11 Proarrhythmia – sensitivity analysis: persistent atrial fibrillation.

Comparison 5 Metoprolol versus placebo or no treatment, Outcome 12 Proarrhythmia – sensitivity analysis: low risk of bias studies.

Comparison 5 Metoprolol versus placebo or no treatment, Outcome 13 Proarrhythmia – sensitivity analysis: studies > 200 participants.

Comparison 5 Metoprolol versus placebo or no treatment, Outcome 14 Atrial fibrillation recurrence – main analysis.

Comparison 5 Metoprolol versus placebo or no treatment, Outcome 15 Atrial fibrillation recurrence – sensitivity analysis: persistent atrial fibrillation.

Comparison 5 Metoprolol versus placebo or no treatment, Outcome 16 Atrial fibrillation recurrence – sensitivity analysis: low risk of bias studies.

Comparison 5 Metoprolol versus placebo or no treatment, Outcome 17 Atrial fibrillation recurrence – sensitivity analysis: studies > 200 participants.

Comparison 6 Amiodarone versus placebo or no treatment, Outcome 1 All‐cause mortality – main analysis.

Comparison 6 Amiodarone versus placebo or no treatment, Outcome 2 All‐cause mortality – intention to treat (ITT) worse case: missing participants counted as events.

Comparison 6 Amiodarone versus placebo or no treatment, Outcome 3 All‐cause mortality – sensitivity analysis: persistent atrial fibrillation.

Comparison 6 Amiodarone versus placebo or no treatment, Outcome 4 Withdrawals due to adverse effects – main analysis.

Comparison 6 Amiodarone versus placebo or no treatment, Outcome 5 Withdrawals due to adverse effects – sensitivity analysis: low risk of bias studies.

Comparison 6 Amiodarone versus placebo or no treatment, Outcome 6 Proarrhythmia – main analysis.

Comparison 6 Amiodarone versus placebo or no treatment, Outcome 7 Proarrhythmia – sensitivity analysis: persistent atrial fibrillation.

Comparison 6 Amiodarone versus placebo or no treatment, Outcome 8 Proarrhythmia – sensitivity analysis: low risk of bias studies.

Comparison 6 Amiodarone versus placebo or no treatment, Outcome 9 Proarrhythmia – sensitivity analysis: studies > 200 participants.

Comparison 6 Amiodarone versus placebo or no treatment, Outcome 10 Stroke – main analysis.

Comparison 6 Amiodarone versus placebo or no treatment, Outcome 11 Stroke – sensitivity analysis: persistent atrial fibrillation.

Comparison 6 Amiodarone versus placebo or no treatment, Outcome 12 Stroke – sensitivity analysis: studies > 200 participants.

Comparison 6 Amiodarone versus placebo or no treatment, Outcome 13 Atrial fibrillation recurrence – main analysis.

Comparison 6 Amiodarone versus placebo or no treatment, Outcome 14 Atrial fibrillation recurrence – sensitivity analysis: persistent atrial fibrillation.

Comparison 6 Amiodarone versus placebo or no treatment, Outcome 15 Atrial fibrillation recurrence – sensitivity analysis: low risk of bias studies.

Comparison 6 Amiodarone versus placebo or no treatment, Outcome 16 Atrial fibrillation recurrence – sensitivity analysis: studies > 200 participants.

Comparison 7 Dofetilide versus placebo or no treatment, Outcome 1 All‐cause mortality – main analysis.

Comparison 7 Dofetilide versus placebo or no treatment, Outcome 2 All‐cause mortality – intention to treat (ITT) worse case: missing participants counted as events.

Comparison 7 Dofetilide versus placebo or no treatment, Outcome 3 All‐cause mortality – sensitivity analysis: persistent atrial fibrillation.

Comparison 7 Dofetilide versus placebo or no treatment, Outcome 4 All‐cause mortality – sensitivity analysis: low risk of bias studies.

Comparison 7 Dofetilide versus placebo or no treatment, Outcome 5 All‐cause mortality – sensitivity analysis: studies > 200 participants.

Comparison 7 Dofetilide versus placebo or no treatment, Outcome 6 Withdrawals due to adverse effects – main analysis.

Comparison 7 Dofetilide versus placebo or no treatment, Outcome 7 Withdrawals due to adverse effects – sensitivity analysis: persistent atrial fibrillation.

Comparison 7 Dofetilide versus placebo or no treatment, Outcome 8 Withdrawals due to adverse effects – sensitivity analysis: studies > 200 participants.

Comparison 7 Dofetilide versus placebo or no treatment, Outcome 9 Proarrhythmia – main analysis.

Comparison 7 Dofetilide versus placebo or no treatment, Outcome 10 Proarrhythmia – sensitivity analysis: persistent atrial fibrillation.

Comparison 7 Dofetilide versus placebo or no treatment, Outcome 11 Proarrhythmia – sensitivity analysis: low risk of bias studies.

Comparison 7 Dofetilide versus placebo or no treatment, Outcome 12 Proarrhythmia – sensitivity analysis: studies > 200 participants.

Comparison 7 Dofetilide versus placebo or no treatment, Outcome 13 Atrial fibrillation recurrence – main analysis.

Comparison 7 Dofetilide versus placebo or no treatment, Outcome 14 Atrial fibrillation recurrence – sensitivity analysis: persistent atrial fibrillation.

Comparison 7 Dofetilide versus placebo or no treatment, Outcome 15 Atrial fibrillation recurrence – sensitivity analysis: low risk of bias studies.

Comparison 7 Dofetilide versus placebo or no treatment, Outcome 16 Atrial fibrillation recurrence – sensitivity analysis: studies > 200 participants.

Comparison 8 Dronedarone versus placebo or no treatment, Outcome 1 All‐cause mortality – main analysis.

Comparison 8 Dronedarone versus placebo or no treatment, Outcome 2 All‐cause mortality – intention to treat (ITT) worse case: missing participants counted as events.

Comparison 8 Dronedarone versus placebo or no treatment, Outcome 3 All‐cause mortality – sensitivity analysis: persistent atrial fibrillation.

Comparison 8 Dronedarone versus placebo or no treatment, Outcome 4 All‐cause mortality – sensitivity analysis: low risk of bias studies.

Comparison 8 Dronedarone versus placebo or no treatment, Outcome 5 All‐cause mortality – sensitivity analysis: studies > 200 participants.

Comparison 8 Dronedarone versus placebo or no treatment, Outcome 6 Withdrawals due to adverse effects – main analysis.

Comparison 8 Dronedarone versus placebo or no treatment, Outcome 7 Withdrawals due to adverse effects – sensitivity analysis: persistent atrial fibrillation.

Comparison 8 Dronedarone versus placebo or no treatment, Outcome 8 Withdrawals due to adverse effects – sensitivity analysis: low risk of bias studies.

Comparison 8 Dronedarone versus placebo or no treatment, Outcome 9 Withdrawals due to adverse effects – sensitivity analysis: studies > 200 participants.

Comparison 8 Dronedarone versus placebo or no treatment, Outcome 10 Proarrhythmia – main analysis.

Comparison 8 Dronedarone versus placebo or no treatment, Outcome 11 Proarrhythmia – sensitivity analysis: low risk of bias studies.

Comparison 8 Dronedarone versus placebo or no treatment, Outcome 12 Proarrhythmia – sensitivity analysis: studies > 200 participants.

Comparison 8 Dronedarone versus placebo or no treatment, Outcome 13 Stroke – main analysis.

Comparison 8 Dronedarone versus placebo or no treatment, Outcome 14 Stroke – sensitivity analysis: studies > 200 participants.

Comparison 8 Dronedarone versus placebo or no treatment, Outcome 15 Atrial fibrillation recurrence – main analysis.

Comparison 8 Dronedarone versus placebo or no treatment, Outcome 16 Atrial fibrillation recurrence – sensitivity analysis: persistent atrial fibrillation.

Comparison 8 Dronedarone versus placebo or no treatment, Outcome 17 Atrial fibrillation recurrence – sensitivity analysis: studies > 200 participants.

Comparison 9 Sotalol versus placebo or no treatment, Outcome 1 All‐cause mortality – main analysis.

Comparison 9 Sotalol versus placebo or no treatment, Outcome 2 All‐cause mortality – intention to treat (ITT) worse case: missing participants counted as events.

Comparison 9 Sotalol versus placebo or no treatment, Outcome 3 All‐cause mortality – sensitivity analysis: persistent atrial fibrillation.

Comparison 9 Sotalol versus placebo or no treatment, Outcome 4 All‐cause mortality – sensitivity analysis: low risk of bias studies.

Comparison 9 Sotalol versus placebo or no treatment, Outcome 5 All‐cause mortality – sensitivity analysis: studies > 200 participants.

Comparison 9 Sotalol versus placebo or no treatment, Outcome 6 Withdrawals due to adverse effects – main analysis.

Comparison 9 Sotalol versus placebo or no treatment, Outcome 7 Withdrawals due to adverse effects – sotalol: heterogeneity study.

Comparison 9 Sotalol versus placebo or no treatment, Outcome 8 Withdrawals due to adverse effects – sensitivity analysis: persistent atrial fibrillation.

Comparison 9 Sotalol versus placebo or no treatment, Outcome 9 Withdrawals due to adverse effects – sensitivity analysis: low risk of bias studies.

Comparison 9 Sotalol versus placebo or no treatment, Outcome 10 Withdrawals due to adverse effects – sensitivity analysis: studies > 200 participants.

Comparison 9 Sotalol versus placebo or no treatment, Outcome 11 Proarrhythmia – main analysis.

Comparison 9 Sotalol versus placebo or no treatment, Outcome 12 Proarrhythmia – sotalol: heterogeneity study.

Comparison 9 Sotalol versus placebo or no treatment, Outcome 13 Proarrhythmia – sensitivity analysis: persistent atrial fibrillation.

Comparison 9 Sotalol versus placebo or no treatment, Outcome 14 Proarrhythmia – sensitivity analysis: low risk of bias studies.

Comparison 9 Sotalol versus placebo or no treatment, Outcome 15 Proarrhythmia – sensitivity analysis: studies > 200 participants.
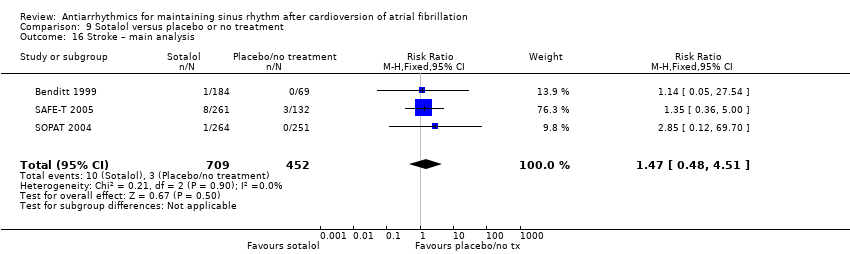
Comparison 9 Sotalol versus placebo or no treatment, Outcome 16 Stroke – main analysis.

Comparison 9 Sotalol versus placebo or no treatment, Outcome 17 Stroke – sensitivity analysis: persistent atrial fibrillation.

Comparison 9 Sotalol versus placebo or no treatment, Outcome 18 Stroke – sensitivity analysis: low risk of bias studies.

Comparison 9 Sotalol versus placebo or no treatment, Outcome 19 Stroke – sensitivity analysis: studies > 200 participants.

Comparison 9 Sotalol versus placebo or no treatment, Outcome 20 Atrial fibrillation recurrence – main analysis.

Comparison 9 Sotalol versus placebo or no treatment, Outcome 21 Atrial fibrillation recurrence – sensitivity analysis: persistent atrial fibrillation.

Comparison 9 Sotalol versus placebo or no treatment, Outcome 22 Atrial fibrillation recurrence – sensitivity analysis: low risk of bias studies.

Comparison 9 Sotalol versus placebo or no treatment, Outcome 23 Atrial fibrillation recurrence – sensitivity analysis: studies > 200 participants.
| Quinidine compared to placebo or no treatment for maintaining sinus rhythm after cardioversion of atrial fibrillation | ||||||
| Patient or population: adults in sinus rhythm after cardioversion of atrial fibrillation | ||||||
| Outcomes | Anticipated absolute effects* (95% CI) | Relative effect | № of participants | Certainty of the evidence | Comments | |
| Risk with placebo or no treatment | Risk with quinidine | |||||
| All‐cause mortality | Study population | RR 2.01 | 1646 | ⊕⊕⊝⊝ | — | |
| 8 per 1000 | 15 per 1000 | |||||
| Withdrawals due to adverse effects | Study population | RR 1.56 (0.87 to 2.78) | 1669 | ⊕⊕⊕⊝ | Heterogeneity was high for the main analysis (I2 = 67%), but the test for subgroup differences indicated that the RR was higher in older studies which used a higher dose. | |
| 163 per 1000 | 254 per 1000 (142 to 452) | |||||
| Proarrhythmia | Study population | RR 2.05 | 1676 | ⊕⊕⊕⊕ | — | |
| 11 per 1000 | 22 per 1000 | |||||
| Stroke | Study population | RR 0.97 | 1107 | ⊕⊕⊝⊝ | — | |
| 5 per 1000 | 5 per 1000 | |||||
| Recurrence of atrial fibrillation | Study population | RR 0.83 | 1624 | ⊕⊕⊕⊕ | — | |
| 80.5 per 100 | 66.8 per 100 | |||||
| *The risk in the intervention group (and its 95% confidence interval) is based on the assumed risk in the comparison group and the relative effect of the intervention (and its 95% CI). CI: confidence interval; RCT: randomised controlled trial; RR: risk ratio. | ||||||
| GRADE Working Group grades of evidence | ||||||
| aDowngraded one level for study limitations: majority of studies were at low or unclear risk of bias for at least one of the key domains (allocation concealment, blinding, incomplete outcome data). | ||||||
| Disopyramide compared to placebo or no treatment for maintaining sinus rhythm after cardioversion of atrial fibrillation | ||||||
| Patient or population: adults in sinus rhythm after cardioversion of atrial fibrillation | ||||||
| Outcomes | Anticipated absolute effects* (95% CI) | Relative effect | № of participants | Certainty of the evidence | Comments | |
| Risk with placebo or no treatment | Risk with disopyramide | |||||
| All‐cause mortality | Study population | RR 5.00 | 92 | ⊕⊝⊝⊝ | Anticipated absolute effects per 1000 could not be calculated because there were no deaths in the control group. Risks were the data from the RCT. | |
| 0/71 | 5/75 | |||||
| Withdrawals due to adverse effects | Study population | RR 3.68 | 146 | ⊕⊕⊝⊝ | — | |
| 28 per 1000 | 104 per 1000 | |||||
| Proarrhythmia | — | — | — | — | — | Not reported |
| Stroke | Study population | RR 0.31 | 146 | ⊕⊝⊝⊝ | — | |
| 28 per 1000 | 9 per 1000 | |||||
| Recurrence of atrial fibrillation | Study population | RR 0.77 | 146 | ⊕⊕⊝⊝ | — | |
| 69.0 per 100 | 53.1 per 100 | |||||
| *The risk in the intervention group (and its 95% confidence interval) is based on the assumed risk in the comparison group and the relative effect of the intervention (and its 95% CI). CI: confidence interval; RCT: randomised controlled trial; RR: risk ratio. | ||||||
| GRADE Working Group grades of evidence | ||||||
| aDowngraded one level for study limitations: both studies had unclear risk of bias for one of the key domains. | ||||||
| Propafenone compared to placebo or no treatment for maintaining sinus rhythm after cardioversion of atrial fibrillation | ||||||
| Patient or population: adults in sinus rhythm after cardioversion of atrial fibrillation | ||||||
| Outcomes | Anticipated absolute effects* (95% CI) | Relative effect | № of participants | Certainty of the evidence | Comments | |
| Risk with placebo or no treatment | Risk with propafenone | |||||
| All‐cause mortality | Study population | RR 0.19 | 212 | ⊕⊝⊝⊝ | Very few data available for this outcome: only 2 deaths reported in 5 included RCTs. | |
| 26 per 1000 | 5 per 1000 | |||||
| Withdrawals due to adverse effects | Study population | RR 1.62 | 1098 | ⊕⊕⊕⊝ | — | |
| 61 per 1000 | 99 per 1000 | |||||
| Proarrhythmia | Study population | RR 1.32 | 381 | ⊕⊝⊝⊝ | — | |
| 13 per 1000 | 17 per 1000 | |||||
| Stroke | — | — | — | — | — | Not reported |
| Recurrence of atrial fibrillation | Study population | RR 0.67 | 1098 | ⊕⊕⊕⊝ | — | |
| 73.0 per 100 | 48.9 per 100 | |||||
| *The risk in the intervention group (and its 95% confidence interval) is based on the assumed risk in the comparison group and the relative effect of the intervention (and its 95% CI). CI: confidence interval; RCT: randomised controlled trial; RR: risk ratio. | ||||||
| GRADE Working Group grades of evidence | ||||||
| aDowngraded one level for study limitations. All studies had unclear or high risk of bias in at least one of the three key domains (allocation concealment, blinding, incomplete outcome data). | ||||||
| Flecainide compared to placebo or no treatment for maintaining sinus rhythm after cardioversion of atrial fibrillation | ||||||
| Patient or population: adults in sinus rhythm after cardioversion of atrial fibrillation | ||||||
| Outcomes | Anticipated absolute effects* (95% CI) | Relative effect | № of participants | Certainty of the evidence | Comments | |
| Risk with placebo or no treatment | Risk with flecainide | |||||
| All‐cause mortality | — | — | — | — | — | Not reported |
| Withdrawals due to adverse effects | Study population | RR 15.41 | 73 | ⊕⊕⊝⊝ | Anticipated absolute effects per 1000 could not be calculated because there were no withdrawals in the control group. Risks were the data from the RCT. | |
| 0/37 | 7/36 | |||||
| Proarrhythmia | Study population | RR 4.80 | 511 | ⊕⊕⊕⊝ | — | |
| 6 per 1000 | 30 per 1000 | |||||
| Stroke | Study population | RR 2.04 | 362 | ⊕⊕⊝⊝ | Anticipated absolute effects per 1000 could not be calculated because there were no strokes in the control group. Risks were the data from the RCT. | |
| 0/81 | 3/281 | |||||
| Recurrence of atrial fibrillation | Study population | RR 0.65 | 511 | ⊕⊕⊕⊕ | — | |
| 69.8 per 100 | 45.4 per 100 | |||||
| *The risk in the intervention group (and its 95% confidence interval) is based on the assumed risk in the comparison group and the relative effect of the intervention (and its 95% CI). CI: confidence interval; RCT: randomised controlled trial; RR: risk ratio. | ||||||
| GRADE Working Group grades of evidence | ||||||
| aNot downgraded for study limitations. the only included study was at high risk of bias for blinding (less relevant for this outcome) but low risk for other key domains. | ||||||
| Metoprolol compared to placebo or no treatment for maintaining sinus rhythm after cardioversion of atrial fibrillation | ||||||
| Patient or population: adults in sinus rhythm after cardioversion of atrial fibrillation | ||||||
| Outcomes | Anticipated absolute effects* (95% CI) | Relative effect | № of participants | Certainty of the evidence | Comments | |
| Risk with placebo or no treatment | Risk with Metoprolol | |||||
| All‐cause mortality | Study population | RR 2.02 | 562 | ⊕⊕⊕⊝ | — | |
| 4 per 1000 | 7 per 1000 | |||||
| Withdrawals due to adverse effects | Study population | RR 3.47 | 562 | ⊕⊕⊕⊕ | — | |
| 21 per 1000 | 74 per 1000 | |||||
| Proarrhythmia | Study population | RR 18.14 | 562 | ⊕⊕⊕⊕ | Anticipated absolute effects per 1000 could not be calculated because there were no events in the control group. Risks are the data from the RCTs. | |
| 0 / 282 | 17 / 280 | |||||
| Stroke | — | — | — | — | — | Not reported |
| Recurrence of atrial fibrillation | Study population | RR 0.83 (0.68 to 1.02) | 562 | ⊕⊕⊕⊝ | — | |
| 72.0 per 100 | 59.7 per 100 | |||||
| *The risk in the intervention group (and its 95% confidence interval) is based on the assumed risk in the comparison group and the relative effect of the intervention (and its 95% CI). CI: confidence interval; RCT: randomised controlled trial; RR: risk ratio. | ||||||
| GRADE Working Group grades of evidence | ||||||
| aDowngraded one level for imprecision. Confidence intervals included both possible harm and possible benefit. | ||||||
| Amiodarone compared to placebo or no treatment for maintaining sinus rhythm after cardioversion of atrial fibrillation | ||||||
| Patient or population: adults in sinus rhythm after cardioversion of atrial fibrillation | ||||||
| Outcomes | Anticipated absolute effects* (95% CI) | Relative effect | № of participants | Certainty of the evidence | Comments | |
| Risk with placebo or no treatment | Risk with amiodarone | |||||
| All‐cause mortality | Study population | RR 1.66 | 444 | ⊕⊕⊕⊝ | — | |
| 26 per 1000 | 43 per 1000 | |||||
| Withdrawals due to adverse effects | Study population | RR 6.70 | 319 | ⊕⊕⊝⊝ | — | |
| 7 per 1000 | 49 per 1000 | |||||
| Proarrhythmia | Study population | RR 2.22 | 673 | ⊕⊕⊕⊝ | — | |
| 8 per 1000 | 18 per 1000 | |||||
| Stroke | Study population | RR 1.15 | 399 | ⊕⊕⊝⊝ | — | |
| 23 per 1000 | 26 per 1000 | |||||
| Recurrence of atrial fibrillation | Study population | RR 0.52 | 812 | ⊕⊕⊕⊕ | — | |
| 81.2 per 100 | 42.2 per 100 | |||||
| *The risk in the intervention group (and its 95% confidence interval) is based on the assumed risk in the comparison group and the relative effect of the intervention (and its 95% CI). CI: confidence interval; RCT: randomised controlled trial; RR: risk ratio. | ||||||
| GRADE Working Group grades of evidence | ||||||
| aDowngraded one level for imprecision: confidence interval included both possible benefit and harm. | ||||||
| Dofetilide compared to placebo or no treatment for maintaining sinus rhythm after cardioversion of atrial fibrillation | ||||||
| Patient or population: adults in sinus rhythm after cardioversion of atrial fibrillation | ||||||
| Outcomes | Anticipated absolute effects* (95% CI) | Relative effect | № of participants | Certainty of the evidence | Comments | |
| Risk with placebo or no treatment | Risk with dofetilide | |||||
| All‐cause mortality | Study population | RR 0.98 | 1183 | ⊕⊕⊕⊝ | — | |
| 193 per 1000 | 189 per 1000 | |||||
| Withdrawals due to adverse effects | Study population | RR 1.77 | 677 | ⊕⊕⊝⊝ | — | |
| 34 per 1000 | 61 per 1000 | |||||
| Proarrhythmia | Study population | RR 5.50 | 1183 | ⊕⊕⊕⊝ | — | |
| 2 per 1000 | 13 per 1000 | |||||
| Stroke | — | — | — | — | — | Not reported |
| Recurrence of atrial fibrillation | Study population | RR 0.72 (0.61 to 0.85) | 1183 | ⊕⊕⊕⊝ | — | |
| 84.2 per 100 | 60.6 per 100 | |||||
| *The risk in the intervention group (and its 95% confidence interval) is based on the assumed risk in the comparison group and the relative effect of the intervention (and its 95% CI). CI: confidence interval; RCT: randomised controlled trial; RR: risk ratio. | ||||||
| GRADE Working Group grades of evidence | ||||||
| aDowngraded one level for study limitations: majority of studies had unclear risk of selection bias. | ||||||
| Dronedarone compared to placebo or no treatment for maintaining sinus rhythm after cardioversion of atrial fibrillation | ||||||
| Patient or population: adults in sinus rhythm after cardioversion of atrial fibrillation | ||||||
| Outcomes | Anticipated absolute effects* (95% CI) | Relative effect | № of participants | Certainty of the evidence | Comments | |
| Risk with placebo or no treatment | Risk with dronedarone | |||||
| All‐cause mortality | Study population | RR 0.86 | 6071 | ⊕⊕⊕⊕ | — | |
| 51 per 1000 | 44 per 1000 | |||||
| Withdrawals due to adverse effects | Study population | RR 1.58 | 6071 | ⊕⊕⊕⊝ | — | |
| 77 per 1000 | 122 per 1000 | |||||
| Proarrhythmia | Study population | RR 1.95 (0.77 to 4.98) | 5872 | ⊕⊕⊕⊝ | — | |
| 18 per 1000 | 36 per 1000 | |||||
| Stroke | Study population | RR 0.66 | 5872 | ⊕⊕⊕⊕ | — | |
| 27 per 1000 | 18 per 1000 | |||||
| Recurrence of atrial fibrillation | Study population | RR 0.85 | 1443 | ⊕⊕⊕⊝ | — | |
| 76.6 per 100 | 65.1 per 100 | |||||
| *The risk in the intervention group (and its 95% confidence interval) is based on the assumed risk in the comparison group and the relative effect of the intervention (and its 95% CI). CI: confidence interval; RCT: randomised controlled trial; RR: risk ratio. | ||||||
| GRADE Working Group grades of evidence | ||||||
| aDowngraded one level for study limitations: 83% of weight came from a study with unclear blinding, which could be relevant to this outcome. | ||||||
| Sotalol compared to placebo or no treatment for maintaining sinus rhythm after cardioversion of atrial fibrillation | ||||||
| Patient or population: adults in sinus rhythm after cardioversion of atrial fibrillation | ||||||
| Outcomes | Anticipated absolute effects* (95% CI) | Relative effect | № of participants | Certainty of the evidence | Comments | |
| Risk with placebo or no treatment | Risk with sotalol | |||||
| All‐cause mortality | Study population | RR 2.23 | 1882 | ⊕⊕⊕⊕ | — | |
| 8 per 1000 | 19 per 1000 | |||||
| Withdrawals due to adverse effects | Study population | RR 1.95 (1.23 to 3.11) | 2688 | ⊕⊕⊕⊝ | Heterogeneity was high for the main analysis (I2 = 56%), but the test for subgroup differences indicated that the RR was higher in older studies with sotalol. | |
| 94 per 1000 | 183 per 1000 | |||||
| Proarrhythmia | Study population | RR 3.55 | 2989 | ⊕⊕⊕⊝ | — | |
| 12 per 1000 | 41 per 1000 | |||||
| Stroke | Study population | RR 1.47 | 1161 | ⊕⊕⊕⊝ | — | |
| 7 per 1000 | 10 per 1000 | |||||
| Recurrence of atrial fibrillation | Study population | RR 0.83 | 3179 | ⊕⊕⊕⊕ | — | |
| 78.8 per 100 | 65.4 per 100 | |||||
| *The risk in the intervention group (and its 95% confidence interval) is based on the assumed risk in the comparison group and the relative effect of the intervention (and its 95% CI). CI: confidence interval; RCT: randomised controlled trial; RR: risk ratio. | ||||||
| GRADE Working Group grades of evidence | ||||||
| aNot downgraded for study limitations. Although the majority of studies had unclear or high risk of bias in at least one of the key domains, the majority of the weight was from studies at low risk of bias in key domains. | ||||||
| Primary outcomes | n trials reporting (n participants) | n trials NOT reporting (n participants) |
| All‐cause mortality | 39 (17,586) | 3a (393) |
| Cardiovascular mortality | Same as total mortality | Same as total mortality |
| Stroke | 11 (9139) | 30 (8840) |
| Adverse effects (proarrhythmia and withdrawals due to adverse effects) | 39 (16,558) | 3b (1421) |
| Out of 41 studies comparing an active drug with a control group receiving no antiarrhythmic (total 17,979 participants). aChun 2014; DAPHNE 2008; Santas 2012. bAFIB 1997; Chun 2014; Santas 2012. Others studies did not reported proarrhythmia but reported withdrawals (DAPHNE 2008; Niu 2006; Villani 1992). | ||
| Drug 1 vs drug 2 | Drug 1 | Drug 2 | RR (95% CI) | ||
| Events | Total | Events | Total | ||
| Disopyramide vs other class I drugs | |||||
| 0 | 29 | 2 | 28 | 0.19 (0.01 to 3.86) | |
| 1 | 31 | 0 | 25 | 2.44 (0.10 to 57.37) | |
| Quinidine vs other class I drugs | |||||
| 2 | 28 | 0 | 29 | 5.17 (0.26 to 103.18) | |
| 0 | 98 | 2 | 102 | 0.21 (0.01 to 4.28) | |
| Quinidine vs sotalol | |||||
| 1 | 85 | 1 | 98 | 1.15 (0.07 to 18.15) | |
| 1 | 41 | 0 | 41 | 3.00 (0.13 to 71.56) | |
| 9 | 377 | 13 | 383 | 0.70 (0.30 to 1.63) | |
| 0 | 63 | 1 | 58 | 0.31 (0.01 to 7.40) | |
| 2 | 518 | 2 | 264 | 0.51 (0.07 to 3.60) | |
| Flecainide vs propafenone | |||||
| 0 | 48 | 1 | 49 | 0.34 (0.01 to 8.15) | |
| Amiodarone vs class I drugs | |||||
| 10 | 106 | 26 | 116 | 0.42 (0.21 to 0.83) | |
| 6 | 70 | 2 | 75 | 3.21 (0.67 to 15.40) | |
| Amiodarone vs dronedarone | |||||
| 5 | 255 | 2 | 249 | 2.44 (0.48 to 12.47) | |
| Amiodarone vs sotalol | |||||
| 15 | 131 | 24 | 125 | 0.60 (0.33 to 1.08) | |
| 6 | 70 | 0 | 31 | 5.86 (0.34 to 100.89) | |
| 13 | 267 | 15 | 261 | 0.85 (0.41 to 1.75) | |
| Sotalol vs class I drugs other than quinidine | |||||
| 13 | 88 | 17 | 95 | 0.83 (0.43 to 1.60) | |
| 2 | 50 | 0 | 50 | 5.00 (0.25 to 101.58) | |
| Sotalol vs dofetilide | |||||
| 0 | 108 | 1 | 321 | 0.98 (0.04 to 23.99) | |
| CI: confidence interval; RR: risk ratio. | |||||
| Drug 1 vs drug 2 | Drug 1 | Drug 2 | RR (95% CI) | ||
| Events | Total | Events | Total | ||
| Disopyramide vs other class I drugs | |||||
| 2 | 29 | 4 | 28 | 0.48 (0.10 to 2.43) | |
| 4 | 31 | 8 | 25 | 0.40 (0.14 to 1.19) | |
| Quinidine vs flecainide | |||||
| 35 | 117 | 22 | 122 | 1.66 (1.04 to 2.65) | |
| 2 | 15 | 0 | 15 | 5.00 (0.26 to 96.13) | |
| Quinidine vs other class I drugs | |||||
| 4 | 28 | 2 | 29 | 2.07 (0.41 to 10.43) | |
| 35 | 117 | 22 | 122 | 1.66 (1.04 to 2.65) | |
| 23 | 98 | 10 | 102 | 2.39 (1.20 to 4.77) | |
| 2 | 15 | 0 | 15 | 5.00 (0.26 to 96.13) | |
| Quinidine vs sotalol | |||||
| 10 | 25 | 1 | 25 | 10.00 (1.38 to 72.39) | |
| 22 | 85 | 11 | 98 | 2.31 (1.19 to 4.47) | |
| 7 | 41 | 3 | 41 | 2.33 (0.65 to 8.40) | |
| 94 | 377 | 96 | 383 | 0.99 (0.78 to 1.27) | |
| 10 | 63 | 7 | 58 | 1.32 (0.54 to 3.23) | |
| 87 | 518 | 53 | 264 | 0.84 (0.62 to 1.14) | |
| Flecainide vs propafenone | |||||
| 2 | 48 | 9 | 49 | 0.23 (0.05 to 1.00) | |
| 10 | 97 | 9 | 103 | 1.18 (0.50 to 2.78) | |
| Amiodarone vs class I drugs | |||||
| 20 | 154 | 47 | 121 | 0.33 (0.21 to 0.53) | |
| 17 | 72 | 2 | 74 | 8.74 (2.09 to 36.46) | |
| 5 | 70 | 2 | 31 | 1.11 (0.23 to 5.40) | |
| 3 | 35 | 10 | 41 | 0.35 (0.10 to 1.18) | |
| 1 | 28 | 1 | 26 | 0.93 (0.06 to 14.09) | |
| Amiodarone vs dronedarone | |||||
| 45 | 255 | 32 | 249 | 1.37 (0.90 to 2.09) | |
| Amiodarone vs sotalol | |||||
| 20 | 154 | 21 | 135 | 0.83 (0.47 to 1.47) | |
| 11 | 65 | 3 | 61 | 3.44 (1.01 to 11.75) | |
| 5 | 51 | 7 | 51 | 0.71 (0.24 to 2.10) | |
| 6 | 70 | 0 | 31 | 5.86 (0.34 to 100.89) | |
| 1 | 22 | 4 | 33 | 0.38 (0.04 to 3.14) | |
| Sotalol vs class I drugs other than quinidine | |||||
| 21 | 135 | 47 | 121 | 0.40 (0.25 to 0.63) | |
| 5 | 85 | 5 | 86 | 1.01 (0.30 to 3.37) | |
| 6 | 50 | 4 | 50 | 1.50 (0.45 to 4.99) | |
| Sotalol vs dofetilide | |||||
| 16 | 108 | 22 | 321 | 2.16 (1.18 to 3.96) | |
| Sotalol vs other beta‐blockers | |||||
| 11 | 69 | 2 | 66 | 5.26 (1.21 to 22.84) | |
| 4 | 64 | 3 | 64 | 1.33 (0.31 to 5.72) | |
| CI: confidence interval; RR: risk ratio. | |||||
| Drug 1 vs drug 2 | Drug 1 | Drug 2 | RR (95% CI) | ||
| Events | Total | Events | Total | ||
| Disopyramide vs other class I drugs | |||||
| 0 | 29 | 1 | 28 | 0.32 (0.01 to 7.59) | |
| 1 | 31 | 1 | 25 | 0.81 (0.05 to 12.26) | |
| Quinidine vs flecainide | |||||
| 10 | 117 | 7 | 122 | 1.49 (0.59 to 3.78) | |
| 2 | 15 | 1 | 15 | 2.00 (0.20 to 19.78) | |
| Quinidine vs other class I drugs | |||||
| 1 | 28 | 0 | 29 | 3.10 (0.13 to 73.12) | |
| 10 | 117 | 7 | 122 | 1.49 (0.59 to 3.78) | |
| 2 | 98 | 2 | 102 | 1.04 (0.15 to 7.24) | |
| 2 | 15 | 1 | 15 | 2.00 (0.20 to 19.78) | |
| Quinidine vs sotalol | |||||
| 3 | 25 | 1 | 25 | 3.00 (0.33 to 26.92) | |
| 1 | 85 | 1 | 98 | 1.15 (0.07 to 18.15) | |
| 1 | 41 | 2 | 41 | 0.50 (0.05 to 5.30) | |
| 17 | 377 | 20 | 383 | 0.86 (0.46 to 1.62) | |
| 2 | 63 | 3 | 58 | 0.61 (0.11 to 3.54) | |
| 8 | 518 | 2 | 264 | 2.04 (0.44 to 9.53) | |
| Flecainide vs propafenone | |||||
| 0 | 48 | 4 | 49 | 0.11 (0.01 to 2.05) | |
| 2 | 97 | 1 | 103 | 2.12 (0.20 to 23.05) | |
| Amiodarone vs class I drugs | |||||
| 5 | 154 | 20 | 121 | 0.20 (0.08 to 0.51) | |
| 2 | 72 | 2 | 74 | 1.03 (0.15 to 7.10) | |
| 1 | 28 | 1 | 26 | 0.93 (0.06 to 14.09) | |
| Amiodarone vs dronedarone | |||||
| 4 | 255 | 2 | 249 | 1.95 (0.36 to 10.57) | |
| Amiodarone vs sotalol | |||||
| 5 | 154 | 9 | 135 | 0.49 (0.17 to 1.42) | |
| 2 | 65 | 2 | 61 | 0.94 (0.14 to 6.46) | |
| 6 | 267 | 9 | 261 | 0.65 (0.24 to 1.81) | |
| Sotalol vs class I drugs other than quinidine | |||||
| 9 | 135 | 20 | 121 | 0.40 (0.19 to 0.85) | |
| 5 | 20 | 3 | 20 | 1.67 (0.46 to 6.06) | |
| 3 | 85 | 2 | 86 | 1.52 (0.26 to 8.86) | |
| 9 | 50 | 6 | 50 | 1.50 (0.58 to 3.90) | |
| Sotalol vs dofetilide | |||||
| 2 | 108 | 7 | 321 | 0.85 (0.18 to 4.03) | |
| Sotalol vs other beta‐blockers | |||||
| 4 | 64 | 3 | 64 | 1.33 (0.31 to 5.72) | |
| CI: confidence interval; RR: risk ratio. | |||||
| Drug 1 vs drug 2 | Drug 1 | Drug 2 | RR (95% CI) | ||
| Events | Total | Events | Total | ||
| Disopyramide vs other class I drugs | |||||
| 16 | 29 | 16 | 28 | 0.97 (0.61 to 1.53) | |
| 10 | 31 | 11 | 25 | 0.73 (0.37 to 1.44) | |
| Quinidine vs flecainide | |||||
| 93 | 117 | 93 | 122 | 1.04 (0.91 to 1.19) | |
| 10 | 15 | 6 | 15 | 1.67 (0.81 to 3.41) | |
| Quinidine vs other class I drugs | |||||
| 16 | 28 | 16 | 29 | 1.04 (0.65 to 1.64) | |
| 93 | 117 | 93 | 122 | 1.04 (0.91 to 1.19) | |
| 57 | 98 | 53 | 102 | 1.12 (0.87 to 1.44) | |
| 10 | 15 | 6 | 15 | 1.67 (0.81 to 3.41) | |
| Quinidine vs sotalol | |||||
| 7 | 25 | 12 | 25 | 0.58 (0.28 to 1.23) | |
| 49 | 85 | 50 | 98 | 1.13 (0.87 to 1.47) | |
| 15 | 41 | 21 | 41 | 0.71 (0.43 to 1.18) | |
| 244 | 377 | 255 | 383 | 0.97 (0.88 to 1.08) | |
| 25 | 63 | 20 | 58 | 1.15 (0.72 to 1.84) | |
| 375 | 518 | 198 | 264 | 0.97 (0.88 to 1.05) | |
| Flecainide vs propafenone | |||||
| 19 | 48 | 26 | 49 | 0.75 (0.48 to 1.16) | |
| 30 | 97 | 30 | 103 | 1.06 (0.70 to 1.62) | |
| Amiodarone vs class I drugs | |||||
| 60 | 106 | 99 | 116 | 0.66 (0.55 to 0.80) | |
| 20 | 72 | 32 | 74 | 0.64 (0.41 to 1.01) | |
| 42 | 70 | 54 | 75 | 0.83 (0.66 to 1.06) | |
| 14 | 35 | 30 | 41 | 0.55 (0.35 to 0.85) | |
| 6 | 28 | 14 | 26 | 0.40 (0.18 to 0.88) | |
| Amiodarone vs dronedarone | |||||
| 116 | 255 | 163 | 249 | 0.69 (0.59 to 0.82) | |
| Amiodarone vs sotalol | |||||
| 58 | 131 | 81 | 125 | 0.68 (0.54 to 0.86) | |
| 27 | 65 | 39 | 61 | 0.65 (0.46 to 0.92) | |
| 24 | 51 | 36 | 51 | 0.67 (0.47 to 0.94) | |
| 42 | 70 | 24 | 31 | 0.78 (0.59 to 1.01) | |
| 133 | 267 | 183 | 261 | 0.71 (0.62 to 0.82) | |
| 3 | 11 | 10 | 17 | 0.46 (0.16 to 1.32) | |
| Dronedarone vs propafenone | |||||
| 36 | 50 | 37 | 50 | 0.97 (0.77 to 1.24) | |
| Sotalol vs class I drugs other than quinidine | |||||
| 67 | 88 | 81 | 95 | 0.89 (0.77 to 1.03) | |
| 8 | 20 | 6 | 20 | 1.33 (0.57 to 3.14) | |
| 43 | 85 | 35 | 86 | 1.24 (0.89 to 1.73) | |
| 32 | 50 | 35 | 50 | 0.91 (0.69 to 1.20) | |
| Sotalol vs dofetilide | |||||
| 74 | 108 | 196 | 321 | 1.12 (0.96 to 1.31) | |
| Sotalol vs beta‐blockers | |||||
| 57 | 69 | 54 | 66 | 1.01 (0.86 to 1.18) | |
| 31 | 64 | 29 | 64 | 1.07 (0.74 to 1.55) | |
| CI: confidence interval; RR: risk ratio. | |||||
| Outcome or subgroup title | No. of studies | No. of participants | Statistical method | Effect size |
| 1 All‐cause mortality – main analysis Show forest plot | 6 | 1646 | Risk Ratio (M‐H, Fixed, 95% CI) | 2.01 [0.84, 4.77] |
| 2 All‐cause mortality – sensitivity analysis intention to treat (ITT) worse case: missing participants counted as events Show forest plot | 6 | 1646 | Risk Ratio (M‐H, Fixed, 95% CI) | 2.12 [0.96, 4.67] |
| 3 All‐cause mortality – subgroup analysis: older and recent studies Show forest plot | 6 | 1646 | Risk Ratio (M‐H, Fixed, 95% CI) | 2.01 [0.84, 4.77] |
| 3.1 Older studies, higher dose | 4 | 412 | Risk Ratio (M‐H, Fixed, 95% CI) | 2.74 [0.85, 8.83] |
| 3.2 More recent studies, lower dose | 2 | 1234 | Risk Ratio (M‐H, Fixed, 95% CI) | 1.29 [0.34, 4.92] |
| 4 All‐cause mortality – sensitivity analysis: persistent atrial fibrillation Show forest plot | 5 | 865 | Risk Ratio (M‐H, Fixed, 95% CI) | 1.82 [0.73, 4.53] |
| 5 All‐cause mortality – sensitivity analysis: low risk of bias studies Show forest plot | 2 | 1234 | Risk Ratio (M‐H, Fixed, 95% CI) | 1.29 [0.34, 4.92] |
| 6 All‐cause mortality – sensitivity analysis: studies > 200 participants Show forest plot | 2 | 1234 | Risk Ratio (M‐H, Fixed, 95% CI) | 1.29 [0.34, 4.92] |
| 7 Withdrawals due to adverse effects – main analysis Show forest plot | 7 | 1669 | Risk Ratio (M‐H, Random, 95% CI) | 1.56 [0.87, 2.78] |
| 8 Withdrawals due to adverse effects – subgroup analysis: older and recent studies Show forest plot | 7 | 1669 | Risk Ratio (M‐H, Random, 95% CI) | 1.56 [0.87, 2.78] |
| 8.1 Older studies, higher dose | 5 | 435 | Risk Ratio (M‐H, Random, 95% CI) | 3.05 [1.29, 7.22] |
| 8.2 More recent studies, lower dose | 2 | 1234 | Risk Ratio (M‐H, Random, 95% CI) | 0.88 [0.61, 1.27] |
| 9 Withdrawals due to adverse effects – sensitivity analysis: persistent atrial fibrillation Show forest plot | 5 | 877 | Risk Ratio (M‐H, Random, 95% CI) | 2.19 [0.99, 4.87] |
| 10 Withdrawals due to adverse effects – sensitivity analysis: low risk of bias studies Show forest plot | 2 | 1234 | Risk Ratio (M‐H, Fixed, 95% CI) | 0.85 [0.66, 1.08] |
| 11 Withdrawals due to adverse effects – sensitivity analysis: studies > 200 participants Show forest plot | 2 | 1234 | Risk Ratio (M‐H, Fixed, 95% CI) | 0.86 [0.67, 1.09] |
| 12 Proarrhythmia – main analysis Show forest plot | 7 | 1676 | Risk Ratio (M‐H, Fixed, 95% CI) | 2.05 [0.95, 4.41] |
| 13 Proarrhythmia – subgroup analysis: older and recent studies Show forest plot | 7 | 1677 | Risk Ratio (M‐H, Fixed, 95% CI) | 2.05 [0.96, 4.42] |
| 13.1 Older studies, higher dose | 5 | 442 | Risk Ratio (M‐H, Fixed, 95% CI) | 3.14 [0.87, 11.32] |
| 13.2 More recent studies, lower dose | 2 | 1235 | Risk Ratio (M‐H, Fixed, 95% CI) | 1.60 [0.61, 4.24] |
| 14 Proarrhythmia – sensitivity analysis: persistent atrial fibrillation Show forest plot | 5 | 877 | Risk Ratio (M‐H, Fixed, 95% CI) | 2.64 [0.93, 7.53] |
| 15 Proarrhythmia – sensitivity analysis: low risk of bias studies Show forest plot | 2 | 1235 | Risk Ratio (M‐H, Fixed, 95% CI) | 1.60 [0.61, 4.24] |
| 16 Proarrhythmia – sensitivity analysis: studies > 200 participants Show forest plot | 2 | 1235 | Risk Ratio (M‐H, Fixed, 95% CI) | 1.60 [0.61, 4.24] |
| 17 Stroke – main analysis Show forest plot | 4 | 1107 | Risk Ratio (M‐H, Fixed, 95% CI) | 0.97 [0.25, 3.83] |
| 18 Stroke – sensitivity analysis: persistent atrial fibrillation Show forest plot | 3 | 338 | Risk Ratio (M‐H, Fixed, 95% CI) | 0.88 [0.19, 4.01] |
| 19 Stroke – sensitivity analysis: low risk of bias studies Show forest plot | 1 | Risk Ratio (M‐H, Fixed, 95% CI) | Subtotals only | |
| 20 Stroke – sensitivity analysis: studies > 200 participants Show forest plot | 1 | Risk Ratio (M‐H, Fixed, 95% CI) | Subtotals only | |
| 21 Atrial fibrillation recurrence – main analysis Show forest plot | 7 | 1624 | Risk Ratio (M‐H, Fixed, 95% CI) | 0.83 [0.78, 0.88] |
| 22 Atrial fibrillation recurrence – sensitivity analysis: persistent atrial fibrillation Show forest plot | 5 | 825 | Risk Ratio (M‐H, Fixed, 95% CI) | 0.77 [0.70, 0.85] |
| 23 Atrial fibrillation recurrence – sensitivity analysis: low risk of bias studies Show forest plot | 2 | 1234 | Risk Ratio (M‐H, Fixed, 95% CI) | 0.85 [0.80, 0.91] |
| 24 Atrial fibrillation recurrence – sensitivity analysis: studies > 200 participants Show forest plot | 2 | 1234 | Risk Ratio (M‐H, Fixed, 95% CI) | 0.86 [0.80, 0.92] |
| Outcome or subgroup title | No. of studies | No. of participants | Statistical method | Effect size |
| 1 All‐cause mortality – main analysis Show forest plot | 1 | 92 | Risk Ratio (M‐H, Fixed, 95% CI) | 5.0 [0.25, 101.37] |
| 2 All‐cause mortality – intention to treat (ITT) worse case: missing participants counted as events Show forest plot | 2 | 146 | Risk Ratio (M‐H, Fixed, 95% CI) | 5.55 [0.68, 45.09] |
| 3 Withdrawals due to adverse effects – main analysis Show forest plot | 2 | 146 | Risk Ratio (M‐H, Fixed, 95% CI) | 3.68 [0.95, 14.24] |
| 4 Withdrawals due to adverse effects – sensitivity analysis: persistent atrial fibrillation Show forest plot | 2 | 146 | Risk Ratio (M‐H, Fixed, 95% CI) | 3.68 [0.95, 14.24] |
| 5 Stroke – main analysis Show forest plot | 2 | 146 | Risk Ratio (M‐H, Fixed, 95% CI) | 0.31 [0.03, 2.91] |
| 6 Stroke – subgroup analysis: persistent atrial fibrillation Show forest plot | 2 | 146 | Risk Ratio (M‐H, Fixed, 95% CI) | 0.31 [0.03, 2.91] |
| 7 Atrial fibrillation recurrence – main analysis Show forest plot | 2 | 146 | Risk Ratio (M‐H, Fixed, 95% CI) | 0.77 [0.59, 1.01] |
| 8 Atrial fibrillation recurrence – sensitivity analysis: persistent atrial fibrillation Show forest plot | 2 | 146 | Risk Ratio (M‐H, Fixed, 95% CI) | 0.77 [0.59, 1.01] |
| Outcome or subgroup title | No. of studies | No. of participants | Statistical method | Effect size |
| 1 All‐cause mortality – main analysis Show forest plot | 2 | 212 | Risk Ratio (M‐H, Fixed, 95% CI) | 0.19 [0.02, 1.68] |
| 2 All‐cause mortality – intention to treat (ITT) worse case: missing participants counted as events Show forest plot | 3 | 406 | Risk Ratio (M‐H, Fixed, 95% CI) | 1.28 [0.45, 3.62] |
| 3 All‐cause mortality – sensitivity analysis: low risk of bias studies Show forest plot | 1 | 102 | Risk Ratio (M‐H, Fixed, 95% CI) | 0.11 [0.00, 2.64] |
| 4 Withdrawals due to adverse effects – main analysis Show forest plot | 5 | 1098 | Risk Ratio (M‐H, Fixed, 95% CI) | 1.62 [1.07, 2.46] |
| 5 Withdrawals due to adverse effects – sensitivity analysis: studies > 200 participants Show forest plot | 1 | 523 | Risk Ratio (M‐H, Fixed, 95% CI) | 1.29 [0.79, 2.11] |
| 6 Proarrhythmia – main analysis Show forest plot | 3 | 381 | Risk Ratio (M‐H, Fixed, 95% CI) | 1.32 [0.39, 4.47] |
| 7 Proarrhythmia – sensitivity analysis: low risk of bias studies Show forest plot | 1 | 102 | Risk Ratio (M‐H, Fixed, 95% CI) | 0.49 [0.09, 2.75] |
| 8 Atrial fibrillation recurrence – main analysis Show forest plot | 5 | 1098 | Risk Ratio (M‐H, Fixed, 95% CI) | 0.67 [0.61, 0.74] |
| 9 Atrial fibrillation recurrence – sensitivity analysis: low risk of bias studies Show forest plot | 1 | 102 | Risk Ratio (M‐H, Fixed, 95% CI) | 0.71 [0.50, 1.01] |
| 10 Atrial fibrillation recurrence – sensitivity analysis: studies > 200 participants Show forest plot | 1 | 523 | Risk Ratio (M‐H, Fixed, 95% CI) | 0.71 [0.63, 0.79] |
| Outcome or subgroup title | No. of studies | No. of participants | Statistical method | Effect size |
| 1 Withdrawals due to adverse effects – main analysis Show forest plot | 1 | 73 | Risk Ratio (M‐H, Fixed, 95% CI) | 15.41 [0.91, 260.19] |
| 2 Proarrhythmia – main analysis Show forest plot | 4 | 511 | Risk Ratio (M‐H, Fixed, 95% CI) | 4.80 [1.30, 17.77] |
| 3 Proarrhythmia – sensitivity analysis: persistent atrial fibrillation Show forest plot | 2 | 435 | Risk Ratio (M‐H, Fixed, 95% CI) | 6.35 [0.91, 44.22] |
| 4 Proarrhythmia – sensitivity analysis: low risk of bias studies Show forest plot | 2 | 435 | Risk Ratio (M‐H, Fixed, 95% CI) | 6.35 [0.91, 44.22] |
| 5 Proarrhythmia – sensitivity analysis: studies > 200 participants Show forest plot | 1 | Risk Ratio (M‐H, Fixed, 95% CI) | Subtotals only | |
| 6 Stroke – main analysis Show forest plot | 1 | 362 | Risk Ratio (M‐H, Fixed, 95% CI) | 2.04 [0.11, 39.00] |
| 7 Stroke – subgroup analysis: persistent atrial fibrillation Show forest plot | 1 | Risk Ratio (M‐H, Fixed, 95% CI) | Subtotals only | |
| 8 Stroke – sensitivity analysis: low risk of bias studies Show forest plot | 1 | Risk Ratio (M‐H, Fixed, 95% CI) | Subtotals only | |
| 9 Stroke – sensitivity analysis: studies > 200 participants Show forest plot | 1 | Risk Ratio (M‐H, Fixed, 95% CI) | Subtotals only | |
| 10 Atrial fibrillation recurrence – main analysis Show forest plot | 4 | 511 | Risk Ratio (M‐H, Fixed, 95% CI) | 0.65 [0.55, 0.77] |
| 11 Atrial fibrillation recurrence – sensitivity analysis: persistent atrial fibrillation Show forest plot | 2 | 435 | Risk Ratio (M‐H, Fixed, 95% CI) | 0.71 [0.60, 0.85] |
| 12 Atrial fibrillation recurrence – sensitivity analysis: low risk of bias studies Show forest plot | 2 | 435 | Risk Ratio (M‐H, Fixed, 95% CI) | 0.71 [0.60, 0.85] |
| 13 Atrial fibrillation recurrence – sensitivity analysis: studies > 200 participants Show forest plot | 1 | Risk Ratio (M‐H, Fixed, 95% CI) | Subtotals only | |
| Outcome or subgroup title | No. of studies | No. of participants | Statistical method | Effect size |
| 1 All‐cause mortality – main analysis Show forest plot | 2 | 562 | Risk Ratio (M‐H, Fixed, 95% CI) | 2.02 [0.37, 11.05] |
| 2 All‐cause mortality – intention to treat (ITT) worse case: missing participants counted as events Show forest plot | 2 | 562 | Risk Ratio (M‐H, Fixed, 95% CI) | 0.77 [0.41, 1.43] |
| 3 All‐cause mortality – sensitivity analysis: persistent atrial fibrillation Show forest plot | 2 | 562 | Risk Ratio (M‐H, Fixed, 95% CI) | 2.02 [0.37, 11.05] |
| 4 All‐cause mortality – sensitivity analysis: low risk of bias studies Show forest plot | 2 | 562 | Risk Ratio (M‐H, Fixed, 95% CI) | 2.02 [0.37, 11.05] |
| 5 All‐cause mortality – sensitivity analysis: studies > 200 participants Show forest plot | 1 | 394 | Risk Ratio (M‐H, Fixed, 95% CI) | 7.0 [0.36, 134.63] |
| 6 Withdrawals due to adverse effects – main analysis Show forest plot | 2 | 562 | Risk Ratio (M‐H, Fixed, 95% CI) | 3.47 [1.48, 8.15] |
| 7 Withdrawals due to adverse effects – sensitivity analysis: persistent atrial fibrillation Show forest plot | 2 | 562 | Risk Ratio (M‐H, Fixed, 95% CI) | 3.47 [1.48, 8.15] |
| 8 Withdrawals due to adverse effects – sensitivity analysis: low risk of bias studies Show forest plot | 2 | 562 | Risk Ratio (M‐H, Fixed, 95% CI) | 3.47 [1.48, 8.15] |
| 9 Withdrawals due to adverse effects – sensitivity analysis: studies > 200 participants Show forest plot | 1 | 394 | Risk Ratio (M‐H, Fixed, 95% CI) | 3.33 [1.37, 8.12] |
| 10 Proarrhythmia – main analysis Show forest plot | 2 | 562 | Risk Ratio (M‐H, Fixed, 95% CI) | 18.14 [2.42, 135.66] |
| 11 Proarrhythmia – sensitivity analysis: persistent atrial fibrillation Show forest plot | 2 | 562 | Risk Ratio (M‐H, Fixed, 95% CI) | 18.14 [2.42, 135.66] |
| 12 Proarrhythmia – sensitivity analysis: low risk of bias studies Show forest plot | 2 | 562 | Risk Ratio (M‐H, Fixed, 95% CI) | 18.14 [2.42, 135.66] |
| 13 Proarrhythmia – sensitivity analysis: studies > 200 participants Show forest plot | 1 | Risk Ratio (M‐H, Fixed, 95% CI) | Subtotals only | |
| 14 Atrial fibrillation recurrence – main analysis Show forest plot | 2 | 562 | Risk Ratio (M‐H, Random, 95% CI) | 0.83 [0.68, 1.02] |
| 15 Atrial fibrillation recurrence – sensitivity analysis: persistent atrial fibrillation Show forest plot | 2 | 562 | Risk Ratio (M‐H, Random, 95% CI) | 0.83 [0.68, 1.02] |
| 16 Atrial fibrillation recurrence – sensitivity analysis: low risk of bias studies Show forest plot | 2 | 562 | Risk Ratio (M‐H, Random, 95% CI) | 0.83 [0.68, 1.02] |
| 17 Atrial fibrillation recurrence – sensitivity analysis: studies > 200 participants Show forest plot | 1 | Risk Ratio (M‐H, Fixed, 95% CI) | Subtotals only | |
| Outcome or subgroup title | No. of studies | No. of participants | Statistical method | Effect size |
| 1 All‐cause mortality – main analysis Show forest plot | 2 | 444 | Risk Ratio (M‐H, Fixed, 95% CI) | 1.66 [0.55, 4.99] |
| 2 All‐cause mortality – intention to treat (ITT) worse case: missing participants counted as events Show forest plot | 2 | 444 | Risk Ratio (M‐H, Fixed, 95% CI) | 1.35 [0.64, 2.82] |
| 3 All‐cause mortality – sensitivity analysis: persistent atrial fibrillation Show forest plot | 2 | 444 | Risk Ratio (M‐H, Fixed, 95% CI) | 1.66 [0.55, 4.99] |
| 4 Withdrawals due to adverse effects – main analysis Show forest plot | 4 | 319 | Risk Ratio (M‐H, Fixed, 95% CI) | 6.70 [1.91, 23.45] |
| 5 Withdrawals due to adverse effects – sensitivity analysis: low risk of bias studies Show forest plot | 1 | 99 | Risk Ratio (M‐H, Fixed, 95% CI) | 4.98 [0.65, 38.29] |
| 6 Proarrhythmia – main analysis Show forest plot | 4 | 673 | Risk Ratio (M‐H, Fixed, 95% CI) | 2.22 [0.71, 6.96] |
| 7 Proarrhythmia – sensitivity analysis: persistent atrial fibrillation Show forest plot | 2 | 498 | Risk Ratio (M‐H, Fixed, 95% CI) | 2.03 [0.52, 7.96] |
| 8 Proarrhythmia – sensitivity analysis: low risk of bias studies Show forest plot | 1 | Risk Ratio (M‐H, Fixed, 95% CI) | Subtotals only | |
| 9 Proarrhythmia – sensitivity analysis: studies > 200 participants Show forest plot | 1 | Risk Ratio (M‐H, Fixed, 95% CI) | Subtotals only | |
| 10 Stroke – main analysis Show forest plot | 1 | 399 | Risk Ratio (M‐H, Fixed, 95% CI) | 1.15 [0.30, 4.39] |
| 11 Stroke – sensitivity analysis: persistent atrial fibrillation Show forest plot | 1 | Risk Ratio (M‐H, Fixed, 95% CI) | Subtotals only | |
| 12 Stroke – sensitivity analysis: studies > 200 participants Show forest plot | 1 | Risk Ratio (M‐H, Fixed, 95% CI) | Subtotals only | |
| 13 Atrial fibrillation recurrence – main analysis Show forest plot | 6 | 812 | Risk Ratio (M‐H, Fixed, 95% CI) | 0.52 [0.46, 0.58] |
| 14 Atrial fibrillation recurrence – sensitivity analysis: persistent atrial fibrillation Show forest plot | 5 | 687 | Risk Ratio (M‐H, Fixed, 95% CI) | 0.52 [0.46, 0.58] |
| 15 Atrial fibrillation recurrence – sensitivity analysis: low risk of bias studies Show forest plot | 2 | 498 | Risk Ratio (M‐H, Fixed, 95% CI) | 0.57 [0.50, 0.64] |
| 16 Atrial fibrillation recurrence – sensitivity analysis: studies > 200 participants Show forest plot | 1 | Risk Ratio (M‐H, Fixed, 95% CI) | Subtotals only | |
| Outcome or subgroup title | No. of studies | No. of participants | Statistical method | Effect size |
| 1 All‐cause mortality – main analysis Show forest plot | 3 | 1183 | Risk Ratio (M‐H, Fixed, 95% CI) | 0.98 [0.76, 1.27] |
| 2 All‐cause mortality – intention to treat (ITT) worse case: missing participants counted as events Show forest plot | 3 | 1183 | Risk Ratio (M‐H, Fixed, 95% CI) | 1.02 [0.79, 1.31] |
| 3 All‐cause mortality – sensitivity analysis: persistent atrial fibrillation Show forest plot | 3 | 1183 | Risk Ratio (M‐H, Fixed, 95% CI) | 0.98 [0.76, 1.27] |
| 4 All‐cause mortality – sensitivity analysis: low risk of bias studies Show forest plot | 1 | 506 | Risk Ratio (M‐H, Fixed, 95% CI) | 0.99 [0.77, 1.29] |
| 5 All‐cause mortality – sensitivity analysis: studies > 200 participants Show forest plot | 3 | 1183 | Risk Ratio (M‐H, Fixed, 95% CI) | 0.98 [0.76, 1.27] |
| 6 Withdrawals due to adverse effects – main analysis Show forest plot | 2 | 677 | Risk Ratio (M‐H, Fixed, 95% CI) | 1.77 [0.75, 4.18] |
| 7 Withdrawals due to adverse effects – sensitivity analysis: persistent atrial fibrillation Show forest plot | 2 | 677 | Risk Ratio (M‐H, Fixed, 95% CI) | 1.77 [0.75, 4.18] |
| 8 Withdrawals due to adverse effects – sensitivity analysis: studies > 200 participants Show forest plot | 2 | 677 | Risk Ratio (M‐H, Fixed, 95% CI) | 1.77 [0.75, 4.18] |
| 9 Proarrhythmia – main analysis Show forest plot | 3 | 1183 | Risk Ratio (M‐H, Fixed, 95% CI) | 5.50 [1.33, 22.76] |
| 10 Proarrhythmia – sensitivity analysis: persistent atrial fibrillation Show forest plot | 3 | 1183 | Risk Ratio (M‐H, Fixed, 95% CI) | 5.50 [1.33, 22.76] |
| 11 Proarrhythmia – sensitivity analysis: low risk of bias studies Show forest plot | 1 | 506 | Risk Ratio (M‐H, Fixed, 95% CI) | 9.29 [0.50, 171.62] |
| 12 Proarrhythmia – sensitivity analysis: studies > 200 participants Show forest plot | 3 | 1183 | Risk Ratio (M‐H, Fixed, 95% CI) | 5.50 [1.33, 22.76] |
| 13 Atrial fibrillation recurrence – main analysis Show forest plot | 3 | 1183 | Risk Ratio (M‐H, Random, 95% CI) | 0.72 [0.61, 0.85] |
| 14 Atrial fibrillation recurrence – sensitivity analysis: persistent atrial fibrillation Show forest plot | 3 | 1183 | Risk Ratio (M‐H, Random, 95% CI) | 0.72 [0.61, 0.85] |
| 15 Atrial fibrillation recurrence – sensitivity analysis: low risk of bias studies Show forest plot | 1 | 506 | Risk Ratio (M‐H, Fixed, 95% CI) | 0.62 [0.54, 0.70] |
| 16 Atrial fibrillation recurrence – sensitivity analysis: studies > 200 participants Show forest plot | 3 | 1183 | Risk Ratio (M‐H, Random, 95% CI) | 0.72 [0.61, 0.85] |
| Outcome or subgroup title | No. of studies | No. of participants | Statistical method | Effect size |
| 1 All‐cause mortality – main analysis Show forest plot | 3 | 6071 | Risk Ratio (M‐H, Fixed, 95% CI) | 0.86 [0.68, 1.09] |
| 2 All‐cause mortality – intention to treat (ITT) worse case: missing participants counted as events Show forest plot | 3 | 6071 | Risk Ratio (M‐H, Fixed, 95% CI) | 0.85 [0.67, 1.07] |
| 3 All‐cause mortality – sensitivity analysis: persistent atrial fibrillation Show forest plot | 1 | 199 | Risk Ratio (M‐H, Fixed, 95% CI) | 0.97 [0.04, 23.36] |
| 4 All‐cause mortality – sensitivity analysis: low risk of bias studies Show forest plot | 1 | 4628 | Risk Ratio (M‐H, Fixed, 95% CI) | 0.84 [0.66, 1.07] |
| 5 All‐cause mortality – sensitivity analysis: studies > 200 participants Show forest plot | 2 | 5872 | Risk Ratio (M‐H, Fixed, 95% CI) | 0.86 [0.68, 1.09] |
| 6 Withdrawals due to adverse effects – main analysis Show forest plot | 3 | 6071 | Risk Ratio (M‐H, Fixed, 95% CI) | 1.58 [1.34, 1.85] |
| 7 Withdrawals due to adverse effects – sensitivity analysis: persistent atrial fibrillation Show forest plot | 1 | 199 | Risk Ratio (M‐H, Fixed, 95% CI) | 14.51 [0.90, 234.74] |
| 8 Withdrawals due to adverse effects – sensitivity analysis: low risk of bias studies Show forest plot | 1 | 4628 | Risk Ratio (M‐H, Fixed, 95% CI) | 1.57 [1.32, 1.87] |
| 9 Withdrawals due to adverse effects – sensitivity analysis: studies > 200 participants Show forest plot | 2 | 5872 | Risk Ratio (M‐H, Fixed, 95% CI) | 1.53 [1.31, 1.80] |
| 10 Proarrhythmia – main analysis Show forest plot | 2 | 5872 | Risk Ratio (M‐H, Random, 95% CI) | 1.95 [0.77, 4.98] |
| 11 Proarrhythmia – sensitivity analysis: low risk of bias studies Show forest plot | 1 | Risk Ratio (M‐H, Fixed, 95% CI) | Subtotals only | |
| 12 Proarrhythmia – sensitivity analysis: studies > 200 participants Show forest plot | 1 | Risk Ratio (M‐H, Fixed, 95% CI) | Subtotals only | |
| 13 Stroke – main analysis Show forest plot | 2 | 5872 | Risk Ratio (M‐H, Fixed, 95% CI) | 0.66 [0.47, 0.95] |
| 14 Stroke – sensitivity analysis: studies > 200 participants Show forest plot | 2 | 5872 | Risk Ratio (M‐H, Fixed, 95% CI) | 0.66 [0.47, 0.95] |
| 15 Atrial fibrillation recurrence – main analysis Show forest plot | 2 | 1443 | Risk Ratio (M‐H, Fixed, 95% CI) | 0.85 [0.80, 0.91] |
| 16 Atrial fibrillation recurrence – sensitivity analysis: persistent atrial fibrillation Show forest plot | 1 | Risk Ratio (M‐H, Fixed, 95% CI) | Subtotals only | |
| 17 Atrial fibrillation recurrence – sensitivity analysis: studies > 200 participants Show forest plot | 1 | Risk Ratio (M‐H, Fixed, 95% CI) | Subtotals only | |
| Outcome or subgroup title | No. of studies | No. of participants | Statistical method | Effect size |
| 1 All‐cause mortality – main analysis Show forest plot | 5 | 1882 | Risk Ratio (M‐H, Fixed, 95% CI) | 2.23 [1.03, 4.81] |
| 2 All‐cause mortality – intention to treat (ITT) worse case: missing participants counted as events Show forest plot | 10 | 2757 | Risk Ratio (M‐H, Fixed, 95% CI) | 2.02 [1.28, 3.20] |
| 3 All‐cause mortality – sensitivity analysis: persistent atrial fibrillation Show forest plot | 3 | 1311 | Risk Ratio (M‐H, Fixed, 95% CI) | 2.51 [1.06, 5.98] |
| 4 All‐cause mortality – sensitivity analysis: low risk of bias studies Show forest plot | 3 | 1311 | Risk Ratio (M‐H, Fixed, 95% CI) | 2.51 [1.06, 5.98] |
| 5 All‐cause mortality – sensitivity analysis: studies > 200 participants Show forest plot | 4 | 1826 | Risk Ratio (M‐H, Fixed, 95% CI) | 2.65 [1.16, 6.09] |
| 6 Withdrawals due to adverse effects – main analysis Show forest plot | 12 | 2688 | Risk Ratio (M‐H, Random, 95% CI) | 1.95 [1.23, 3.11] |
| 7 Withdrawals due to adverse effects – sotalol: heterogeneity study Show forest plot | 12 | 2688 | Risk Ratio (M‐H, Random, 95% CI) | 1.95 [1.23, 3.11] |
| 7.1 PAFAC and SOPAT trials | 2 | 987 | Risk Ratio (M‐H, Random, 95% CI) | 0.96 [0.74, 1.25] |
| 7.2 Rest of studies | 10 | 1701 | Risk Ratio (M‐H, Random, 95% CI) | 2.77 [1.81, 4.22] |
| 8 Withdrawals due to adverse effects – sensitivity analysis: persistent atrial fibrillation Show forest plot | 6 | 1350 | Risk Ratio (M‐H, Fixed, 95% CI) | 1.75 [1.28, 2.41] |
| 9 Withdrawals due to adverse effects – sensitivity analysis: low risk of bias studies Show forest plot | 4 | 1686 | Risk Ratio (M‐H, Random, 95% CI) | 1.52 [0.82, 2.81] |
| 10 Withdrawals due to adverse effects – sensitivity analysis: studies > 200 participants Show forest plot | 5 | 1900 | Risk Ratio (M‐H, Random, 95% CI) | 1.81 [0.97, 3.35] |
| 11 Proarrhythmia – main analysis Show forest plot | 12 | 2989 | Risk Ratio (M‐H, Fixed, 95% CI) | 3.55 [2.16, 5.83] |
| 12 Proarrhythmia – sotalol: heterogeneity study Show forest plot | 11 | 2826 | Risk Ratio (M‐H, Fixed, 95% CI) | 3.43 [2.07, 5.67] |
| 12.1 PAFAC and SOPAT trials | 2 | 986 | Risk Ratio (M‐H, Fixed, 95% CI) | 1.49 [0.51, 4.37] |
| 12.2 Rest of studies | 9 | 1840 | Risk Ratio (M‐H, Fixed, 95% CI) | 4.32 [2.40, 7.76] |
| 13 Proarrhythmia – sensitivity analysis: persistent atrial fibrillation Show forest plot | 6 | 1687 | Risk Ratio (M‐H, Fixed, 95% CI) | 4.37 [2.25, 8.52] |
| 14 Proarrhythmia – sensitivity analysis: low risk of bias studies Show forest plot | 4 | 1686 | Risk Ratio (M‐H, Fixed, 95% CI) | 3.05 [1.73, 5.40] |
| 15 Proarrhythmia – sensitivity analysis: studies > 200 participants Show forest plot | 6 | 2293 | Risk Ratio (M‐H, Fixed, 95% CI) | 3.00 [1.77, 5.06] |
| 16 Stroke – main analysis Show forest plot | 3 | 1161 | Risk Ratio (M‐H, Fixed, 95% CI) | 1.47 [0.48, 4.51] |
| 17 Stroke – sensitivity analysis: persistent atrial fibrillation Show forest plot | 1 | 393 | Risk Ratio (M‐H, Fixed, 95% CI) | 1.35 [0.36, 5.00] |
| 18 Stroke – sensitivity analysis: low risk of bias studies Show forest plot | 2 | 768 | Risk Ratio (M‐H, Fixed, 95% CI) | 1.85 [0.20, 16.71] |
| 19 Stroke – sensitivity analysis: studies > 200 participants Show forest plot | 3 | 1161 | Risk Ratio (M‐H, Fixed, 95% CI) | 1.47 [0.48, 4.51] |
| 20 Atrial fibrillation recurrence – main analysis Show forest plot | 14 | 3179 | Risk Ratio (M‐H, Fixed, 95% CI) | 0.83 [0.80, 0.87] |
| 21 Atrial fibrillation recurrence – sensitivity analysis: persistent atrial fibrillation Show forest plot | 7 | 1743 | Risk Ratio (M‐H, Fixed, 95% CI) | 0.81 [0.77, 0.86] |
| 22 Atrial fibrillation recurrence – sensitivity analysis: low risk of bias studies Show forest plot | 4 | 1686 | Risk Ratio (M‐H, Fixed, 95% CI) | 0.86 [0.82, 0.91] |
| 23 Atrial fibrillation recurrence – sensitivity analysis: studies > 200 participants Show forest plot | 6 | 2293 | Risk Ratio (M‐H, Fixed, 95% CI) | 0.85 [0.81, 0.89] |