Scolaris Content Display Scolaris Content Display

Selection of studies for inclusion. AF: atrial fibrillation.
Figuras y tablas -
Figure 1

Selection of studies for inclusion. AF: atrial fibrillation.

Funnel plot of comparison: 9 Sotalol versus placebo/no treatment, outcome: 9.6 Withdrawals due to adverse effects – main analysis.
Figuras y tablas -
Figure 2

Funnel plot of comparison: 9 Sotalol versus placebo/no treatment, outcome: 9.6 Withdrawals due to adverse effects – main analysis.

Risk of bias graph: review authors' judgements about each risk of bias item presented as percentages across all included studies.
Figuras y tablas -
Figure 3

Risk of bias graph: review authors' judgements about each risk of bias item presented as percentages across all included studies.

Risk of bias summary: review authors' judgements about each risk of bias item for each included study.
Figuras y tablas -
Figure 4

Risk of bias summary: review authors' judgements about each risk of bias item for each included study.

All‐cause mortality with sotalol compared with placebo/no treatment: main analysis.
Figuras y tablas -
Figure 5

All‐cause mortality with sotalol compared with placebo/no treatment: main analysis.

Comparison 1 Quinidine versus placebo or no treatment, Outcome 1 All‐cause mortality – main analysis.
Figuras y tablas -
Analysis 1.1

Comparison 1 Quinidine versus placebo or no treatment, Outcome 1 All‐cause mortality – main analysis.

Comparison 1 Quinidine versus placebo or no treatment, Outcome 2 All‐cause mortality – sensitivity analysis intention to treat (ITT) worse case: missing participants counted as events.
Figuras y tablas -
Analysis 1.2

Comparison 1 Quinidine versus placebo or no treatment, Outcome 2 All‐cause mortality – sensitivity analysis intention to treat (ITT) worse case: missing participants counted as events.

Comparison 1 Quinidine versus placebo or no treatment, Outcome 3 All‐cause mortality – subgroup analysis: older and recent studies.
Figuras y tablas -
Analysis 1.3

Comparison 1 Quinidine versus placebo or no treatment, Outcome 3 All‐cause mortality – subgroup analysis: older and recent studies.

Comparison 1 Quinidine versus placebo or no treatment, Outcome 4 All‐cause mortality – sensitivity analysis: persistent atrial fibrillation.
Figuras y tablas -
Analysis 1.4

Comparison 1 Quinidine versus placebo or no treatment, Outcome 4 All‐cause mortality – sensitivity analysis: persistent atrial fibrillation.

Comparison 1 Quinidine versus placebo or no treatment, Outcome 5 All‐cause mortality – sensitivity analysis: low risk of bias studies.
Figuras y tablas -
Analysis 1.5

Comparison 1 Quinidine versus placebo or no treatment, Outcome 5 All‐cause mortality – sensitivity analysis: low risk of bias studies.

Comparison 1 Quinidine versus placebo or no treatment, Outcome 6 All‐cause mortality – sensitivity analysis: studies > 200 participants.
Figuras y tablas -
Analysis 1.6

Comparison 1 Quinidine versus placebo or no treatment, Outcome 6 All‐cause mortality – sensitivity analysis: studies > 200 participants.

Comparison 1 Quinidine versus placebo or no treatment, Outcome 7 Withdrawals due to adverse effects – main analysis.
Figuras y tablas -
Analysis 1.7

Comparison 1 Quinidine versus placebo or no treatment, Outcome 7 Withdrawals due to adverse effects – main analysis.

Comparison 1 Quinidine versus placebo or no treatment, Outcome 8 Withdrawals due to adverse effects – subgroup analysis: older and recent studies.
Figuras y tablas -
Analysis 1.8

Comparison 1 Quinidine versus placebo or no treatment, Outcome 8 Withdrawals due to adverse effects – subgroup analysis: older and recent studies.

Comparison 1 Quinidine versus placebo or no treatment, Outcome 9 Withdrawals due to adverse effects – sensitivity analysis: persistent atrial fibrillation.
Figuras y tablas -
Analysis 1.9

Comparison 1 Quinidine versus placebo or no treatment, Outcome 9 Withdrawals due to adverse effects – sensitivity analysis: persistent atrial fibrillation.

Comparison 1 Quinidine versus placebo or no treatment, Outcome 10 Withdrawals due to adverse effects – sensitivity analysis: low risk of bias studies.
Figuras y tablas -
Analysis 1.10

Comparison 1 Quinidine versus placebo or no treatment, Outcome 10 Withdrawals due to adverse effects – sensitivity analysis: low risk of bias studies.

Comparison 1 Quinidine versus placebo or no treatment, Outcome 11 Withdrawals due to adverse effects – sensitivity analysis: studies > 200 participants.
Figuras y tablas -
Analysis 1.11

Comparison 1 Quinidine versus placebo or no treatment, Outcome 11 Withdrawals due to adverse effects – sensitivity analysis: studies > 200 participants.

Comparison 1 Quinidine versus placebo or no treatment, Outcome 12 Proarrhythmia – main analysis.
Figuras y tablas -
Analysis 1.12

Comparison 1 Quinidine versus placebo or no treatment, Outcome 12 Proarrhythmia – main analysis.

Comparison 1 Quinidine versus placebo or no treatment, Outcome 13 Proarrhythmia – subgroup analysis: older and recent studies.
Figuras y tablas -
Analysis 1.13

Comparison 1 Quinidine versus placebo or no treatment, Outcome 13 Proarrhythmia – subgroup analysis: older and recent studies.

Comparison 1 Quinidine versus placebo or no treatment, Outcome 14 Proarrhythmia – sensitivity analysis: persistent atrial fibrillation.
Figuras y tablas -
Analysis 1.14

Comparison 1 Quinidine versus placebo or no treatment, Outcome 14 Proarrhythmia – sensitivity analysis: persistent atrial fibrillation.

Comparison 1 Quinidine versus placebo or no treatment, Outcome 15 Proarrhythmia – sensitivity analysis: low risk of bias studies.
Figuras y tablas -
Analysis 1.15

Comparison 1 Quinidine versus placebo or no treatment, Outcome 15 Proarrhythmia – sensitivity analysis: low risk of bias studies.

Comparison 1 Quinidine versus placebo or no treatment, Outcome 16 Proarrhythmia – sensitivity analysis: studies > 200 participants.
Figuras y tablas -
Analysis 1.16

Comparison 1 Quinidine versus placebo or no treatment, Outcome 16 Proarrhythmia – sensitivity analysis: studies > 200 participants.

Comparison 1 Quinidine versus placebo or no treatment, Outcome 17 Stroke – main analysis.
Figuras y tablas -
Analysis 1.17

Comparison 1 Quinidine versus placebo or no treatment, Outcome 17 Stroke – main analysis.

Comparison 1 Quinidine versus placebo or no treatment, Outcome 18 Stroke – sensitivity analysis: persistent atrial fibrillation.
Figuras y tablas -
Analysis 1.18

Comparison 1 Quinidine versus placebo or no treatment, Outcome 18 Stroke – sensitivity analysis: persistent atrial fibrillation.

Comparison 1 Quinidine versus placebo or no treatment, Outcome 19 Stroke – sensitivity analysis: low risk of bias studies.
Figuras y tablas -
Analysis 1.19

Comparison 1 Quinidine versus placebo or no treatment, Outcome 19 Stroke – sensitivity analysis: low risk of bias studies.

Comparison 1 Quinidine versus placebo or no treatment, Outcome 20 Stroke – sensitivity analysis: studies > 200 participants.
Figuras y tablas -
Analysis 1.20

Comparison 1 Quinidine versus placebo or no treatment, Outcome 20 Stroke – sensitivity analysis: studies > 200 participants.

Comparison 1 Quinidine versus placebo or no treatment, Outcome 21 Atrial fibrillation recurrence – main analysis.
Figuras y tablas -
Analysis 1.21

Comparison 1 Quinidine versus placebo or no treatment, Outcome 21 Atrial fibrillation recurrence – main analysis.

Comparison 1 Quinidine versus placebo or no treatment, Outcome 22 Atrial fibrillation recurrence – sensitivity analysis: persistent atrial fibrillation.
Figuras y tablas -
Analysis 1.22

Comparison 1 Quinidine versus placebo or no treatment, Outcome 22 Atrial fibrillation recurrence – sensitivity analysis: persistent atrial fibrillation.

Comparison 1 Quinidine versus placebo or no treatment, Outcome 23 Atrial fibrillation recurrence – sensitivity analysis: low risk of bias studies.
Figuras y tablas -
Analysis 1.23

Comparison 1 Quinidine versus placebo or no treatment, Outcome 23 Atrial fibrillation recurrence – sensitivity analysis: low risk of bias studies.

Comparison 1 Quinidine versus placebo or no treatment, Outcome 24 Atrial fibrillation recurrence – sensitivity analysis: studies > 200 participants.
Figuras y tablas -
Analysis 1.24

Comparison 1 Quinidine versus placebo or no treatment, Outcome 24 Atrial fibrillation recurrence – sensitivity analysis: studies > 200 participants.

Comparison 2 Disopyramide versus placebo or no treatment, Outcome 1 All‐cause mortality – main analysis.
Figuras y tablas -
Analysis 2.1

Comparison 2 Disopyramide versus placebo or no treatment, Outcome 1 All‐cause mortality – main analysis.

Comparison 2 Disopyramide versus placebo or no treatment, Outcome 2 All‐cause mortality – intention to treat (ITT) worse case: missing participants counted as events.
Figuras y tablas -
Analysis 2.2

Comparison 2 Disopyramide versus placebo or no treatment, Outcome 2 All‐cause mortality – intention to treat (ITT) worse case: missing participants counted as events.

Comparison 2 Disopyramide versus placebo or no treatment, Outcome 3 Withdrawals due to adverse effects – main analysis.
Figuras y tablas -
Analysis 2.3

Comparison 2 Disopyramide versus placebo or no treatment, Outcome 3 Withdrawals due to adverse effects – main analysis.

Comparison 2 Disopyramide versus placebo or no treatment, Outcome 4 Withdrawals due to adverse effects – sensitivity analysis: persistent atrial fibrillation.
Figuras y tablas -
Analysis 2.4

Comparison 2 Disopyramide versus placebo or no treatment, Outcome 4 Withdrawals due to adverse effects – sensitivity analysis: persistent atrial fibrillation.

Comparison 2 Disopyramide versus placebo or no treatment, Outcome 5 Stroke – main analysis.
Figuras y tablas -
Analysis 2.5

Comparison 2 Disopyramide versus placebo or no treatment, Outcome 5 Stroke – main analysis.

Comparison 2 Disopyramide versus placebo or no treatment, Outcome 6 Stroke – subgroup analysis: persistent atrial fibrillation.
Figuras y tablas -
Analysis 2.6

Comparison 2 Disopyramide versus placebo or no treatment, Outcome 6 Stroke – subgroup analysis: persistent atrial fibrillation.

Comparison 2 Disopyramide versus placebo or no treatment, Outcome 7 Atrial fibrillation recurrence – main analysis.
Figuras y tablas -
Analysis 2.7

Comparison 2 Disopyramide versus placebo or no treatment, Outcome 7 Atrial fibrillation recurrence – main analysis.

Comparison 2 Disopyramide versus placebo or no treatment, Outcome 8 Atrial fibrillation recurrence – sensitivity analysis: persistent atrial fibrillation.
Figuras y tablas -
Analysis 2.8

Comparison 2 Disopyramide versus placebo or no treatment, Outcome 8 Atrial fibrillation recurrence – sensitivity analysis: persistent atrial fibrillation.

Comparison 3 Propafenone versus placebo or no treatment, Outcome 1 All‐cause mortality – main analysis.
Figuras y tablas -
Analysis 3.1

Comparison 3 Propafenone versus placebo or no treatment, Outcome 1 All‐cause mortality – main analysis.

Comparison 3 Propafenone versus placebo or no treatment, Outcome 2 All‐cause mortality – intention to treat (ITT) worse case: missing participants counted as events.
Figuras y tablas -
Analysis 3.2

Comparison 3 Propafenone versus placebo or no treatment, Outcome 2 All‐cause mortality – intention to treat (ITT) worse case: missing participants counted as events.

Comparison 3 Propafenone versus placebo or no treatment, Outcome 3 All‐cause mortality – sensitivity analysis: low risk of bias studies.
Figuras y tablas -
Analysis 3.3

Comparison 3 Propafenone versus placebo or no treatment, Outcome 3 All‐cause mortality – sensitivity analysis: low risk of bias studies.

Comparison 3 Propafenone versus placebo or no treatment, Outcome 4 Withdrawals due to adverse effects – main analysis.
Figuras y tablas -
Analysis 3.4

Comparison 3 Propafenone versus placebo or no treatment, Outcome 4 Withdrawals due to adverse effects – main analysis.

Comparison 3 Propafenone versus placebo or no treatment, Outcome 5 Withdrawals due to adverse effects – sensitivity analysis: studies > 200 participants.
Figuras y tablas -
Analysis 3.5

Comparison 3 Propafenone versus placebo or no treatment, Outcome 5 Withdrawals due to adverse effects – sensitivity analysis: studies > 200 participants.

Comparison 3 Propafenone versus placebo or no treatment, Outcome 6 Proarrhythmia – main analysis.
Figuras y tablas -
Analysis 3.6

Comparison 3 Propafenone versus placebo or no treatment, Outcome 6 Proarrhythmia – main analysis.

Comparison 3 Propafenone versus placebo or no treatment, Outcome 7 Proarrhythmia – sensitivity analysis: low risk of bias studies.
Figuras y tablas -
Analysis 3.7

Comparison 3 Propafenone versus placebo or no treatment, Outcome 7 Proarrhythmia – sensitivity analysis: low risk of bias studies.

Comparison 3 Propafenone versus placebo or no treatment, Outcome 8 Atrial fibrillation recurrence – main analysis.
Figuras y tablas -
Analysis 3.8

Comparison 3 Propafenone versus placebo or no treatment, Outcome 8 Atrial fibrillation recurrence – main analysis.

Comparison 3 Propafenone versus placebo or no treatment, Outcome 9 Atrial fibrillation recurrence – sensitivity analysis: low risk of bias studies.
Figuras y tablas -
Analysis 3.9

Comparison 3 Propafenone versus placebo or no treatment, Outcome 9 Atrial fibrillation recurrence – sensitivity analysis: low risk of bias studies.

Comparison 3 Propafenone versus placebo or no treatment, Outcome 10 Atrial fibrillation recurrence – sensitivity analysis: studies > 200 participants.
Figuras y tablas -
Analysis 3.10

Comparison 3 Propafenone versus placebo or no treatment, Outcome 10 Atrial fibrillation recurrence – sensitivity analysis: studies > 200 participants.

Comparison 4 Flecainide versus placebo or no treatment, Outcome 1 Withdrawals due to adverse effects – main analysis.
Figuras y tablas -
Analysis 4.1

Comparison 4 Flecainide versus placebo or no treatment, Outcome 1 Withdrawals due to adverse effects – main analysis.

Comparison 4 Flecainide versus placebo or no treatment, Outcome 2 Proarrhythmia – main analysis.
Figuras y tablas -
Analysis 4.2

Comparison 4 Flecainide versus placebo or no treatment, Outcome 2 Proarrhythmia – main analysis.

Comparison 4 Flecainide versus placebo or no treatment, Outcome 3 Proarrhythmia – sensitivity analysis: persistent atrial fibrillation.
Figuras y tablas -
Analysis 4.3

Comparison 4 Flecainide versus placebo or no treatment, Outcome 3 Proarrhythmia – sensitivity analysis: persistent atrial fibrillation.

Comparison 4 Flecainide versus placebo or no treatment, Outcome 4 Proarrhythmia – sensitivity analysis: low risk of bias studies.
Figuras y tablas -
Analysis 4.4

Comparison 4 Flecainide versus placebo or no treatment, Outcome 4 Proarrhythmia – sensitivity analysis: low risk of bias studies.

Comparison 4 Flecainide versus placebo or no treatment, Outcome 5 Proarrhythmia – sensitivity analysis: studies > 200 participants.
Figuras y tablas -
Analysis 4.5

Comparison 4 Flecainide versus placebo or no treatment, Outcome 5 Proarrhythmia – sensitivity analysis: studies > 200 participants.

Comparison 4 Flecainide versus placebo or no treatment, Outcome 6 Stroke – main analysis.
Figuras y tablas -
Analysis 4.6

Comparison 4 Flecainide versus placebo or no treatment, Outcome 6 Stroke – main analysis.

Comparison 4 Flecainide versus placebo or no treatment, Outcome 7 Stroke – subgroup analysis: persistent atrial fibrillation.
Figuras y tablas -
Analysis 4.7

Comparison 4 Flecainide versus placebo or no treatment, Outcome 7 Stroke – subgroup analysis: persistent atrial fibrillation.

Comparison 4 Flecainide versus placebo or no treatment, Outcome 8 Stroke – sensitivity analysis: low risk of bias studies.
Figuras y tablas -
Analysis 4.8

Comparison 4 Flecainide versus placebo or no treatment, Outcome 8 Stroke – sensitivity analysis: low risk of bias studies.

Comparison 4 Flecainide versus placebo or no treatment, Outcome 9 Stroke – sensitivity analysis: studies > 200 participants.
Figuras y tablas -
Analysis 4.9

Comparison 4 Flecainide versus placebo or no treatment, Outcome 9 Stroke – sensitivity analysis: studies > 200 participants.

Comparison 4 Flecainide versus placebo or no treatment, Outcome 10 Atrial fibrillation recurrence – main analysis.
Figuras y tablas -
Analysis 4.10

Comparison 4 Flecainide versus placebo or no treatment, Outcome 10 Atrial fibrillation recurrence – main analysis.

Comparison 4 Flecainide versus placebo or no treatment, Outcome 11 Atrial fibrillation recurrence – sensitivity analysis: persistent atrial fibrillation.
Figuras y tablas -
Analysis 4.11

Comparison 4 Flecainide versus placebo or no treatment, Outcome 11 Atrial fibrillation recurrence – sensitivity analysis: persistent atrial fibrillation.

Comparison 4 Flecainide versus placebo or no treatment, Outcome 12 Atrial fibrillation recurrence – sensitivity analysis: low risk of bias studies.
Figuras y tablas -
Analysis 4.12

Comparison 4 Flecainide versus placebo or no treatment, Outcome 12 Atrial fibrillation recurrence – sensitivity analysis: low risk of bias studies.

Comparison 4 Flecainide versus placebo or no treatment, Outcome 13 Atrial fibrillation recurrence – sensitivity analysis: studies > 200 participants.
Figuras y tablas -
Analysis 4.13

Comparison 4 Flecainide versus placebo or no treatment, Outcome 13 Atrial fibrillation recurrence – sensitivity analysis: studies > 200 participants.

Comparison 5 Metoprolol versus placebo or no treatment, Outcome 1 All‐cause mortality – main analysis.
Figuras y tablas -
Analysis 5.1

Comparison 5 Metoprolol versus placebo or no treatment, Outcome 1 All‐cause mortality – main analysis.

Comparison 5 Metoprolol versus placebo or no treatment, Outcome 2 All‐cause mortality – intention to treat (ITT) worse case: missing participants counted as events.
Figuras y tablas -
Analysis 5.2

Comparison 5 Metoprolol versus placebo or no treatment, Outcome 2 All‐cause mortality – intention to treat (ITT) worse case: missing participants counted as events.

Comparison 5 Metoprolol versus placebo or no treatment, Outcome 3 All‐cause mortality – sensitivity analysis: persistent atrial fibrillation.
Figuras y tablas -
Analysis 5.3

Comparison 5 Metoprolol versus placebo or no treatment, Outcome 3 All‐cause mortality – sensitivity analysis: persistent atrial fibrillation.

Comparison 5 Metoprolol versus placebo or no treatment, Outcome 4 All‐cause mortality – sensitivity analysis: low risk of bias studies.
Figuras y tablas -
Analysis 5.4

Comparison 5 Metoprolol versus placebo or no treatment, Outcome 4 All‐cause mortality – sensitivity analysis: low risk of bias studies.

Comparison 5 Metoprolol versus placebo or no treatment, Outcome 5 All‐cause mortality – sensitivity analysis: studies > 200 participants.
Figuras y tablas -
Analysis 5.5

Comparison 5 Metoprolol versus placebo or no treatment, Outcome 5 All‐cause mortality – sensitivity analysis: studies > 200 participants.

Comparison 5 Metoprolol versus placebo or no treatment, Outcome 6 Withdrawals due to adverse effects – main analysis.
Figuras y tablas -
Analysis 5.6

Comparison 5 Metoprolol versus placebo or no treatment, Outcome 6 Withdrawals due to adverse effects – main analysis.

Comparison 5 Metoprolol versus placebo or no treatment, Outcome 7 Withdrawals due to adverse effects – sensitivity analysis: persistent atrial fibrillation.
Figuras y tablas -
Analysis 5.7

Comparison 5 Metoprolol versus placebo or no treatment, Outcome 7 Withdrawals due to adverse effects – sensitivity analysis: persistent atrial fibrillation.

Comparison 5 Metoprolol versus placebo or no treatment, Outcome 8 Withdrawals due to adverse effects – sensitivity analysis: low risk of bias studies.
Figuras y tablas -
Analysis 5.8

Comparison 5 Metoprolol versus placebo or no treatment, Outcome 8 Withdrawals due to adverse effects – sensitivity analysis: low risk of bias studies.

Comparison 5 Metoprolol versus placebo or no treatment, Outcome 9 Withdrawals due to adverse effects – sensitivity analysis: studies > 200 participants.
Figuras y tablas -
Analysis 5.9

Comparison 5 Metoprolol versus placebo or no treatment, Outcome 9 Withdrawals due to adverse effects – sensitivity analysis: studies > 200 participants.

Comparison 5 Metoprolol versus placebo or no treatment, Outcome 10 Proarrhythmia – main analysis.
Figuras y tablas -
Analysis 5.10

Comparison 5 Metoprolol versus placebo or no treatment, Outcome 10 Proarrhythmia – main analysis.

Comparison 5 Metoprolol versus placebo or no treatment, Outcome 11 Proarrhythmia – sensitivity analysis: persistent atrial fibrillation.
Figuras y tablas -
Analysis 5.11

Comparison 5 Metoprolol versus placebo or no treatment, Outcome 11 Proarrhythmia – sensitivity analysis: persistent atrial fibrillation.

Comparison 5 Metoprolol versus placebo or no treatment, Outcome 12 Proarrhythmia – sensitivity analysis: low risk of bias studies.
Figuras y tablas -
Analysis 5.12

Comparison 5 Metoprolol versus placebo or no treatment, Outcome 12 Proarrhythmia – sensitivity analysis: low risk of bias studies.

Comparison 5 Metoprolol versus placebo or no treatment, Outcome 13 Proarrhythmia – sensitivity analysis: studies > 200 participants.
Figuras y tablas -
Analysis 5.13

Comparison 5 Metoprolol versus placebo or no treatment, Outcome 13 Proarrhythmia – sensitivity analysis: studies > 200 participants.

Comparison 5 Metoprolol versus placebo or no treatment, Outcome 14 Atrial fibrillation recurrence – main analysis.
Figuras y tablas -
Analysis 5.14

Comparison 5 Metoprolol versus placebo or no treatment, Outcome 14 Atrial fibrillation recurrence – main analysis.

Comparison 5 Metoprolol versus placebo or no treatment, Outcome 15 Atrial fibrillation recurrence – sensitivity analysis: persistent atrial fibrillation.
Figuras y tablas -
Analysis 5.15

Comparison 5 Metoprolol versus placebo or no treatment, Outcome 15 Atrial fibrillation recurrence – sensitivity analysis: persistent atrial fibrillation.

Comparison 5 Metoprolol versus placebo or no treatment, Outcome 16 Atrial fibrillation recurrence – sensitivity analysis: low risk of bias studies.
Figuras y tablas -
Analysis 5.16

Comparison 5 Metoprolol versus placebo or no treatment, Outcome 16 Atrial fibrillation recurrence – sensitivity analysis: low risk of bias studies.

Comparison 5 Metoprolol versus placebo or no treatment, Outcome 17 Atrial fibrillation recurrence – sensitivity analysis: studies > 200 participants.
Figuras y tablas -
Analysis 5.17

Comparison 5 Metoprolol versus placebo or no treatment, Outcome 17 Atrial fibrillation recurrence – sensitivity analysis: studies > 200 participants.

Comparison 6 Amiodarone versus placebo or no treatment, Outcome 1 All‐cause mortality – main analysis.
Figuras y tablas -
Analysis 6.1

Comparison 6 Amiodarone versus placebo or no treatment, Outcome 1 All‐cause mortality – main analysis.

Comparison 6 Amiodarone versus placebo or no treatment, Outcome 2 All‐cause mortality – intention to treat (ITT) worse case: missing participants counted as events.
Figuras y tablas -
Analysis 6.2

Comparison 6 Amiodarone versus placebo or no treatment, Outcome 2 All‐cause mortality – intention to treat (ITT) worse case: missing participants counted as events.

Comparison 6 Amiodarone versus placebo or no treatment, Outcome 3 All‐cause mortality – sensitivity analysis: persistent atrial fibrillation.
Figuras y tablas -
Analysis 6.3

Comparison 6 Amiodarone versus placebo or no treatment, Outcome 3 All‐cause mortality – sensitivity analysis: persistent atrial fibrillation.

Comparison 6 Amiodarone versus placebo or no treatment, Outcome 4 Withdrawals due to adverse effects – main analysis.
Figuras y tablas -
Analysis 6.4

Comparison 6 Amiodarone versus placebo or no treatment, Outcome 4 Withdrawals due to adverse effects – main analysis.

Comparison 6 Amiodarone versus placebo or no treatment, Outcome 5 Withdrawals due to adverse effects – sensitivity analysis: low risk of bias studies.
Figuras y tablas -
Analysis 6.5

Comparison 6 Amiodarone versus placebo or no treatment, Outcome 5 Withdrawals due to adverse effects – sensitivity analysis: low risk of bias studies.

Comparison 6 Amiodarone versus placebo or no treatment, Outcome 6 Proarrhythmia – main analysis.
Figuras y tablas -
Analysis 6.6

Comparison 6 Amiodarone versus placebo or no treatment, Outcome 6 Proarrhythmia – main analysis.

Comparison 6 Amiodarone versus placebo or no treatment, Outcome 7 Proarrhythmia – sensitivity analysis: persistent atrial fibrillation.
Figuras y tablas -
Analysis 6.7

Comparison 6 Amiodarone versus placebo or no treatment, Outcome 7 Proarrhythmia – sensitivity analysis: persistent atrial fibrillation.

Comparison 6 Amiodarone versus placebo or no treatment, Outcome 8 Proarrhythmia – sensitivity analysis: low risk of bias studies.
Figuras y tablas -
Analysis 6.8

Comparison 6 Amiodarone versus placebo or no treatment, Outcome 8 Proarrhythmia – sensitivity analysis: low risk of bias studies.

Comparison 6 Amiodarone versus placebo or no treatment, Outcome 9 Proarrhythmia – sensitivity analysis: studies > 200 participants.
Figuras y tablas -
Analysis 6.9

Comparison 6 Amiodarone versus placebo or no treatment, Outcome 9 Proarrhythmia – sensitivity analysis: studies > 200 participants.

Comparison 6 Amiodarone versus placebo or no treatment, Outcome 10 Stroke – main analysis.
Figuras y tablas -
Analysis 6.10

Comparison 6 Amiodarone versus placebo or no treatment, Outcome 10 Stroke – main analysis.

Comparison 6 Amiodarone versus placebo or no treatment, Outcome 11 Stroke – sensitivity analysis: persistent atrial fibrillation.
Figuras y tablas -
Analysis 6.11

Comparison 6 Amiodarone versus placebo or no treatment, Outcome 11 Stroke – sensitivity analysis: persistent atrial fibrillation.

Comparison 6 Amiodarone versus placebo or no treatment, Outcome 12 Stroke – sensitivity analysis: studies > 200 participants.
Figuras y tablas -
Analysis 6.12

Comparison 6 Amiodarone versus placebo or no treatment, Outcome 12 Stroke – sensitivity analysis: studies > 200 participants.

Comparison 6 Amiodarone versus placebo or no treatment, Outcome 13 Atrial fibrillation recurrence – main analysis.
Figuras y tablas -
Analysis 6.13

Comparison 6 Amiodarone versus placebo or no treatment, Outcome 13 Atrial fibrillation recurrence – main analysis.

Comparison 6 Amiodarone versus placebo or no treatment, Outcome 14 Atrial fibrillation recurrence – sensitivity analysis: persistent atrial fibrillation.
Figuras y tablas -
Analysis 6.14

Comparison 6 Amiodarone versus placebo or no treatment, Outcome 14 Atrial fibrillation recurrence – sensitivity analysis: persistent atrial fibrillation.

Comparison 6 Amiodarone versus placebo or no treatment, Outcome 15 Atrial fibrillation recurrence – sensitivity analysis: low risk of bias studies.
Figuras y tablas -
Analysis 6.15

Comparison 6 Amiodarone versus placebo or no treatment, Outcome 15 Atrial fibrillation recurrence – sensitivity analysis: low risk of bias studies.

Comparison 6 Amiodarone versus placebo or no treatment, Outcome 16 Atrial fibrillation recurrence – sensitivity analysis: studies > 200 participants.
Figuras y tablas -
Analysis 6.16

Comparison 6 Amiodarone versus placebo or no treatment, Outcome 16 Atrial fibrillation recurrence – sensitivity analysis: studies > 200 participants.

Comparison 7 Dofetilide versus placebo or no treatment, Outcome 1 All‐cause mortality – main analysis.
Figuras y tablas -
Analysis 7.1

Comparison 7 Dofetilide versus placebo or no treatment, Outcome 1 All‐cause mortality – main analysis.

Comparison 7 Dofetilide versus placebo or no treatment, Outcome 2 All‐cause mortality – intention to treat (ITT) worse case: missing participants counted as events.
Figuras y tablas -
Analysis 7.2

Comparison 7 Dofetilide versus placebo or no treatment, Outcome 2 All‐cause mortality – intention to treat (ITT) worse case: missing participants counted as events.

Comparison 7 Dofetilide versus placebo or no treatment, Outcome 3 All‐cause mortality – sensitivity analysis: persistent atrial fibrillation.
Figuras y tablas -
Analysis 7.3

Comparison 7 Dofetilide versus placebo or no treatment, Outcome 3 All‐cause mortality – sensitivity analysis: persistent atrial fibrillation.

Comparison 7 Dofetilide versus placebo or no treatment, Outcome 4 All‐cause mortality – sensitivity analysis: low risk of bias studies.
Figuras y tablas -
Analysis 7.4

Comparison 7 Dofetilide versus placebo or no treatment, Outcome 4 All‐cause mortality – sensitivity analysis: low risk of bias studies.

Comparison 7 Dofetilide versus placebo or no treatment, Outcome 5 All‐cause mortality – sensitivity analysis: studies > 200 participants.
Figuras y tablas -
Analysis 7.5

Comparison 7 Dofetilide versus placebo or no treatment, Outcome 5 All‐cause mortality – sensitivity analysis: studies > 200 participants.

Comparison 7 Dofetilide versus placebo or no treatment, Outcome 6 Withdrawals due to adverse effects – main analysis.
Figuras y tablas -
Analysis 7.6

Comparison 7 Dofetilide versus placebo or no treatment, Outcome 6 Withdrawals due to adverse effects – main analysis.

Comparison 7 Dofetilide versus placebo or no treatment, Outcome 7 Withdrawals due to adverse effects – sensitivity analysis: persistent atrial fibrillation.
Figuras y tablas -
Analysis 7.7

Comparison 7 Dofetilide versus placebo or no treatment, Outcome 7 Withdrawals due to adverse effects – sensitivity analysis: persistent atrial fibrillation.

Comparison 7 Dofetilide versus placebo or no treatment, Outcome 8 Withdrawals due to adverse effects – sensitivity analysis: studies > 200 participants.
Figuras y tablas -
Analysis 7.8

Comparison 7 Dofetilide versus placebo or no treatment, Outcome 8 Withdrawals due to adverse effects – sensitivity analysis: studies > 200 participants.

Comparison 7 Dofetilide versus placebo or no treatment, Outcome 9 Proarrhythmia – main analysis.
Figuras y tablas -
Analysis 7.9

Comparison 7 Dofetilide versus placebo or no treatment, Outcome 9 Proarrhythmia – main analysis.

Comparison 7 Dofetilide versus placebo or no treatment, Outcome 10 Proarrhythmia – sensitivity analysis: persistent atrial fibrillation.
Figuras y tablas -
Analysis 7.10

Comparison 7 Dofetilide versus placebo or no treatment, Outcome 10 Proarrhythmia – sensitivity analysis: persistent atrial fibrillation.

Comparison 7 Dofetilide versus placebo or no treatment, Outcome 11 Proarrhythmia – sensitivity analysis: low risk of bias studies.
Figuras y tablas -
Analysis 7.11

Comparison 7 Dofetilide versus placebo or no treatment, Outcome 11 Proarrhythmia – sensitivity analysis: low risk of bias studies.

Comparison 7 Dofetilide versus placebo or no treatment, Outcome 12 Proarrhythmia – sensitivity analysis: studies > 200 participants.
Figuras y tablas -
Analysis 7.12

Comparison 7 Dofetilide versus placebo or no treatment, Outcome 12 Proarrhythmia – sensitivity analysis: studies > 200 participants.

Comparison 7 Dofetilide versus placebo or no treatment, Outcome 13 Atrial fibrillation recurrence – main analysis.
Figuras y tablas -
Analysis 7.13

Comparison 7 Dofetilide versus placebo or no treatment, Outcome 13 Atrial fibrillation recurrence – main analysis.

Comparison 7 Dofetilide versus placebo or no treatment, Outcome 14 Atrial fibrillation recurrence – sensitivity analysis: persistent atrial fibrillation.
Figuras y tablas -
Analysis 7.14

Comparison 7 Dofetilide versus placebo or no treatment, Outcome 14 Atrial fibrillation recurrence – sensitivity analysis: persistent atrial fibrillation.

Comparison 7 Dofetilide versus placebo or no treatment, Outcome 15 Atrial fibrillation recurrence – sensitivity analysis: low risk of bias studies.
Figuras y tablas -
Analysis 7.15

Comparison 7 Dofetilide versus placebo or no treatment, Outcome 15 Atrial fibrillation recurrence – sensitivity analysis: low risk of bias studies.

Comparison 7 Dofetilide versus placebo or no treatment, Outcome 16 Atrial fibrillation recurrence – sensitivity analysis: studies > 200 participants.
Figuras y tablas -
Analysis 7.16

Comparison 7 Dofetilide versus placebo or no treatment, Outcome 16 Atrial fibrillation recurrence – sensitivity analysis: studies > 200 participants.

Comparison 8 Dronedarone versus placebo or no treatment, Outcome 1 All‐cause mortality – main analysis.
Figuras y tablas -
Analysis 8.1

Comparison 8 Dronedarone versus placebo or no treatment, Outcome 1 All‐cause mortality – main analysis.

Comparison 8 Dronedarone versus placebo or no treatment, Outcome 2 All‐cause mortality – intention to treat (ITT) worse case: missing participants counted as events.
Figuras y tablas -
Analysis 8.2

Comparison 8 Dronedarone versus placebo or no treatment, Outcome 2 All‐cause mortality – intention to treat (ITT) worse case: missing participants counted as events.

Comparison 8 Dronedarone versus placebo or no treatment, Outcome 3 All‐cause mortality – sensitivity analysis: persistent atrial fibrillation.
Figuras y tablas -
Analysis 8.3

Comparison 8 Dronedarone versus placebo or no treatment, Outcome 3 All‐cause mortality – sensitivity analysis: persistent atrial fibrillation.

Comparison 8 Dronedarone versus placebo or no treatment, Outcome 4 All‐cause mortality – sensitivity analysis: low risk of bias studies.
Figuras y tablas -
Analysis 8.4

Comparison 8 Dronedarone versus placebo or no treatment, Outcome 4 All‐cause mortality – sensitivity analysis: low risk of bias studies.

Comparison 8 Dronedarone versus placebo or no treatment, Outcome 5 All‐cause mortality – sensitivity analysis: studies > 200 participants.
Figuras y tablas -
Analysis 8.5

Comparison 8 Dronedarone versus placebo or no treatment, Outcome 5 All‐cause mortality – sensitivity analysis: studies > 200 participants.

Comparison 8 Dronedarone versus placebo or no treatment, Outcome 6 Withdrawals due to adverse effects – main analysis.
Figuras y tablas -
Analysis 8.6

Comparison 8 Dronedarone versus placebo or no treatment, Outcome 6 Withdrawals due to adverse effects – main analysis.

Comparison 8 Dronedarone versus placebo or no treatment, Outcome 7 Withdrawals due to adverse effects – sensitivity analysis: persistent atrial fibrillation.
Figuras y tablas -
Analysis 8.7

Comparison 8 Dronedarone versus placebo or no treatment, Outcome 7 Withdrawals due to adverse effects – sensitivity analysis: persistent atrial fibrillation.

Comparison 8 Dronedarone versus placebo or no treatment, Outcome 8 Withdrawals due to adverse effects – sensitivity analysis: low risk of bias studies.
Figuras y tablas -
Analysis 8.8

Comparison 8 Dronedarone versus placebo or no treatment, Outcome 8 Withdrawals due to adverse effects – sensitivity analysis: low risk of bias studies.

Comparison 8 Dronedarone versus placebo or no treatment, Outcome 9 Withdrawals due to adverse effects – sensitivity analysis: studies > 200 participants.
Figuras y tablas -
Analysis 8.9

Comparison 8 Dronedarone versus placebo or no treatment, Outcome 9 Withdrawals due to adverse effects – sensitivity analysis: studies > 200 participants.

Comparison 8 Dronedarone versus placebo or no treatment, Outcome 10 Proarrhythmia – main analysis.
Figuras y tablas -
Analysis 8.10

Comparison 8 Dronedarone versus placebo or no treatment, Outcome 10 Proarrhythmia – main analysis.

Comparison 8 Dronedarone versus placebo or no treatment, Outcome 11 Proarrhythmia – sensitivity analysis: low risk of bias studies.
Figuras y tablas -
Analysis 8.11

Comparison 8 Dronedarone versus placebo or no treatment, Outcome 11 Proarrhythmia – sensitivity analysis: low risk of bias studies.

Comparison 8 Dronedarone versus placebo or no treatment, Outcome 12 Proarrhythmia – sensitivity analysis: studies > 200 participants.
Figuras y tablas -
Analysis 8.12

Comparison 8 Dronedarone versus placebo or no treatment, Outcome 12 Proarrhythmia – sensitivity analysis: studies > 200 participants.

Comparison 8 Dronedarone versus placebo or no treatment, Outcome 13 Stroke – main analysis.
Figuras y tablas -
Analysis 8.13

Comparison 8 Dronedarone versus placebo or no treatment, Outcome 13 Stroke – main analysis.

Comparison 8 Dronedarone versus placebo or no treatment, Outcome 14 Stroke – sensitivity analysis: studies > 200 participants.
Figuras y tablas -
Analysis 8.14

Comparison 8 Dronedarone versus placebo or no treatment, Outcome 14 Stroke – sensitivity analysis: studies > 200 participants.

Comparison 8 Dronedarone versus placebo or no treatment, Outcome 15 Atrial fibrillation recurrence – main analysis.
Figuras y tablas -
Analysis 8.15

Comparison 8 Dronedarone versus placebo or no treatment, Outcome 15 Atrial fibrillation recurrence – main analysis.

Comparison 8 Dronedarone versus placebo or no treatment, Outcome 16 Atrial fibrillation recurrence – sensitivity analysis: persistent atrial fibrillation.
Figuras y tablas -
Analysis 8.16

Comparison 8 Dronedarone versus placebo or no treatment, Outcome 16 Atrial fibrillation recurrence – sensitivity analysis: persistent atrial fibrillation.

Comparison 8 Dronedarone versus placebo or no treatment, Outcome 17 Atrial fibrillation recurrence – sensitivity analysis: studies > 200 participants.
Figuras y tablas -
Analysis 8.17

Comparison 8 Dronedarone versus placebo or no treatment, Outcome 17 Atrial fibrillation recurrence – sensitivity analysis: studies > 200 participants.

Comparison 9 Sotalol versus placebo or no treatment, Outcome 1 All‐cause mortality – main analysis.
Figuras y tablas -
Analysis 9.1

Comparison 9 Sotalol versus placebo or no treatment, Outcome 1 All‐cause mortality – main analysis.

Comparison 9 Sotalol versus placebo or no treatment, Outcome 2 All‐cause mortality – intention to treat (ITT) worse case: missing participants counted as events.
Figuras y tablas -
Analysis 9.2

Comparison 9 Sotalol versus placebo or no treatment, Outcome 2 All‐cause mortality – intention to treat (ITT) worse case: missing participants counted as events.

Comparison 9 Sotalol versus placebo or no treatment, Outcome 3 All‐cause mortality – sensitivity analysis: persistent atrial fibrillation.
Figuras y tablas -
Analysis 9.3

Comparison 9 Sotalol versus placebo or no treatment, Outcome 3 All‐cause mortality – sensitivity analysis: persistent atrial fibrillation.

Comparison 9 Sotalol versus placebo or no treatment, Outcome 4 All‐cause mortality – sensitivity analysis: low risk of bias studies.
Figuras y tablas -
Analysis 9.4

Comparison 9 Sotalol versus placebo or no treatment, Outcome 4 All‐cause mortality – sensitivity analysis: low risk of bias studies.

Comparison 9 Sotalol versus placebo or no treatment, Outcome 5 All‐cause mortality – sensitivity analysis: studies > 200 participants.
Figuras y tablas -
Analysis 9.5

Comparison 9 Sotalol versus placebo or no treatment, Outcome 5 All‐cause mortality – sensitivity analysis: studies > 200 participants.

Comparison 9 Sotalol versus placebo or no treatment, Outcome 6 Withdrawals due to adverse effects – main analysis.
Figuras y tablas -
Analysis 9.6

Comparison 9 Sotalol versus placebo or no treatment, Outcome 6 Withdrawals due to adverse effects – main analysis.

Comparison 9 Sotalol versus placebo or no treatment, Outcome 7 Withdrawals due to adverse effects – sotalol: heterogeneity study.
Figuras y tablas -
Analysis 9.7

Comparison 9 Sotalol versus placebo or no treatment, Outcome 7 Withdrawals due to adverse effects – sotalol: heterogeneity study.

Comparison 9 Sotalol versus placebo or no treatment, Outcome 8 Withdrawals due to adverse effects – sensitivity analysis: persistent atrial fibrillation.
Figuras y tablas -
Analysis 9.8

Comparison 9 Sotalol versus placebo or no treatment, Outcome 8 Withdrawals due to adverse effects – sensitivity analysis: persistent atrial fibrillation.

Comparison 9 Sotalol versus placebo or no treatment, Outcome 9 Withdrawals due to adverse effects – sensitivity analysis: low risk of bias studies.
Figuras y tablas -
Analysis 9.9

Comparison 9 Sotalol versus placebo or no treatment, Outcome 9 Withdrawals due to adverse effects – sensitivity analysis: low risk of bias studies.

Comparison 9 Sotalol versus placebo or no treatment, Outcome 10 Withdrawals due to adverse effects – sensitivity analysis: studies > 200 participants.
Figuras y tablas -
Analysis 9.10

Comparison 9 Sotalol versus placebo or no treatment, Outcome 10 Withdrawals due to adverse effects – sensitivity analysis: studies > 200 participants.

Comparison 9 Sotalol versus placebo or no treatment, Outcome 11 Proarrhythmia – main analysis.
Figuras y tablas -
Analysis 9.11

Comparison 9 Sotalol versus placebo or no treatment, Outcome 11 Proarrhythmia – main analysis.

Comparison 9 Sotalol versus placebo or no treatment, Outcome 12 Proarrhythmia – sotalol: heterogeneity study.
Figuras y tablas -
Analysis 9.12

Comparison 9 Sotalol versus placebo or no treatment, Outcome 12 Proarrhythmia – sotalol: heterogeneity study.

Comparison 9 Sotalol versus placebo or no treatment, Outcome 13 Proarrhythmia – sensitivity analysis: persistent atrial fibrillation.
Figuras y tablas -
Analysis 9.13

Comparison 9 Sotalol versus placebo or no treatment, Outcome 13 Proarrhythmia – sensitivity analysis: persistent atrial fibrillation.

Comparison 9 Sotalol versus placebo or no treatment, Outcome 14 Proarrhythmia – sensitivity analysis: low risk of bias studies.
Figuras y tablas -
Analysis 9.14

Comparison 9 Sotalol versus placebo or no treatment, Outcome 14 Proarrhythmia – sensitivity analysis: low risk of bias studies.

Comparison 9 Sotalol versus placebo or no treatment, Outcome 15 Proarrhythmia – sensitivity analysis: studies > 200 participants.
Figuras y tablas -
Analysis 9.15

Comparison 9 Sotalol versus placebo or no treatment, Outcome 15 Proarrhythmia – sensitivity analysis: studies > 200 participants.

Comparison 9 Sotalol versus placebo or no treatment, Outcome 16 Stroke – main analysis.
Figuras y tablas -
Analysis 9.16

Comparison 9 Sotalol versus placebo or no treatment, Outcome 16 Stroke – main analysis.

Comparison 9 Sotalol versus placebo or no treatment, Outcome 17 Stroke – sensitivity analysis: persistent atrial fibrillation.
Figuras y tablas -
Analysis 9.17

Comparison 9 Sotalol versus placebo or no treatment, Outcome 17 Stroke – sensitivity analysis: persistent atrial fibrillation.

Comparison 9 Sotalol versus placebo or no treatment, Outcome 18 Stroke – sensitivity analysis: low risk of bias studies.
Figuras y tablas -
Analysis 9.18

Comparison 9 Sotalol versus placebo or no treatment, Outcome 18 Stroke – sensitivity analysis: low risk of bias studies.

Comparison 9 Sotalol versus placebo or no treatment, Outcome 19 Stroke – sensitivity analysis: studies > 200 participants.
Figuras y tablas -
Analysis 9.19

Comparison 9 Sotalol versus placebo or no treatment, Outcome 19 Stroke – sensitivity analysis: studies > 200 participants.

Comparison 9 Sotalol versus placebo or no treatment, Outcome 20 Atrial fibrillation recurrence – main analysis.
Figuras y tablas -
Analysis 9.20

Comparison 9 Sotalol versus placebo or no treatment, Outcome 20 Atrial fibrillation recurrence – main analysis.

Comparison 9 Sotalol versus placebo or no treatment, Outcome 21 Atrial fibrillation recurrence – sensitivity analysis: persistent atrial fibrillation.
Figuras y tablas -
Analysis 9.21

Comparison 9 Sotalol versus placebo or no treatment, Outcome 21 Atrial fibrillation recurrence – sensitivity analysis: persistent atrial fibrillation.

Comparison 9 Sotalol versus placebo or no treatment, Outcome 22 Atrial fibrillation recurrence – sensitivity analysis: low risk of bias studies.
Figuras y tablas -
Analysis 9.22

Comparison 9 Sotalol versus placebo or no treatment, Outcome 22 Atrial fibrillation recurrence – sensitivity analysis: low risk of bias studies.

Comparison 9 Sotalol versus placebo or no treatment, Outcome 23 Atrial fibrillation recurrence – sensitivity analysis: studies > 200 participants.
Figuras y tablas -
Analysis 9.23

Comparison 9 Sotalol versus placebo or no treatment, Outcome 23 Atrial fibrillation recurrence – sensitivity analysis: studies > 200 participants.

Summary of findings for the main comparison. Quinidine compared to placebo or no treatment for maintaining sinus rhythm after cardioversion of atrial fibrillation

Quinidine compared to placebo or no treatment for maintaining sinus rhythm after cardioversion of atrial fibrillation

Patient or population: adults in sinus rhythm after cardioversion of atrial fibrillation
Setting: hospital/community
Intervention: quinidine
Comparison: placebo or no treatment

Outcomes

Anticipated absolute effects* (95% CI)

Relative effect
(95% CI)

№ of participants
(studies)

Certainty of the evidence
(GRADE)

Comments

Risk with placebo or no treatment

Risk with quinidine

All‐cause mortality
follow‐up: median 12 months

Study population

RR 2.01
(0.84 to 4.77)

1646
(6 RCTs)

⊕⊕⊝⊝
Lowa,b

8 per 1000

15 per 1000
(6 to 36)

Withdrawals due to adverse effects
follow‐up: median 12 months

Study population

RR 1.56 (0.87 to 2.78)

1669
(7 RCTs)

⊕⊕⊕⊝
Moderatec,d,e

Heterogeneity was high for the main analysis (I2 = 67%), but the test for subgroup differences indicated that the RR was higher in older studies which used a higher dose.

163 per 1000

254 per 1000 (142 to 452)

Proarrhythmia
follow‐up: median 12 months

Study population

RR 2.05
(0.95 to 4.41)

1676
(7 RCTs)

⊕⊕⊕⊕
Highc,f

11 per 1000

22 per 1000
(10 to 48)

Stroke
follow‐up: median 12 months

Study population

RR 0.97
(0.25 to 3.83)

1107
(4 RCTs)

⊕⊕⊝⊝
Lowa,g

5 per 1000

5 per 1000
(1 to 19)

Recurrence of atrial fibrillation
follow‐up: median 12 months

Study population

RR 0.83
(0.78 to 0.88)

1624
(7 RCTs)

⊕⊕⊕⊕
Highc

80.5 per 100

66.8 per 100
(62.8 to 70.8)

*The risk in the intervention group (and its 95% confidence interval) is based on the assumed risk in the comparison group and the relative effect of the intervention (and its 95% CI).

CI: confidence interval; RCT: randomised controlled trial; RR: risk ratio.

GRADE Working Group grades of evidence
High certainty: we are very confident that the true effect lies close to that of the estimate of the effect.
Moderate certainty: we are moderately confident in the effect estimate: the true effect is likely to be close to the estimate of the effect, but there is a possibility that it is substantially different.
Low certainty: our confidence in the effect estimate is limited: the true effect may be substantially different from the estimate of the effect.
Very low certainty: we have very little confidence in the effect estimate: the true effect is likely to be substantially different from the estimate of effect.

aDowngraded one level for study limitations: majority of studies were at low or unclear risk of bias for at least one of the key domains (allocation concealment, blinding, incomplete outcome data).
bDowngraded one level for imprecision: confidence interval included no effect, the possibility of a beneficial effect and a strong harmful effect.
cNot downgraded for study limitations, as the two studies contributing majority of weight were at low risk for key domains (allocation concealment, blinding, incomplete outcome data).
dNot downgraded for inconsistency: although heterogeneity was high for the main analysis, this was partially explained by subgroup analysis.
eDowngraded one level for imprecision: confidence interval included possibility of no effect or small beneficial effect as well as harmful effect.
fNot downgraded for imprecision, although CI just included null.
gDowngraded one level for imprecision: confidence interval included both important benefits and harms, and event rate was very low.

Figuras y tablas -
Summary of findings for the main comparison. Quinidine compared to placebo or no treatment for maintaining sinus rhythm after cardioversion of atrial fibrillation
Summary of findings 2. Disopyramide compared to placebo or no treatment for maintaining sinus rhythm after cardioversion of atrial fibrillation

Disopyramide compared to placebo or no treatment for maintaining sinus rhythm after cardioversion of atrial fibrillation

Patient or population: adults in sinus rhythm after cardioversion of atrial fibrillation
Setting: hospital/community
Intervention: disopyramide
Comparison: placebo or no treatment

Outcomes

Anticipated absolute effects* (95% CI)

Relative effect
(95% CI)

№ of participants
(studies)

Certainty of the evidence
(GRADE)

Comments

Risk with placebo or no treatment

Risk with disopyramide

All‐cause mortality
follow‐up: mean 12 months

Study population

RR 5.00
(0.25 to 101.37)

92
(1 RCT)

⊕⊝⊝⊝
Very lowa,b

Anticipated absolute effects per 1000 could not be calculated because there were no deaths in the control group. Risks were the data from the RCT.

0/71

5/75

Withdrawals due to adverse effects
follow‐up: range 6–12 months

Study population

RR 3.68
(0.95 to 14.24)

146
(2 RCTs)

⊕⊕⊝⊝
Lowa,c

28 per 1000

104 per 1000
(27 to 401)

Proarrhythmia

Not reported

Stroke
follow‐up: range 6–12 months

Study population

RR 0.31
(0.03 to 2.91)

146
(2 RCTs)

⊕⊝⊝⊝
Very lowa,b

28 per 1000

9 per 1000
(1 to 82)

Recurrence of atrial fibrillation
follow‐up: range 6–12 months

Study population

RR 0.77
(0.59 to 1.01)

146
(2 RCTs)

⊕⊕⊝⊝
Lowa,c

69.0 per 100

53.1 per 100
(40.7 to 69.7)

*The risk in the intervention group (and its 95% confidence interval) is based on the assumed risk in the comparison group and the relative effect of the intervention (and its 95% CI).

CI: confidence interval; RCT: randomised controlled trial; RR: risk ratio.

GRADE Working Group grades of evidence
High certainty: we are very confident that the true effect lies close to that of the estimate of the effect.
Moderate certainty: we are moderately confident in the effect estimate: the true effect is likely to be close to the estimate of the effect, but there is a possibility that it is substantially different.
Low certainty: our confidence in the effect estimate is limited: the true effect may be substantially different from the estimate of the effect.
Very low certainty: we have very little confidence in the effect estimate: the true effect is likely to be substantially different from the estimate of effect.

aDowngraded one level for study limitations: both studies had unclear risk of bias for one of the key domains.
bDowngraded two levels for imprecision: very small sample size and wide confidence intervals including both important benefits and harms.
cDowngraded one level for imprecision: very small sample size.

Figuras y tablas -
Summary of findings 2. Disopyramide compared to placebo or no treatment for maintaining sinus rhythm after cardioversion of atrial fibrillation
Summary of findings 3. Propafenone compared to placebo or no treatment for maintaining sinus rhythm after cardioversion of atrial fibrillation

Propafenone compared to placebo or no treatment for maintaining sinus rhythm after cardioversion of atrial fibrillation

Patient or population: adults in sinus rhythm after cardioversion of atrial fibrillation
Setting: hospital/community
Intervention: propafenone
Comparison: placebo or no treatment

Outcomes

Anticipated absolute effects* (95% CI)

Relative effect
(95% CI)

№ of participants
(studies)

Certainty of the evidence
(GRADE)

Comments

Risk with placebo or no treatment

Risk with propafenone

All‐cause mortality
follow‐up: range 6–15 months

Study population

RR 0.19
(0.02 to 1.68)

212
(2 RCTs)

⊕⊝⊝⊝
Very lowa,b

Very few data available for this outcome: only 2 deaths reported in 5 included RCTs.

26 per 1000

5 per 1000
(1 to 44)

Withdrawals due to adverse effects
follow‐up: range 6–15 months

Study population

RR 1.62
(1.07 to 2.46)

1098
(5 RCTs)

⊕⊕⊕⊝
Moderatea

61 per 1000

99 per 1000
(65 to 150)

Proarrhythmia
follow‐up: range 6–15 months

Study population

RR 1.32
(0.39 to 4.47)

381
(3 RCTs)

⊕⊝⊝⊝
Very lowa,b

13 per 1000

17 per 1000
(5 to 56)

Stroke

Not reported

Recurrence of atrial fibrillation
follow‐up: range 6–15 months

Study population

RR 0.67
(0.61 to 0.74)

1098
(5 RCTs)

⊕⊕⊕⊝
Moderatea

73.0 per 100

48.9 per 100
(44.5 to 54.0)

*The risk in the intervention group (and its 95% confidence interval) is based on the assumed risk in the comparison group and the relative effect of the intervention (and its 95% CI).

CI: confidence interval; RCT: randomised controlled trial; RR: risk ratio.

GRADE Working Group grades of evidence
High certainty: we are very confident that the true effect lies close to that of the estimate of the effect.
Moderate certainty: we are moderately confident in the effect estimate: the true effect is likely to be close to the estimate of the effect, but there is a possibility that it is substantially different.
Low certainty: our confidence in the effect estimate is limited: the true effect may be substantially different from the estimate of the effect.
Very low certainty: we have very little confidence in the effect estimate: the true effect is likely to be substantially different from the estimate of effect.

aDowngraded one level for study limitations. All studies had unclear or high risk of bias in at least one of the three key domains (allocation concealment, blinding, incomplete outcome data).
bDowngraded two levels for imprecision due to small sample size and confidence interval wide enough to include both important benefit and harm.

Figuras y tablas -
Summary of findings 3. Propafenone compared to placebo or no treatment for maintaining sinus rhythm after cardioversion of atrial fibrillation
Summary of findings 4. Flecainide compared to placebo or no treatment for maintaining sinus rhythm after cardioversion of atrial fibrillation

Flecainide compared to placebo or no treatment for maintaining sinus rhythm after cardioversion of atrial fibrillation

Patient or population: adults in sinus rhythm after cardioversion of atrial fibrillation
Setting: hospital/community
Intervention: flecainide
Comparison: placebo or no treatment

Outcomes

Anticipated absolute effects* (95% CI)

Relative effect
(95% CI)

№ of participants
(studies)

Certainty of the evidence
(GRADE)

Comments

Risk with placebo or no treatment

Risk with flecainide

All‐cause mortality

Not reported

Withdrawals due to adverse effects
follow‐up: mean 6 months

Study population

RR 15.41
(0.91 to 260)

73
(1 RCT)

⊕⊕⊝⊝
Lowa,b

Anticipated absolute effects per 1000 could not be calculated because there were no withdrawals in the control group. Risks were the data from the RCT.

0/37

7/36

Proarrhythmia
follow‐up: range 6–12 months

Study population

RR 4.80
(1.30 to 17.7)

511
(4 RCTs)

⊕⊕⊕⊝
Moderatec

6 per 1000

30 per 1000
(8 to 112)

Stroke
follow‐up: mean 6 months

Study population

RR 2.04
(0.11 to 39)

362
(1 RCT)

⊕⊕⊝⊝
Lowa,b

Anticipated absolute effects per 1000 could not be calculated because there were no strokes in the control group. Risks were the data from the RCT.

0/81

3/281

Recurrence of atrial fibrillation
follow‐up: range 6–12 months

Study population

RR 0.65
(0.55 to 0.77)

511
(4 RCTs)

⊕⊕⊕⊕
Highd

69.8 per 100

45.4 per 100
(38.4 to 53.8)

*The risk in the intervention group (and its 95% confidence interval) is based on the assumed risk in the comparison group and the relative effect of the intervention (and its 95% CI).

CI: confidence interval; RCT: randomised controlled trial; RR: risk ratio.

GRADE Working Group grades of evidence
High certainty: we are very confident that the true effect lies close to that of the estimate of the effect.
Moderate certainty: we are moderately confident in the effect estimate: the true effect is likely to be close to the estimate of the effect, but there is a possibility that it is substantially different.
Low certainty: our confidence in the effect estimate is limited: the true effect may be substantially different from the estimate of the effect.
Very low certainty: we have very little confidence in the effect estimate: the true effect is likely to be substantially different from the estimate of effect.

aNot downgraded for study limitations. the only included study was at high risk of bias for blinding (less relevant for this outcome) but low risk for other key domains.
bDowngraded two levels for imprecision due to small sample size and wide confidence interval that included both possible harm and no effect.
cDowngraded one level for study limitations; all studies were at high or unclear risk of bias in at least one of the key domains.
dNot downgraded for study limitations. Majority of weight came from 2 largest studies which were at high risk of bias for blinding (less relevant for this outcome) but low risk for other key domains.

Figuras y tablas -
Summary of findings 4. Flecainide compared to placebo or no treatment for maintaining sinus rhythm after cardioversion of atrial fibrillation
Summary of findings 5. Metoprolol compared to placebo or no treatment for maintaining sinus rhythm after cardioversion of atrial fibrillation

Metoprolol compared to placebo or no treatment for maintaining sinus rhythm after cardioversion of atrial fibrillation

Patient or population: adults in sinus rhythm after cardioversion of atrial fibrillation
Setting: hospital/community
Intervention: metoprolol
Comparison: placebo or no treatment

Outcomes

Anticipated absolute effects* (95% CI)

Relative effect
(95% CI)

№ of participants
(studies)

Certainty of the evidence
(GRADE)

Comments

Risk with placebo or no treatment

Risk with Metoprolol

All‐cause mortality
follow‐up: mean 6 months

Study population

RR 2.02
(0.37 to 11.1)

562
(2 RCTs)

⊕⊕⊕⊝
Moderatea

4 per 1000

7 per 1000
(1 to 39)

Withdrawals due to adverse effects
follow‐up: mean 6 months

Study population

RR 3.47
(1.48 to 8.1)

562
(2 RCTs)

⊕⊕⊕⊕
High

21 per 1000

74 per 1000
(31 to 173)

Proarrhythmia
follow‐up: mean 6 months

Study population

RR 18.14
(2.42 to 135.6)

562
(2 RCTs)

⊕⊕⊕⊕
High

Anticipated absolute effects per 1000 could not be calculated because there were no events in the control group. Risks are the data from the RCTs.

0 / 282

17 / 280

Stroke

Not reported

Recurrence of atrial fibrillation
follow‐up: mean 6 months

Study population

RR 0.83 (0.68 to 1.02)

562
(2 RCTs)

⊕⊕⊕⊝
Moderateb

72.0 per 100

59.7 per 100
(49.0 to 73.4)

*The risk in the intervention group (and its 95% confidence interval) is based on the assumed risk in the comparison group and the relative effect of the intervention (and its 95% CI).

CI: confidence interval; RCT: randomised controlled trial; RR: risk ratio.

GRADE Working Group grades of evidence
High certainty: we are very confident that the true effect lies close to that of the estimate of the effect.
Moderate certainty: we are moderately confident in the effect estimate: the true effect is likely to be close to the estimate of the effect, but there is a possibility that it is substantially different.
Low certainty: our confidence in the effect estimate is limited: the true effect may be substantially different from the estimate of the effect.
Very low certainty: we have very little confidence in the effect estimate: the true effect is likely to be substantially different from the estimate of effect.

aDowngraded one level for imprecision. Confidence intervals included both possible harm and possible benefit.
bDowngraded one level for inconsistency: high I2 statistic (59%) indicated heterogeneity and this could not be explored in subgroup analysis due to only two studies being included.

Figuras y tablas -
Summary of findings 5. Metoprolol compared to placebo or no treatment for maintaining sinus rhythm after cardioversion of atrial fibrillation
Summary of findings 6. Amiodarone compared to placebo or no treatment for maintaining sinus rhythm after cardioversion of atrial fibrillation

Amiodarone compared to placebo or no treatment for maintaining sinus rhythm after cardioversion of atrial fibrillation

Patient or population: adults in sinus rhythm after cardioversion of atrial fibrillation
Setting: hospital/community
Intervention: amiodarone
Comparison: placebo or no treatment

Outcomes

Anticipated absolute effects* (95% CI)

Relative effect
(95% CI)

№ of participants
(studies)

Certainty of the evidence
(GRADE)

Comments

Risk with placebo or no treatment

Risk with amiodarone

All‐cause mortality
follow‐up: range 6–12 months

Study population

RR 1.66
(0.55 to 4.99)

444
(2 RCTs)

⊕⊕⊕⊝
Moderatea

26 per 1000

43 per 1000
(14 to 129)

Withdrawals due to adverse effects
follow‐up: range 6–16 months

Study population

RR 6.70
(1.91 to 23.45)

319
(4 RCTs)

⊕⊕⊝⊝
Lowb,c

7 per 1000

49 per 1000
(14 to 172)

Proarrhythmia
follow‐up: range 6–16 months

Study population

RR 2.22
(0.71 to 6.96)

673
(4 RCTs)

⊕⊕⊕⊝
Moderatea,d

8 per 1000

18 per 1000
(6 to 57)

Stroke
follow‐up: mean 12 months

Study population

RR 1.15
(0.30 to 4.39)

399
(1 RCT)

⊕⊕⊝⊝
Lowe

23 per 1000

26 per 1000
(7 to 100)

Recurrence of atrial fibrillation
follow‐up: median 12 months

Study population

RR 0.52
(0.46 to 0.58)

812
(6 RCTs)

⊕⊕⊕⊕
Highd

81.2 per 100

42.2 per 100
(37.3 to 47.1)

*The risk in the intervention group (and its 95% confidence interval) is based on the assumed risk in the comparison group and the relative effect of the intervention (and its 95% CI).

CI: confidence interval; RCT: randomised controlled trial; RR: risk ratio.

GRADE Working Group grades of evidence
High certainty: we are very confident that the true effect lies close to that of the estimate of the effect.
Moderate certainty: we are moderately confident in the effect estimate: the true effect is likely to be close to the estimate of the effect, but there is a possibility that it is substantially different.
Low certainty: our confidence in the effect estimate is limited: the true effect may be substantially different from the estimate of the effect.
Very low certainty: we have very little confidence in the effect estimate: the true effect is likely to be substantially different from the estimate of effect.

aDowngraded one level for imprecision: confidence interval included both possible benefit and harm.
bDowngraded one level for study limitations: majority of weight was from studies with unclear or high risk of bias in key domains.
cDowngraded one level for imprecision: small sample size.
dNot downgraded for study limitations, as the majority weight was from studies at low risk of bias in all key domains.
eDowngraded two levels for imprecision: small sample size and wide confidence interval which included both possible benefit and harm.

Figuras y tablas -
Summary of findings 6. Amiodarone compared to placebo or no treatment for maintaining sinus rhythm after cardioversion of atrial fibrillation
Summary of findings 7. Dofetilide compared to placebo or no treatment for maintaining sinus rhythm after cardioversion of atrial fibrillation

Dofetilide compared to placebo or no treatment for maintaining sinus rhythm after cardioversion of atrial fibrillation

Patient or population: adults in sinus rhythm after cardioversion of atrial fibrillation
Setting: hospital/community
Intervention: dofetilide
Comparison: placebo or no treatment

Outcomes

Anticipated absolute effects* (95% CI)

Relative effect
(95% CI)

№ of participants
(studies)

Certainty of the evidence
(GRADE)

Comments

Risk with placebo or no treatment

Risk with dofetilide

All‐cause mortality
follow‐up: mean 12 months

Study population

RR 0.98
(0.76 to 1.27)

1183
(3 RCTs)

⊕⊕⊕⊝
Moderatea

193 per 1000

189 per 1000
(146 to 245)

Withdrawals due to adverse effects
follow‐up: mean 12 months

Study population

RR 1.77
(0.75 to 4.2)

677
(2 RCTs)

⊕⊕⊝⊝
Lowa,b

34 per 1000

61 per 1000
(26 to 144)

Proarrhythmia
follow‐up: mean 12 months

Study population

RR 5.50
(1.33 to 22.8)

1183
(3 RCTs)

⊕⊕⊕⊝
Moderatea

2 per 1000

13 per 1000
(3 to 53)

Stroke

Not reported

Recurrence of atrial fibrillation
follow‐up: mean 12 months

Study population

RR 0.72 (0.61 to 0.85)

1183
(3 RCTs)

⊕⊕⊕⊝
Moderatec,d

84.2 per 100

60.6 per 100
(51.4 to 71.6)

*The risk in the intervention group (and its 95% confidence interval) is based on the assumed risk in the comparison group and the relative effect of the intervention (and its 95% CI).

CI: confidence interval; RCT: randomised controlled trial; RR: risk ratio.

GRADE Working Group grades of evidence
High certainty: we are very confident that the true effect lies close to that of the estimate of the effect.
Moderate certainty: we are moderately confident in the effect estimate: the true effect is likely to be close to the estimate of the effect, but there is a possibility that it is substantially different.
Low certainty: our confidence in the effect estimate is limited: the true effect may be substantially different from the estimate of the effect.
Very low certainty: we have very little confidence in the effect estimate: the true effect is likely to be substantially different from the estimate of effect.

aDowngraded one level for study limitations: majority of studies had unclear risk of selection bias.
bDowngraded one level for imprecision: confidence interval included both possible benefit and harm.
cNot downgraded for study limitations as 51% of weight came from a study with low risk of bias across all domains (but other two studies had unclear risk of selection bias).
dDowngraded one level for heterogeneity due to very high I2 value (79%).

Figuras y tablas -
Summary of findings 7. Dofetilide compared to placebo or no treatment for maintaining sinus rhythm after cardioversion of atrial fibrillation
Summary of findings 8. Dronedarone compared to placebo or no treatment for maintaining sinus rhythm after cardioversion of atrial fibrillation

Dronedarone compared to placebo or no treatment for maintaining sinus rhythm after cardioversion of atrial fibrillation

Patient or population: adults in sinus rhythm after cardioversion of atrial fibrillation
Setting: hospital/community
Intervention: dronedarone
Comparison: placebo or no treatment

Outcomes

Anticipated absolute effects* (95% CI)

Relative effect
(95% CI)

№ of participants
(studies)

Certainty of the evidence
(GRADE)

Comments

Risk with placebo or no treatment

Risk with dronedarone

All‐cause mortality
follow‐up: range 6–12 months

Study population

RR 0.86
(0.68 to 1.09)

6071
(3 RCTs)

⊕⊕⊕⊕
High

51 per 1000

44 per 1000
(35 to 56)

Withdrawals due to adverse effects
follow‐up: range 6–12 months

Study population

RR 1.58
(1.34 to 1.85)

6071
(3 RCTs)

⊕⊕⊕⊝
Moderatea

77 per 1000

122 per 1000
(104 to 143)

Proarrhythmia
follow‐up: mean 12 months

Study population

RR 1.95 (0.77 to 4.98)

5872
(2 RCTs)

⊕⊕⊕⊝
Moderateb

18 per 1000

36 per 1000
(14 to 91)

Stroke
follow‐up: mean 12 months

Study population

RR 0.66
(0.47 to 0.95)

5872
(2 RCTs)

⊕⊕⊕⊕
High

27 per 1000

18 per 1000
(13 to 25)

Recurrence of atrial fibrillation
follow‐up: range 6–12 months

Study population

RR 0.85
(0.80 to 0.91)

1443
(2 RCTs)

⊕⊕⊕⊝
Moderatec

76.6 per 100

65.1 per 100
(61.3 to 69.7)

*The risk in the intervention group (and its 95% confidence interval) is based on the assumed risk in the comparison group and the relative effect of the intervention (and its 95% CI).

CI: confidence interval; RCT: randomised controlled trial; RR: risk ratio.

GRADE Working Group grades of evidence
High certainty: we are very confident that the true effect lies close to that of the estimate of the effect.
Moderate certainty: we are moderately confident in the effect estimate: the true effect is likely to be close to the estimate of the effect, but there is a possibility that it is substantially different.
Low certainty: our confidence in the effect estimate is limited: the true effect may be substantially different from the estimate of the effect.
Very low certainty: we have very little confidence in the effect estimate: the true effect is likely to be substantially different from the estimate of effect.

aDowngraded one level for study limitations: 83% of weight came from a study with unclear blinding, which could be relevant to this outcome.
bDowngraded one level for inconsistency due to very high I2 statistic of 78%.
cDowngraded one level for study limitations: most weight came from a study with unclear allocation concealment.

Figuras y tablas -
Summary of findings 8. Dronedarone compared to placebo or no treatment for maintaining sinus rhythm after cardioversion of atrial fibrillation
Summary of findings 9. Sotalol compared to placebo or no treatment for maintaining sinus rhythm after cardioversion of atrial fibrillation

Sotalol compared to placebo or no treatment for maintaining sinus rhythm after cardioversion of atrial fibrillation

Patient or population: adults in sinus rhythm after cardioversion of atrial fibrillation
Setting: hospital/community
Intervention: sotalol
Comparison: placebo or no treatment

Outcomes

Anticipated absolute effects* (95% CI)

Relative effect
(95% CI)

№ of participants
(studies)

Certainty of the evidence
(GRADE)

Comments

Risk with placebo or no treatment

Risk with sotalol

All‐cause mortality
follow‐up: range 6–12 months

Study population

RR 2.23
(1.03 to 4.81)

1882
(5 RCTs)

⊕⊕⊕⊕
High

8 per 1000

19 per 1000
(9 to 40)

Withdrawals due to adverse effects
follow‐up: range 6–19 months; median 12 months

Study population

RR 1.95 (1.23 to 3.11)

2688
(12 RCTs)

⊕⊕⊕⊝
Moderatea,b,c

Heterogeneity was high for the main analysis (I2 = 56%), but the test for subgroup differences indicated that the RR was higher in older studies with sotalol.

94 per 1000

183 per 1000
(116 to 293)

Proarrhythmia
follow‐up: median 12 months

Study population

RR 3.55
(2.16 to 5.83)

2989
(12 RCTs)

⊕⊕⊕⊝
Moderatea,c

12 per 1000

41 per 1000
(25 to 68)

Stroke
follow‐up: range 6–12 months

Study population

RR 1.47
(0.48 to 4.51)

1161
(3 RCTs)

⊕⊕⊕⊝
Moderated

7 per 1000

10 per 1000
(3 to 30)

Recurrence of atrial fibrillation
follow‐up: range 6–19 months; median 12 months

Study population

RR 0.83
(0.80 to 0.87)

3179
(14 RCTs)

⊕⊕⊕⊕
Higha,e,f

78.8 per 100

65.4 per 100
(63.1 to 68.6)

*The risk in the intervention group (and its 95% confidence interval) is based on the assumed risk in the comparison group and the relative effect of the intervention (and its 95% CI).

CI: confidence interval; RCT: randomised controlled trial; RR: risk ratio.

GRADE Working Group grades of evidence
High certainty: we are very confident that the true effect lies close to that of the estimate of the effect.
Moderate certainty: we are moderately confident in the effect estimate: the true effect is likely to be close to the estimate of the effect, but there is a possibility that it is substantially different.
Low certainty: our confidence in the effect estimate is limited: the true effect may be substantially different from the estimate of the effect.
Very low certainty: we have very little confidence in the effect estimate: the true effect is likely to be substantially different from the estimate of effect.

aNot downgraded for study limitations. Although the majority of studies had unclear or high risk of bias in at least one of the key domains, the majority of the weight was from studies at low risk of bias in key domains.
bNot downgraded for inconsistency. I2 statistic was 56% for the main analysis, but this was partially explained by subgroup analysis.
cDowngraded one level for publication bias: forest plot appeared to be asymmetrical.
dDowngraded one level for imprecision: confidence interval included both possible benefit and harm.
eNot downgraded for publication bias: funnel plot appears to be broadly symmetrical.
fNot downgraded for inconsistency. I2 statistic was 54% but the forest plot had good overlap in confidence intervals, so a fixed‐effect model was used to maintain the weight of the few larger studies.

Figuras y tablas -
Summary of findings 9. Sotalol compared to placebo or no treatment for maintaining sinus rhythm after cardioversion of atrial fibrillation
Table 1. Number of studies assessing each primary outcome

Primary outcomes

n trials reporting (n participants)

n trials NOT reporting (n participants)

All‐cause mortality

39 (17,586)

3a (393)

Cardiovascular mortality

Same as total mortality

Same as total mortality

Stroke

11 (9139)

30 (8840)

Adverse effects (proarrhythmia and withdrawals due to adverse effects)

39 (16,558)

3b (1421)

Out of 41 studies comparing an active drug with a control group receiving no antiarrhythmic (total 17,979 participants).

aChun 2014; DAPHNE 2008; Santas 2012.

bAFIB 1997; Chun 2014; Santas 2012. Others studies did not reported proarrhythmia but reported withdrawals (DAPHNE 2008; Niu 2006; Villani 1992).

Figuras y tablas -
Table 1. Number of studies assessing each primary outcome
Table 2. Head‐to‐head trials: all‐cause mortality

Drug 1 vs drug 2

Drug 1

Drug 2

RR (95% CI)

Events

Total

Events

Total

Disopyramide vs other class I drugs

Lloyd 1984

0

29

2

28

0.19 (0.01 to 3.86)

PRODIS 1996

1

31

0

25

2.44 (0.10 to 57.37)

Quinidine vs other class I drugs

Lloyd 1984

2

28

0

29

5.17 (0.26 to 103.18)

Richiardi 1992

0

98

2

102

0.21 (0.01 to 4.28)

Quinidine vs sotalol

Juul‐Moller 1990

1

85

1

98

1.15 (0.07 to 18.15)

Kalusche 1994

1

41

0

41

3.00 (0.13 to 71.56)

PAFAC 2004

9

377

13

383

0.70 (0.30 to 1.63)

SOCESP 1999

0

63

1

58

0.31 (0.01 to 7.40)

SOPAT 2004

2

518

2

264

0.51 (0.07 to 3.60)

Flecainide vs propafenone

Aliot 1996

0

48

1

49

0.34 (0.01 to 8.15)

Amiodarone vs class I drugs

AFFIRM Substudy 2003

10

106

26

116

0.42 (0.21 to 0.83)

PITAGORA 2008

6

70

2

75

3.21 (0.67 to 15.40)

Amiodarone vs dronedarone

DIONYSOS 2010

5

255

2

249

2.44 (0.48 to 12.47)

Amiodarone vs sotalol

AFFIRM Substudy 2003

15

131

24

125

0.60 (0.33 to 1.08)

PITAGORA 2008

6

70

0

31

5.86 (0.34 to 100.89)

SAFE‐T 2005

13

267

15

261

0.85 (0.41 to 1.75)

Sotalol vs class I drugs other than quinidine

AFFIRM Substudy 2003

13

88

17

95

0.83 (0.43 to 1.60)

Reimold 1993

2

50

0

50

5.00 (0.25 to 101.58)

Sotalol vs dofetilide

EMERALD 2000

0

108

1

321

0.98 (0.04 to 23.99)

CI: confidence interval; RR: risk ratio.

Figuras y tablas -
Table 2. Head‐to‐head trials: all‐cause mortality
Table 3. Head‐to‐head trials: withdrawals due to adverse events

Drug 1 vs drug 2

Drug 1

Drug 2

RR (95% CI)

Events

Total

Events

Total

Disopyramide vs other class I drugs

Lloyd 1984

2

29

4

28

0.48 (0.10 to 2.43)

PRODIS 1996

4

31

8

25

0.40 (0.14 to 1.19)

Quinidine vs flecainide

Naccarelli 1996

35

117

22

122

1.66 (1.04 to 2.65)

Steinbeck 1988

2

15

0

15

5.00 (0.26 to 96.13)

Quinidine vs other class I drugs

Lloyd 1984

4

28

2

29

2.07 (0.41 to 10.43)

Naccarelli 1996

35

117

22

122

1.66 (1.04 to 2.65)

Richiardi 1992

23

98

10

102

2.39 (1.20 to 4.77)

Steinbeck 1988

2

15

0

15

5.00 (0.26 to 96.13)

Quinidine vs sotalol

Hohnloser 1995

10

25

1

25

10.00 (1.38 to 72.39)

Juul‐Moller 1990

22

85

11

98

2.31 (1.19 to 4.47)

Kalusche 1994

7

41

3

41

2.33 (0.65 to 8.40)

PAFAC 2004

94

377

96

383

0.99 (0.78 to 1.27)

SOCESP 1999

10

63

7

58

1.32 (0.54 to 3.23)

SOPAT 2004

87

518

53

264

0.84 (0.62 to 1.14)

Flecainide vs propafenone

Aliot 1996

2

48

9

49

0.23 (0.05 to 1.00)

FAPIS 1996

10

97

9

103

1.18 (0.50 to 2.78)

Amiodarone vs class I drugs

AFFIRM Substudy 2003

20

154

47

121

0.33 (0.21 to 0.53)

Kochiadakis 2004a

17

72

2

74

8.74 (2.09 to 36.46)

PITAGORA 2008

5

70

2

31

1.11 (0.23 to 5.40)

Villani 1992

3

35

10

41

0.35 (0.10 to 1.18)

Vitolo 1981

1

28

1

26

0.93 (0.06 to 14.09)

Amiodarone vs dronedarone

DIONYSOS 2010

45

255

32

249

1.37 (0.90 to 2.09)

Amiodarone vs sotalol

AFFIRM Substudy 2003

20

154

21

135

0.83 (0.47 to 1.47)

Kochiadakis 2000

11

65

3

61

3.44 (1.01 to 11.75)

Niu 2006

5

51

7

51

0.71 (0.24 to 2.10)

PITAGORA 2008

6

70

0

31

5.86 (0.34 to 100.89)

Vijayalakshmi 2006

1

22

4

33

0.38 (0.04 to 3.14)

Sotalol vs class I drugs other than quinidine

AFFIRM Substudy 2003

21

135

47

121

0.40 (0.25 to 0.63)

Kochiadakis 2004b

5

85

5

86

1.01 (0.30 to 3.37)

Reimold 1993

6

50

4

50

1.50 (0.45 to 4.99)

Sotalol vs dofetilide

EMERALD 2000

16

108

22

321

2.16 (1.18 to 3.96)

Sotalol vs other beta‐blockers

DAPHNE 2008

11

69

2

66

5.26 (1.21 to 22.84)

Plewan 2001

4

64

3

64

1.33 (0.31 to 5.72)

CI: confidence interval; RR: risk ratio.

Figuras y tablas -
Table 3. Head‐to‐head trials: withdrawals due to adverse events
Table 4. Head‐to‐head trials: proarrhythmia

Drug 1 vs drug 2

Drug 1

Drug 2

RR (95% CI)

Events

Total

Events

Total

Disopyramide vs other class I drugs

Lloyd 1984

0

29

1

28

0.32 (0.01 to 7.59)

PRODIS 1996

1

31

1

25

0.81 (0.05 to 12.26)

Quinidine vs flecainide

Naccarelli 1996

10

117

7

122

1.49 (0.59 to 3.78)

Steinbeck 1988

2

15

1

15

2.00 (0.20 to 19.78)

Quinidine vs other class I drugs

Lloyd 1984

1

28

0

29

3.10 (0.13 to 73.12)

Naccarelli 1996

10

117

7

122

1.49 (0.59 to 3.78)

Richiardi 1992

2

98

2

102

1.04 (0.15 to 7.24)

Steinbeck 1988

2

15

1

15

2.00 (0.20 to 19.78)

Quinidine vs sotalol

Hohnloser 1995

3

25

1

25

3.00 (0.33 to 26.92)

Juul‐Moller 1990

1

85

1

98

1.15 (0.07 to 18.15)

Kalusche 1994

1

41

2

41

0.50 (0.05 to 5.30)

PAFAC 2004

17

377

20

383

0.86 (0.46 to 1.62)

SOCESP 1999

2

63

3

58

0.61 (0.11 to 3.54)

SOPAT 2004

8

518

2

264

2.04 (0.44 to 9.53)

Flecainide vs propafenone

Aliot 1996

0

48

4

49

0.11 (0.01 to 2.05)

FAPIS 1996

2

97

1

103

2.12 (0.20 to 23.05)

Amiodarone vs class I drugs

AFFIRM Substudy 2003

5

154

20

121

0.20 (0.08 to 0.51)

Kochiadakis 2004a

2

72

2

74

1.03 (0.15 to 7.10)

Vitolo 1981

1

28

1

26

0.93 (0.06 to 14.09)

Amiodarone vs dronedarone

DIONYSOS 2010

4

255

2

249

1.95 (0.36 to 10.57)

Amiodarone vs sotalol

AFFIRM Substudy 2003

5

154

9

135

0.49 (0.17 to 1.42)

Kochiadakis 2000

2

65

2

61

0.94 (0.14 to 6.46)

SAFE‐T 2005

6

267

9

261

0.65 (0.24 to 1.81)

Sotalol vs class I drugs other than quinidine

AFFIRM Substudy 2003

9

135

20

121

0.40 (0.19 to 0.85)

Carunchio 1995

5

20

3

20

1.67 (0.46 to 6.06)

Kochiadakis 2004b

3

85

2

86

1.52 (0.26 to 8.86)

Reimold 1993

9

50

6

50

1.50 (0.58 to 3.90)

Sotalol vs dofetilide

EMERALD 2000

2

108

7

321

0.85 (0.18 to 4.03)

Sotalol vs other beta‐blockers

Plewan 2001

4

64

3

64

1.33 (0.31 to 5.72)

CI: confidence interval; RR: risk ratio.

Figuras y tablas -
Table 4. Head‐to‐head trials: proarrhythmia
Table 5. Head‐to‐head trials: recurrence of atrial fibrillation

Drug 1 vs drug 2

Drug 1

Drug 2

RR (95% CI)

Events

Total

Events

Total

Disopyramide vs other class I drugs

Lloyd 1984

16

29

16

28

0.97 (0.61 to 1.53)

PRODIS 1996

10

31

11

25

0.73 (0.37 to 1.44)

Quinidine vs flecainide

Naccarelli 1996

93

117

93

122

1.04 (0.91 to 1.19)

Steinbeck 1988

10

15

6

15

1.67 (0.81 to 3.41)

Quinidine vs other class I drugs

Lloyd 1984

16

28

16

29

1.04 (0.65 to 1.64)

Naccarelli 1996

93

117

93

122

1.04 (0.91 to 1.19)

Richiardi 1992

57

98

53

102

1.12 (0.87 to 1.44)

Steinbeck 1988

10

15

6

15

1.67 (0.81 to 3.41)

Quinidine vs sotalol

Hohnloser 1995

7

25

12

25

0.58 (0.28 to 1.23)

Juul‐Moller 1990

49

85

50

98

1.13 (0.87 to 1.47)

Kalusche 1994

15

41

21

41

0.71 (0.43 to 1.18)

PAFAC 2004

244

377

255

383

0.97 (0.88 to 1.08)

SOCESP 1999

25

63

20

58

1.15 (0.72 to 1.84)

SOPAT 2004

375

518

198

264

0.97 (0.88 to 1.05)

Flecainide vs propafenone

Aliot 1996

19

48

26

49

0.75 (0.48 to 1.16)

FAPIS 1996

30

97

30

103

1.06 (0.70 to 1.62)

Amiodarone vs class I drugs

AFFIRM Substudy 2003

60

106

99

116

0.66 (0.55 to 0.80)

Kochiadakis 2004a

20

72

32

74

0.64 (0.41 to 1.01)

PITAGORA 2008

42

70

54

75

0.83 (0.66 to 1.06)

Villani 1992

14

35

30

41

0.55 (0.35 to 0.85)

Vitolo 1981

6

28

14

26

0.40 (0.18 to 0.88)

Amiodarone vs dronedarone

DIONYSOS 2010

116

255

163

249

0.69 (0.59 to 0.82)

Amiodarone vs sotalol

AFFIRM Substudy 2003

58

131

81

125

0.68 (0.54 to 0.86)

Kochiadakis 2000

27

65

39

61

0.65 (0.46 to 0.92)

Niu 2006

24

51

36

51

0.67 (0.47 to 0.94)

PITAGORA 2008

42

70

24

31

0.78 (0.59 to 1.01)

SAFE‐T 2005

133

267

183

261

0.71 (0.62 to 0.82)

Vijayalakshmi 2006

3

11

10

17

0.46 (0.16 to 1.32)

Dronedarone vs propafenone

Chun 2014

36

50

37

50

0.97 (0.77 to 1.24)

Sotalol vs class I drugs other than quinidine

AFFIRM Substudy 2003

67

88

81

95

0.89 (0.77 to 1.03)

Carunchio 1995

8

20

6

20

1.33 (0.57 to 3.14)

Kochiadakis 2004b

43

85

35

86

1.24 (0.89 to 1.73)

Reimold 1993

32

50

35

50

0.91 (0.69 to 1.20)

Sotalol vs dofetilide

EMERALD 2000

74

108

196

321

1.12 (0.96 to 1.31)

Sotalol vs beta‐blockers

DAPHNE 2008

57

69

54

66

1.01 (0.86 to 1.18)

Plewan 2001

31

64

29

64

1.07 (0.74 to 1.55)

CI: confidence interval; RR: risk ratio.

Figuras y tablas -
Table 5. Head‐to‐head trials: recurrence of atrial fibrillation
Comparison 1. Quinidine versus placebo or no treatment

Outcome or subgroup title

No. of studies

No. of participants

Statistical method

Effect size

1 All‐cause mortality – main analysis Show forest plot

6

1646

Risk Ratio (M‐H, Fixed, 95% CI)

2.01 [0.84, 4.77]

2 All‐cause mortality – sensitivity analysis intention to treat (ITT) worse case: missing participants counted as events Show forest plot

6

1646

Risk Ratio (M‐H, Fixed, 95% CI)

2.12 [0.96, 4.67]

3 All‐cause mortality – subgroup analysis: older and recent studies Show forest plot

6

1646

Risk Ratio (M‐H, Fixed, 95% CI)

2.01 [0.84, 4.77]

3.1 Older studies, higher dose

4

412

Risk Ratio (M‐H, Fixed, 95% CI)

2.74 [0.85, 8.83]

3.2 More recent studies, lower dose

2

1234

Risk Ratio (M‐H, Fixed, 95% CI)

1.29 [0.34, 4.92]

4 All‐cause mortality – sensitivity analysis: persistent atrial fibrillation Show forest plot

5

865

Risk Ratio (M‐H, Fixed, 95% CI)

1.82 [0.73, 4.53]

5 All‐cause mortality – sensitivity analysis: low risk of bias studies Show forest plot

2

1234

Risk Ratio (M‐H, Fixed, 95% CI)

1.29 [0.34, 4.92]

6 All‐cause mortality – sensitivity analysis: studies > 200 participants Show forest plot

2

1234

Risk Ratio (M‐H, Fixed, 95% CI)

1.29 [0.34, 4.92]

7 Withdrawals due to adverse effects – main analysis Show forest plot

7

1669

Risk Ratio (M‐H, Random, 95% CI)

1.56 [0.87, 2.78]

8 Withdrawals due to adverse effects – subgroup analysis: older and recent studies Show forest plot

7

1669

Risk Ratio (M‐H, Random, 95% CI)

1.56 [0.87, 2.78]

8.1 Older studies, higher dose

5

435

Risk Ratio (M‐H, Random, 95% CI)

3.05 [1.29, 7.22]

8.2 More recent studies, lower dose

2

1234

Risk Ratio (M‐H, Random, 95% CI)

0.88 [0.61, 1.27]

9 Withdrawals due to adverse effects – sensitivity analysis: persistent atrial fibrillation Show forest plot

5

877

Risk Ratio (M‐H, Random, 95% CI)

2.19 [0.99, 4.87]

10 Withdrawals due to adverse effects – sensitivity analysis: low risk of bias studies Show forest plot

2

1234

Risk Ratio (M‐H, Fixed, 95% CI)

0.85 [0.66, 1.08]

11 Withdrawals due to adverse effects – sensitivity analysis: studies > 200 participants Show forest plot

2

1234

Risk Ratio (M‐H, Fixed, 95% CI)

0.86 [0.67, 1.09]

12 Proarrhythmia – main analysis Show forest plot

7

1676

Risk Ratio (M‐H, Fixed, 95% CI)

2.05 [0.95, 4.41]

13 Proarrhythmia – subgroup analysis: older and recent studies Show forest plot

7

1677

Risk Ratio (M‐H, Fixed, 95% CI)

2.05 [0.96, 4.42]

13.1 Older studies, higher dose

5

442

Risk Ratio (M‐H, Fixed, 95% CI)

3.14 [0.87, 11.32]

13.2 More recent studies, lower dose

2

1235

Risk Ratio (M‐H, Fixed, 95% CI)

1.60 [0.61, 4.24]

14 Proarrhythmia – sensitivity analysis: persistent atrial fibrillation Show forest plot

5

877

Risk Ratio (M‐H, Fixed, 95% CI)

2.64 [0.93, 7.53]

15 Proarrhythmia – sensitivity analysis: low risk of bias studies Show forest plot

2

1235

Risk Ratio (M‐H, Fixed, 95% CI)

1.60 [0.61, 4.24]

16 Proarrhythmia – sensitivity analysis: studies > 200 participants Show forest plot

2

1235

Risk Ratio (M‐H, Fixed, 95% CI)

1.60 [0.61, 4.24]

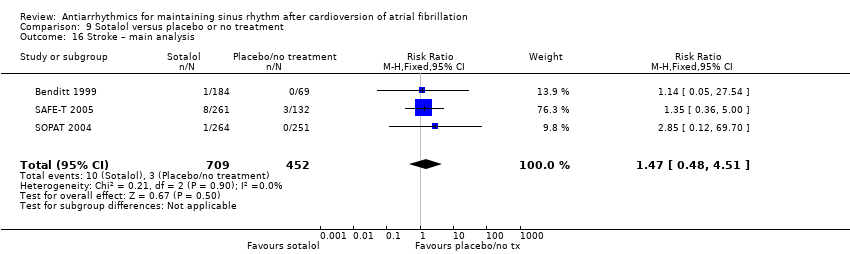
17 Stroke – main analysis Show forest plot

4

1107

Risk Ratio (M‐H, Fixed, 95% CI)

0.97 [0.25, 3.83]

18 Stroke – sensitivity analysis: persistent atrial fibrillation Show forest plot

3

338

Risk Ratio (M‐H, Fixed, 95% CI)

0.88 [0.19, 4.01]

19 Stroke – sensitivity analysis: low risk of bias studies Show forest plot

1

Risk Ratio (M‐H, Fixed, 95% CI)

Subtotals only

20 Stroke – sensitivity analysis: studies > 200 participants Show forest plot

1

Risk Ratio (M‐H, Fixed, 95% CI)

Subtotals only

21 Atrial fibrillation recurrence – main analysis Show forest plot

7

1624

Risk Ratio (M‐H, Fixed, 95% CI)

0.83 [0.78, 0.88]

22 Atrial fibrillation recurrence – sensitivity analysis: persistent atrial fibrillation Show forest plot

5

825

Risk Ratio (M‐H, Fixed, 95% CI)

0.77 [0.70, 0.85]

23 Atrial fibrillation recurrence – sensitivity analysis: low risk of bias studies Show forest plot

2

1234

Risk Ratio (M‐H, Fixed, 95% CI)

0.85 [0.80, 0.91]

24 Atrial fibrillation recurrence – sensitivity analysis: studies > 200 participants Show forest plot

2

1234

Risk Ratio (M‐H, Fixed, 95% CI)

0.86 [0.80, 0.92]

Figuras y tablas -
Comparison 1. Quinidine versus placebo or no treatment
Comparison 2. Disopyramide versus placebo or no treatment

Outcome or subgroup title

No. of studies

No. of participants

Statistical method

Effect size

1 All‐cause mortality – main analysis Show forest plot

1

92

Risk Ratio (M‐H, Fixed, 95% CI)

5.0 [0.25, 101.37]

2 All‐cause mortality – intention to treat (ITT) worse case: missing participants counted as events Show forest plot

2

146

Risk Ratio (M‐H, Fixed, 95% CI)

5.55 [0.68, 45.09]

3 Withdrawals due to adverse effects – main analysis Show forest plot

2

146

Risk Ratio (M‐H, Fixed, 95% CI)

3.68 [0.95, 14.24]

4 Withdrawals due to adverse effects – sensitivity analysis: persistent atrial fibrillation Show forest plot

2

146

Risk Ratio (M‐H, Fixed, 95% CI)

3.68 [0.95, 14.24]

5 Stroke – main analysis Show forest plot

2

146

Risk Ratio (M‐H, Fixed, 95% CI)

0.31 [0.03, 2.91]

6 Stroke – subgroup analysis: persistent atrial fibrillation Show forest plot

2

146

Risk Ratio (M‐H, Fixed, 95% CI)

0.31 [0.03, 2.91]

7 Atrial fibrillation recurrence – main analysis Show forest plot

2

146

Risk Ratio (M‐H, Fixed, 95% CI)

0.77 [0.59, 1.01]

8 Atrial fibrillation recurrence – sensitivity analysis: persistent atrial fibrillation Show forest plot

2

146

Risk Ratio (M‐H, Fixed, 95% CI)

0.77 [0.59, 1.01]

Figuras y tablas -
Comparison 2. Disopyramide versus placebo or no treatment
Comparison 3. Propafenone versus placebo or no treatment

Outcome or subgroup title

No. of studies

No. of participants

Statistical method

Effect size

1 All‐cause mortality – main analysis Show forest plot

2

212

Risk Ratio (M‐H, Fixed, 95% CI)

0.19 [0.02, 1.68]

2 All‐cause mortality – intention to treat (ITT) worse case: missing participants counted as events Show forest plot

3

406

Risk Ratio (M‐H, Fixed, 95% CI)

1.28 [0.45, 3.62]

3 All‐cause mortality – sensitivity analysis: low risk of bias studies Show forest plot

1

102

Risk Ratio (M‐H, Fixed, 95% CI)

0.11 [0.00, 2.64]

4 Withdrawals due to adverse effects – main analysis Show forest plot

5

1098

Risk Ratio (M‐H, Fixed, 95% CI)

1.62 [1.07, 2.46]

5 Withdrawals due to adverse effects – sensitivity analysis: studies > 200 participants Show forest plot

1

523

Risk Ratio (M‐H, Fixed, 95% CI)

1.29 [0.79, 2.11]

6 Proarrhythmia – main analysis Show forest plot

3

381

Risk Ratio (M‐H, Fixed, 95% CI)

1.32 [0.39, 4.47]

7 Proarrhythmia – sensitivity analysis: low risk of bias studies Show forest plot

1

102

Risk Ratio (M‐H, Fixed, 95% CI)

0.49 [0.09, 2.75]

8 Atrial fibrillation recurrence – main analysis Show forest plot

5

1098

Risk Ratio (M‐H, Fixed, 95% CI)

0.67 [0.61, 0.74]

9 Atrial fibrillation recurrence – sensitivity analysis: low risk of bias studies Show forest plot

1

102

Risk Ratio (M‐H, Fixed, 95% CI)

0.71 [0.50, 1.01]

10 Atrial fibrillation recurrence – sensitivity analysis: studies > 200 participants Show forest plot

1

523

Risk Ratio (M‐H, Fixed, 95% CI)

0.71 [0.63, 0.79]

Figuras y tablas -
Comparison 3. Propafenone versus placebo or no treatment
Comparison 4. Flecainide versus placebo or no treatment

Outcome or subgroup title

No. of studies

No. of participants

Statistical method

Effect size

1 Withdrawals due to adverse effects – main analysis Show forest plot

1

73

Risk Ratio (M‐H, Fixed, 95% CI)

15.41 [0.91, 260.19]

2 Proarrhythmia – main analysis Show forest plot

4

511

Risk Ratio (M‐H, Fixed, 95% CI)

4.80 [1.30, 17.77]

3 Proarrhythmia – sensitivity analysis: persistent atrial fibrillation Show forest plot

2

435

Risk Ratio (M‐H, Fixed, 95% CI)

6.35 [0.91, 44.22]

4 Proarrhythmia – sensitivity analysis: low risk of bias studies Show forest plot

2

435

Risk Ratio (M‐H, Fixed, 95% CI)

6.35 [0.91, 44.22]

5 Proarrhythmia – sensitivity analysis: studies > 200 participants Show forest plot

1

Risk Ratio (M‐H, Fixed, 95% CI)

Subtotals only

6 Stroke – main analysis Show forest plot

1

362

Risk Ratio (M‐H, Fixed, 95% CI)

2.04 [0.11, 39.00]

7 Stroke – subgroup analysis: persistent atrial fibrillation Show forest plot

1

Risk Ratio (M‐H, Fixed, 95% CI)

Subtotals only

8 Stroke – sensitivity analysis: low risk of bias studies Show forest plot

1

Risk Ratio (M‐H, Fixed, 95% CI)

Subtotals only

9 Stroke – sensitivity analysis: studies > 200 participants Show forest plot

1

Risk Ratio (M‐H, Fixed, 95% CI)

Subtotals only

10 Atrial fibrillation recurrence – main analysis Show forest plot

4

511

Risk Ratio (M‐H, Fixed, 95% CI)

0.65 [0.55, 0.77]

11 Atrial fibrillation recurrence – sensitivity analysis: persistent atrial fibrillation Show forest plot

2

435

Risk Ratio (M‐H, Fixed, 95% CI)

0.71 [0.60, 0.85]

12 Atrial fibrillation recurrence – sensitivity analysis: low risk of bias studies Show forest plot

2

435

Risk Ratio (M‐H, Fixed, 95% CI)

0.71 [0.60, 0.85]

13 Atrial fibrillation recurrence – sensitivity analysis: studies > 200 participants Show forest plot

1

Risk Ratio (M‐H, Fixed, 95% CI)

Subtotals only

Figuras y tablas -
Comparison 4. Flecainide versus placebo or no treatment
Comparison 5. Metoprolol versus placebo or no treatment

Outcome or subgroup title

No. of studies

No. of participants

Statistical method

Effect size

1 All‐cause mortality – main analysis Show forest plot

2

562

Risk Ratio (M‐H, Fixed, 95% CI)

2.02 [0.37, 11.05]

2 All‐cause mortality – intention to treat (ITT) worse case: missing participants counted as events Show forest plot

2

562

Risk Ratio (M‐H, Fixed, 95% CI)

0.77 [0.41, 1.43]

3 All‐cause mortality – sensitivity analysis: persistent atrial fibrillation Show forest plot

2

562

Risk Ratio (M‐H, Fixed, 95% CI)

2.02 [0.37, 11.05]

4 All‐cause mortality – sensitivity analysis: low risk of bias studies Show forest plot

2

562

Risk Ratio (M‐H, Fixed, 95% CI)

2.02 [0.37, 11.05]

5 All‐cause mortality – sensitivity analysis: studies > 200 participants Show forest plot

1

394

Risk Ratio (M‐H, Fixed, 95% CI)

7.0 [0.36, 134.63]

6 Withdrawals due to adverse effects – main analysis Show forest plot

2

562

Risk Ratio (M‐H, Fixed, 95% CI)

3.47 [1.48, 8.15]

7 Withdrawals due to adverse effects – sensitivity analysis: persistent atrial fibrillation Show forest plot

2

562

Risk Ratio (M‐H, Fixed, 95% CI)

3.47 [1.48, 8.15]

8 Withdrawals due to adverse effects – sensitivity analysis: low risk of bias studies Show forest plot

2

562

Risk Ratio (M‐H, Fixed, 95% CI)

3.47 [1.48, 8.15]

9 Withdrawals due to adverse effects – sensitivity analysis: studies > 200 participants Show forest plot

1

394

Risk Ratio (M‐H, Fixed, 95% CI)

3.33 [1.37, 8.12]

10 Proarrhythmia – main analysis Show forest plot

2

562

Risk Ratio (M‐H, Fixed, 95% CI)

18.14 [2.42, 135.66]

11 Proarrhythmia – sensitivity analysis: persistent atrial fibrillation Show forest plot

2

562

Risk Ratio (M‐H, Fixed, 95% CI)

18.14 [2.42, 135.66]

12 Proarrhythmia – sensitivity analysis: low risk of bias studies Show forest plot

2

562

Risk Ratio (M‐H, Fixed, 95% CI)

18.14 [2.42, 135.66]

13 Proarrhythmia – sensitivity analysis: studies > 200 participants Show forest plot

1

Risk Ratio (M‐H, Fixed, 95% CI)

Subtotals only

14 Atrial fibrillation recurrence – main analysis Show forest plot

2

562

Risk Ratio (M‐H, Random, 95% CI)

0.83 [0.68, 1.02]

15 Atrial fibrillation recurrence – sensitivity analysis: persistent atrial fibrillation Show forest plot

2

562

Risk Ratio (M‐H, Random, 95% CI)

0.83 [0.68, 1.02]

16 Atrial fibrillation recurrence – sensitivity analysis: low risk of bias studies Show forest plot

2

562

Risk Ratio (M‐H, Random, 95% CI)

0.83 [0.68, 1.02]

17 Atrial fibrillation recurrence – sensitivity analysis: studies > 200 participants Show forest plot

1

Risk Ratio (M‐H, Fixed, 95% CI)

Subtotals only

Figuras y tablas -
Comparison 5. Metoprolol versus placebo or no treatment
Comparison 6. Amiodarone versus placebo or no treatment

Outcome or subgroup title

No. of studies

No. of participants

Statistical method

Effect size

1 All‐cause mortality – main analysis Show forest plot

2

444

Risk Ratio (M‐H, Fixed, 95% CI)

1.66 [0.55, 4.99]

2 All‐cause mortality – intention to treat (ITT) worse case: missing participants counted as events Show forest plot

2

444

Risk Ratio (M‐H, Fixed, 95% CI)

1.35 [0.64, 2.82]

3 All‐cause mortality – sensitivity analysis: persistent atrial fibrillation Show forest plot

2

444

Risk Ratio (M‐H, Fixed, 95% CI)

1.66 [0.55, 4.99]

4 Withdrawals due to adverse effects – main analysis Show forest plot

4

319

Risk Ratio (M‐H, Fixed, 95% CI)

6.70 [1.91, 23.45]

5 Withdrawals due to adverse effects – sensitivity analysis: low risk of bias studies Show forest plot

1

99

Risk Ratio (M‐H, Fixed, 95% CI)

4.98 [0.65, 38.29]

6 Proarrhythmia – main analysis Show forest plot

4

673

Risk Ratio (M‐H, Fixed, 95% CI)

2.22 [0.71, 6.96]

7 Proarrhythmia – sensitivity analysis: persistent atrial fibrillation Show forest plot

2

498

Risk Ratio (M‐H, Fixed, 95% CI)

2.03 [0.52, 7.96]

8 Proarrhythmia – sensitivity analysis: low risk of bias studies Show forest plot

1

Risk Ratio (M‐H, Fixed, 95% CI)

Subtotals only

9 Proarrhythmia – sensitivity analysis: studies > 200 participants Show forest plot

1

Risk Ratio (M‐H, Fixed, 95% CI)

Subtotals only

10 Stroke – main analysis Show forest plot

1

399

Risk Ratio (M‐H, Fixed, 95% CI)

1.15 [0.30, 4.39]

11 Stroke – sensitivity analysis: persistent atrial fibrillation Show forest plot

1

Risk Ratio (M‐H, Fixed, 95% CI)

Subtotals only

12 Stroke – sensitivity analysis: studies > 200 participants Show forest plot

1

Risk Ratio (M‐H, Fixed, 95% CI)

Subtotals only

13 Atrial fibrillation recurrence – main analysis Show forest plot

6

812

Risk Ratio (M‐H, Fixed, 95% CI)

0.52 [0.46, 0.58]

14 Atrial fibrillation recurrence – sensitivity analysis: persistent atrial fibrillation Show forest plot

5

687

Risk Ratio (M‐H, Fixed, 95% CI)

0.52 [0.46, 0.58]

15 Atrial fibrillation recurrence – sensitivity analysis: low risk of bias studies Show forest plot

2

498

Risk Ratio (M‐H, Fixed, 95% CI)

0.57 [0.50, 0.64]

16 Atrial fibrillation recurrence – sensitivity analysis: studies > 200 participants Show forest plot

1

Risk Ratio (M‐H, Fixed, 95% CI)

Subtotals only

Figuras y tablas -
Comparison 6. Amiodarone versus placebo or no treatment
Comparison 7. Dofetilide versus placebo or no treatment

Outcome or subgroup title

No. of studies

No. of participants

Statistical method

Effect size

1 All‐cause mortality – main analysis Show forest plot

3

1183

Risk Ratio (M‐H, Fixed, 95% CI)

0.98 [0.76, 1.27]

2 All‐cause mortality – intention to treat (ITT) worse case: missing participants counted as events Show forest plot

3

1183

Risk Ratio (M‐H, Fixed, 95% CI)

1.02 [0.79, 1.31]

3 All‐cause mortality – sensitivity analysis: persistent atrial fibrillation Show forest plot

3

1183

Risk Ratio (M‐H, Fixed, 95% CI)

0.98 [0.76, 1.27]

4 All‐cause mortality – sensitivity analysis: low risk of bias studies Show forest plot

1

506

Risk Ratio (M‐H, Fixed, 95% CI)

0.99 [0.77, 1.29]

5 All‐cause mortality – sensitivity analysis: studies > 200 participants Show forest plot

3

1183

Risk Ratio (M‐H, Fixed, 95% CI)

0.98 [0.76, 1.27]

6 Withdrawals due to adverse effects – main analysis Show forest plot

2

677

Risk Ratio (M‐H, Fixed, 95% CI)

1.77 [0.75, 4.18]

7 Withdrawals due to adverse effects – sensitivity analysis: persistent atrial fibrillation Show forest plot

2

677

Risk Ratio (M‐H, Fixed, 95% CI)

1.77 [0.75, 4.18]

8 Withdrawals due to adverse effects – sensitivity analysis: studies > 200 participants Show forest plot

2

677

Risk Ratio (M‐H, Fixed, 95% CI)

1.77 [0.75, 4.18]

9 Proarrhythmia – main analysis Show forest plot

3

1183

Risk Ratio (M‐H, Fixed, 95% CI)

5.50 [1.33, 22.76]

10 Proarrhythmia – sensitivity analysis: persistent atrial fibrillation Show forest plot

3

1183

Risk Ratio (M‐H, Fixed, 95% CI)

5.50 [1.33, 22.76]

11 Proarrhythmia – sensitivity analysis: low risk of bias studies Show forest plot

1

506

Risk Ratio (M‐H, Fixed, 95% CI)

9.29 [0.50, 171.62]

12 Proarrhythmia – sensitivity analysis: studies > 200 participants Show forest plot

3

1183

Risk Ratio (M‐H, Fixed, 95% CI)

5.50 [1.33, 22.76]

13 Atrial fibrillation recurrence – main analysis Show forest plot

3

1183

Risk Ratio (M‐H, Random, 95% CI)

0.72 [0.61, 0.85]

14 Atrial fibrillation recurrence – sensitivity analysis: persistent atrial fibrillation Show forest plot

3

1183

Risk Ratio (M‐H, Random, 95% CI)

0.72 [0.61, 0.85]

15 Atrial fibrillation recurrence – sensitivity analysis: low risk of bias studies Show forest plot

1

506

Risk Ratio (M‐H, Fixed, 95% CI)

0.62 [0.54, 0.70]

16 Atrial fibrillation recurrence – sensitivity analysis: studies > 200 participants Show forest plot

3

1183

Risk Ratio (M‐H, Random, 95% CI)

0.72 [0.61, 0.85]

Figuras y tablas -
Comparison 7. Dofetilide versus placebo or no treatment
Comparison 8. Dronedarone versus placebo or no treatment

Outcome or subgroup title

No. of studies

No. of participants

Statistical method

Effect size

1 All‐cause mortality – main analysis Show forest plot

3

6071

Risk Ratio (M‐H, Fixed, 95% CI)

0.86 [0.68, 1.09]

2 All‐cause mortality – intention to treat (ITT) worse case: missing participants counted as events Show forest plot

3

6071

Risk Ratio (M‐H, Fixed, 95% CI)

0.85 [0.67, 1.07]

3 All‐cause mortality – sensitivity analysis: persistent atrial fibrillation Show forest plot

1

199

Risk Ratio (M‐H, Fixed, 95% CI)

0.97 [0.04, 23.36]

4 All‐cause mortality – sensitivity analysis: low risk of bias studies Show forest plot

1

4628

Risk Ratio (M‐H, Fixed, 95% CI)

0.84 [0.66, 1.07]

5 All‐cause mortality – sensitivity analysis: studies > 200 participants Show forest plot

2

5872

Risk Ratio (M‐H, Fixed, 95% CI)

0.86 [0.68, 1.09]

6 Withdrawals due to adverse effects – main analysis Show forest plot

3

6071

Risk Ratio (M‐H, Fixed, 95% CI)

1.58 [1.34, 1.85]

7 Withdrawals due to adverse effects – sensitivity analysis: persistent atrial fibrillation Show forest plot

1

199

Risk Ratio (M‐H, Fixed, 95% CI)

14.51 [0.90, 234.74]

8 Withdrawals due to adverse effects – sensitivity analysis: low risk of bias studies Show forest plot

1

4628

Risk Ratio (M‐H, Fixed, 95% CI)

1.57 [1.32, 1.87]

9 Withdrawals due to adverse effects – sensitivity analysis: studies > 200 participants Show forest plot

2

5872

Risk Ratio (M‐H, Fixed, 95% CI)

1.53 [1.31, 1.80]

10 Proarrhythmia – main analysis Show forest plot

2

5872

Risk Ratio (M‐H, Random, 95% CI)

1.95 [0.77, 4.98]

11 Proarrhythmia – sensitivity analysis: low risk of bias studies Show forest plot

1

Risk Ratio (M‐H, Fixed, 95% CI)

Subtotals only

12 Proarrhythmia – sensitivity analysis: studies > 200 participants Show forest plot

1

Risk Ratio (M‐H, Fixed, 95% CI)

Subtotals only

13 Stroke – main analysis Show forest plot

2

5872

Risk Ratio (M‐H, Fixed, 95% CI)

0.66 [0.47, 0.95]

14 Stroke – sensitivity analysis: studies > 200 participants Show forest plot

2

5872

Risk Ratio (M‐H, Fixed, 95% CI)

0.66 [0.47, 0.95]

15 Atrial fibrillation recurrence – main analysis Show forest plot

2

1443

Risk Ratio (M‐H, Fixed, 95% CI)

0.85 [0.80, 0.91]

16 Atrial fibrillation recurrence – sensitivity analysis: persistent atrial fibrillation Show forest plot

1

Risk Ratio (M‐H, Fixed, 95% CI)

Subtotals only

17 Atrial fibrillation recurrence – sensitivity analysis: studies > 200 participants Show forest plot

1

Risk Ratio (M‐H, Fixed, 95% CI)

Subtotals only

Figuras y tablas -
Comparison 8. Dronedarone versus placebo or no treatment
Comparison 9. Sotalol versus placebo or no treatment

Outcome or subgroup title

No. of studies

No. of participants

Statistical method

Effect size

1 All‐cause mortality – main analysis Show forest plot

5

1882

Risk Ratio (M‐H, Fixed, 95% CI)

2.23 [1.03, 4.81]

2 All‐cause mortality – intention to treat (ITT) worse case: missing participants counted as events Show forest plot

10

2757

Risk Ratio (M‐H, Fixed, 95% CI)

2.02 [1.28, 3.20]

3 All‐cause mortality – sensitivity analysis: persistent atrial fibrillation Show forest plot

3

1311

Risk Ratio (M‐H, Fixed, 95% CI)

2.51 [1.06, 5.98]

4 All‐cause mortality – sensitivity analysis: low risk of bias studies Show forest plot

3

1311

Risk Ratio (M‐H, Fixed, 95% CI)

2.51 [1.06, 5.98]

5 All‐cause mortality – sensitivity analysis: studies > 200 participants Show forest plot

4

1826

Risk Ratio (M‐H, Fixed, 95% CI)

2.65 [1.16, 6.09]

6 Withdrawals due to adverse effects – main analysis Show forest plot

12

2688

Risk Ratio (M‐H, Random, 95% CI)

1.95 [1.23, 3.11]

7 Withdrawals due to adverse effects – sotalol: heterogeneity study Show forest plot

12

2688

Risk Ratio (M‐H, Random, 95% CI)

1.95 [1.23, 3.11]

7.1 PAFAC and SOPAT trials

2

987

Risk Ratio (M‐H, Random, 95% CI)

0.96 [0.74, 1.25]

7.2 Rest of studies

10

1701

Risk Ratio (M‐H, Random, 95% CI)

2.77 [1.81, 4.22]

8 Withdrawals due to adverse effects – sensitivity analysis: persistent atrial fibrillation Show forest plot

6

1350

Risk Ratio (M‐H, Fixed, 95% CI)

1.75 [1.28, 2.41]

9 Withdrawals due to adverse effects – sensitivity analysis: low risk of bias studies Show forest plot

4

1686

Risk Ratio (M‐H, Random, 95% CI)

1.52 [0.82, 2.81]

10 Withdrawals due to adverse effects – sensitivity analysis: studies > 200 participants Show forest plot

5

1900

Risk Ratio (M‐H, Random, 95% CI)

1.81 [0.97, 3.35]

11 Proarrhythmia – main analysis Show forest plot

12

2989

Risk Ratio (M‐H, Fixed, 95% CI)

3.55 [2.16, 5.83]

12 Proarrhythmia – sotalol: heterogeneity study Show forest plot

11

2826

Risk Ratio (M‐H, Fixed, 95% CI)

3.43 [2.07, 5.67]

12.1 PAFAC and SOPAT trials

2

986

Risk Ratio (M‐H, Fixed, 95% CI)

1.49 [0.51, 4.37]

12.2 Rest of studies

9

1840

Risk Ratio (M‐H, Fixed, 95% CI)

4.32 [2.40, 7.76]

13 Proarrhythmia – sensitivity analysis: persistent atrial fibrillation Show forest plot

6

1687

Risk Ratio (M‐H, Fixed, 95% CI)

4.37 [2.25, 8.52]

14 Proarrhythmia – sensitivity analysis: low risk of bias studies Show forest plot

4

1686

Risk Ratio (M‐H, Fixed, 95% CI)

3.05 [1.73, 5.40]

15 Proarrhythmia – sensitivity analysis: studies > 200 participants Show forest plot

6

2293

Risk Ratio (M‐H, Fixed, 95% CI)

3.00 [1.77, 5.06]

16 Stroke – main analysis Show forest plot

3

1161

Risk Ratio (M‐H, Fixed, 95% CI)

1.47 [0.48, 4.51]

17 Stroke – sensitivity analysis: persistent atrial fibrillation Show forest plot

1

393

Risk Ratio (M‐H, Fixed, 95% CI)

1.35 [0.36, 5.00]

18 Stroke – sensitivity analysis: low risk of bias studies Show forest plot

2

768

Risk Ratio (M‐H, Fixed, 95% CI)

1.85 [0.20, 16.71]

19 Stroke – sensitivity analysis: studies > 200 participants Show forest plot

3

1161

Risk Ratio (M‐H, Fixed, 95% CI)

1.47 [0.48, 4.51]

20 Atrial fibrillation recurrence – main analysis Show forest plot

14

3179

Risk Ratio (M‐H, Fixed, 95% CI)

0.83 [0.80, 0.87]

21 Atrial fibrillation recurrence – sensitivity analysis: persistent atrial fibrillation Show forest plot

7

1743

Risk Ratio (M‐H, Fixed, 95% CI)

0.81 [0.77, 0.86]

22 Atrial fibrillation recurrence – sensitivity analysis: low risk of bias studies Show forest plot

4

1686

Risk Ratio (M‐H, Fixed, 95% CI)

0.86 [0.82, 0.91]

23 Atrial fibrillation recurrence – sensitivity analysis: studies > 200 participants Show forest plot

6

2293

Risk Ratio (M‐H, Fixed, 95% CI)

0.85 [0.81, 0.89]

Figuras y tablas -
Comparison 9. Sotalol versus placebo or no treatment