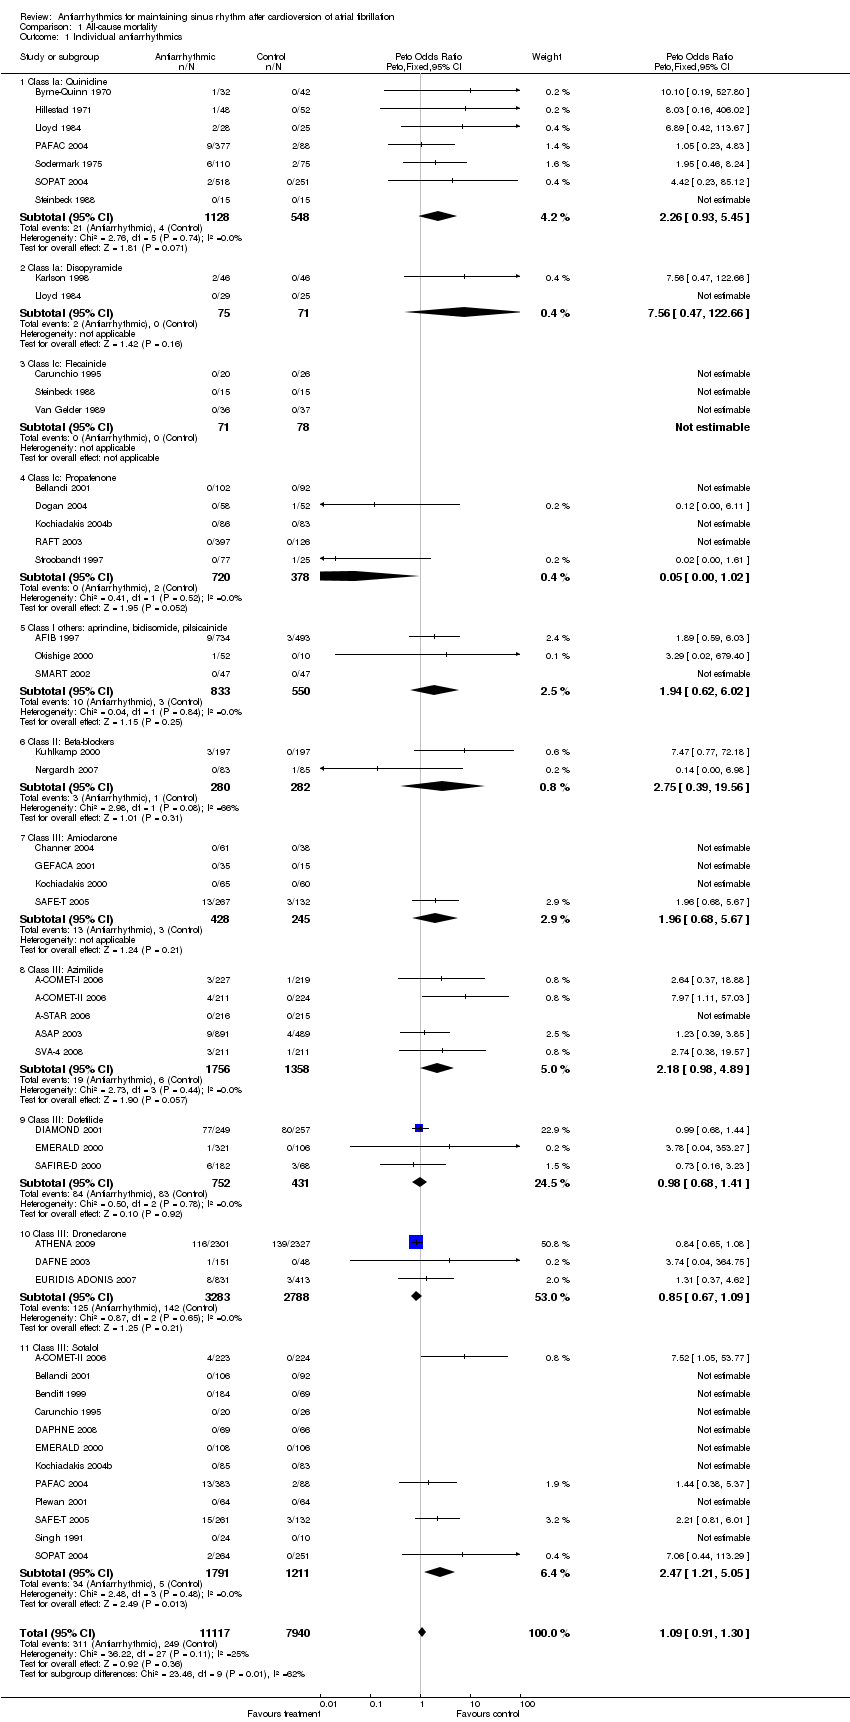
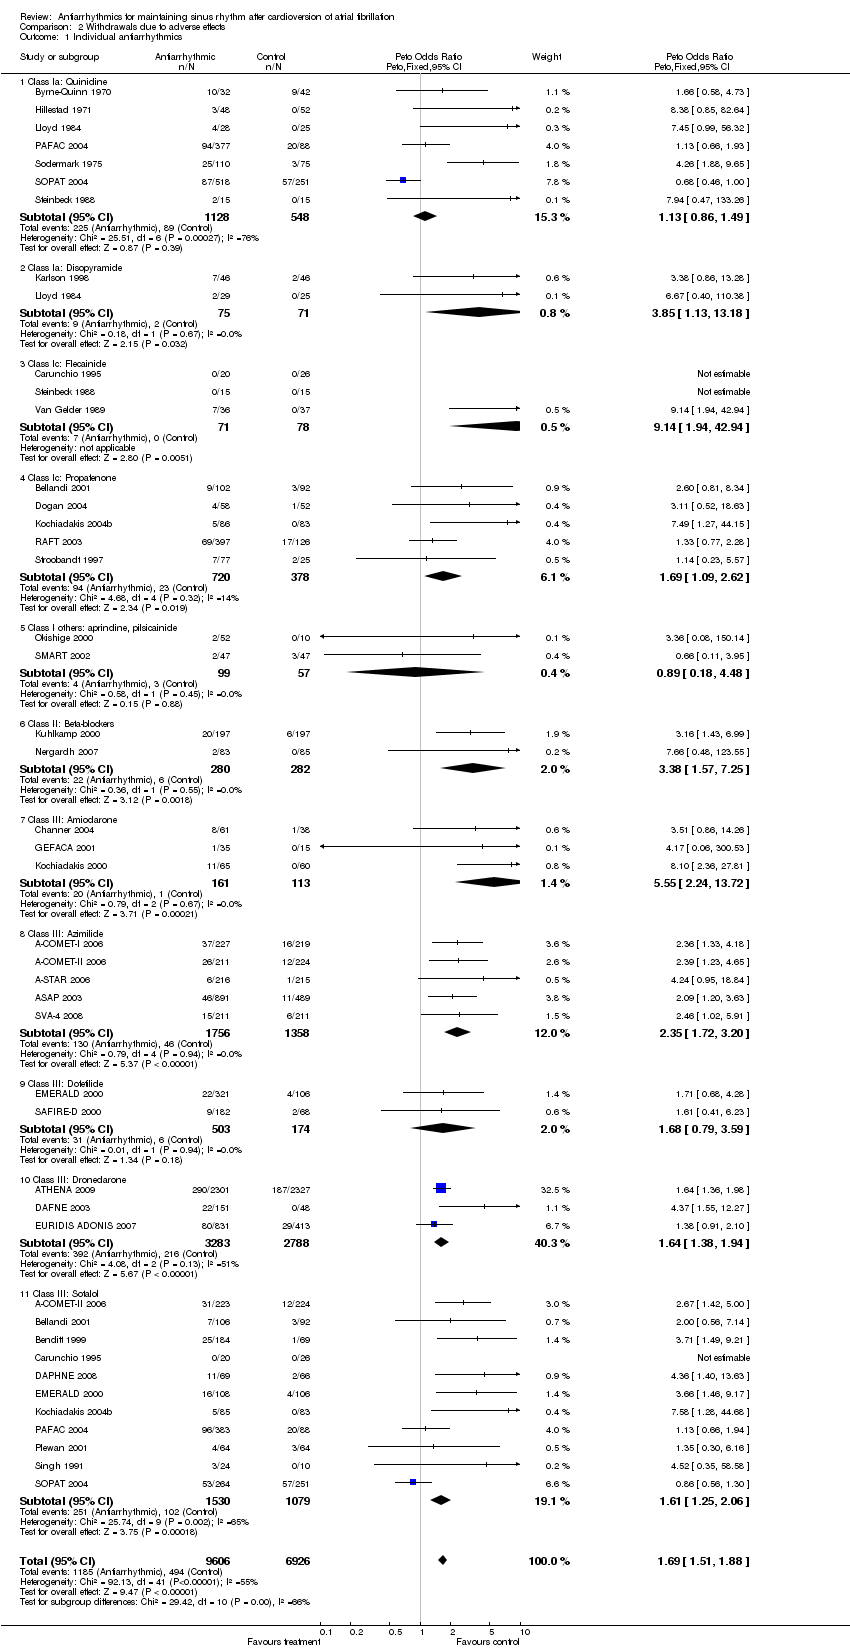
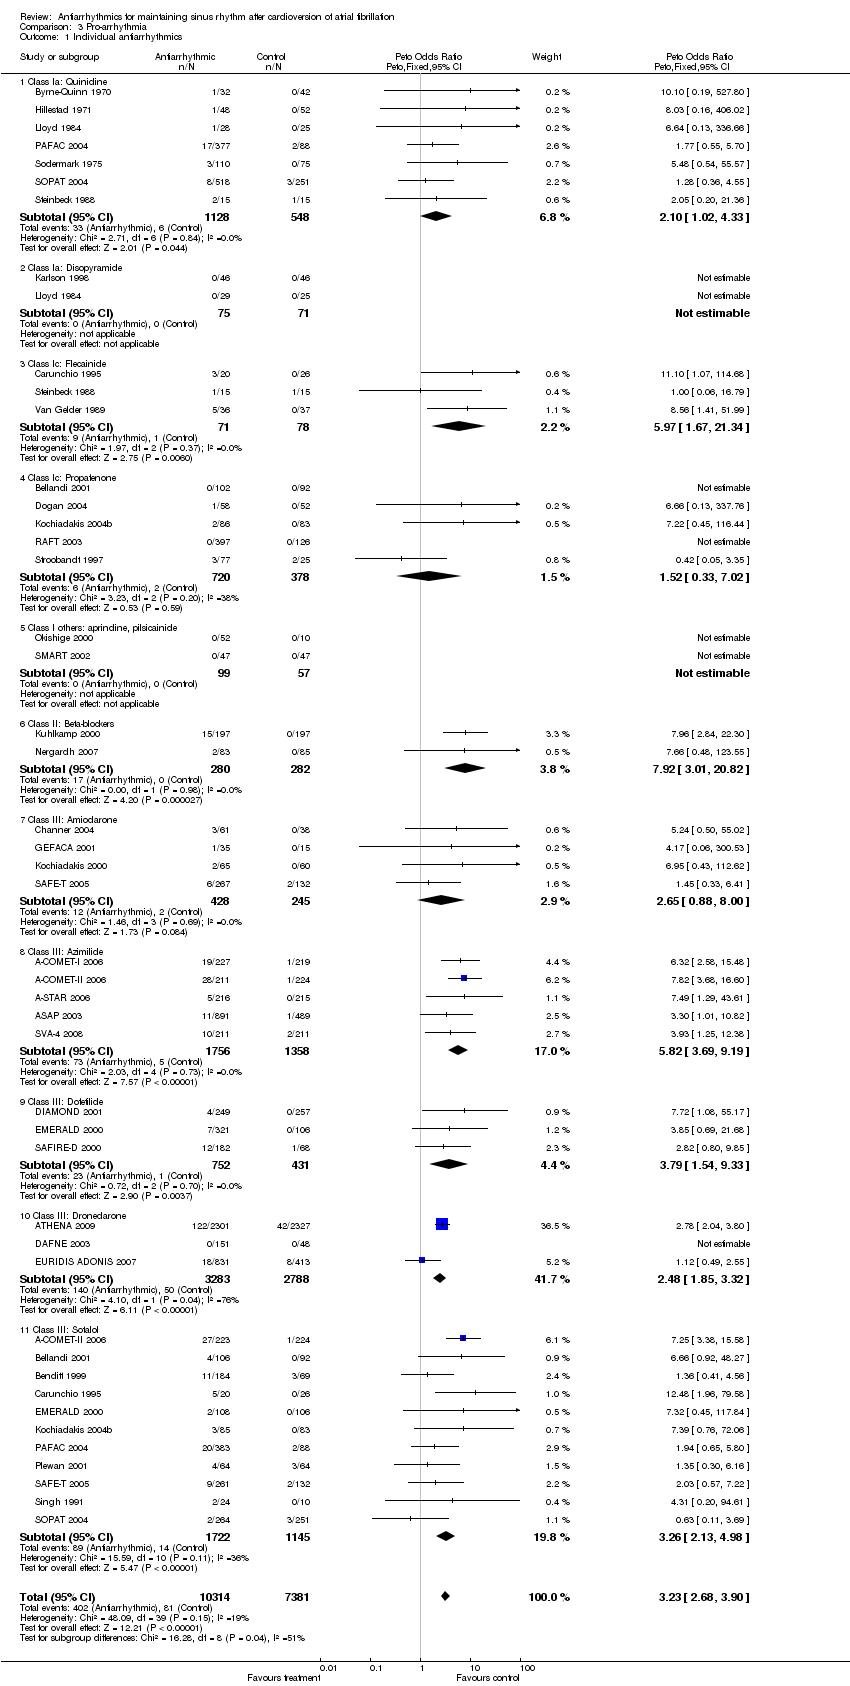
| 1 Individual antiarrhythmics Show forest plot | 39 | 19057 | Peto Odds Ratio (Peto, Fixed, 95% CI) | 1.09 [0.91, 1.30] |
|
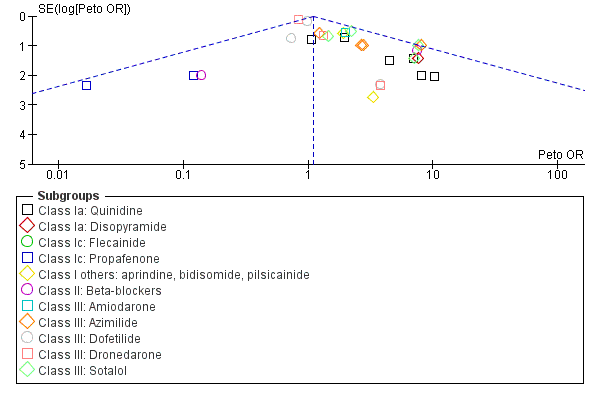
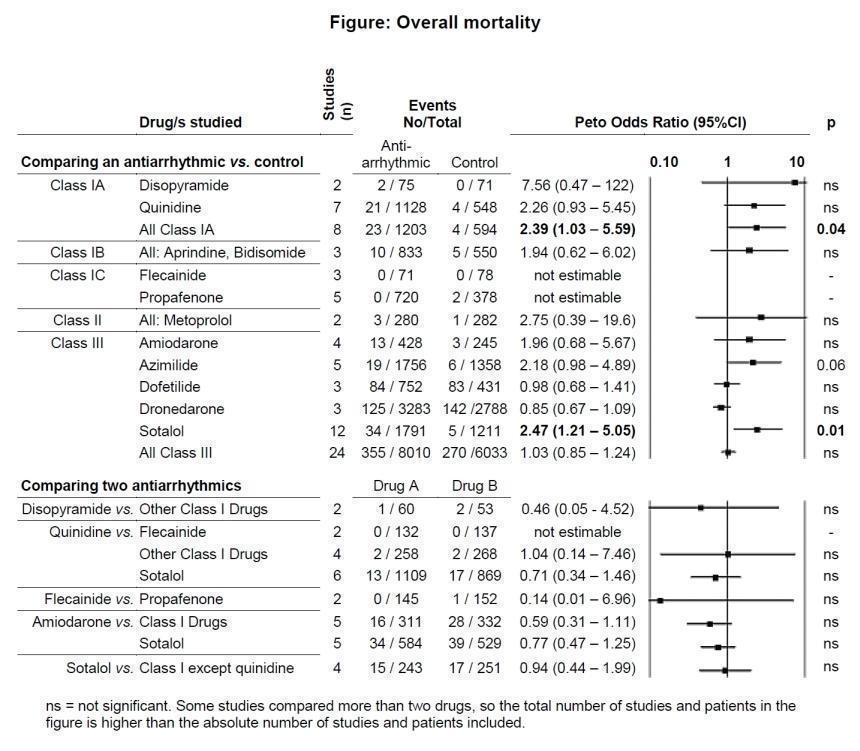
| 1.1 Class Ia: Quinidine | 7 | 1676 | Peto Odds Ratio (Peto, Fixed, 95% CI) | 2.26 [0.93, 5.45] |
| 1.2 Class Ia: Disopyramide | 2 | 146 | Peto Odds Ratio (Peto, Fixed, 95% CI) | 7.56 [0.47, 122.66] |
| 1.3 Class Ic: Flecainide | 3 | 149 | Peto Odds Ratio (Peto, Fixed, 95% CI) | 0.0 [0.0, 0.0] |
| 1.4 Class Ic: Propafenone | 5 | 1098 | Peto Odds Ratio (Peto, Fixed, 95% CI) | 0.05 [0.00, 1.02] |
| 1.5 Class I others: aprindine, bidisomide, pilsicainide | 3 | 1383 | Peto Odds Ratio (Peto, Fixed, 95% CI) | 1.94 [0.62, 6.02] |
| 1.6 Class II: Beta‐blockers | 2 | 562 | Peto Odds Ratio (Peto, Fixed, 95% CI) | 2.75 [0.39, 19.56] |
| 1.7 Class III: Amiodarone | 4 | 673 | Peto Odds Ratio (Peto, Fixed, 95% CI) | 1.96 [0.68, 5.67] |
| 1.8 Class III: Azimilide | 5 | 3114 | Peto Odds Ratio (Peto, Fixed, 95% CI) | 2.18 [0.98, 4.89] |
| 1.9 Class III: Dofetilide | 3 | 1183 | Peto Odds Ratio (Peto, Fixed, 95% CI) | 0.98 [0.68, 1.41] |
| 1.10 Class III: Dronedarone | 3 | 6071 | Peto Odds Ratio (Peto, Fixed, 95% CI) | 0.85 [0.67, 1.09] |
| 1.11 Class III: Sotalol | 12 | 3002 | Peto Odds Ratio (Peto, Fixed, 95% CI) | 2.47 [1.21, 5.05] |
| 2 Individual antiarrhythmics ‐ ITT Worst case: missing patients counted as events Show forest plot | 39 | 19226 | Peto Odds Ratio (Peto, Fixed, 95% CI) | 1.16 [0.99, 1.36] |
|
| 2.1 Class Ia: Quinidine | 7 | 1676 | Peto Odds Ratio (Peto, Fixed, 95% CI) | 2.29 [1.05, 5.01] |
| 2.2 Class Ia: Disopyramide | 2 | 146 | Peto Odds Ratio (Peto, Fixed, 95% CI) | 7.18 [1.21, 42.55] |
| 2.3 Class Ic: Flecainide | 4 | 318 | Peto Odds Ratio (Peto, Fixed, 95% CI) | 0.0 [0.0, 0.0] |
| 2.4 Class Ic: Propafenone | 5 | 1098 | Peto Odds Ratio (Peto, Fixed, 95% CI) | 1.27 [0.48, 3.37] |
| 2.5 Class I others: aprindine, bidisomide, pilsicainide | 3 | 1383 | Peto Odds Ratio (Peto, Fixed, 95% CI) | 1.94 [0.62, 6.02] |
| 2.6 Class II: Beta‐blockers | 2 | 562 | Peto Odds Ratio (Peto, Fixed, 95% CI) | 0.75 [0.39, 1.47] |
| 2.7 Class III: Amiodarone | 4 | 673 | Peto Odds Ratio (Peto, Fixed, 95% CI) | 1.49 [0.69, 3.20] |
| 2.8 Class III: Azimilide | 5 | 3114 | Peto Odds Ratio (Peto, Fixed, 95% CI) | 1.74 [0.99, 3.06] |
| 2.9 Class III: Dofetilide | 3 | 1183 | Peto Odds Ratio (Peto, Fixed, 95% CI) | 1.02 [0.72, 1.45] |
| 2.10 Class III: Dronedarone | 3 | 6071 | Peto Odds Ratio (Peto, Fixed, 95% CI) | 0.84 [0.66, 1.08] |
| 2.11 Class III: Sotalol | 12 | 3002 | Peto Odds Ratio (Peto, Fixed, 95% CI) | 2.14 [1.40, 3.25] |
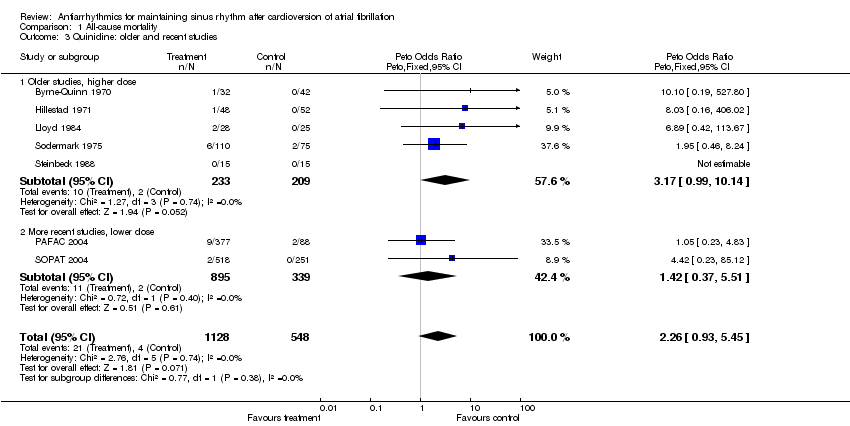
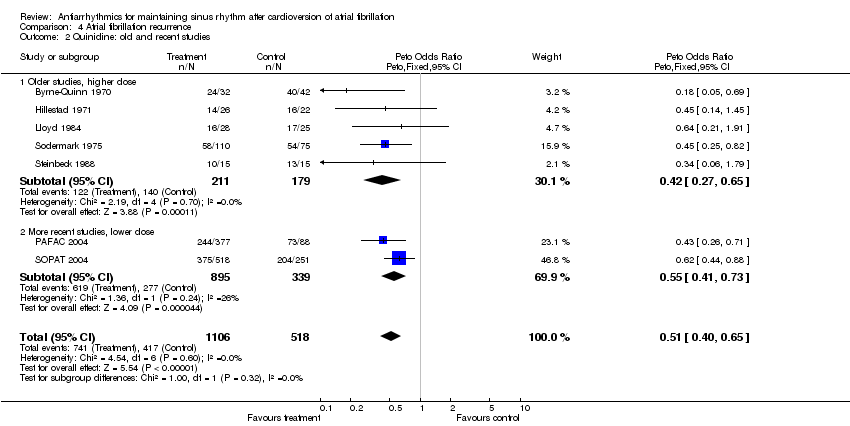
| 3 Quinidine: older and recent studies Show forest plot | 7 | 1676 | Peto Odds Ratio (Peto, Fixed, 95% CI) | 2.26 [0.93, 5.45] |
|
| 3.1 Older studies, higher dose | 5 | 442 | Peto Odds Ratio (Peto, Fixed, 95% CI) | 3.17 [0.99, 10.14] |
| 3.2 More recent studies, lower dose | 2 | 1234 | Peto Odds Ratio (Peto, Fixed, 95% CI) | 1.42 [0.37, 5.51] |
| 4 Quinidine: older and recent studies ‐ ITT Worst case: missing patients counted as events Show forest plot | 7 | 1676 | Peto Odds Ratio (Peto, Fixed, 95% CI) | 2.29 [1.05, 5.01] |
|
| 4.1 Older studies, higher dose | 5 | 442 | Peto Odds Ratio (Peto, Fixed, 95% CI) | 2.91 [1.12, 7.56] |
| 4.2 More recent studies, lower dose | 2 | 1234 | Peto Odds Ratio (Peto, Fixed, 95% CI) | 1.42 [0.37, 5.51] |
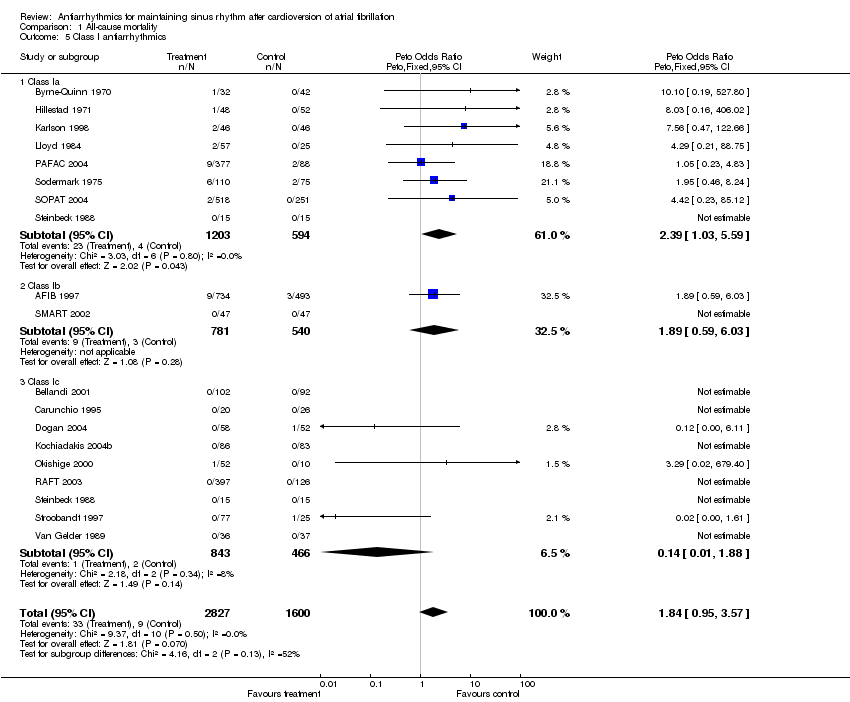
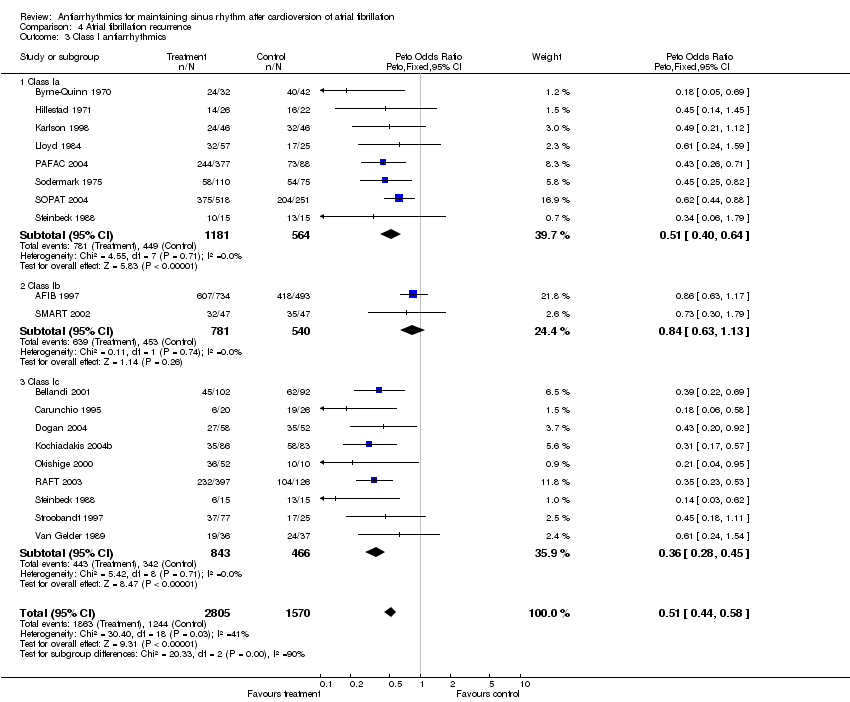
| 5 Class I antiarrhythmics Show forest plot | 18 | 4427 | Peto Odds Ratio (Peto, Fixed, 95% CI) | 1.84 [0.95, 3.57] |
|
| 5.1 Class Ia | 8 | 1797 | Peto Odds Ratio (Peto, Fixed, 95% CI) | 2.39 [1.03, 5.59] |
| 5.2 Class Ib | 2 | 1321 | Peto Odds Ratio (Peto, Fixed, 95% CI) | 1.89 [0.59, 6.03] |
| 5.3 Class Ic | 9 | 1309 | Peto Odds Ratio (Peto, Fixed, 95% CI) | 0.14 [0.01, 1.88] |
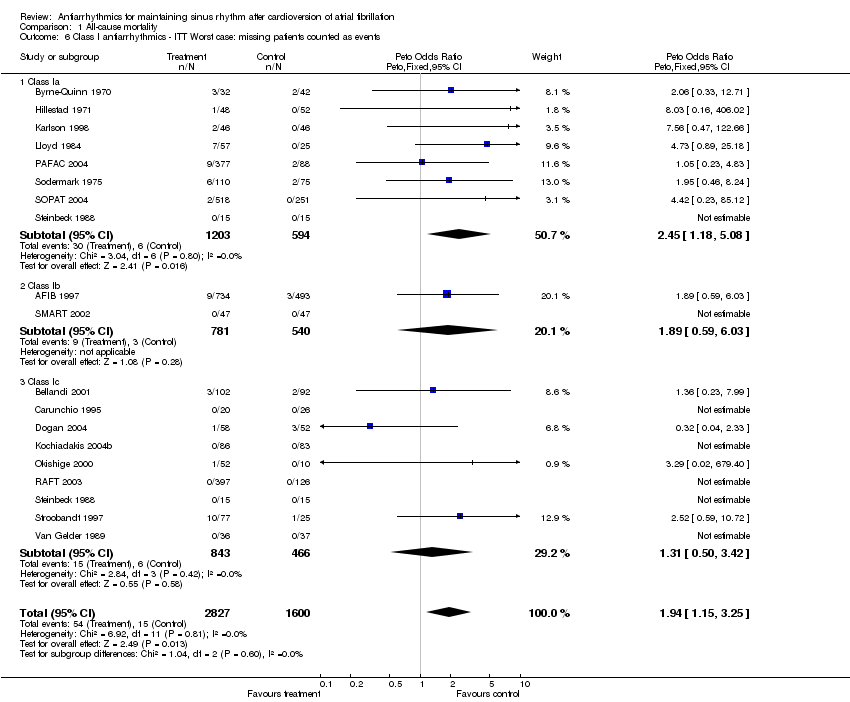
| 6 Class I antiarrhythmics ‐ ITT Worst case: missing patients counted as events Show forest plot | 18 | 4427 | Peto Odds Ratio (Peto, Fixed, 95% CI) | 1.94 [1.15, 3.25] |
|
| 6.1 Class Ia | 8 | 1797 | Peto Odds Ratio (Peto, Fixed, 95% CI) | 2.45 [1.18, 5.08] |
| 6.2 Class Ib | 2 | 1321 | Peto Odds Ratio (Peto, Fixed, 95% CI) | 1.89 [0.59, 6.03] |
| 6.3 Class Ic | 9 | 1309 | Peto Odds Ratio (Peto, Fixed, 95% CI) | 1.31 [0.50, 3.42] |
| 7 Class III antiarrhythmics Show forest plot | 24 | 14043 | Peto Odds Ratio (Peto, Fixed, 95% CI) | 1.03 [0.85, 1.24] |
|
| 7.1 Amiodarone | 4 | 673 | Peto Odds Ratio (Peto, Fixed, 95% CI) | 1.96 [0.68, 5.67] |
| 7.2 Azimilide | 5 | 3114 | Peto Odds Ratio (Peto, Fixed, 95% CI) | 2.18 [0.98, 4.89] |
| 7.3 Dofetilide | 3 | 1183 | Peto Odds Ratio (Peto, Fixed, 95% CI) | 0.98 [0.68, 1.41] |
| 7.4 Dronedarone | 3 | 6071 | Peto Odds Ratio (Peto, Fixed, 95% CI) | 0.85 [0.67, 1.09] |
| 7.5 Sotalol | 12 | 3002 | Peto Odds Ratio (Peto, Fixed, 95% CI) | 2.47 [1.21, 5.05] |
| 8 Class III antiarrhythmics ‐ ITT Worst case: missing patients counted as events Show forest plot | 24 | 14043 | Peto Odds Ratio (Peto, Fixed, 95% CI) | 1.13 [0.95, 1.33] |
|
| 8.1 Amiodarone | 4 | 673 | Peto Odds Ratio (Peto, Fixed, 95% CI) | 1.49 [0.69, 3.20] |
| 8.2 Azimilide | 5 | 3114 | Peto Odds Ratio (Peto, Fixed, 95% CI) | 1.74 [0.99, 3.06] |
| 8.3 Dofetilide | 3 | 1183 | Peto Odds Ratio (Peto, Fixed, 95% CI) | 1.02 [0.72, 1.45] |
| 8.4 Dronedarone | 3 | 6071 | Peto Odds Ratio (Peto, Fixed, 95% CI) | 0.86 [0.67, 1.09] |
| 8.5 Sotalol | 12 | 3002 | Peto Odds Ratio (Peto, Fixed, 95% CI) | 2.27 [1.45, 3.56] |
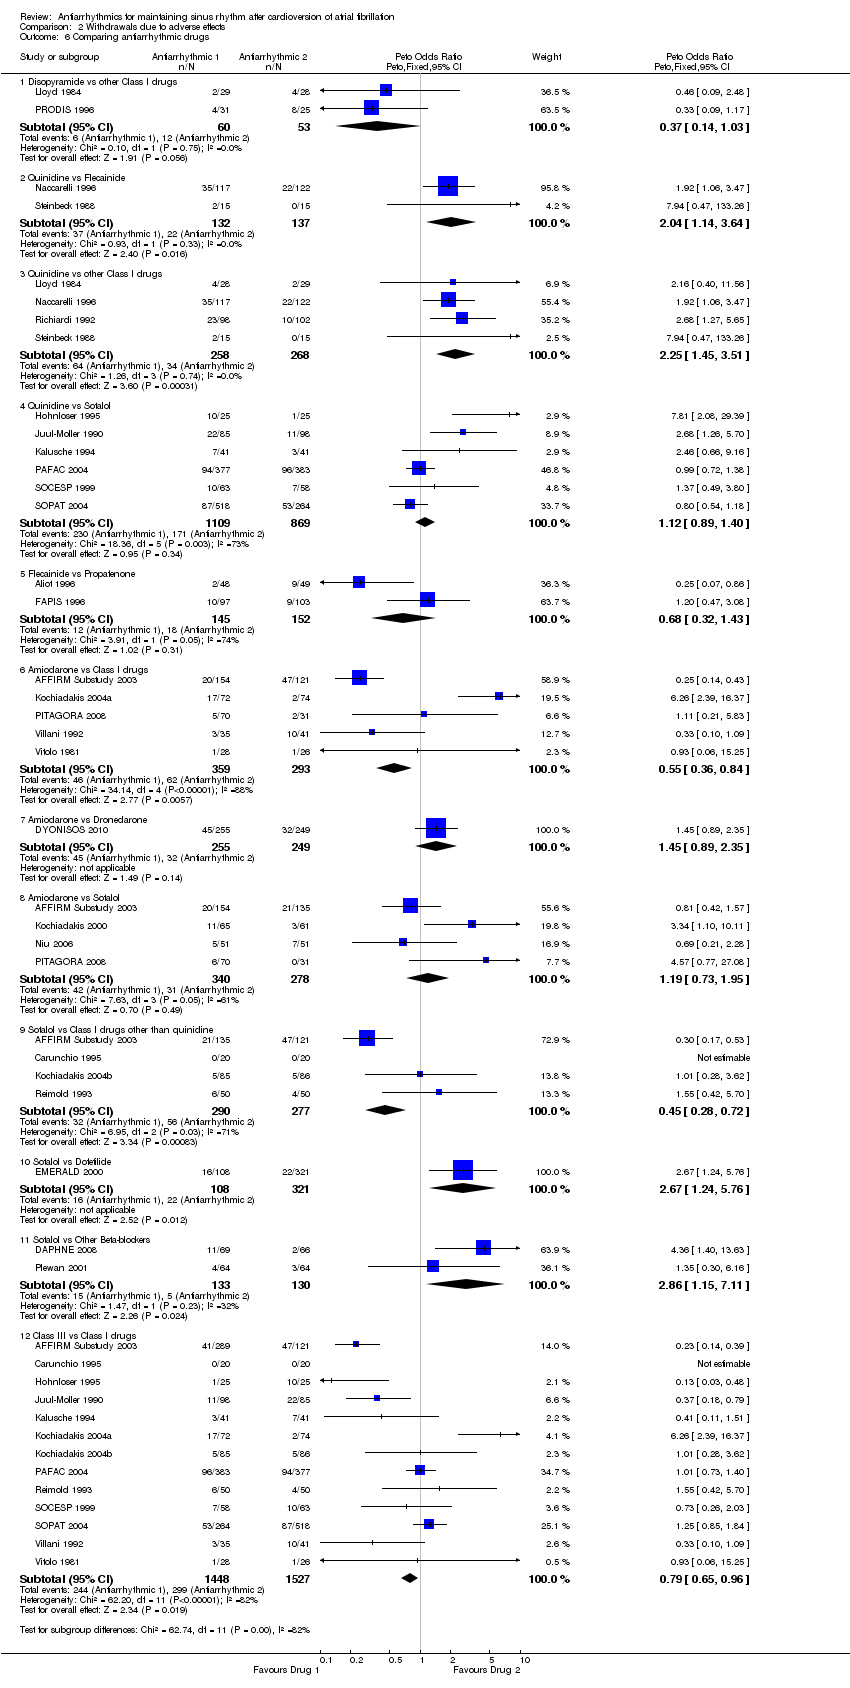
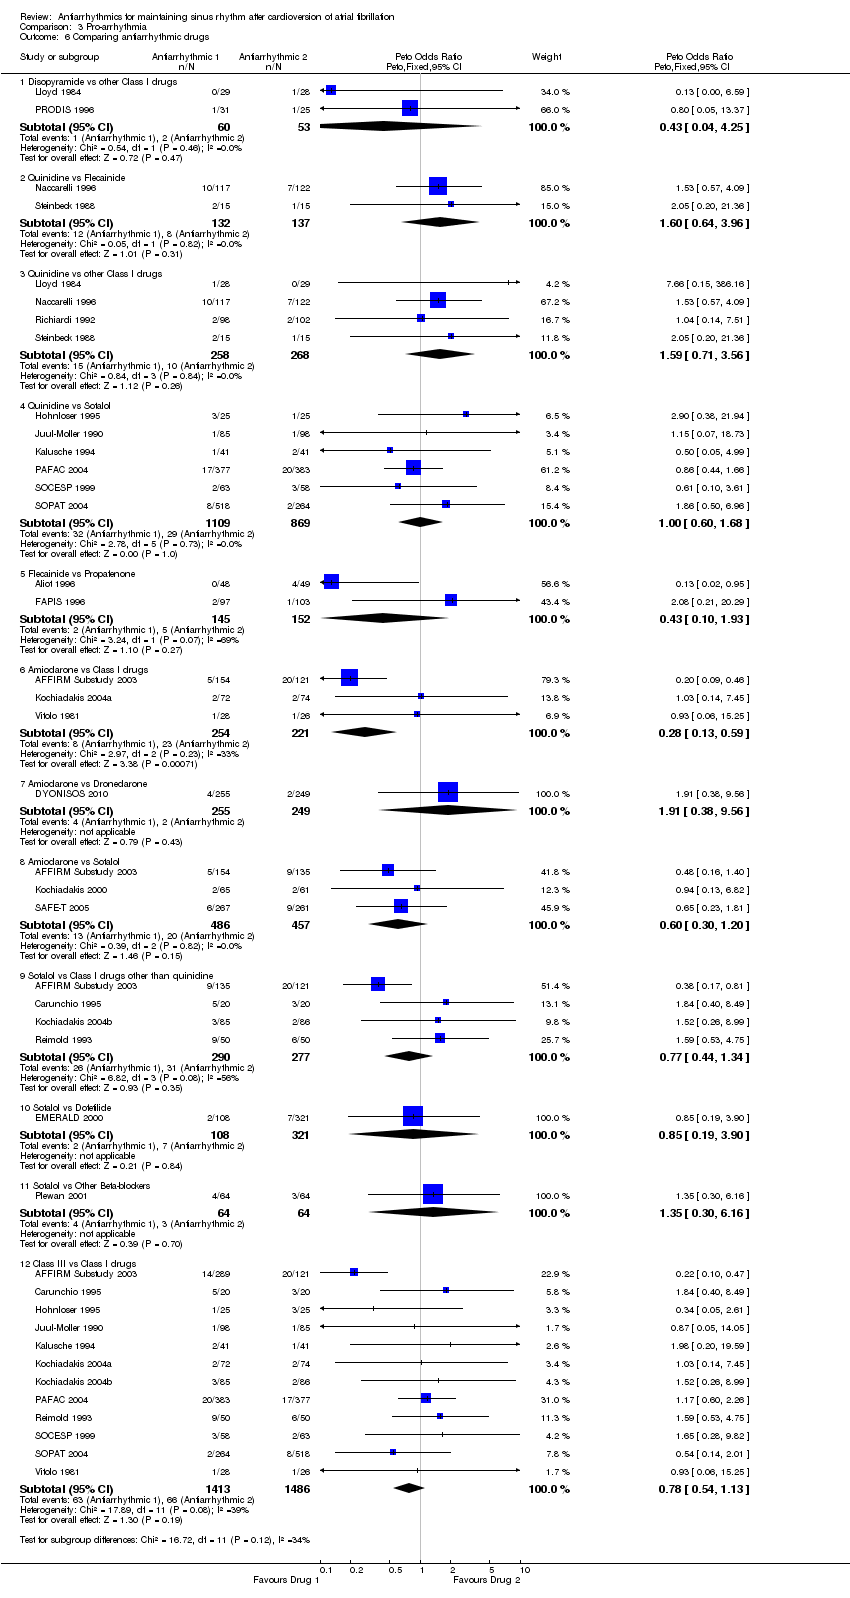
| 9 Comparing antiarrhythmic drugs Show forest plot | 28 | | Peto Odds Ratio (Peto, Fixed, 95% CI) | Subtotals only |
|
| 9.1 Disopyramide vs other Class I drugs | 2 | 113 | Peto Odds Ratio (Peto, Fixed, 95% CI) | 0.46 [0.05, 4.52] |
| 9.2 Quinidine vs Flecainide | 2 | 269 | Peto Odds Ratio (Peto, Fixed, 95% CI) | 0.0 [0.0, 0.0] |
| 9.3 Quinidine vs other Class I drugs | 4 | 526 | Peto Odds Ratio (Peto, Fixed, 95% CI) | 1.04 [0.14, 7.46] |
| 9.4 Quinidine vs Sotalol | 6 | 1978 | Peto Odds Ratio (Peto, Fixed, 95% CI) | 0.71 [0.34, 1.46] |
| 9.5 Flecainide vs Propafenone | 2 | 297 | Peto Odds Ratio (Peto, Fixed, 95% CI) | 0.14 [0.00, 6.96] |
| 9.6 Amiodarone vs Class I drugs | 5 | 643 | Peto Odds Ratio (Peto, Fixed, 95% CI) | 0.59 [0.31, 1.11] |
| 9.7 Amiodarone vs Dronedarone | 1 | 504 | Peto Odds Ratio (Peto, Fixed, 95% CI) | 2.32 [0.52, 10.32] |
| 9.8 Amiodarone vs Sotalol | 5 | 1113 | Peto Odds Ratio (Peto, Fixed, 95% CI) | 0.77 [0.47, 1.25] |
| 9.9 Sotalol vs Class I drugs other than quinidine | 4 | 494 | Peto Odds Ratio (Peto, Fixed, 95% CI) | 0.94 [0.44, 1.99] |
| 9.10 Sotalol vs Dofetilide | 1 | 429 | Peto Odds Ratio (Peto, Fixed, 95% CI) | 0.26 [0.00, 24.03] |
| 9.11 Sotalol vs Other Beta‐blockers | 2 | 263 | Peto Odds Ratio (Peto, Fixed, 95% CI) | 0.0 [0.0, 0.0] |
| 9.12 Class III vs Class I drugs | 13 | 2875 | Peto Odds Ratio (Peto, Fixed, 95% CI) | 0.79 [0.49, 1.26] |
| 10 Subgroup analysis: Persistent atrial fibrillation Show forest plot | 20 | | Peto Odds Ratio (Peto, Fixed, 95% CI) | Subtotals only |
|
| 10.1 Class Ia: Quinidine | 5 | 877 | Peto Odds Ratio (Peto, Fixed, 95% CI) | 2.11 [0.84, 5.32] |
| 10.2 All class Ia antiarrhythmics | 6 | 998 | Peto Odds Ratio (Peto, Fixed, 95% CI) | 2.27 [0.94, 5.49] |
| 10.3 All class I antiarrhythmics | 8 | 1133 | Peto Odds Ratio (Peto, Fixed, 95% CI) | 2.29 [0.96, 5.48] |
| 10.4 Class II antiarrhythmics | 2 | 562 | Peto Odds Ratio (Peto, Fixed, 95% CI) | 2.75 [0.39, 19.56] |
| 10.5 Class III: Sotalol | 6 | 1687 | Peto Odds Ratio (Peto, Fixed, 95% CI) | 2.30 [1.10, 4.80] |
| 10.6 All class III antiarrhythmics | 11 | 3485 | Peto Odds Ratio (Peto, Fixed, 95% CI) | 1.17 [0.84, 1.61] |
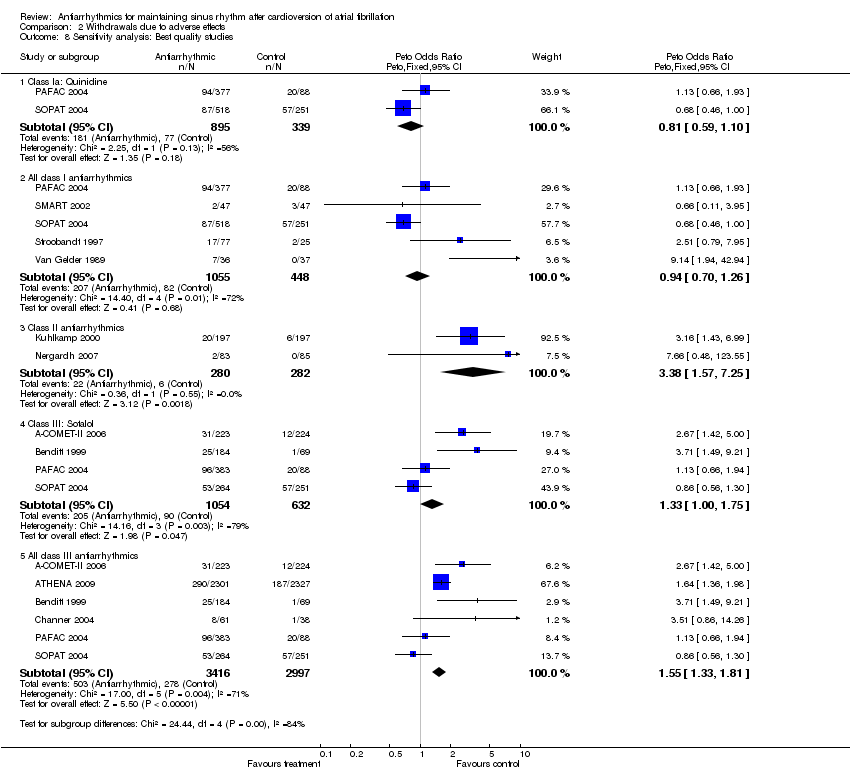
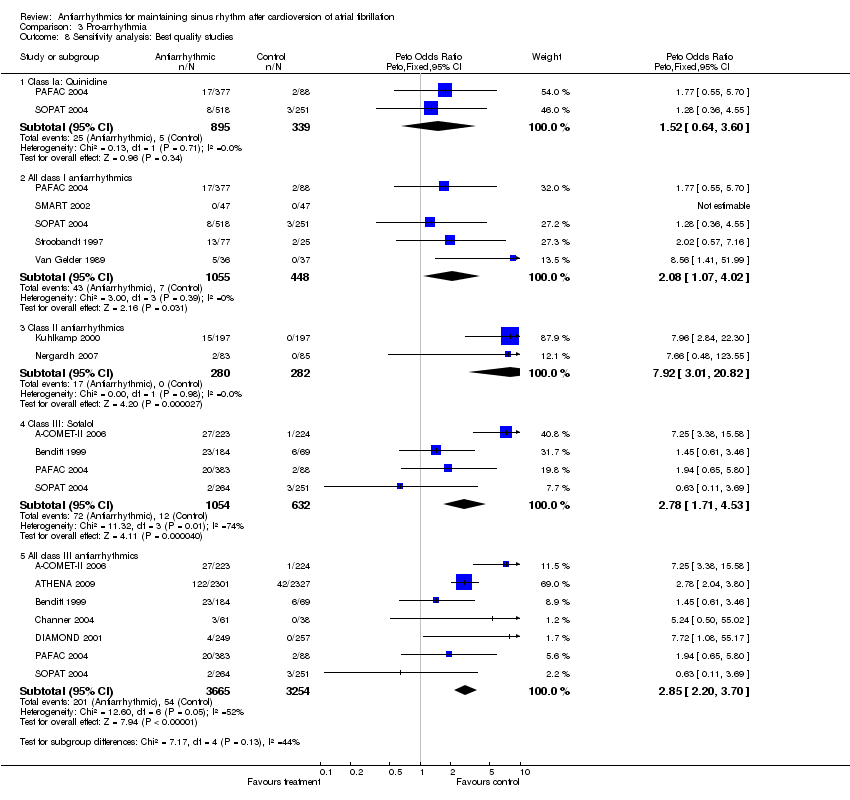
| 11 Sensitivity analysis: Best quality studies Show forest plot | 12 | | Peto Odds Ratio (Peto, Fixed, 95% CI) | Subtotals only |
|
| 11.1 Class Ia: Quinidine | 2 | 1234 | Peto Odds Ratio (Peto, Fixed, 95% CI) | 1.42 [0.37, 5.51] |
| 11.2 All class I antiarrhythmics | 5 | 1503 | Peto Odds Ratio (Peto, Fixed, 95% CI) | 0.99 [0.27, 3.63] |
| 11.3 Class II antiarrhythmics | 2 | 562 | Peto Odds Ratio (Peto, Fixed, 95% CI) | 2.75 [0.39, 19.56] |
| 11.4 Class III: Sotalol | 4 | 1686 | Peto Odds Ratio (Peto, Fixed, 95% CI) | 2.78 [1.00, 7.69] |
| 11.5 Class III: Azimilide | 1 | 447 | Peto Odds Ratio (Peto, Fixed, 95% CI) | 7.52 [1.05, 53.77] |
| 11.6 All class III antiarrhythmics | 7 | 6919 | Peto Odds Ratio (Peto, Fixed, 95% CI) | 0.92 [0.75, 1.13] |
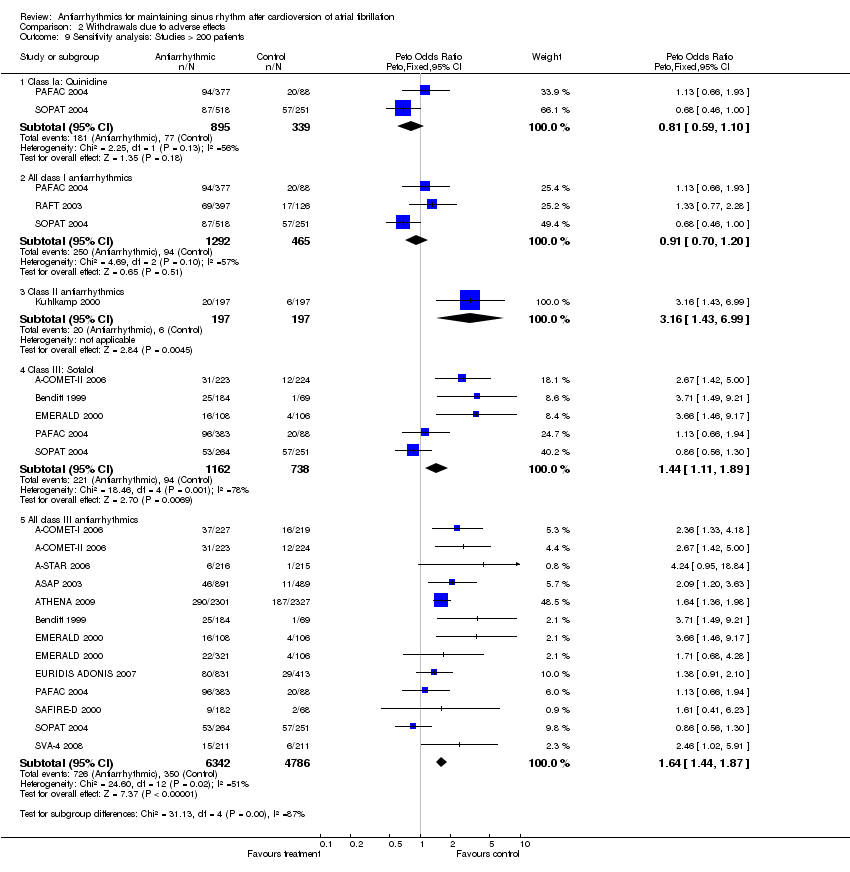
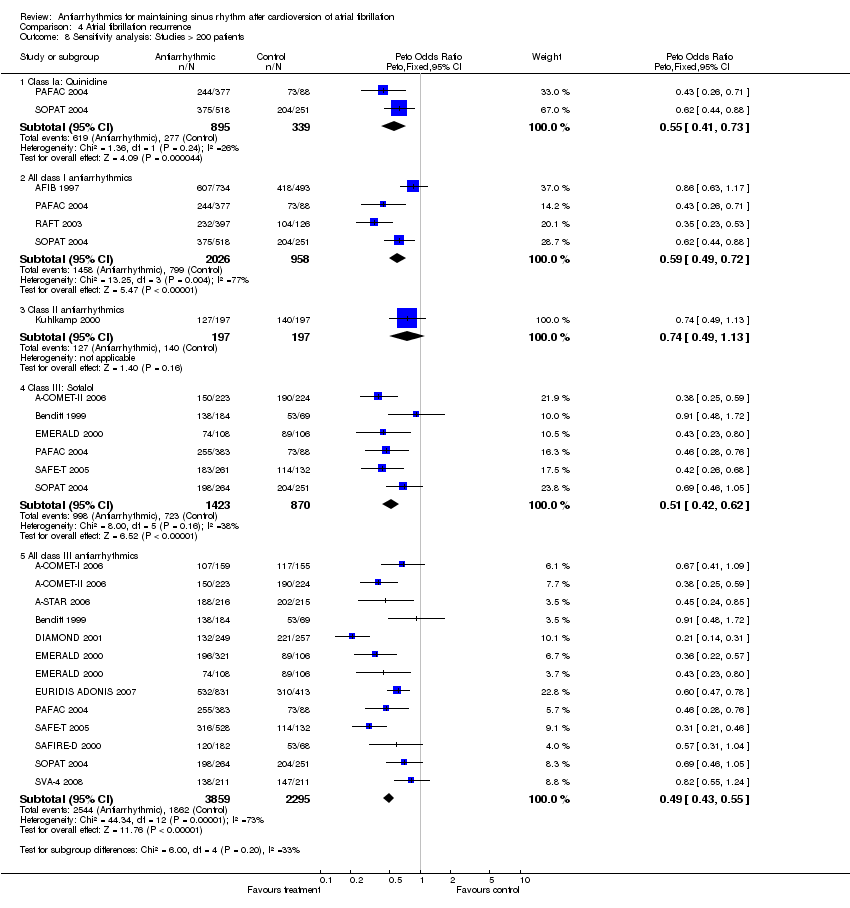
| 12 Sensitivity analysis: Studies > 200 patients Show forest plot | 17 | | Peto Odds Ratio (Peto, Fixed, 95% CI) | Subtotals only |
|
| 12.1 Class Ia: Quinidine | 2 | 1234 | Peto Odds Ratio (Peto, Fixed, 95% CI) | 1.42 [0.37, 5.51] |
| 12.2 All class I antiarrhythmics | 4 | 2984 | Peto Odds Ratio (Peto, Fixed, 95% CI) | 1.68 [0.69, 4.05] |
| 12.3 Class II antiarrhythmics | 1 | 394 | Peto Odds Ratio (Peto, Fixed, 95% CI) | 7.47 [0.77, 72.18] |
| 12.4 Class III: Sotalol | 7 | 2543 | Peto Odds Ratio (Peto, Fixed, 95% CI) | 1.97 [1.03, 3.75] |
| 12.5 Class III: Azimilide | 4 | 2704 | Peto Odds Ratio (Peto, Fixed, 95% CI) | 2.06 [0.85, 4.99] |
| 12.6 All class III antiarrhythmics | 14 | 12294 | Peto Odds Ratio (Peto, Fixed, 95% CI) | 0.99 [0.82, 1.20] |