Quinine for muscle cramps
Abstract
Background
Muscle cramps can occur anywhere and for many reasons. Quinine has been used to treat cramps of all causes. However, controversy continues about its efficacy and safety. This review was first published in 2010 and searches were updated in 2014.
Objectives
To assess the efficacy and safety of quinine‐based agents in treating muscle cramps.
Search methods
On 27 October 2014 we searched the Cochrane Neuromuscular Disease Group Specialized Register, CENTRAL, MEDLINE and EMBASE. We searched reference lists of articles up to 2014. We also searched for ongoing trials in November 2014.
Selection criteria
Randomised controlled trials of people of all ages with muscle cramps in any location and of any cause, treated with quinine or its derivatives.
Data collection and analysis
Three review authors independently selected trials for inclusion, assessed risk of bias and extracted data. We contacted study authors for additional information. For comparisons including more than one trial, we assessed the quality of the evidence using Grading of Recommendations Assessment, Development and Evaluation (GRADE).
Main results
We identified 23 trials with a total of 1586 participants. Fifty‐eight per cent of these participants were from five unpublished studies. Quinine was compared to placebo (20 trials, n = 1140), vitamin E (four trials, n = 543), a quinine‐vitamin E combination (three trials, n = 510), a quinine‐theophylline combination (one trial, n = 77), and xylocaine injections into the gastrocnemius muscle (one trial, n = 24). The most commonly used quinine dosage was 300 mg/day (range 200 to 500 mg). We found no new trials for inclusion when searches were updated in 2014.
The risk of bias in the trials varied considerably. All 23 trials claimed to be randomised, but only a minority described randomisation and allocation concealment adequately.
Compared to placebo, quinine significantly reduced cramp number over two weeks by 28%, cramp intensity by 10%, and cramp days by 20%. Cramp duration was not significantly affected.
A significantly greater number of people suffered minor adverse events on quinine than placebo (risk difference (RD) 3%, 95% confidence interval (CI) 0% to 6%), mainly gastrointestinal symptoms. Overdoses of quinine have been reported elsewhere to cause potentially fatal adverse effects, but in the included trials there was no significant difference in major adverse events compared with placebo (RD 0%, 95% CI ‐1% to 2%). One participant suffered from thrombocytopenia (0.12% risk) on quinine.
A quinine‐vitamin E combination, vitamin E alone, and xylocaine injections into gastrocnemius were not significantly different to quinine across all outcomes, including adverse effects. Based on a single trial comparison, quinine alone was significantly less effective than a quinine‐theophylline combination but with no significant differences in adverse events.
Authors' conclusions
There is low quality evidence that quinine (200 mg to 500 mg daily) significantly reduces cramp number and cramp days and moderate quality evidence that quinine reduces cramp intensity. There is moderate quality evidence that with use up to 60 days, the incidence of serious adverse events is not significantly greater than for placebo in the identified trials, but because serious adverse events can be rarely fatal, in some countries prescription of quinine is severely restricted.
Evidence from single trials suggests that theophylline combined with quinine improves cramps more than quinine alone, and the effects of xylocaine injections into gastrocnemius are not significantly different to quinine across all outcomes. Low or moderate quality evidence shows no significant difference between quinine and vitamin E or quinine and quinine‐vitamin E mixture. Further research into these alternatives, as well other pharmacological and non‐pharmacological treatments, is thus warranted.
There is no evidence to judge optimal dosage or duration of quinine treatment. Further studies using different dosages and measurement of serum quinine levels will allow a therapeutic range to be defined for muscle cramp. Because serious adverse events are not common, large population studies are required to more accurately inform incidence. Longer lengths of follow‐up in future trials will help determine the duration of action following cessation of quinine as well as long‐term adverse events. The search for new therapies, pharmacological and nonpharmacological, should continue and further trials should compare vitamin E, quinine‐vitamin E combination, and quinine‐theophylline mixture with quinine.
PICO
Plain language summary
Quinine for muscle cramps
Review question
We reviewed the evidence about the effect of quinine on muscle cramps.
Background
Muscle cramps can occur anywhere and in anyone; however, leg cramps are especially common in older people. Quinine is a medicine which has been used to treat cramps for many years. There is conflicting evidence for its ability to reduce cramps. Quinine can cause serious, even fatal adverse events, especially in overdosage.
Study characteristics
This review includes 23 trials, with 1586 participants. The trials compared quinine or quinine‐based medicines against inactive treatment (placebo) or other active treatments. We found no new studies when we searched the medical literature again and updated the review in 2014.
Key results and quality of the evidence
The risk of bias in the included trials varied considerably. All 23 trials claimed to be randomised, but many failed to clearly describe how participants were assigned to treatments. There is low quality evidence that quinine (200 mg to 500 mg daily) significantly reduces cramp number and cramp days and moderate quality evidence that quinine reduces cramp intensity. There is moderate quality evidence that there are more minor adverse events with quinine compared to placebo but no increase in major adverse events. However, there are reliable reports from other sources that an overdose of quinine can cause serious harm including death.
Low or moderate quality evidence shows there is no significant difference when comparing quinine to vitamin E or to a quinine‐vitamin E mixture. There is evidence from one trial that theophylline combined with quinine improves cramps more than quinine alone. In a single trial there was no significant difference when comparing quinine to xylocaine injections.
More research is needed to clarify the best dose and duration of treatment, as well as alternatives to quinine for cramps.
The evidence is current to October 2014.
Authors' conclusions
Summary of findings
| Quinine for muscle cramps | ||||||
| Patient or population: people with muscle cramps | ||||||
| Outcomes | Illustrative comparative risks* (95% CI) | Relative effect | No of Participants | Quality of the evidence | Comments | |
| Assumed risk | Corresponding risk | |||||
| Placebo | Quinine | |||||
| Number of cramps over 2 weeks | The mean number of cramps over 2 weeks in the control groups was | The mean number of cramps over 2 weeks in the intervention groups was | 952 | ⊕⊕⊝⊝ | The difference was statistically significant. | |
| Cramp intensity | The mean cramp intensity in the control groups was | The mean cramp intensity in the intervention groups was | 666 | ⊕⊕⊕⊝ | The difference was statistically significant. | |
| Participants suffering major adverse events | 14 per 1000 | 15 per 1000 | See comment | 1103 | ⊕⊕⊕⊝ | Risks were calculated from pooled risk differences. The difference was not statistically significant. |
| Participants suffering minor adverse events | 94 per 1000 | 127 per 1000 | See comment | 969 | ⊕⊕⊕⊝ | Risks were calculated from pooled risk differences. The difference was statistically significant. |
| *The basis for the assumed risk (e.g. the median control group risk across studies) is provided in footnotes. The corresponding risk (and its 95% CI) is based on the assumed risk in the comparison group and the relative effect of the intervention (and its 95% CI). | ||||||
| GRADE Working Group grades of evidence | ||||||
| 1There were significant shortcomings in study design in some trials, but the majority of those included in this meta‐analysis were of moderate to high quality, warranting a single downgrading for limitations in design and implementation. We further downgraded the evidence for this outcome to low quality because of the heterogeneity of the results.2Major adverse events were defined as those being severe enough to warrant participant withdrawal from the trial. As specific hypersensitivity reactions are so rare, larger studies are needed to clarify the incidence of such adverse events in particular. Some trials did not prespecify adverse events as an outcome but simply reported them retrospectively, thus compromising slightly on the quality of evidence. | ||||||
| Quinine versus vitamin E for muscle cramps | ||||||
| Patient or population: people with muscle cramps | ||||||
| Outcomes | Illustrative comparative risks* (95% CI) | Relative effect | No of Participants | Quality of the evidence | Comments | |
| Assumed risk | Corresponding risk | |||||
| Vitamin E | Quinine | |||||
| Number of cramps over 2 weeks | The mean number of cramps over 2 weeks in the control groups was | The mean number of cramps over 2 weeks in the intervention groups was | 513 | ⊕⊕⊝⊝ | The difference was not statistically significant. | |
| Cramp intensity | The mean cramp intensity in the control groups was | The mean cramp intensity in the intervention groups was | 513 | ⊕⊕⊕⊝ | The difference was not statistically significant. | |
| Participants suffering major adverse events | 3 per 1000 | 9 per 1000 | See comment | 513 | ⊕⊕⊕⊝ | Risks were calculated from pooled risk differences. The difference between the 2 groups was not statistically significant. |
| Participants suffering minor adverse events | 167 per 1000 | 189 per 1000 | See comment | 483 | ⊕⊕⊕⊝ | Risks were calculated from pooled risk differences. The difference between the 2 groups was not statistically significant. |
| *The basis for the assumed risk (e.g. the median control group risk across studies) is provided in footnotes. The corresponding risk (and its 95% CI) is based on the assumed risk in the comparison group and the relative effect of the intervention (and its 95% CI). | ||||||
| GRADE Working Group grades of evidence | ||||||
| 1Only 3 trials were available for this comparison, 2 of which were conducted by pharmaceutical investigators on behalf of manufacturers of quinine. A deficiency in the design of 1 of these trials meant that there was only a 2‐day washout between cross‐over treatments. | ||||||
| Quinine versus a quinine‐vitamin E combination (Q‐Vel) for muscle cramps | ||||||
| Patient or population: people with muscle cramps | ||||||
| Outcomes | Illustrative comparative risks* (95% CI) | Relative effect | No of Participants | Quality of the evidence | Comments | |
| Assumed risk | Corresponding risk | |||||
| Quinine‐vitamin E combination (Q‐Vel) | Quinine | |||||
| Number of cramps over 2 weeks | The mean number of cramps over 2 weeks in the control groups was | The mean number of cramps over 2 weeks in the intervention groups was | 486 | ⊕⊕⊝⊝ | The difference was not statistically significant. | |
| Cramp intensity | The mean cramp intensity in the control groups was | The mean cramp intensity in the intervention groups was | 510 | ⊕⊕⊝⊝ | The difference was not statistically significant. | |
| Participants suffering major adverse events | 8 per 1000 | 8 per 1000 | See comment | 510 | ⊕⊕⊕⊝ | Risks were calculated from pooled risk differences. |
| Participants suffering minor adverse events | 173 per 1000 | 202 per 1000 | See comment | 510 | ⊕⊕⊕⊝ | Risks were calculated from pooled risk differences. The difference was not statistically significant. |
| *The basis for the assumed risk (e.g. the median control group risk across studies) is provided in footnotes. The corresponding risk (and its 95% CI) is based on the assumed risk in the comparison group and the relative effect of the intervention (and its 95% CI). | ||||||
| GRADE Working Group grades of evidence | ||||||
| 1The results for cramp number in these 2 trials were not consistent, each suggesting opposite effects. | ||||||
Background
Description of the condition
Muscle cramps are sudden episodes of painful involuntary muscle contractions that may be visible or palpable (Baldissera 1994). Episodes may last seconds or several minutes but are usually self limiting. The severity and duration of each attack varies from person to person, as does their frequency. They are a common distressing occurrence in elderly people. It has been estimated that between 33% and 50% of elderly people suffer from regular leg cramps (Abdulla 1999; Naylor 1994). Muscle cramps can occur at any time and in any body part, but frequently they occur at night in the legs. Most cases seem to be idiopathic (with no obvious underlying cause).
There are no explicit diagnostic criteria for muscle cramp or indeed a universally accepted definition. Despite its frequency and associated morbidity there has been relatively little research into its cause, treatment or prevention.
The aetiology of muscle cramp is unknown, and the many proposed mechanistic causes are speculative. Two principal mechanisms have been proposed. In one, the motor nerve terminals are abnormally excitable; in the other, groups of anterior horn cells may be unstable due to spinal disinhibition leading to explosive hyperactivity of motor neurons and consequent high‐frequency discharges of several motor units (Baldissera 1994; Jansen 1990; Layzer 1994). In symptomatic cramps, the pathophysiology may differ according to the underlying cause.
Suggested risk factors include motor neuron disease, peripheral neuropathy, radiculopathy, electrolyte disturbances, haemodialysis, uraemia, liver cirrhosis, hypothyroidism, as well as pregnancy and vigorous exercise (Miller TM 2005). Medications have also been implicated including diuretics, nifedipine, steroids, beta‐adrenoreceptor agonists, morphine and statins (Eaton 1989; Haskell 1997; McGee 1990).
Without a clear understanding of aetiology or pathophysiology, treatments have been empirical. It has been recommended that muscle cramps are treated by nonpharmacological interventions before any medications are commenced (Butler 2002). There is, however a significant paucity of good quality data on non‐drug therapies for cramp (Blyton 2012; Hallegraeff 2012). Drugs utilised to prevent muscle cramp include vitamin E (Ayres 1974), calcium channel blockers (Baltodano 1988; Peer 1983), naftidrofuryl oxalate (Young 1993), orphenadrine citrate (Latta 1989), magnesium sulphate (Dahle 1995; Garrison 2012; Young 2002), and quinine (Jones 1983).
Vitamin E was considered effective in reducing cramps in three trials (Ayres 1969; Ayres 1974; Khajehdehi 2001), but not in another (Connolly 1992). Verapamil was tested in an uncontrolled trial of eight participants who were refractory to quinine treatment (Baltodano 1988). Of these eight, seven reported an improvement in their cramp symptoms over an eight‐week treatment period. Naftidrofuryl oxalate, a vasodilator, significantly reduced the frequency of cramps in a randomised control trial (RCT) involving 14 participants (Young 1993). Orphenadrine citrate, an anticholinergic with muscle relaxant properties, significantly reduced the frequency of cramps in a group of 59 participants in a double‐blind cross‐over trial (Latta 1989). Though magnesium salts have been shown to be effective in relieving the subjective distress caused by cramps in pregnancy (Dahle 1995; Young 2002), a RCT in nonpregnant sufferers reported no significant decrease in cramp frequency (Roffe 2002).
Description of the intervention
Quinine and its derivatives, quinine sulphate, hydroquinine and its optical isomer quinidine have been commonly prescribed to prevent cramps ever since a series of uncontrolled studies reported their beneficial effects in the 1940s (Gootnick 1943; Moss 1940; Nicholson 1945). Small groups of up to 30 people suffering from recurrent cramps were given quinine and the subjective outcome of no, partial or complete alleviation was reported on a case‐by‐case basis. In all three studies, the majority of participants reported improvement in their cramps, an effect that was reversed when the quinine was withdrawn.
Quinine (C₂₀H₂₄N₂O₂: molecular weight = 324), is a white crystalline alkaloid powder obtained from the bark of the cinchona tree which is native to the Andes region of South America (Krishna 1996). It comprises two benzene rings, and a covalently‐bonded nitrogenous carbon chain. Almost insoluble in water, it dissolves readily in alcohol and other organic solvents, and is used in the form of a salt, most commonly the sulphate. It is well known for its use in malaria and has been commercially synthesised from coal tar since 1944. Tonic water contains between 40 and 80 mg quinine/L. Quinine is inexpensive, bitter to taste, has excellent bioavailability and is predominantly excreted by the liver (Krishna 1996) but also by the kidneys to varying extents (Martindale 1996).
Quinine may have potentially serious adverse effects including fatal hypersensitivity reactions, particularly quinine‐induced thrombocytopenia (Barr 1990) which can occur idiosyncratically from the ingestion of even minimal amounts of quinine, such as are present in commercial tonic waters (Schneemann 2006). Other hypersensitivity reactions include angio‐oedema, disseminated intravascular coagulation, pancytopenia (Maguire 1993) and haemolytic uraemic syndrome (McDonald 1997). General and toxic reactions on the other hand are dose‐dependent and become common when plasma concentrations reach 10 mg/L (Schneemann 2006).
The dose of quinine used for the prevention of muscle cramps (200 to 300 mg daily) is significantly less than that used for the treatment of malaria (600 mg every eight hours); hence dose‐related adverse events are less common. However, gastrointestinal upset, abdominal pain, tinnitus and vertigo may occur, especially at higher doses, and quinine‐induced hypoglycaemia and renal insufficiency are also reported (Schneemann 2006). 'Cinchonism' is a symptom complex often linked to chronic use of quinine and consists of nausea, vomiting, vertigo, visual disturbances, tinnitus and hearing impairment (Bateman 1985). Quinine can interfere with the conduction pathways in the heart giving rise to arrhythmias, especially in overdosage (White 2007). Acute intoxication (ingestion of 4 to 12 g quinine) can cause convulsions followed by coma; death from respiratory arrest often results with doses exceeding 8 g. Permanent blindness has been reported in those with plasma concentrations over 10 mg/L (Prasad 2003).
Serious adverse effects including fatalities reported to the US Food and Drug Administration (FDA) led to the withdrawal of quinine from over‐the‐counter use and subsequently for all indications other than uncomplicated falciparum malaria (FDA 1982; FDA 1994; FDA 1995a; FDA 1995b; FDA 2006). A recent report from the American Academy of Neurology has recommended that quinine should not be used for the routine treatment of cramps, but only in cases of severe cramp where other treatments have failed and there is careful monitoring of side effects (Katzberg 2010). The FDA continue to be concerned about 'off label' use for nocturnal muscle cramp (www.fda.gov/ForHealthProfessionals/ArticlesofInterest/ucm317811.htm).
How the intervention might work
The precise mechanism of action of quinine is not known but it is believed to have a similar effect to curare on muscles and the neuromuscular junction. Quinine increases the refractory period of muscle, thereby reducing its response to repetitive stimulation (Goodman 2001). It also reduces the excitability of the motor end plate so that there is a diminished response to nerve stimulation and acetylcholine (Harvey 1939).
Why it is important to do this review
The first meta‐analysis of the efficacy of quinine for treating muscle cramps was published in 1995 and combined the results of six randomised, double‐blind, controlled trials investigating nocturnal leg cramps (Man‐Son‐Hing 1995). It concluded that treatment with quinine sulphate significantly reduced the number of cramps over a four‐week period by 8.83 (95% CI 4.2 to 13.5) cramps compared to placebo. However, the duration and intensity of individual cramps was not significantly affected by treatment. The same authors published a second meta‐analysis in 1998 that included three new unpublished trials which, when incorporated, decreased the magnitude of the reduction in the number of cramps to 3.6 (95% CI 2.2 to 5.1) fewer cramps than placebo (over four weeks) which remained significant (Man‐Son‐Hing 1998). The reduction in individual cramp intensity became significant, but the change in cramp duration remained nonsignificant. New data have been generated since the meta‐analyses of Man‐Song‐Hing (Man‐Son‐Hing 1995; Man‐Son‐Hing 1998). This systematic review includes these new studies. The review was first published in 2010 and this update in 2014.
Objectives
To assess the efficacy or safety of quinine‐based agents in treating muscle cramps.
Methods
Criteria for considering studies for this review
Types of studies
We included all randomised controlled trials (RCTs) and quasi‐RCTs of quinine‐based agents for muscle cramps. Both cross‐over and parallel study designs were accepted and studies did not have to be double‐blinded. We included studies comparing quinine to placebo or to any other medication.
Types of participants
We included results from participants of all ages who suffered muscle cramps from any cause and in any setting. There is no universally accepted definition for muscle cramp and studies vary greatly in their diagnostic criteria. We defined a muscle cramp as a sudden, intense involuntary contraction of a muscle during rest or activity, accompanied by visible or palpable muscle hardening and pain. We included cramps in any body part, occurring at any time of day or night, and of any frequency.
Types of interventions
We included all the salts and derivatives of quinine such as quinine sulphate, quinine bisulphate, hydroquinine, hydroquinine hydrobromide and quinidine, the optical isomer of quinine. We excluded trials that did not contain a treatment arm solely composed of a quinine salt, as combinations with non‐quinine‐based drugs would mean the resultant effect could not be ascribed solely to the quinine component of the intervention. All doses and timing regimens of quinine administration were accepted.
Types of outcome measures
Primary outcomes
Absolute difference in number of cramps (occurring day or night) during a two‐week treatment period.
The number of cramps was selected as the primary outcome on the grounds that it is the most commonly used outcome in clinical trials. For trials that involved treatment periods greater than two weeks, the results were standardised to provide comparable data for combined analysis at two weeks. For example, studies with treatment periods of four weeks had the reported number of cramps divided by two.
Secondary outcomes
-
Difference in cramp intensity; there are a variety of 'pain scales' and so these were standardised to a three‐point scale (1 = mild, 2 = moderate, 3 = severe) to allow the results to be combined. This was done by scaling the scores proportionately (for example with a scale of 1 to 10, the score was divided by 3.33).
-
Difference in cramp duration (in minutes per cramp).
-
Absolute difference in number of 'cramp days' during a two‐week treatment period. This was the number of days in which the person suffered one or more cramps.
-
Participants with one or more minor adverse events. A 'minor' adverse event was defined as a reported side effect not severe enough to require withdrawal of treatment (e.g. diarrhoea or constipation).
-
Participants with one or more serious adverse events. A 'major' adverse event was defined as a side effect severe enough to require withdrawal of treatment (e.g. pancytopenia).
Search methods for identification of studies
Electronic searches
With the assistance of the Cochrane Neuromuscular Disease Group, we searched the Cochrane Neuromuscular Disease Group Specialized Register (27 October 2014), CENTRAL (2014, Issue 9 in The Cochrane Library), MEDLINE (January 1966 to October 2014) and EMBASE (January 1980 to October 2014). The detailed search strategies are in the appendices: Appendix 1 (MEDLINE), Appendix 2 (EMBASE), Appendix 3 (Cochrane Neuromuscular Disease Group Specialized Register) and Appendix 4 (CENTRAL).
On 3 November 2014 we also searched trial registries, ClinicalTrials.gov (www.clinicaltrials.gov/) and World Health Organization International Clinical Trials Registry Platform (apps.who.int/trialsearch/) for ongoing trials (Appendix 5).
Searching other resources
We contacted the American and British drug regulatory agencies and relevant pharmaceutical companies that manufacture quinine products to request any unpublished trials in their possession. We also contacted the authors of relevant trials and reviews to identify additional published or unpublished data. We checked the reference lists of these papers for further relevant material.
Data collection and analysis
Selection of studies
For the original review, three review authors independently checked the titles and abstracts of the articles identified by the search, obtaining the full text of all potentially relevant studies. The review authors selected the trials that satisfied the inclusion criteria for the review and graded their risk of bias and extracted data onto specially designed forms. There were no disagreements on which trials were to be excluded. For the update two authors (RB and SET) independently checked the titles and abstracts from the literature searches.
Data extraction and management
Four authors (SET, TAM, HV and TET) were involved in the data extraction, its checking and analysis. Three review authors independently extracted the data relating to the primary and secondary outcomes for all the included trials, and a fourth checked them.
One review author (SET) transferred study characteristics and outcome data into the Cochrane authoring and statistical software Review Manager (RevMan 2014) and a second author (TAM) carried out checks.
We transformed outcome data as described in Types of outcome measures to standardise reporting.
Assessment of risk of bias in included studies
Three review authors assessed the risk of bias of the trials independently using the recommended approach described in the Cochrane Handbook for Systematic Reviews of Interventions (Higgins 2011). This addresses six specific domains: adequate sequence generation; allocation concealment; blinding; incomplete outcome data; selective outcome reporting; and 'other sources of bias'. We gave each trial a classification of 'low risk', 'high risk' or 'unclear risk' (i.e. insufficient or no information). A fourth author resolved disagreements.
Measures of treatment effect
We combined the results of trials identified for inclusion in this review, where possible, using the Cochrane statistical package, RevMan. We combined continuous outcomes using the generic inverse variance (GIV) method which allows paired data from cross‐over trials (where each participant acts as their own control) to be combined with the results of two‐group parallel studies, producing a mean treatment effect with a 95% confidence interval (CI). For dichotomous outcomes (presence of major or minor adverse events), we calculated risk differences (RDs) with 95% CIs.
Unit of analysis issues
As noted above, we used GIV analysis to allow combination of parallel‐group and cross‐over studies. If multiple trial arms had been reported in a single trial, we would have included only the relevant arms.
Dealing with missing data
Where possible we derived standard errors (SE) from other data in order to perform GIV analyses. We contacted authors for missing data, but where we received no reply, we used the data within the studies to derive a standard error which could be used in the meta analysis.
Assessment of heterogeneity
We asssessed heterogeneity using the I2 statistic (Higgins 2003). Where we identified substantial unexplained heterogeneity, we reported it and explored possible causes by sensitivity analysis.
Assessment of reporting biases
Not done
Data synthesis
We undertook a fixed‐effect analysis initially and where the I² statistic exceeded 25%, undertook a sensitivity analysis. If heterogeneity remained unexplained, we used the random‐effects model of analysis. We regarded any outcome with a P value below 0.05 as significant. We also expressed all outcomes that reached statistical significance as relative percentage differences.
We discussed the adverse effects of quinine in the light of the results of this meta‐analysis. We used other sources of information for quinine's adverse event profile, including studies that were not randomised and texts such as Meyler's Adverse Events of Drugs (Schneemann 2006). We also discussed the costs and cost‐benefits of treating muscle cramp with quinine.
We created a 'Summary of findings' tables for comparisons where more than one trial was available. We presented the following outcomes:
-
Number of cramps over two weeks
-
Cramp intensity
-
Participants suffering major adverse events
-
Participants suffering minor adverse events
We used the five GRADE considerations (study limitations, consistency of effect, imprecision, indirectness and publication bias) to assess the quality of a body of evidence (studies that contribute data for the prespecified outcomes). We used methods and recommendations described in Section 8.5 and Chapter 12 of the Cochrane Handbook for Systematic Reviews of Interventions (Higgins 2011) using GRADEpro software. We justified all decisions to down‐ or up‐grade the quality of studies using footnotes and we made comments to aid readers' understanding of the review where necessary.
Subgroup analysis and investigation of heterogeneity
For the quinine versus placebo comparison and the outcome cramp number, we conducted a subgroup analysis by quinine dose. This was not a pre‐specified analysis.
Sensitivity analysis
We carried out a sensitivity analysis when I2 exceeded 25% by excluding:
-
trials that on examination had obvious potential sources of heterogeneity
-
trials at a high or unclear risk of bias for adequate sequence generation, allocation concealment, and blinding
We have described any deviations from the published protocol (El Tawil 2004) in Differences between protocol and review.
Results
Description of studies
The new, updated searches produced the following results: Cochrane Neuromuscular Disease (NMD) Group Specialized Register 32 papers, MEDLINE 186 papers, EMBASE 89 papers and CENTRAL 42 papers. There were no new studies satisfying our inclusion criteria. Searches of the trials registries ClinicalTrials.gov and ICTRP revealed no ongoing trials.
For the original review, search results from MEDLINE, EMBASE, CENTRAL and the Cochrane NMD Group Register revealed 259, 171, 43 and 22 papers, respectively. One hundred and twenty‐six titles were relevant to the topic and the abstracts of these were analysed. The authors reviewed the full texts of 28 studies. They eliminated five (see Excluded studies) leaving 23 studies that fulfilled our inclusion criteria. Quinine was compared to placebo (20 trials), to vitamin E (four trials), to a combination of quinine and vitamin E (also known as Q‐Vel) (three trials), to a combination of quinine and theophylline (one trial; Gorlich 1991) and to xylocaine injections (one trial; Prateepavanich 1999). Four trials compared quinine to more than one treatment (CIBA 1988; Connolly 1992; Gorlich 1991; Leo Winter 1986). See Table 1 for a tabulated summary of the trials and Included studies for further detail.
| Study | Number of participants Study design Patient focus | Mean age (yrs) | Female | Male | F: M ratio | Quinine dose (mg) | Treatment period (d) | Washout period (d) | Treatment comparisons |
| n = 24 Study design = C Patient focus = I | 57 | 11 | 13 | 0.8 | 260 | 7 | 7 | Quinine‐vitamin E combination (Q‐Vel®)b ✓ | |
| n = 69 Study design = C Patient focus = I | 51 | 66 | 3 | 22.0 | 260 | 14 | 14 | Placebo ✓ | |
| n = 556 Study design = P Patient focus = I | 45 | 393 | 163 | 2.4 | 260 | 14 | n/a | Placebo ✓ Vitamin E ✓ Quinine‐vitamin E combination (Q‐Vel®) ✓ | |
| n = 30 Study design = C Patient focus = I | 59 | 0 | 30 | 0.0 | 500 | 28 | 28 | Placebo ✓ Vitamin E ✓c | |
| n = 28 Study design = C Patient focus = I | 67 | 17 | 11 | 1.5 | 300 | 30 | 3 | Placebo ✓ | |
| n = 94 Study design = P Patient focus = I | 49 | 66 | 32 | 2.1 | 400 | 14 | n/a | Placebo ✓ | |
| n = 9 Study design = C Patient focus = I | 63 | 7 | 1 | 7.0 | 200 | 28 | 7 | Placebo ✓ | |
| n = 164 Study design = P Patient focus = I | 56 | 119 | 45 | 2.6 | 260 | 14 | n/a | Placebo ✓ Quinine‐theophylline combination (Limptar®)b ✓ | |
| n = 62 Study design = C Patient focus = I | 47 | 49 | 13 | 3.8 | 325 | 14 | 14 | Placebo ✓ | |
| n = 20 Study design = P | 55 | 14 | 6 | 2.3 | 300 | 14 | n/a | Placebo ✓ | |
| n = 106 Study design = P Patient focus = I | 51 | 68 | 44 | 1.5 | 300 | 14 | n/a | Placebo ✓ | |
| n = 9 Study design = C Patient focus = I | _ | _ | _ | _ | 300 | 14 | 14 | Placebo ✓ | |
| n = 9 Study design = C Patient focus = H | _ | _ | _ | _ | 320d | 42d | 0 | Placebo ✓ | |
| n = 31 Study design = P Patient focus = L | 62 | 5 | 26 | 0.2 | 400 | 28 | n/a | Placebo ✓ | |
| n = 205 Study design = C Patient focus = I | 44 | 173 | 32 | 5.4 | 260 | 5 | 2 | Placebo ✓ Vitamin E ✓ Quinine‐vitamin E combination (Q‐Vel®) ✓ | |
| n = 25 Study design = P Patient focus = I | _ | _ | _ | _ | 300 | ≤ 14 | n/a | Placebo ✓ | |
| n = 16 Study design = C Patient focus = I | 76 | 10 | 6 | 1.7 | 300 | 21 | 0 | Placebo ✓ | |
| n = 24 Study design = P Patient focus = Ie | 64 | 21 | 3 | 7.0 | 300 | 28 | n/a | Xylocaine injection ✓ | |
| n = 30 Study design = P Patient focus = H | 48 | 10 | 19 | 0.5 | 325 | 60f | n/a | Vitamin E ✓ | |
| n = 19 Study design = C Patient focus = I | 58 | 14 | 2 | 7.0 | 200 | 14 | 14 | Placebo ✓ | |
| n = 21 Study design = C Patient focus = I | 73 | _ | _ | _ | 300 | 21 | 0 | Placebo ✓ | |
| n = 22 Study design = C Patient focus = I | 74 | 16 | 6 | 2.7 | 300 | 21 | 0 | Placebo ✓ | |
| n = 13 Study design = N‐of‐1 Patient focus = I | 75 | 7 | 6 | 1.2 | 200 to 300 | 42 | 0 | Placebo ✓ |
Abbreviations: C: cross‐over, P: parallel, H: haemodialysis‐induced cramps, I: idiopathic, L: patients with liver cirrhosis; n/a: not available
aUnpublished.
bQ‐Vel®: trade name for quinine‐vitamin E combination; Limptar®:trade name for quinine‐theophylline combination.
cConnolly 1992 did not directly compare quinine versus vitamin E ‐ using the data provided we were able to draw comparison.
dQuinine dose given at beginning of each dialysis session (3 times per wk) and not daily.
eInclusion criteria included presence of myofascial trigger point in gastrocnemius.
fA 60‐day trial but results only reported from first month of treatment.
Thirteen trials were cross‐over in design, nine were parallel studies, and one was a 'N‐of‐1' trial (see Table 1). The 23 studies involved a total of 1586 unique participants commencing the trials; 523 were from cross‐over trials and thus formed their own controls. The number of participants in each trial varied from 9 to 556, with only four trials containing more than 100 participants. Of the 23 trials included, five were unpublished studies acquired via the United States Food and Drug Administration (FDA). Indeed, the two largest trials included in this meta‐analysis were both large unpublished multicentre studies conducted by pharmaceutical companies in the United States: CIBA 1988 with 556 participants, and Leo Winter 1986 with 205 participants. The five unpublished studies contributed 58% of the total number of participants included in this meta‐analysis. The third largest trial was translated from German (Gorlich 1991). This was the only trial to compare quinine with a combination of quinine and theophylline, and was also conducted by a pharmaceutical company.
Twenty trials investigated idiopathic muscle cramps, most often in elderly participants suffering from nocturnal leg cramps. In one (Prateepavanich 1999), inclusion criteria included nocturnal calf cramps associated with a demonstrable myofascial trigger point on the medial head of the gastrocnemius muscle. Two studies (Kaji 1976; Roca 1992) recruited only participants who suffered haemodialysis‐related cramps, whilst one study (Lee 1991) recruited those with liver cirrhosis. The participants were all outpatients from general practice and medical clinics, except those in one trial (Lim 1986) who were inpatients on a general medical ward.
The typical format of the cross‐over trials consisted of an initial 'run‐in period' of around two weeks, allowing baseline characteristics to be assessed, inclusion criteria to be met, and any quinine from previous treatment to be washed out. Common inclusion criteria were: minimum cramp frequency of two per week, and the absence of conditions predisposing to cramps in those trials investigating idiopathic cramps. Common exclusion criteria included: electrolyte disturbances, renal or hepatic impairment, detectable quinine serum levels after the run‐in phase, and the use of concomitant medication interfering with quinine or cramp sensation. Time periods for trial washout and cross‐over varied. The washout interval ranged from 0 days (Kaji 1976; Maule 1990; Smith 1985; Warburton 1987) to 28 days (Connolly 1992) (see Table 1). Parallel group trials included a follow‐up assessment period.
The average age of the population under investigation in each study varied from 44 to 76 years (mean of these averages = 58 years). The youngest affected with cramp was 17 years and the oldest 87 years. Of the 19 trials that included gender demographics, 15 had a female preponderance, 11 of which contained more than twice as many women as men. The mean female to male ratio across the 19 trials describing sex distribution was 3.8. Of the four trials containing more men than women, one was conducted at a Veterans Affairs medical centre (Connolly 1992; 100% men), and another investigated people with liver cirrhosis resulting from chronic hepatitis and not alcohol intake (Lee 1991; 84% men).
Twenty trials used the sulphate salt of quinine as the active treatment, two studies (Jansen 1994; Jansen 1997) used hydroquinine hydrobromide, and one trial (Lee 1991) used the quinine isomer quinidine. Most of the trials used a daily quinine dose of 300 mg, closely followed by 200 mg. Two trials (Diener 2002: Lee 1991) used doses of 400 mg, and one trial (Connolly 1992) used a dose of 500 mg. The Woodfield 2005 trial maintained participants on the dosage of quinine which they had previously been prescribed (mainly 200 mg).
The duration of treatment with quinine ranged from five days (Leo Winter 1986) to 42 days (Kaji 1976; Woodfield 2005), with the majority (10 trials) treating for 14 days. One trial administered active medication for 60 days but only provided results for the first month of treatment (Roca 1992). The Leo Winter 1986 trial compared four treatments in cross‐over design over four weeks and so the treatment duration was limited to five days each with only two days washout in between treatments. A poorly designed trial treated patients on a general medical ward up to their discharge date or for up to two weeks, whichever was shorter (Lim 1986).
The timing of drug administration varied between trials; the majority of studies advised participants to take the therapy at or approaching bedtime, while the others divided the dose across the evening (BioDesign 1984; Leo Winter 1986) or in a morning/evening regimen (Lee 1991). Of the two haemodialysis trials, one (Kaji 1976) administered quinine or placebo at the beginning of each dialysis session only (three times per week), whilst the other (Roca 1992) administered the study drug daily. The parallel trial involving xylocaine injections (Prateepavanich 1999) gave one group daily 300 mg quinine at bedtime and the other group an injection of 1% xylocaine into the medial head of the gastrocnemius muscle at the start of the four‐week treatment period. Symptoms were reviewed on a fortnightly basis and further injections administered depending on the frequency of any ongoing symptoms.
Cramp number was the most common outcome measured in the trials. Some trials combined the cramp intensity with duration to give a 'cramp index' which was not an outcome in this meta‐analysis. All but two trials recorded adverse events as an outcome (Roca 1992; Smith 1985). In Kaji 1976, the frequency and severity of cramps was assessed only during dialysis sessions and not between them.
Risk of bias in included studies
The 'Risk of bias' assessment was performed as set out in the Methods.
The quality of the trials varied considerably. Newer trials were of better design, incorporating more appropriate statistical analysis, applying intention‐to‐treat analysis and taking into consideration baseline differences. The unpublished studies in general were much more detailed, each comprising several documents, and were conducted by professional pharmaceutical investigators.
All 23 trials claimed to be randomised, but only eight actually described the method of randomisation (Characteristics of included studies; Figure 1). Likewise, only eight trials stated how allocation was concealed.

Methodological quality summary: review authors' judgements about each methodological quality item for each included study. Red = high risk of bias; yellow = unclear risk of bias; green = low risk of bias.
Fourteen studies were judged to be adequately double‐blinded (Figure 1). There was insufficient information to pass judgement in four trials, whilst five trials were not double‐blinded: quinine and placebo tablets looked different in one trial (Maule 1990), tasted different in two trials (Jansen 1994; Jansen 1997), physicians were not blinded in another (Lee 1991), and both participant and observer were aware of the treatments administered (xylocaine injections or oral quinine) in another (Prateepavanich 1999).
Thirteen studies were considered to have adequately addressed any incomplete outcome data. Two studies did not give complete details for participant withdrawal (Dunn 1993; Maule 1990) and two did not mention the drop‐outs at all (Bottner 1984; Diener 2002). In the Bottner 1984 trial, 15 drop‐outs were unaccounted for and one suffered quinine‐related adverse events and was not followed up. One study did not give the number of participants completing the trial (Lim 1986). Intention‐to‐treat analysis was not used in six studies (Fung 1989; Jansen 1994; Maule 1990; Prateepavanich 1999; Roca 1992; Warburton 1987).
The majority of studies were free of selective reporting (Figure 1), but five studies did not report on their adverse event outcomes (Roca 1992; Smith 1985) or other outcomes stipulated in their methods (Jansen 1994; Jansen 1997; Kaji 1976).
Other sources of bias included the lack of sufficient washout periods in cross‐over treatments (Dunn 1993; Kaji 1976; Leo Winter 1986; Maule 1990; Smith 1985; Warburton 1987), the fact that six studies were conducted by pharmaceutical companies (BioDesign 1984; Bottner 1984; CIBA 1988; Gorlich 1991; Hays 1986; Leo Winter 1986) (although this is not always considered a source of significant bias), gender bias (Bottner 1984; Connolly 1992; Fung 1989; Lee 1991; Jansen 1994; Sidorov 1993), and intra‐study variability in treatment dose (Prateepavanich 1999; Woodfield 2005) or duration (Lim 1986).
Not all data could be entered into the meta‐analysis. Two trials did not contain sufficient data for entry into the meta‐analysis (Maule 1990; Smith 1985). The Smith 1985 trial did not include any washout period between quinine and placebo and no data were given for the results. The Maule 1990 trial failed to give any detail on the cramp number outcome, whilst the information on adverse events could not be ascribed to a set number of participants.
The only data that could be entered from three of the trials were those of the adverse events experienced (Bottner 1984; Lim 1986; Kaji 1976). Kaji 1976 measured the number of cramps during dialysis sessions only and not over 24 hours, and this outcome was thus excluded from the meta‐analysis.The Lim 1986 trial presented very basic information on design and conduct. The trial did not have a set treatment duration and also failed to specify how many participants were randomised to each group. The results were not reported fully and carried no measure of spread. The GIV method of meta‐analysis is dependent upon the calculation of a standard error (SE) from standard deviations (SDs); where SDs were not available, the SE was approximated from a range, or CI, or from measures of significance (P values). None of these were available for the Bottner 1984 trial and so the results could not be entered into the meta‐analysis.
Effects of interventions
See: Summary of findings for the main comparison Quinine versus placebo for muscle cramps; Summary of findings 2 Quinine versus vitamin E for muscle cramps; Summary of findings 3 Quinine versus a quinine‐vitamin E combination (Q‐Vel) for muscle cramps
Quinine versus placebo
Primary outcome measure: difference in number of cramps (occurring day or night) during a two‐week treatment period
Eighteen placebo‐controlled trials reported the absolute number of cramps occurring over their study period. To allow the results to be combined in a meta‐analysis, we standardised the data to the number of cramps occurring over two weeks.
Four trials could not be entered into the meta‐analysis for the reasons given above (Bottner 1984; Kaji 1976; Maule 1990; Smith 1985). The 14 trials (n = 982) entered into the meta‐analysis all investigated idiopathic muscle cramps except one (Lee 1991), which investigated cramps in people with liver cirrhosis. The results of the Lee 1991 trial were comparable with the rest. When the 14 trials were entered into the meta‐analysis, the combined mean change in the number of cramps was ‐1.81 (95% CI ‐2.20 to ‐1.42) (See Analysis 1.1).
Significant heterogeneity was detected in the meta‐analysis (I² = 89%). Inspection of the included trials identified potential causes in two trials. The small trial of Woodfield 2005 contained large standard errors for the primary outcome and Connolly 1992 was the only trial to use 500 mg quinine and included only men. The exclusion of Woodfield 2005 did not reduce the heterogeneity but excluding Connolly 1992 reduced the I² index to 71%. We performed further sensitivity analyses excluding all trials at a high or unclear risk of bias for adequate sequence generation, allocation concealment, and blinding; the heterogeneity index changed to 50%, 67% and 91% respectively. Quinine remained significantly effective compared to placebo in all these sensitivity analyses. After discussion, we excluded Connolly 1992 only because of its unique participant selection and quinine dose, and used a random‐effects model. Quinine resulted in a significant decrease in cramp number (‐2.45 cramps, 95% CI ‐3.54 to ‐1.36, random‐effects), equivalent to a 28% (95% CI 15% to 40%) reduction over placebo (see Analysis 1.2, Figure 2). It is worth noting the persistent heterogeneity (I² = 71%) associated with this result.

Forest plot of comparison: 1 Quinine versus placebo, outcome: 1.2 Difference in number of cramps over 2 weeks ‐ random‐effects (minus Connolly 1992).
Subgroup analysis according to quinine dose
We analysed the data for the effect of quinine dose on cramp number over two weeks (see Analysis 1.3), grouping the studies according to the dose of quinine used. Although there seems to be an increasing effect with dose from 300 mg through 400 mg to 500 mg, the 200 mg and 260 mg doses go against this trend. It is notable that the reduction in cramp number reported by using the higher 500 mg dose (Connolly 1992) is more than double that achieved by any of the other doses. However, analysis of these data is severely undermined by the shortage of studies in each dose range; any conclusions drawn from these data would be highly speculative.
Change in cramp intensity during treatment period
Cramp intensity was reported in 13 of the 20 placebo‐controlled trials. A further two trials measured cramp intensity but combined it with duration to give an 'index' from which intensity itself could not be derived (Smith 1985; Warburton 1987).
From the 13 trials reporting intensity as an outcome, six trials could not be entered into the meta‐analysis. Three trials failed to report exact data (Diener 2002; Jansen 1994; Jansen 1997), standard errors could not be derived from two trials (Bottner 1984; Lim 1986), and one trial (Connolly 1992) measured only the most severe cramp experienced each night.
The remaining seven trials (n = 666) measured the intensity per cramp on different scales and so these were standardised to a three‐point scale (1 = mild pain, 2 = moderate pain, 3 = severe pain). Meta‐analysis of these trials (CIBA 1988; Fung 1989; Gorlich 1991; Hays 1986; Jones 1983; Leo Winter 1986; Sidorov 1993) demonstrated that quinine was significantly better than placebo in reducing cramp intensity (‐0.12 units, 95% CI ‐0.20 to ‐0.05), representing a 10% drop (95% CI 4% to 16%) compared to placebo (Analysis 1.4). There was no heterogeneity in this meta‐analysis (I² = 0).
Change in cramp duration (in minutes)
This was an outcome in eight of the trials (CIBA 1988; Fung 1989; Gorlich 1991; Jansen 1994; Jansen 1997; Jones 1983; Kaji 1976; Sidorov 1993), but data from six trials (CIBA 1988; Gorlich 1991; Jansen 1994; Jansen 1997; Jones 1983; Kaji 1976) could not be entered into the meta‐analysis because the data could not be ascertained or converted into a suitable form or were unavailable from the trial authors. All except one (Gorlich 1991) of these excluded trials individually showed that there was no significant difference between quinine and placebo with regards to cramp duration. A further trial (Warburton 1987) combined cramp duration with mean severity to give a 'cramp index'; no significant difference in this index was found between quinine and placebo.
There remained two trials (n = 28; Fung 1989; Sidorov 1993) which could be combined into the meta‐analysis. Cramp durations were calculated from individual patient data provided in the Fung 1989 trial. We used a random‐effects model because of unexplained significant heterogeneity (I² = 31%), and there was no significant difference between quinine and placebo (‐1.35 minutes, 95% CI ‐4.00 to 1.30) (see Analysis 1.5).
Change in number of cramp days
Ten trials measured this outcome and seven reported statistically significant reductions in the number of cramp days with quinine compared with placebo. However, one of these trials (Dunn 1993) could not be entered into the meta‐analysis as it was a cross‐over trial that was declared invalid by its authors because of a significant carry‐over effect. Lim 1986 could not be entered into the meta‐analysis as it failed to indicate the number of participants in each group.
Eight trials were combined (CIBA 1988; Connolly 1992; Diener 2002; Gorlich 1991; Hays 1986; Jansen 1997; Leo Winter 1986; Woodfield 2005). Results were standardised to two weeks. The three unpublished trials (CIBA 1988; Hays 1986; Leo Winter 1986) reported differences in the number of cramp days without details of standard deviation or confidence limits. These were approximately derived from the P values given. The trial of Connolly 1992 was excluded after sensitivity analysis because of the demonstrable heterogeneity that it contributed. The remaining seven trials (n = 842) showed that quinine significantly reduced cramp days compared to placebo (‐1.15 days, 95% CI ‐1.93 to ‐0.38, random‐effects) (see Analysis 1.6). This represents a 20% (95% CI 6% to 33%) reduction in cramp days when compared to the average number of affected days on placebo. It is worth noting that despite the exclusion of Connolly 1992, there remained significant heterogeneity between the trials (I² = 86%).
Participants with one or more adverse events
All but one of the included trials provided results for adverse events, investigated by participant diary or clinical assessment, or both. The trial that did not mention adverse events set out with the intention to do so but no mention of this was later given in the paper (Smith 1985). The data on adverse events in the Maule 1990 trial were unclear and could not be entered into the meta‐analysis. Only data for major adverse events from the Jansen 1997 trial could be entered into the meta‐analysis.
Minor adverse events
Sixteen of the 20 placebo‐controlled trials provided accurate data on minor adverse events. Quinine was free of all adverse events in six trials with a total of 106 participants (Dunn 1993; Jones 1983; Kaji 1976; Lim 1986; Warburton 1987; Woodfield 2005).
When the 16 trials were combined, 93 out of 725 participants on quinine suffered minor adverse events (12.8%), compared to 68 out of 722 on placebo (9.4%). The risk difference (RD) was small but significant at 3% (95% CI 0% to 6%) (Analysis 1.7, Figure 3). There was no heterogeneity in the results (I² = 0%).
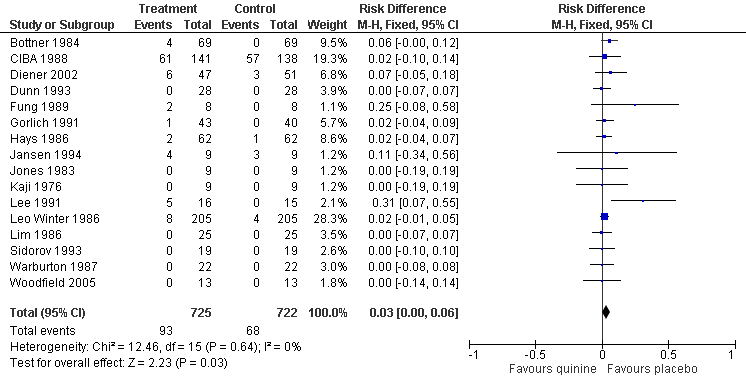
Forest plot of comparison: 1 Quinine versus placebo, outcome: 1.7 Participants suffering minor adverse events ‐ fixed‐effect.
In a separate analysis of specific minor adverse events, the Jansen 1997 and Maule 1990 trials could also be taken into account, giving a total of 790 participants in the quinine group and 791 in the placebo group. Comparing quinine with placebo, the following numbers of participants suffered the respective minor adverse events: gastrointestinal (39 quinine versus 16 placebo), headache (36 versus 33), tinnitus (10 versus 1), pruritis/scaly rash (9 versus 3), dizziness/drowsiness (8 versus 8), myalgia/paraesthesia (7 versus 10), visual disturbance (4 versus 2), and fever (3 versus 1). The only significant risk difference was found to be gastrointestinal‐related adverse events (RD 3%, 95% CI 1% to 5%) (Analysis 1.8, Figure 4). The apparent increase in incidence of tinnitus did not reach statistical significance.

Forest plot of comparison: 1 Quinine versus placebo, outcome: 1.8 Participants suffering specific minor adverse events.
Major adverse events
Quinine was stopped in a total of 12 participants in eight separate trials because of adverse events. Twelve participants (1.5%) withdrew from a total of 806 participants treated with quinine compared to 11 out of 807 on placebo (1.4%). There was no significant risk difference between the two groups (RD 0.0%; 95% CI ‐1% to 2%) (Analysis 1.9, Figure 5). There was no heterogeneity in the results (I² = 0%).

Forest plot of comparison: 1 Quinine versus placebo, outcome: 1.9 Participants suffering major adverse events.
The only truly serious adverse event occurred in the Sidorov 1993 cross‐over trial (n = 19), where a participant suffered leukopenia and thrombocytopenia with a severe rash, myalgia, and nausea, all of which resolved three days after stopping quinine. No further details are available regarding this participant.
The other adverse events encountered were mild or short‐lived, with authors usually reporting their resolution on cessation of treatment. Several participants suffered more than one major adverse event and by symptomatology these were: gastrointestinal (7 in quinine group versus 1 in placebo group), dizziness/drowsiness (3 versus 2), headache (2 versus 2), pruritis/scaly rash (2 versus 0), tinnitus (1 versus 0), myalgia/paraesthesia (1 versus 0), visual disturbance (0 versus 1), and fever (1 versus 0). Gastrointestinal symptoms were the commonest reason for participant withdrawal but this was not significantly different to placebo (Analysis 1.10, Figure 6).

Forest plot of comparison: 1 Quinine versus placebo, outcome: 1.10 Participants suffering specific major adverse events (gastrointestinal).
Quinine versus vitamin E
Four trials (n = 543) compared quinine against vitamin E at doses of 1600 units (CIBA 1988; Leo Winter 1986) and 800 units (Connolly 1992; Roca 1992).
Primary outcome measure: difference in number of cramps (occurring day or night) during a two‐week treatment period
The inclusion of Connolly 1992 resulted in significant heterogeneity (I² = 94%, reduced to 29% on exclusion), so it was removed on the basis of its unique selection of participants and dose. With this persisting heterogeneity (I² = 29%), we used the random‐effects model and there was no significant difference between quinine and vitamin E in reducing cramps; ‐0.24 cramps (95% CI ‐1.29 to 0.81) (see Analysis 2.1, Figure 7).
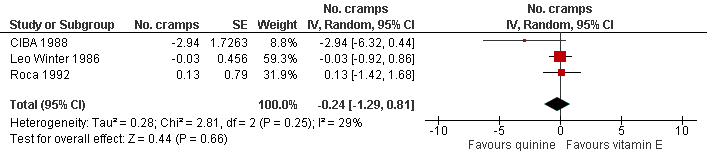
Forest plot of comparison: 2 Quinine versus vitamin E, outcome: 2.1 Difference in number of cramps in 2 weeks ‐ random‐effects (minus Connolly 1992).
Change in cramp intensity during treatment period
Four trials (CIBA 1988; Connolly 1992; Leo Winter 1986; Roca 1992) compared quinine to vitamin E, and in none was there a significant difference between the two treatments in reducing cramp intensity.
Following sensitivity analysis, Connolly 1992 was again removed, reducing I² to 0. The combined result from the remaining three trials (n = 513) showed that quinine was not significantly better than vitamin E in reducing cramp intensity (‐0.06 units, 95% CI ‐0.17 to 0.04, see Analysis 2.2).
Change in cramp duration (in minutes)
Only one trial (CIBA 1988, n = 256) measured cramp duration for this comparison. A descriptive scale was used (0 'none', 1 'short', 2 'moderate' and 3 'long') and the difference between quinine and vitamin E on this scale was nonsignificant at two weeks (‐0.06 units, 95% CI ‐0.13 to 0.01).
Change in number of cramp days
From the four trials comparing quinine with vitamin E, the number of cramp days was an outcome in three (CIBA 1988; Connolly 1992; Leo Winter 1986). The smaller study of Connolly 1992 did not provide statistical comparison of quinine with vitamin E, but did provide sufficient data for this analysis to be made without any statistical assumption; at two weeks, quinine was significantly better than vitamin E in reducing cramp days (‐2.85, 95% CI ‐3.32 to ‐2.38). However, the trial of Connolly 1992 was excluded from the final meta‐analysis (n = 483) due to high heterogeneity (I² dropping from 98% to 48% on exclusion). Accepting the persisting significant heterogeneity, there was no significant difference when quinine was compared to vitamin E (‐0.28 cramp days, 95% CI ‐0.98 to 0.43, random‐effects) (see Analysis 2.3).
Participants with one or more adverse events
Three of the four vitamin E trials provided results for adverse events. The trial that did not mention adverse events set out with the intention to do so but no mention of this was later given in the paper (Roca 1992).
Minor adverse events
Two studies (CIBA 1988; Leo Winter 1986) were entered into the meta‐analysis as Connolly 1992 failed to give any detail on minor adverse events. Sixty‐nine participants (19.9%) from a total of 346 participants treated with quinine experienced minor adverse events compared to 57 out of 342 on vitamin E (16.7%). There was no significant risk difference between the two groups (RD 2%, 95% CI ‐4% to 9%, random‐effects) (Analysis 2.4). There was unexplained heterogeneity (I² = 36%).
Several participants suffered more than one minor adverse event and by symptomatology these were mainly: headache (29 in quinine group versus 24 in vitamin E group), gastrointestinal (17 versus 14), tinnitus (4 versus 0), and visual disturbance (1 versus 3).
Major adverse events
Three studies (CIBA 1988; Connolly 1992; Leo Winter 1986) could be entered into the meta‐analysis. Four participants (1.06%) withdrew from a total of 376 participants treated with quinine compared to one of 372 participants on vitamin E (0.27%). There was no significant risk difference between the two groups (RD 1%, 95% CI ‐1% to 2%) (Analysis 2.5). We used a random‐effects model, as the exclusion of Connolly 1992 did not reduce the significant heterogeneity found with the fixed‐effect model.
The four withdrawals from the quinine groups all complained of gastrointestinal symptoms, but also rash and paraesthesia (one participant), headache (two participants), and pruritus with bruising (one participant). This last participant would not permit follow‐up (Connolly 1992), whilst all symptoms resolved soon after cessation of quinine in the other three (CIBA 1988). The only participant to withdraw from the vitamin E group suffered from severe headache with nausea and vomiting, but was found to have a history of migraine.
Quinine versus a quinine‐vitamin E combination
Primary outcome measure: difference in number of cramps (occurring day or night) during a two‐week treatment period
Three unpublished studies (n = 510) compared quinine with a combination of quinine and vitamin E (Q‐Vel); two of these trials claimed superiority of the quinine‐vitamin E combination over quinine alone (BioDesign 1984; Leo Winter 1986), whilst one reported no significant difference (CIBA 1988). The BioDesign 1984 study did not report data that could be included in the meta‐analysis. We identified significant heterogeneity in the meta‐analysis of the remaining two studies (CIBA 1988; Leo Winter 1986). This could not be explained, so we used a random‐effects model (I² = 49%); there was a nonsignificant difference in cramp number when quinine alone was compared to the quinine‐vitamin E combination (1.07 cramps, 95% CI ‐1.08 to 3.23) (see Analysis 3.1, Figure 8).

Forest plot of comparison: 3 Quinine versus a quinine‐vitamin E combination (Q‐Vel), outcome: 3.1 Difference in number of cramps in 2 weeks ‐ random‐effects.
Change in cramp intensity during treatment period
Three trials (n = 510), all unpublished, compared quinine to a quinine‐vitamin E combination (BioDesign 1984; CIBA 1988; Leo Winter 1986) and reported the change in cramp intensity.
We used a random‐effects model for the meta‐analysis because of unexplained heterogeneity. Accepting significant heterogeneity (I² = 74%) in the results, there was no significant difference between quinine and the quinine‐vitamin E combination with regards to cramp intensity (0.10, 95% CI ‐0.06 to 0.26) (see Analysis 3.2).
Change in cramp duration (in minutes)
Two trials (n = 299) measured cramp duration for this comparison, but could not be included in a meta‐analysis as grouped (BioDesign 1984) or descriptive (CIBA 1988) data only were available. There was no significant difference between quinine and quinine‐vitamin E combination in either study.
Change in number of cramp days
Two of the three trials involving a quinine‐vitamin E combination measured the number of cramp days as an outcome (CIBA 1988; Leo Winter 1986). The combined result of these two trials (n = 486) showed no significant difference between quinine and the quinine‐vitamin E combination (0.18 cramp days, 95% CI ‐1.13 to 1.49, random‐effects) (see Analysis 3.3). There was however significant unexplained heterogeneity (81%) in the results.
Participants with one or more adverse events
Minor adverse events
Three trials (BioDesign 1984; CIBA 1988; Leo Winter 1986) were entered in the meta‐analysis. Seventy‐two participants out of the 370 (19.5%) taking quinine suffered from minor adverse events compared to 64 from 369 (17.3%) taking the quinine‐vitamin E combination. We used a random‐effects model as there was significant heterogeneity that could not be explained. The weighted RD was not significant at 3% (95% CI ‐4% to 10%) (Analysis 3.4). The adverse events mainly included: headache (29 participants on quinine versus 29 on quinine‐vitamin E), gastrointestinal (20 versus 17), tinnitus (4 versus 4), rashes (2 versus 0), pruritis (3 versus 1), visual disturbance (1 versus 1).
Major adverse events
Three trials (BioDesign 1984; CIBA 1988; Leo Winter 1986) were entered in the meta‐analysis. There were no major adverse events in the Leo Winter 1986 (n = 205) or BioDesign 1984 (n = 24) cross‐over trials. There were three participant withdrawals from each group in the CIBA 1988 trial. Thus, three participants (0.81%) withdrew from a total of 370 participants treated with quinine compared to three out of 369 on the quinine‐vitamin E combination (0.81%). The combined meta‐analysis thus showed no risk difference (RD 0%, 95% CI ‐1% to 1%) (Analysis 3.5).
The adverse events suffered by those participants withdrawing from the quinine‐vitamin E group included: flu‐like symptoms, mild tinnitus, nausea, vomiting and diarrhoea, all of which resolved on cessation of medication. One participant was hospitalised with abdominal pain, headache, diffuse myalgias and fever, but their condition was never judged to be serious and improved with cessation of treatment (CIBA 1988). The three withdrawals from the quinine group all complained of gastrointestinal symptoms but also headache in one, and rash and paraesthesia in another (CIBA 1988). Again all resolved on cessation of treatment.
Quinine versus a quinine‐theophylline combination
Primary outcome measure: difference in number of cramps (occurring day or night) during a two‐week treatment period
A single parallel‐group study conducted by a pharmaceutical company (Gorlich 1991, n = 77 excluding placebo group) compared quinine to a quinine‐theophylline combination known as Limptar®. Standardised results from the second treatment week showed quinine was at a significant disadvantage compared to the quinine‐theophylline combination, giving 3.8 more cramps (95% CI 1.08 to 6.52) over two weeks, representing a 136% (95% CI 39% to 233%) difference.
Change in cramp intensity during treatment period
The Gorlich 1991 trial (n = 77 excluding placebo group) found that quinine alone was significantly less effective than the quinine‐theophylline combination in reducing cramp intensity (0.32 units, 95% CI 0.11 to 0.53) on a three‐point scale, representing a 168% (95% CI 58% to 279%) higher intensity.
Change in cramp duration (in minutes)
The Gorlich 1991 trial (n = 77) grouped cramp duration into three time intervals, meaning that individual cramp durations could not be ascertained. However, on their three‐point scale, quinine alone was significantly less effective than the quinine‐theophylline combination in reducing cramp duration (0.17 units, 95% CI 0.06 to 0.28), representing a 106% (95% CI 38% to 175%) longer cramp duration with quinine.
Change in number of cramp days
The Gorlich 1991 study (n = 77) reported a significantly higher incidence of cramp days over two weeks (2.2 cramp days, 95% CI 0.58 to 3.82) with the quinine group compared to the quinine‐theophylline combination, representing a 101% increase (95% CI 27% to 175%).
Participants with one or more adverse events
Minor adverse events
In the Gorlich 1991 trial, four participants suffered adverse events in the quinine‐theophylline combination group (n = 34). These included low blood pressure with dizziness (one participant), nausea and palpitations (two participants) and tinnitus (one participant). Three of these participants withdrew from the study but it is not clear from the study which participants these were. There was thus one minor adverse event in the quinine‐theophylline group (n = 34), which compares with one minor adverse event (nausea and vomiting) in the quinine group (n = 43) (Gorlich 1991).
Major adverse events
There were three withdrawals from the quinine‐theophylline group (n = 34), and this compares with two drop‐outs from the quinine group (n = 43), with nausea and vomiting.
Quinine versus xylocaine injection
Prateepavanich 1999 (n = 24) was the only trial to compare quinine with 1% xylocaine injections into the medial head of the gastrocnemius muscle. Both treatments reduced cramp number significantly from baseline but there was no significant difference between the groups after four weeks treatment. However, xylocaine's beneficial effect lasted longer; four weeks after treatment cessation, quinine had a significant disadvantage compared to xylocaine (1.35 cramps, 95% CI 0.52 to 2.18).
Change in cramp intensity during treatment period
In the Prateepavanich 1999 trial (n = 24) both treatments reduced cramp intensity significantly from baseline, but there was no significant difference between the groups at four weeks. However, at the follow‐up appointment four weeks after treatment cessation, the quinine group was at a significant disadvantage compared to xylocaine (0.72 units on a three‐point scale, 95% CI 0.24 to 1.20).
Change in cramp duration (in minutes)
In the Prateepavanich 1999 trial (n = 24) both treatments reduced cramp duration significantly from baseline, but there was no significant difference between the groups at four weeks. However, at the follow‐up appointment four weeks after treatment cessation, quinine was at a significant disadvantage compared to xylocaine (0.5 minutes, 95% CI 0.09 to 0.91).
Change in number of cramp days
The number of cramp days was not an outcome in the Prateepavanich 1999 trial.
Participants with one or more adverse events
Minor adverse events
There were no minor adverse events in the Prateepavanich 1999 study.
Major adverse events
The Prateepavanich 1999 study reported the withdrawal of two participants from the quinine treatment group (n = 10) due to 'cinchonism'. Details of the specific adverse events experienced by each participant were not provided, and no follow‐up is given. No adverse events occurred in the xylocaine injection group (n = 12).
Discussion
Quinine versus placebo
There is low quality evidence of a statistically significant benefit of quinine in reducing cramp number over two weeks (the primary outcome) and moderate quality evidence for a reduction in cramp intensity (summary of findings Table for the main comparison). Quinine also reduced the number of cramp days over two weeks. The only outcome which was not significantly different from placebo was that of cramp duration. The Summary of findings table does not present data for cramp duration and cramp days, but using GRADE criteria, we consider the quality of the evidence for these outcomes as moderate and low, respectively, owing to study design limitations and additionally for cramp days, heterogeneity.
Significant unexplained heterogeneity was notable in many of the meta‐analyses, reflecting the variable results between the included studies, and this may reduce the confidence in the conclusions. It is this heterogeneity which has led to the lack of a clear consensus on this subject. As little is known about the pathophysiology of cramps or the mechanism of action of quinine, it is difficult to explain why quinine should have no significant effect on cramp duration, yet seems to reduce cramp number and intensity. However, cramp duration is probably the most difficult to judge.
The first meta‐analysis by Man‐Son‐Hing included six small cross‐over trials (n = 107) (Man‐Son‐Hing 1995). Later, the same group performed a second meta‐analysis that included four published and three unpublished trials (n = 659) (Man‐Son‐Hing 1998); this demonstrated that quinine was effective in reducing cramp number (21% reduction; 95% CI 12% to 30%), and intensity (‐0.13 unit on a three‐point scale, P = 0.002). This is broadly in line with the results of our meta‐analysis.
The American Academy of Neurology reviewed a variety of treatments for muscle cramp and found that there was Level A evidence that quinine was effective (Katzberg 2010). As this was not a meta‐analysis, there are no figures for comparison. Only 12 studies containing quinine were included in the review, and none of these were unpublished trials. The report recommends the avoidance of quinine for leg cramps unless absolutely necessary, because of its potentially serious side‐effect profile. The review of adverse events also consisted of case reports and case series where high doses of quinine were being used for the treatment of malaria.
Quinine versus other treatments
This meta‐analysis showed there was no significant difference between quinine and vitamin E, or between quinine and a quinine‐vitamin E combination (summary of findings Table 2 and summary of findings Table 3). This would suggest that vitamin E alone may be as effective as quinine in reducing cramp number, intensity, and days, but that its effect when combined with quinine is not significantly additive.
We removed Connolly 1992 after sensitivity analyses for methodological reasons. However, inclusion of this study would make quinine seem significantly more effective than vitamin E at reducing cramp number and days. Vitamin E is generally regarded as safe, but a meta‐analysis (Miller 2005) suggested that high‐dose vitamin E (400 IU/d or more) may increase all‐cause mortality and should be avoided.
A single study (n = 77) performed by a pharmaceutical company suggested that a quinine‐theophylline combination was significantly more effective than quinine alone across all outcomes (Gorlich 1991). There were no additional adverse events. More trials are needed containing quinine‐theophylline to support or refute these findings.
Cramps with an identified myofascial trigger point may be more unusual. One trial (Prateepavanich 1999, n = 24) showed that quinine did not differ significantly from xylocaine injections into these trigger points after four weeks treatment, but that the xylocaine injections were significantly more effective at the eight‐week follow‐up (four weeks after treatment cessation). Further long‐term studies are required to replicate this finding and assess the feasibility of its application.
Effect of quinine dose and duration
Dose
Accumulation of quinine with daily dosing can be expected because its half‐life is between 9 and 11 hours in young people (Berlin 1975; Mutual 2006) and up to 19 hours in the elderly (Smith 1985; Warburton 1987). Despite these pharmacokinetic changes in the elderly, an alteration in the quinine dosage regimen in elderly people is not recommended by the manufacturers of one quinine product (Qualaquin) (Mutual 2006).
Two trials showed a significant positive correlation between serum quinine levels and reductions in cramp number (Lee 1991; Warburton 1987), whilst one trial showed no correlation (Woodfield 2005). In the Lee 1991 trial where 200 mg quinidine was given twice daily, the mean (SD) peak and trough serum levels at two weeks were 1.3 (0.1) mg/L and 0.7 (0.1) mg/L respectively. Two participants who did not show a significant response to quinidine were found to have low trough serum levels (0.2 mg/L and 0.3 mg/L); upon increasing the dose to 600 mg daily, trough levels improved to 0.6 and 0.7 mg/L and significant reductions in cramp number were then achieved. This indicates that quinine therapy may benefit from monitoring serum drug levels and adjusting dosage accordingly. Further trials are needed to elucidate the optimum therapeutic range for quinine in muscle cramps.
In the trials identified for this meta‐analysis, there was a trend of increasing effect with quinine doses of 300 mg to 500 mg. However, the results with lower doses (200 mg to 260 mg) go against this trend. This, however, is a very limited analysis as there was a shortage of studies in each dosage group and also several confounding variables. The Connolly 1992 trial was the only one to use a dose of 500 mg quinine; the adverse events experienced were comparable to those in the other trials.
Duration
The optimum treatment duration with quinine has equally not been investigated. The Connolly 1992 study suggested that quinine was rapidly effective, achieving a 50% reduction in cramp number in almost half the participants by three days. One trial (Leo Winter 1986) showed that a short five‐day course was sufficient to bring about significant change, whilst two trials recommended seven days (BioDesign 1984; CIBA 1988).
Most studies showed greater effect the longer quinine was continued; for example, cramp reductions were more significant in the second treatment week than the first in the Gorlich 1991 trial. However, the opposite was found in the CIBA 1988 trial where significant reductions after week one became nonsignificant in week two. The duration of treatment varied from 5 to 60 days in the included trials. Of the five trials with the greatest reductions in cramp number by quinine, four were achieved by the longest trials, with treatment durations of 42 days (Woodfield 2005) and 28 days (Connolly 1992; Fung 1989; Lee 1991).
Quinine was found to have significant lasting effects at two weeks after treatment cessation in three trials (Diener 2002; Jansen 1994; Jansen 1997), and at four weeks in another (Prateepavanich 1999). If continuous therapy is not needed, then knowing the duration of quinine's effect after cessation will allow the determination of suitable periods for 'drug holidays' and also for the required washout periods in new trials.
Adverse events due to quinine
The adverse events attributed to quinine can be divided into three types: those arising from hypersensitivity reactions which may occur immediately or after years of treatment (thrombocytopenia, disseminated intravascular coagulation, acute renal failure, haemolytic uraemic syndrome), those reversible adverse events that are dose‐dependent and can occur with normal use (gastrointestinal upset, tinnitus, vertigo, visual disturbance), and those that arise from toxic overdose (cardiac arrhythmias, blindness, seizures) (Bateman 1985; Knower 2003; Morton 2002; Prasad 2003; Schneemann 2006). All but one of the adverse events occurring from the trials included in this meta‐analysis fall into the second group; these dose‐related adverse events can occur with normal therapeutic use of quinine, but are more common when plasma quinine levels rise above 5 mg/L (Mandal 1995; Schneemann 2006).
Quinine has been implicated in accidental and intentional poisoning. The Scottish Poisons Information Bureau reported 96 such cases (out of a population of 5.2 million) over five years across a wide range of ages and overdosage; 38% of these patients were asymptomatic, 23% suffered visual toxicity, 19% auditory toxicity, 15% cardiotoxicity, 14% gastrointestinal symptoms, and 11% reduced Glasgow Coma Scale (Langford 2003).
Renal impairment and interactions with other medication (such as digoxin, anticoagulants and phenothiazines) must also be borne in mind (Pederson 1985), as well as the fact that memory loss in the elderly may make people vulnerable to overdosage of quinine.
This meta‐analysis showed that significantly more people suffered minor adverse events on quinine than placebo but no difference in major adverse events. Gastrointestinal upset in the form of nausea, vomiting and abdominal pain was the most common adverse event (5.7%, n = 806), followed by headache (4.7%), and tinnitus (1.4%). Pruritus, scaly rashes, dizziness, visual disturbances, and fever were rare. The only minor adverse events that were significantly higher with quinine were gastrointestinal events. This compares with Man‐Son‐Hing 1998 which showed that tinnitus was the only minor adverse event that was significantly more common with quinine.
Though 12 participants withdrew from quinine treatment due to side effects, these tended to be benign adverse events, and may or may not have been related to quinine; indeed, a total of 11 participants withdrew from placebo treatment, some with similar adverse events. There was however one serious adverse event which was likely to be attributed to quinine: one participant in the Sidorov 1993 trial suffered leukopenia and thrombocytopenia, with a severe rash, myalgia, and nausea. His symptoms resolved three days after stopping quinine.
In the placebo‐controlled trials, there were 1103 unique participants in the meta‐analysis of major adverse events and 969 unique participants in the minor adverse events meta‐analysis (the treatment groups contained many participants from cross‐over trials so the total numbers in both groups should not be summated). On the basis of these, quinine appears to be reasonably safe, but it is not possible to accurately calculate the true incidence of serious or life‐threatening side effects which are rare. A case‐control study in the USA estimated that quinine‐induced thrombocytopenia occurs in 26 of every 1 million users (Kaufman 1993).
Between 1969 and 1990, 110 serious adverse events with suspected links to quinine were reported to the Food and Drug Administration (FDA 1995b). However, the FDA judged that of the 110 reports, only 26 could reasonably be attributed to quinine; 21 of these cases involved quinine doses used in the treatment of leg cramps. There were no cases of overdose, but there were three deaths (FDA 1995b). There were six cases of severe skin reactions (two of which were erythema multiforme), 13 'haematological events' (two resulting in death), two cases of hepatitis, two cases of renal failure (one resulting in death, the other dialysis‐dependence), two cases of hypersensitivity syndrome ("chills, nausea, vomiting, diarrhoea"), and one case of anaphylaxis complicated by seizures and hypoxia following a single dose of quinine (FDA 1995b). Although this is invaluable information, the incidence of such adverse events still cannot be ascertained as the size of the treated population is unknown and not all serious side effects are reported to the FDA. It is however on the basis of these serious adverse effects that the FDA has banned the marketing of quinine for muscle cramps (FDA 2006) and that the American Academy of Neurology has recommended in their report (Katzberg 2010) that it only be used as a last resort in intractable cramps and with close monitoring.
Haemodialysis and liver cirrhosis
Muscle cramps are more common in people on haemodialysis (Chou 1985; Khajehdehi 2001) and in those with liver cirrhosis (Abrams 1996; Angeli 1996). Two trials (Kaji 1976; Roca 1992) involved participants with cramps related to dialysis, and quinine significantly reduced cramp number in both, along with cramp intensity in one (Roca 1992), and duration in the other (Kaji 1976). Serum levels of quinine were not monitored, but there were no reports of toxicity with doses of 325 mg daily (Roca 1992) and 320 mg thrice weekly (Kaji 1976). The manufacturers of a quinine product (Qualaquin) state that negligible amounts of quinine are removed from the blood during dialysis, and that the half‐life in people with severe renal impairment who are not on dialysis is increased to 26 hours, despite the vast majority of quinine being metabolised by the liver (Mutual 2006). The manufacturers thus recommend lower doses of quinine in people with severe renal impairment who require treatment for malaria (less than half the normal dose) (Mutual 2006).
One trial included 31 participants with liver cirrhosis and found the optical isomer of quinine, quinidine, to be significantly effective in reducing cramp number, with no sign of serum accumulation (Lee 1991). The manufacturers of Qualaquin state that although the elimination half‐life is increased in people with mild to moderate hepatic impairment, dosage adjustment is not needed as weight‐adjusted clearance remains the same (Mutual 2006).
Risk of bias and trial quality
Almost all of the trials included in this meta‐analysis had methodological limitations. As with all meta‐analyses, this leads to exclusion of some trials from some analyses, or the inclusion of data imputed from the published data. Each of the methodological flaws potentially impairs the quality of the data and the power of the meta‐analysis. Specific limitations included inadequate washout periods in cross‐over studies (Dunn 1993; Kaji 1976; Leo Winter 1986; Maule 1990; Smith 1985; Warburton 1987; Woodfield 2005), small number of participants (all but four trials contained less than 100 participants), inadequate explanations of methodology (for example randomisation and blinding), and poor statistical presentation (including lack of mean and standard error figures for outcomes).
A common problem was the lack of explanations for drop‐outs and the lack of intention‐to‐treat analyses. Many of the trials failed to elaborate on adverse events, which lie at the heart of the debate of quinine's benefit‐risk ratio. Only four trials (Lee 1991; Smith 1985; Warburton 1987; Woodfield 2005) measured serum quinine concentrations, which is not only helpful in determining the dose‐response relationship for muscle cramp, but allows the ceiling effect to be estimated (the level above which the risks of serious adverse events becomes significant).
It was impossible to exclude the confounding factor of physiological interventions. Some participants may have used various stretch exercises in addition to their allocated treatment and this may have influenced the outcomes to varying degrees. One study reported that seven out of the 10 participants used stretches to relieve cramp in the acute phase, although the outcomes in this trial did not include cramp duration or intensity (Woodfield 2005).
Other considerations
No study addressed the health economics of quinine; this is most likely because the trials were conducted when quinine was readily and cheaply available in the USA. Recently, however, the cost has risen sharply in the USA due to the FDA's ban on the marketing of quinine for muscle cramps, with the only approved brand being Qualaquin (Mutual Pharmaceutical) for falciparum malaria. Quinine in Europe, however, remains readily available and inexpensive; for instance in the UK each generic 300 mg tablet costs just under GBP 0.08 (USD 0.12). This compares with around USD 5.00 per 324 mg capsule of Qualaquin in the USA (Mutual Pharmaceutical).
The difference between the USA and Europe with regards to quinine use in muscle cramps is striking. Whilst it can only be used off‐label in the USA for muscle cramps, in the UK quinine is fully licensed and regularly prescribed by general practitioners for people suffering from muscle cramp. It can be bought over the counter in Germany.
The British National Formulary (BNF) advises that it may take up to four weeks for the effect on cramp to become apparent and that if there is improvement, then quinine should be taken continuously with close monitoring for adverse events (BNF 2010). The BNF also advises interruption of treatment every three months for review of benefit. Some studies have suggested that there are people who benefit from quinine and some who do not (Connolly 1992; Woodfield 2005); this may be due to inadequate serum concentrations in some, or other factors which have yet to be identified. There is also no current evidence to predict who will suffer serious adverse events, and so it has been suggested that a trial of quinine be used on an individual basis to identify those who will safely benefit from therapy, and prevent others from unnecessary and possibly harmful long‐term medication (Woodfield 2005).
It has also been stated that before starting a trial of quinine, reversible causes of cramp such as hypothyroidism, electrolyte imbalance and the presence of cramp‐inducing medication should be considered (Guay 2008; Miller TM 2005). An audit of prescribing patterns in general practice showed that out of 70 people prescribed quinine for muscle cramp, over half were taking medications known to cause cramps (Mackie 1995).
There is a paucity of data concerning the use of quinine in pregnancy (Nosten 2006). Quinine crosses the placenta and is also excreted in breast milk, although breast feeding whilst on quinine is not contraindicated (AAP 2001). In very high doses, quinine can be teratogenic; in pregnant women who took overdoses of quinine, abortion was very rare but congenital anomalies occurred with central nervous system, limb, facial and cardiac defects (Nishimura 1976), optic nerve hypoplasia and deafness (McKinna 1966; Morgon 1971). However, at doses used in malaria, quinine appears to be safe in pregnancy (BNF 2010; McGready 2001; McGready 2002; Nosten 2002; Orton 2008) and does not increase the risk of abortion or preterm delivery (Phillips‐Howard 1996). There are, however, the expected side effects on the mother with the high doses used in malaria (Piola 2010). The World Health Organization recommends that quinine be used as first‐line treatment for uncomplicated falciparum malaria in the first trimester of pregnancy, and third‐line treatment in the second and third trimesters because of an increased risk of maternal hypoglycaemia in late pregnancy (WHO 2010). It is likely that the benefits of treatment outweigh the risks when treating pregnant women with malaria, but this may not be the case with muscle cramps. Magnesium salts may be a safer alternative for the treatment of cramps in pregnant women (Dahle 1995; Young 2002).

Methodological quality summary: review authors' judgements about each methodological quality item for each included study. Red = high risk of bias; yellow = unclear risk of bias; green = low risk of bias.

Forest plot of comparison: 1 Quinine versus placebo, outcome: 1.2 Difference in number of cramps over 2 weeks ‐ random‐effects (minus Connolly 1992).

Forest plot of comparison: 1 Quinine versus placebo, outcome: 1.7 Participants suffering minor adverse events ‐ fixed‐effect.

Forest plot of comparison: 1 Quinine versus placebo, outcome: 1.8 Participants suffering specific minor adverse events.

Forest plot of comparison: 1 Quinine versus placebo, outcome: 1.9 Participants suffering major adverse events.
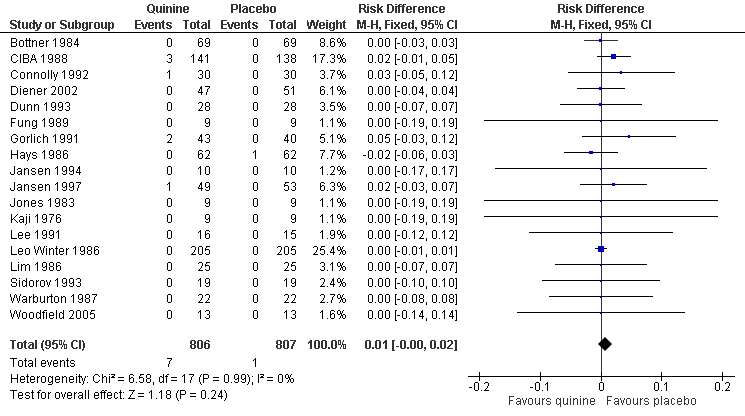
Forest plot of comparison: 1 Quinine versus placebo, outcome: 1.10 Participants suffering specific major adverse events (gastrointestinal).

Forest plot of comparison: 2 Quinine versus vitamin E, outcome: 2.1 Difference in number of cramps in 2 weeks ‐ random‐effects (minus Connolly 1992).
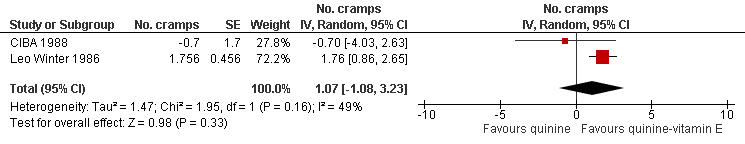
Forest plot of comparison: 3 Quinine versus a quinine‐vitamin E combination (Q‐Vel), outcome: 3.1 Difference in number of cramps in 2 weeks ‐ random‐effects.
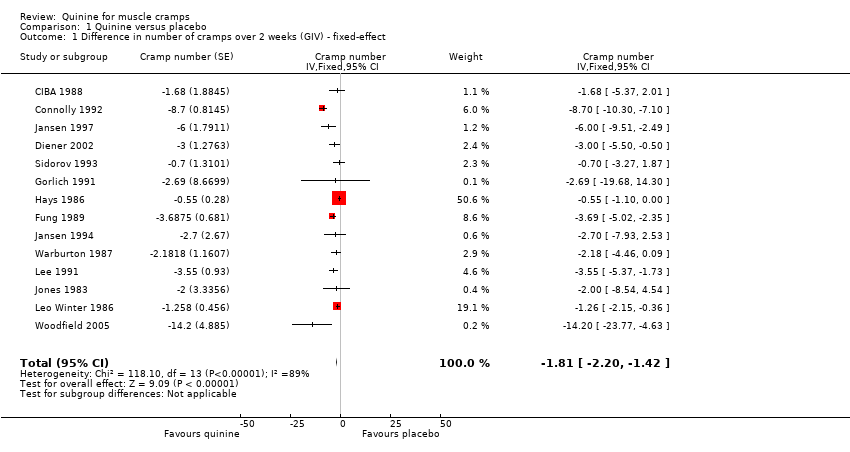
Comparison 1 Quinine versus placebo, Outcome 1 Difference in number of cramps over 2 weeks (GIV) ‐ fixed‐effect.

Comparison 1 Quinine versus placebo, Outcome 2 Difference in number of cramps over 2 weeks ‐ random‐effects (minus Connolly 1992).

Comparison 1 Quinine versus placebo, Outcome 3 Difference in number of cramps according to quinine dose (GIV) ‐ fixed‐effect.

Comparison 1 Quinine versus placebo, Outcome 4 Difference in cramp intensity (GIV) ‐ fixed‐effect.

Comparison 1 Quinine versus placebo, Outcome 5 Change in cramp duration (min) ‐ random‐effects.

Comparison 1 Quinine versus placebo, Outcome 6 Difference in number of cramp days over 2 weeks (GIV) ‐ random‐effects (minus Connolly 1992.
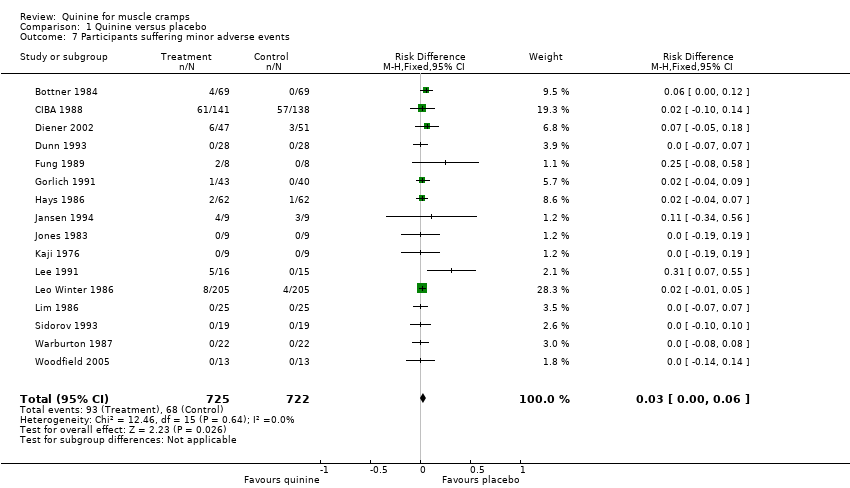
Comparison 1 Quinine versus placebo, Outcome 7 Participants suffering minor adverse events.
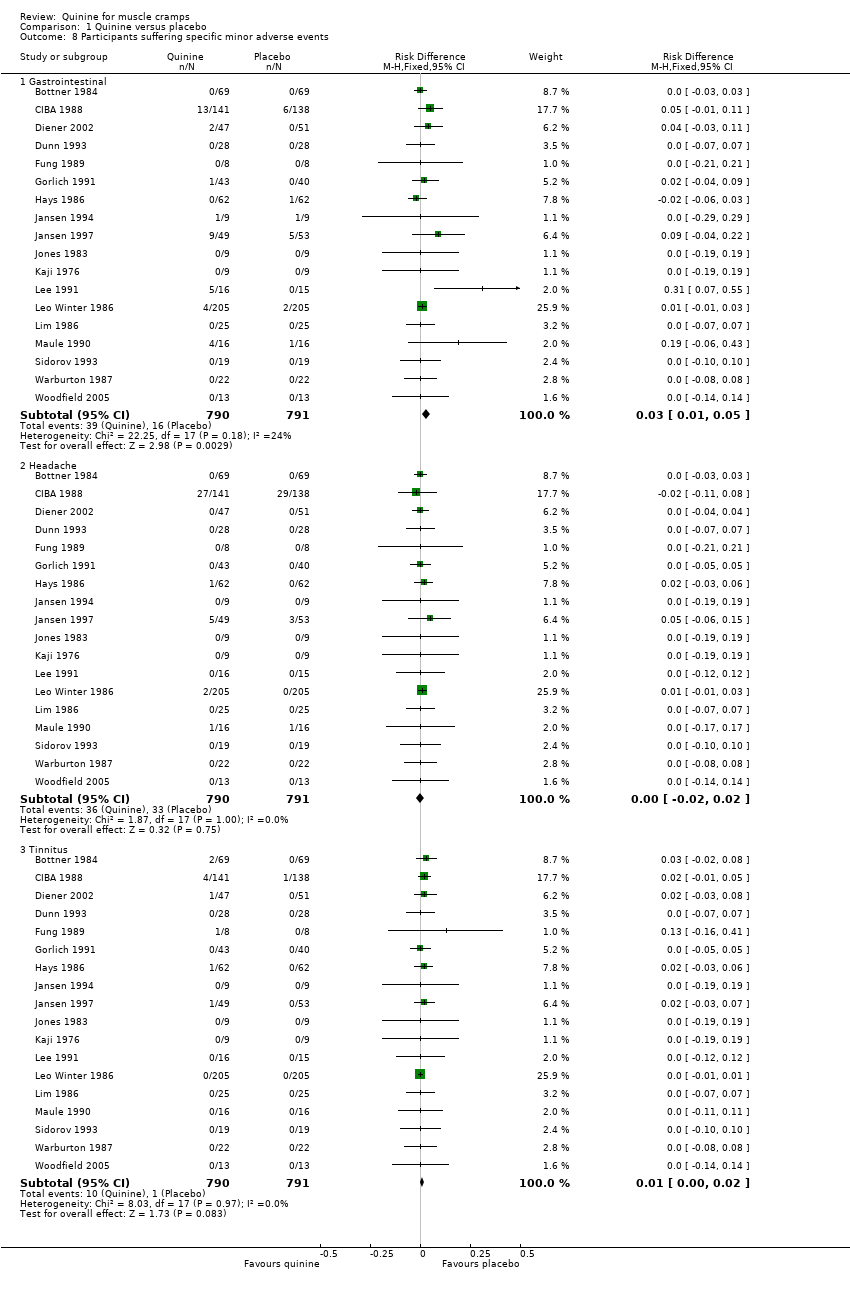
Comparison 1 Quinine versus placebo, Outcome 8 Participants suffering specific minor adverse events.

Comparison 1 Quinine versus placebo, Outcome 9 Participants suffering major adverse events.

Comparison 1 Quinine versus placebo, Outcome 10 Participants suffering specific major adverse events (gastrointestinal).

Comparison 2 Quinine versus vitamin E, Outcome 1 Difference in number of cramps in 2 weeks ‐ random‐effects (minus Connolly 1992).

Comparison 2 Quinine versus vitamin E, Outcome 2 Difference in cramp intensity ‐ fixed‐effect.

Comparison 2 Quinine versus vitamin E, Outcome 3 Difference in number of cramp days over 2 weeks ‐ random‐effects (minus Connolly 1992).
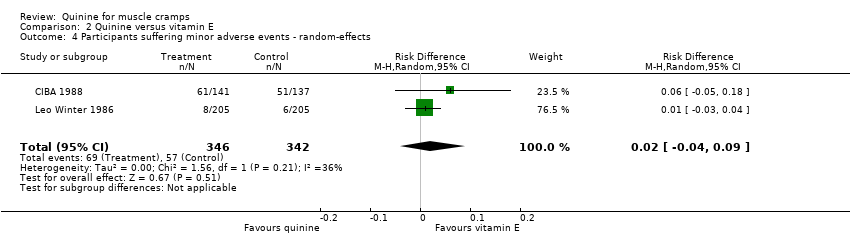
Comparison 2 Quinine versus vitamin E, Outcome 4 Participants suffering minor adverse events ‐ random‐effects.

Comparison 2 Quinine versus vitamin E, Outcome 5 Participants suffering major adverse events ‐ random‐effects.

Comparison 3 Quinine versus a quinine‐vitamin E combination (Q‐Vel), Outcome 1 Difference in number of cramps in 2 weeks ‐ random‐effects.
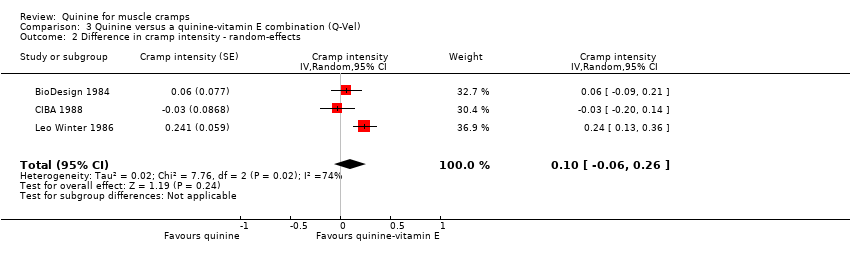
Comparison 3 Quinine versus a quinine‐vitamin E combination (Q‐Vel), Outcome 2 Difference in cramp intensity ‐ random‐effects.

Comparison 3 Quinine versus a quinine‐vitamin E combination (Q‐Vel), Outcome 3 Difference in number of cramp days over 2 weeks ‐ random‐effects.

Comparison 3 Quinine versus a quinine‐vitamin E combination (Q‐Vel), Outcome 4 Participants suffering minor adverse events ‐ random‐effects.

Comparison 3 Quinine versus a quinine‐vitamin E combination (Q‐Vel), Outcome 5 Participants suffering major adverse events ‐ fixed‐effect.
| Quinine for muscle cramps | ||||||
| Patient or population: people with muscle cramps | ||||||
| Outcomes | Illustrative comparative risks* (95% CI) | Relative effect | No of Participants | Quality of the evidence | Comments | |
| Assumed risk | Corresponding risk | |||||
| Placebo | Quinine | |||||
| Number of cramps over 2 weeks | The mean number of cramps over 2 weeks in the control groups was | The mean number of cramps over 2 weeks in the intervention groups was | 952 | ⊕⊕⊝⊝ | The difference was statistically significant. | |
| Cramp intensity | The mean cramp intensity in the control groups was | The mean cramp intensity in the intervention groups was | 666 | ⊕⊕⊕⊝ | The difference was statistically significant. | |
| Participants suffering major adverse events | 14 per 1000 | 15 per 1000 | See comment | 1103 | ⊕⊕⊕⊝ | Risks were calculated from pooled risk differences. The difference was not statistically significant. |
| Participants suffering minor adverse events | 94 per 1000 | 127 per 1000 | See comment | 969 | ⊕⊕⊕⊝ | Risks were calculated from pooled risk differences. The difference was statistically significant. |
| *The basis for the assumed risk (e.g. the median control group risk across studies) is provided in footnotes. The corresponding risk (and its 95% CI) is based on the assumed risk in the comparison group and the relative effect of the intervention (and its 95% CI). | ||||||
| GRADE Working Group grades of evidence | ||||||
| 1There were significant shortcomings in study design in some trials, but the majority of those included in this meta‐analysis were of moderate to high quality, warranting a single downgrading for limitations in design and implementation. We further downgraded the evidence for this outcome to low quality because of the heterogeneity of the results.2Major adverse events were defined as those being severe enough to warrant participant withdrawal from the trial. As specific hypersensitivity reactions are so rare, larger studies are needed to clarify the incidence of such adverse events in particular. Some trials did not prespecify adverse events as an outcome but simply reported them retrospectively, thus compromising slightly on the quality of evidence. | ||||||
| Quinine versus vitamin E for muscle cramps | ||||||
| Patient or population: people with muscle cramps | ||||||
| Outcomes | Illustrative comparative risks* (95% CI) | Relative effect | No of Participants | Quality of the evidence | Comments | |
| Assumed risk | Corresponding risk | |||||
| Vitamin E | Quinine | |||||
| Number of cramps over 2 weeks | The mean number of cramps over 2 weeks in the control groups was | The mean number of cramps over 2 weeks in the intervention groups was | 513 | ⊕⊕⊝⊝ | The difference was not statistically significant. | |
| Cramp intensity | The mean cramp intensity in the control groups was | The mean cramp intensity in the intervention groups was | 513 | ⊕⊕⊕⊝ | The difference was not statistically significant. | |
| Participants suffering major adverse events | 3 per 1000 | 9 per 1000 | See comment | 513 | ⊕⊕⊕⊝ | Risks were calculated from pooled risk differences. The difference between the 2 groups was not statistically significant. |
| Participants suffering minor adverse events | 167 per 1000 | 189 per 1000 | See comment | 483 | ⊕⊕⊕⊝ | Risks were calculated from pooled risk differences. The difference between the 2 groups was not statistically significant. |
| *The basis for the assumed risk (e.g. the median control group risk across studies) is provided in footnotes. The corresponding risk (and its 95% CI) is based on the assumed risk in the comparison group and the relative effect of the intervention (and its 95% CI). | ||||||
| GRADE Working Group grades of evidence | ||||||
| 1Only 3 trials were available for this comparison, 2 of which were conducted by pharmaceutical investigators on behalf of manufacturers of quinine. A deficiency in the design of 1 of these trials meant that there was only a 2‐day washout between cross‐over treatments. | ||||||
| Quinine versus a quinine‐vitamin E combination (Q‐Vel) for muscle cramps | ||||||
| Patient or population: people with muscle cramps | ||||||
| Outcomes | Illustrative comparative risks* (95% CI) | Relative effect | No of Participants | Quality of the evidence | Comments | |
| Assumed risk | Corresponding risk | |||||
| Quinine‐vitamin E combination (Q‐Vel) | Quinine | |||||
| Number of cramps over 2 weeks | The mean number of cramps over 2 weeks in the control groups was | The mean number of cramps over 2 weeks in the intervention groups was | 486 | ⊕⊕⊝⊝ | The difference was not statistically significant. | |
| Cramp intensity | The mean cramp intensity in the control groups was | The mean cramp intensity in the intervention groups was | 510 | ⊕⊕⊝⊝ | The difference was not statistically significant. | |
| Participants suffering major adverse events | 8 per 1000 | 8 per 1000 | See comment | 510 | ⊕⊕⊕⊝ | Risks were calculated from pooled risk differences. |
| Participants suffering minor adverse events | 173 per 1000 | 202 per 1000 | See comment | 510 | ⊕⊕⊕⊝ | Risks were calculated from pooled risk differences. The difference was not statistically significant. |
| *The basis for the assumed risk (e.g. the median control group risk across studies) is provided in footnotes. The corresponding risk (and its 95% CI) is based on the assumed risk in the comparison group and the relative effect of the intervention (and its 95% CI). | ||||||
| GRADE Working Group grades of evidence | ||||||
| 1The results for cramp number in these 2 trials were not consistent, each suggesting opposite effects. | ||||||
| Study | Number of participants Study design Patient focus | Mean age (yrs) | Female | Male | F: M ratio | Quinine dose (mg) | Treatment period (d) | Washout period (d) | Treatment comparisons |
| n = 24 Study design = C Patient focus = I | 57 | 11 | 13 | 0.8 | 260 | 7 | 7 | Quinine‐vitamin E combination (Q‐Vel®)b ✓ | |
| n = 69 Study design = C Patient focus = I | 51 | 66 | 3 | 22.0 | 260 | 14 | 14 | Placebo ✓ | |
| n = 556 Study design = P Patient focus = I | 45 | 393 | 163 | 2.4 | 260 | 14 | n/a | Placebo ✓ Vitamin E ✓ Quinine‐vitamin E combination (Q‐Vel®) ✓ | |
| n = 30 Study design = C Patient focus = I | 59 | 0 | 30 | 0.0 | 500 | 28 | 28 | Placebo ✓ Vitamin E ✓c | |
| n = 28 Study design = C Patient focus = I | 67 | 17 | 11 | 1.5 | 300 | 30 | 3 | Placebo ✓ | |
| n = 94 Study design = P Patient focus = I | 49 | 66 | 32 | 2.1 | 400 | 14 | n/a | Placebo ✓ | |
| n = 9 Study design = C Patient focus = I | 63 | 7 | 1 | 7.0 | 200 | 28 | 7 | Placebo ✓ | |
| n = 164 Study design = P Patient focus = I | 56 | 119 | 45 | 2.6 | 260 | 14 | n/a | Placebo ✓ Quinine‐theophylline combination (Limptar®)b ✓ | |
| n = 62 Study design = C Patient focus = I | 47 | 49 | 13 | 3.8 | 325 | 14 | 14 | Placebo ✓ | |
| n = 20 Study design = P | 55 | 14 | 6 | 2.3 | 300 | 14 | n/a | Placebo ✓ | |
| n = 106 Study design = P Patient focus = I | 51 | 68 | 44 | 1.5 | 300 | 14 | n/a | Placebo ✓ | |
| n = 9 Study design = C Patient focus = I | _ | _ | _ | _ | 300 | 14 | 14 | Placebo ✓ | |
| n = 9 Study design = C Patient focus = H | _ | _ | _ | _ | 320d | 42d | 0 | Placebo ✓ | |
| n = 31 Study design = P Patient focus = L | 62 | 5 | 26 | 0.2 | 400 | 28 | n/a | Placebo ✓ | |
| n = 205 Study design = C Patient focus = I | 44 | 173 | 32 | 5.4 | 260 | 5 | 2 | Placebo ✓ Vitamin E ✓ Quinine‐vitamin E combination (Q‐Vel®) ✓ | |
| n = 25 Study design = P Patient focus = I | _ | _ | _ | _ | 300 | ≤ 14 | n/a | Placebo ✓ | |
| n = 16 Study design = C Patient focus = I | 76 | 10 | 6 | 1.7 | 300 | 21 | 0 | Placebo ✓ | |
| n = 24 Study design = P Patient focus = Ie | 64 | 21 | 3 | 7.0 | 300 | 28 | n/a | Xylocaine injection ✓ | |
| n = 30 Study design = P Patient focus = H | 48 | 10 | 19 | 0.5 | 325 | 60f | n/a | Vitamin E ✓ | |
| n = 19 Study design = C Patient focus = I | 58 | 14 | 2 | 7.0 | 200 | 14 | 14 | Placebo ✓ | |
| n = 21 Study design = C Patient focus = I | 73 | _ | _ | _ | 300 | 21 | 0 | Placebo ✓ | |
| n = 22 Study design = C Patient focus = I | 74 | 16 | 6 | 2.7 | 300 | 21 | 0 | Placebo ✓ | |
| n = 13 Study design = N‐of‐1 Patient focus = I | 75 | 7 | 6 | 1.2 | 200 to 300 | 42 | 0 | Placebo ✓ | |
| Abbreviations: C: cross‐over, P: parallel, H: haemodialysis‐induced cramps, I: idiopathic, L: patients with liver cirrhosis; n/a: not available aUnpublished. | |||||||||
| Outcome or subgroup title | No. of studies | No. of participants | Statistical method | Effect size |
| 1 Difference in number of cramps over 2 weeks (GIV) ‐ fixed‐effect Show forest plot | 14 | Cramp number (Fixed, 95% CI) | ‐1.81 [‐2.20, ‐1.42] | |
| 2 Difference in number of cramps over 2 weeks ‐ random‐effects (minus Connolly 1992) Show forest plot | 13 | Cramp Number (Random, 95% CI) | ‐2.45 [‐3.54, ‐1.36] | |
| 3 Difference in number of cramps according to quinine dose (GIV) ‐ fixed‐effect Show forest plot | 14 | Cramp Number (Fixed, 95% CI) | ‐1.81 [‐2.20, ‐1.42] | |
| 3.1 500 mg quinine | 1 | Cramp Number (Fixed, 95% CI) | ‐8.7 [‐10.30, ‐7.10] | |
| 3.2 400 mg quinine | 2 | Cramp Number (Fixed, 95% CI) | ‐3.36 [‐4.83, ‐1.89] | |
| 3.3 300 to 325 mg quinine | 5 | Cramp Number (Fixed, 95% CI) | ‐0.79 [‐1.31, ‐0.26] | |
| 3.4 260 mg quinine | 3 | Cramp Number (Fixed, 95% CI) | ‐1.29 [‐2.15, ‐0.42] | |
| 3.5 200 mg quinine | 3 | Cramp Number (Fixed, 95% CI) | ‐3.22 [‐4.40, ‐2.04] | |
| 4 Difference in cramp intensity (GIV) ‐ fixed‐effect Show forest plot | 7 | Cramp intensity (Fixed, 95% CI) | ‐0.12 [‐0.20, ‐0.05] | |
| 5 Change in cramp duration (min) ‐ random‐effects Show forest plot | 2 | Change in duration (Random, 95% CI) | ‐1.35 [‐4.00, 1.30] | |
| 6 Difference in number of cramp days over 2 weeks (GIV) ‐ random‐effects (minus Connolly 1992 Show forest plot | 7 | Cramp days (Random, 95% CI) | ‐1.15 [‐1.93, ‐0.38] | |
| 7 Participants suffering minor adverse events Show forest plot | 16 | 1447 | Risk Difference (M‐H, Fixed, 95% CI) | 0.03 [0.00, 0.06] |
| 8 Participants suffering specific minor adverse events Show forest plot | 18 | Risk Difference (M‐H, Fixed, 95% CI) | Subtotals only | |
| 8.1 Gastrointestinal | 18 | 1581 | Risk Difference (M‐H, Fixed, 95% CI) | 0.03 [0.01, 0.05] |
| 8.2 Headache | 18 | 1581 | Risk Difference (M‐H, Fixed, 95% CI) | 0.00 [‐0.02, 0.02] |
| 8.3 Tinnitus | 18 | 1581 | Risk Difference (M‐H, Fixed, 95% CI) | 0.01 [‐0.00, 0.02] |
| 9 Participants suffering major adverse events Show forest plot | 18 | 1613 | Risk Difference (M‐H, Fixed, 95% CI) | 0.00 [‐0.01, 0.02] |
| 10 Participants suffering specific major adverse events (gastrointestinal) Show forest plot | 18 | 1613 | Risk Difference (M‐H, Fixed, 95% CI) | 0.01 [‐0.00, 0.02] |
| Outcome or subgroup title | No. of studies | No. of participants | Statistical method | Effect size |
| 1 Difference in number of cramps in 2 weeks ‐ random‐effects (minus Connolly 1992) Show forest plot | 3 | No. cramps (Random, 95% CI) | ‐0.24 [‐1.29, 0.81] | |
| 2 Difference in cramp intensity ‐ fixed‐effect Show forest plot | 3 | Cramp intensity (Fixed, 95% CI) | ‐0.06 [‐0.17, 0.04] | |
| 3 Difference in number of cramp days over 2 weeks ‐ random‐effects (minus Connolly 1992) Show forest plot | 2 | Cramp days (Random, 95% CI) | ‐0.28 [‐0.98, 0.43] | |
| 4 Participants suffering minor adverse events ‐ random‐effects Show forest plot | 2 | 688 | Risk Difference (M‐H, Random, 95% CI) | 0.02 [‐0.04, 0.09] |
| 5 Participants suffering major adverse events ‐ random‐effects Show forest plot | 3 | 748 | Risk Difference (M‐H, Random, 95% CI) | 0.01 [‐0.01, 0.02] |
| Outcome or subgroup title | No. of studies | No. of participants | Statistical method | Effect size |
| 1 Difference in number of cramps in 2 weeks ‐ random‐effects Show forest plot | 2 | No. cramps (Random, 95% CI) | 1.07 [‐1.08, 3.23] | |
| 2 Difference in cramp intensity ‐ random‐effects Show forest plot | 3 | Cramp intensity (Random, 95% CI) | 0.10 [‐0.06, 0.26] | |
| 3 Difference in number of cramp days over 2 weeks ‐ random‐effects Show forest plot | 2 | Cramp days (Random, 95% CI) | 0.18 [‐1.13, 1.49] | |
| 4 Participants suffering minor adverse events ‐ random‐effects Show forest plot | 3 | 739 | Risk Difference (M‐H, Random, 95% CI) | 0.03 [‐0.04, 0.10] |
| 5 Participants suffering major adverse events ‐ fixed‐effect Show forest plot | 3 | 739 | Risk Difference (M‐H, Fixed, 95% CI) | ‐0.00 [‐0.01, 0.01] |