正常に成長している6カ月以下の乳児を対象に精神的および身体的な健康を促進するためのマッサージ
Appendices
Appendix 1. Original search strategies
The following strategy was used to search CENTRAL:
#1 MASSAGE (Mesh)
#2 Massage next therap*
#3 Therapeutic next touch
#4 THERAPEUTIC TOUCH (Mesh)
#5 TOUCH
#6 Tactile next stimulation
#7 #1 or #2 or #3 or #4 or #5 or #6
#8 infant* or baby or babies
#9 #7 and #8
The strategy used for MEDLINE, AMED and CINAHL was:
#1 exp MASSAGE/ or massage.mp.
#2 (massage adj therap$).mp
#3 (therapeutic adj touch).mp
#4 exp TOUCH/ or exp THERAPEUTIC TOUCH/ or touch.mp.
#5 (tactile adj stimulation).mp.
#6 1 or 2 or 3 or 4 or 5
#7 (infant$ or baby or babies).mp.
#8 6 and 7
The strategy used for EMBASE was:
#1 exp MASSAGE/ or massage.mp.
#2 (massage adj therap$).mp
#3 (therapeutic adj touch).mp
#4 exp TOUCH/ or touch.mp.
#5 (tactile adj stimulation).mp.
#6 1 or 2 or 3 or 4 or 5
#7 (infant$ or baby or babies).mp.
#8 6 and 7 (1415)
The strategy used for LILACS was:
massage or massage therapy or massage therapies [Words] or therapeutic touch or touch or tactile stimulation [Words] and infant or infants or baby or babies [Words]
The strategy used for PsycINFO was:
#10 (infant* or baby or babies) and (#1 or #2 or #3 or #4 or #5 or #6 or #7)
#9 infant* or baby or babies
#8 #1 or #2 or #3 or #4 or #5 or #6 or #7
#7 tactile adj stimulation
#6 therapeutic touch
#5 TOUCH
#4 therapeutic adj touch*
#3 massage adj therap*
#2 massage
#1 MASSAGE
The strategy used for the National Research Register was:
#1 MASSAGE (Mesh)
#2 Massage next therap*
#3 Therapeutic next touch
#4 THERAPEUTIC TOUCH (Mesh)
#5 TOUCH
#6 Tactile next stimulation
#7 #1 or #2 or #3 or #4 or #5 or #6
#8 infant* or baby or babies
#9 #7 and #8
Dissertation Abstracts, ClinicalTrials.gov, Cochrane Neonatal Review Group specialised register and the Chinese databases were searched using the terms:
Infant or infants or baby or babies AND massage
Appendix 2. Original search dates
Cochrane Central Register of Controlled Trials (CENTRAL) 2005 (Issue 3)
MEDLINE (1970 to August 2005)
PsycINFO (1970 to August 2005)
CINAHL (1982 to August 2005)
EMBASE (1980 to August 2005)
Dissertation Abstracts (1981 to August 2005)
AMED (Alternative and Complementary Medicine) (1985 to August 2005)
LILACS (Latin American & Caribbean Health Sciences Literature) (1982 to August 2005)
The National Research Register (2005) Issue 3
Clinicaltrials.gov (1966 to 2005)
Cochrane Neonatal Review Group specialised register (1966 to 2005)
VC undertook a search of the following Chinese database(s):
Chinese Scientific Journal Database (Jan 89 ‐ Oct 05)
Traditional Chinese Medicine Database (Jan 84 ‐ Sept 05)
Chinese BioMedical Database (Jan 89 ‐ Oct 05)
China Academic Journal Full Text Database (Jan 94 ‐ Oct 05)
China Proceedings of Conference Databases (Jan 99 ‐ Oct 05)
China Doctorate/Master Dissertations Full Text Databases (Jan 99 ‐ Oct 05)
Appendix 3. Results of the updated searches
| Database searched | Date of search | Issue searched | Number of hits | Date range of search |
| CENTRAL | 14.05.2010 | 2011(2) | 115 | 2005‐2010 |
| MEDLINE | 12.05.2010 | 1950 to May Week 1 2011 | 478 | 2005‐2010 |
| EMBASE | 17.05 2010 | 1980 to Week 19 2010 | 384 | 2005‐2010 |
| CINAHL | 14.05.2010 | 1937 to current | 368 | 2005‐2010 |
| PsycINFO | 15.05.2010 | 1887 to current | 299 | 2005‐2010 |
| Maternity and Infant Care | 18.05.2010 | 1971 to May 2010 | 505 | All years searched |
| LILACS | 19.05.2010 | all available years | 30 | 2005‐2010 |
| Database searched | Date of search | Issue searched | Number of hits | Date range of search |
| CENTRAL | 20.06.2011 | 2011(3) | 21 | Records added since May 2010 |
| MEDLINE | 20.06.2011 | 1948 to June Week 2 2011 | 121 | Records added since May 2010 |
| EMBASE | 20.06.2011 | 1980 to 2011 | 159 | Records added since May 2010 |
| CINAHL | 20.06.2011 | 1937 to current | 111 | Records added since May 2010 |
| PsycINFO | 20.06.2011 | 1887 to current | 69 | Records added since May 2010 |
| Maternity and Infant Care | 20.06.2011 | 1971 to May 2011 | 37 | Records added since May 2010 |
| LILACS | 20.06.2011 |
| 10 | Records published 2010 ‐ 2011 |
| WorldCat (dissertations) | 20.06.2011 |
| 16 | Records published 2005 ‐ 2011 |
|
|
| Database total before duplicates removed | 544 | 418 |
| ClinicalTrials.gov | 20.06.2011 |
| 14 |
|
| China Masters' Theses | 15.06.2011 | 2000 to current | 3 | Searched via China National Knowledge Infrastructure Portal limited to PY 2005‐2011 |
| China Academic Journals | 15.06.2011 | 1915 to current | 19 | Searched via China National Knowledge Infrastructure Portal limited to PY 2005‐2011 |
| China Doctoral Dissertations | 15.06.2011 | 1999 to current | 0 | Searched via China National Knowledge Infrastructure Portal limited to PY 2005‐2011 |
| China Proceedings of Conference | 15.06.2011 | 1999 to current | 0 | Searched via China National Knowledge Infrastructure Portal limited to PY 2005‐2011 |
Appendix 4. Search strategies for update search in June 2011
Ovid MEDLINE 1948 to June Week 2 2011, searched 20 June 2011
1 exp Massage/
2 massag$.mp.
3 exp Touch/ or exp Therapeutic Touch/
4 touch$.mp.
5 tactile stimul$.mp.
6 or/1‐5
7 (infant$ or baby or babies).mp.
8 exp Infant/
9 7 or 8
10 6 and 9
11 limit 10 to ed=20100501‐20110620
CINAHL Plus (EBSCOhost) 1937 to current, searched 20 June 2011
Search limited by publication year (2005 to 2011)
S10 S6 and S9
S9 S7 or S8
S8 infant* or baby or babies
S7 MH Infant
S6 S1 or S2 or S3 or S4 or S5
S5 tactile stimul*
S4 touch*
S3 MH Touch or MH Therapeutic Touch
S2 massag*
S1 MH Massage
CENTRAL 2011(3), searched 20 June 2011
#1 MeSH descriptor Massage
#2 massag*
#3 MeSH descriptor Therapeutic Touch
#4 MeSH descriptor Touch
#5 (touch*)
#6 (tactile next stimul*)
#7 (#1 OR #2 OR #3 OR #4 OR #5 OR #6)
#8 MeSH descriptor Infant explode all trees
#9 infant* or baby or babies
#10 (#8 OR #9)
#11 (#7 AND #10)
#12 (#11), from 2005 to 2011
#13 hs‐handsrch
#14 (#11 AND #13)
#15 (#12 OR #14)
PsycINFO (EBSCOhost) 1887 to 20 June 2011
Search limited by publication year (2005 to 2011)
S11 S6 and S10
S10 S7 or S8 or S9
S9 AG infancy
S8 AG neonatal
S7 infant* or baby or babies
S6 S1 or S2 or S3 or S4 or S5
S5 tactile stimul*
S4 touch*
S3 DE "Tactual Perception" or DE "Tactual Stimulation"
S2 massag*
S1 DE "Massage"
EMBASE 1980 to current, searched 20 June 2011
1. massage/
2. massag$.mp.
3. exp touch/
4. touch$.mp
5. tactile stimul$.mp.
6. or/1‐5
7. exp infant/
8. (infant$ or baby or babies).mp.
9. 7 or 8
10. 6 and 9
11. limit 10 to yr="2005 –Current
LILACS searched 20 June 2011
(Mh MASSAGE ) or (Mh TOUCH) or massag$ or touch$ or (tactile and stimul$)
and
(Mh infant) or (baby or babies or infant$)
and
(PD 2005 or PD 2006 or PD 2007 or PD 2008 or PD 2009 or PD 2010 or PD 2011)
Maternity and Infant Care 1971 to June 2011, searched 20 June 2011. All years searched
1 Massage.de.
2 Touch.de.
3 touch$.mp.
4 massag$.mp.
5 Therapeutic touch.de.
6 tactile stimul$.mp.
7 or/1‐6
8 (Infant ‐ newborn or Infant ‐ premature).de.
9 Infant ‐ low birth weight.de. (2161)
10 (infant$ or baby or babies).mp.
11 or/8‐10
12 7 and 11
WorldCat searched 20 May 2011
(Massage or touch) AND (infants or babies)
Search limited by publication year (2005 to 2011) and by Content (thesis/dissertations)
ClinicalTrials.gov searched 20 May 2011. All years searched
(Infant* or baby or babies) AND massage
China Knowledge Resource Integrated Database (CNKI) searched 15 May 2011
KW = infant or newborn AND KW =massage or therapeutic touch AND AB= random or randomly or randomised or randomised
Search limited by publication year 2005 to 2011

'Risk of bias' summary: review authors' judgements about each risk of bias item for each included study

'Risk of bias' graph: review authors' judgements about each risk of bias item presented as percentages across all included studies

Comparison 1 Infant massage versus control ‐ physical development, Outcome 1 Weight.

Comparison 1 Infant massage versus control ‐ physical development, Outcome 2 Weight: subgroup analyses (duration of intervention).
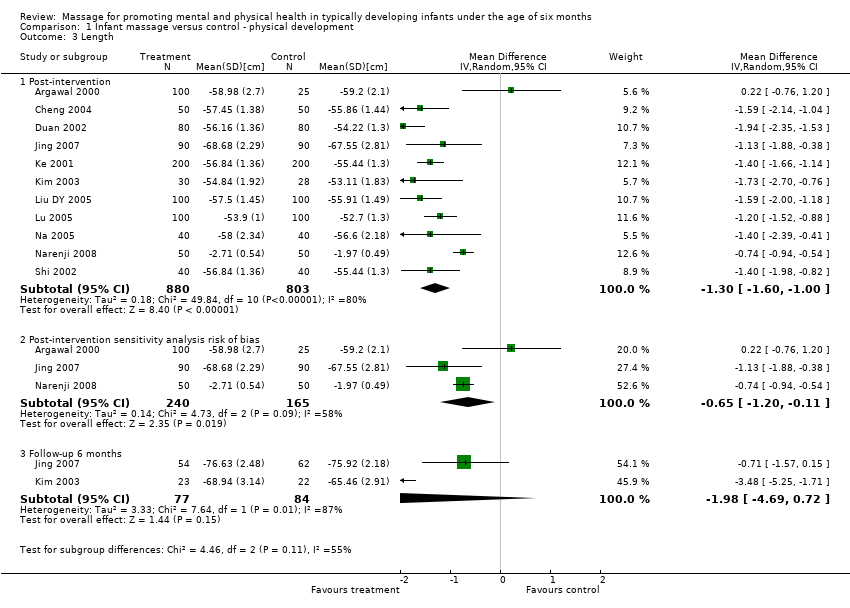
Comparison 1 Infant massage versus control ‐ physical development, Outcome 3 Length.

Comparison 1 Infant massage versus control ‐ physical development, Outcome 4 Length: subgroup analyses (duration of intervention).
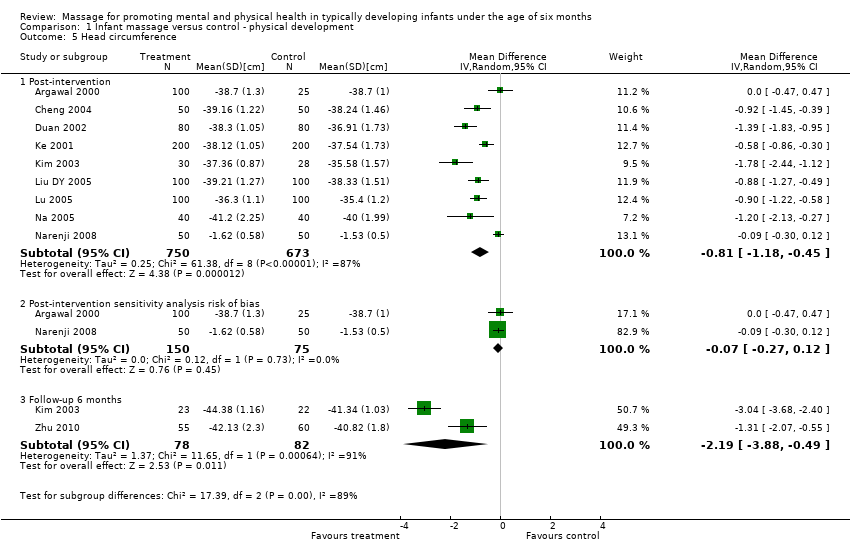
Comparison 1 Infant massage versus control ‐ physical development, Outcome 5 Head circumference.

Comparison 1 Infant massage versus control ‐ physical development, Outcome 6 Head circumference: subgroup analyses (duration of intervention).
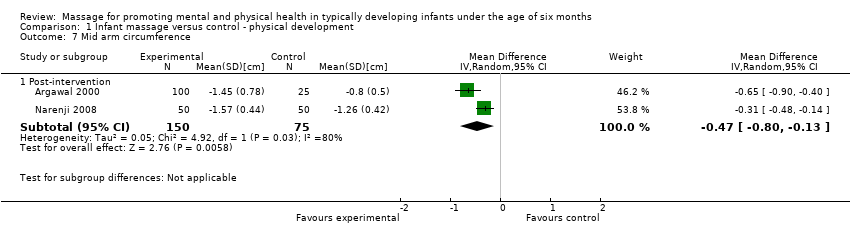
Comparison 1 Infant massage versus control ‐ physical development, Outcome 7 Mid arm circumference.
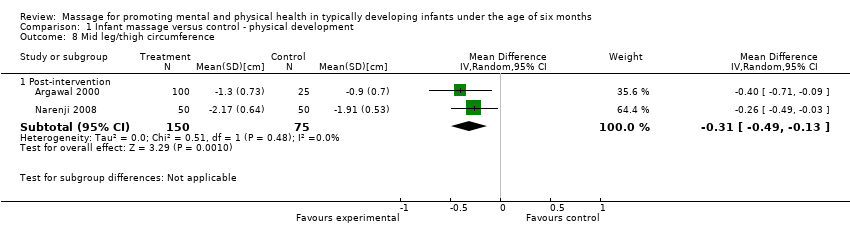
Comparison 1 Infant massage versus control ‐ physical development, Outcome 8 Mid leg/thigh circumference.
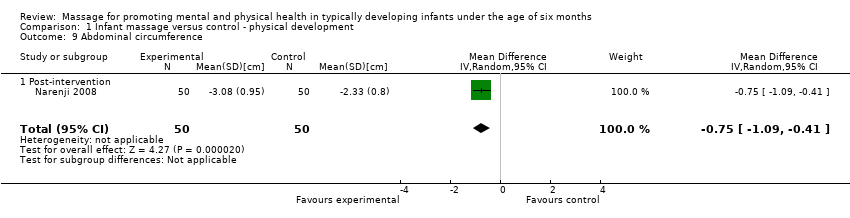
Comparison 1 Infant massage versus control ‐ physical development, Outcome 9 Abdominal circumference.
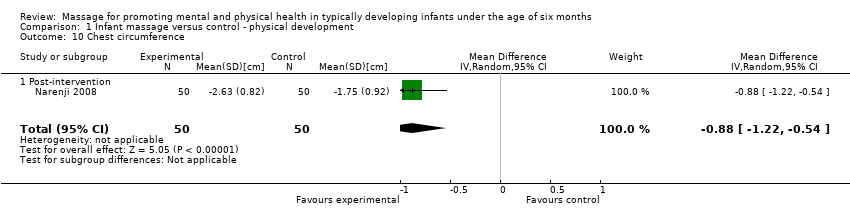
Comparison 1 Infant massage versus control ‐ physical development, Outcome 10 Chest circumference.
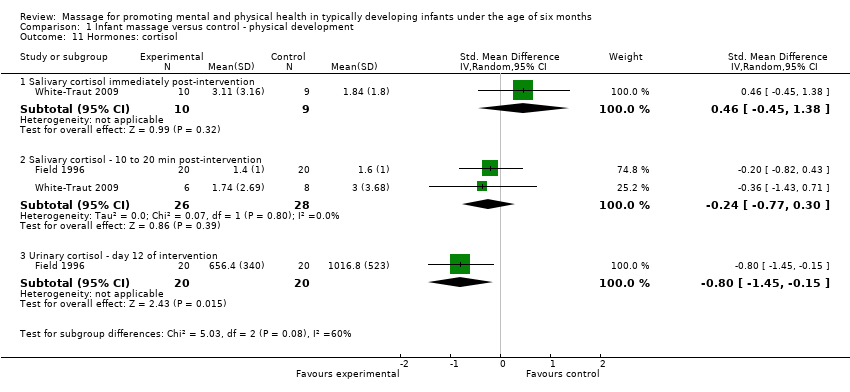
Comparison 1 Infant massage versus control ‐ physical development, Outcome 11 Hormones: cortisol.

Comparison 1 Infant massage versus control ‐ physical development, Outcome 12 Hormones: norepinephrine.

Comparison 1 Infant massage versus control ‐ physical development, Outcome 13 Hormones: epinephrine.

Comparison 1 Infant massage versus control ‐ physical development, Outcome 14 Hormones: serotonin.

Comparison 1 Infant massage versus control ‐ physical development, Outcome 15 Hormones: 6‐sulphatoxymelatonin secretion.

Comparison 1 Infant massage versus control ‐ physical development, Outcome 16 Biochemical markers: Bilirubin (7 days PN).
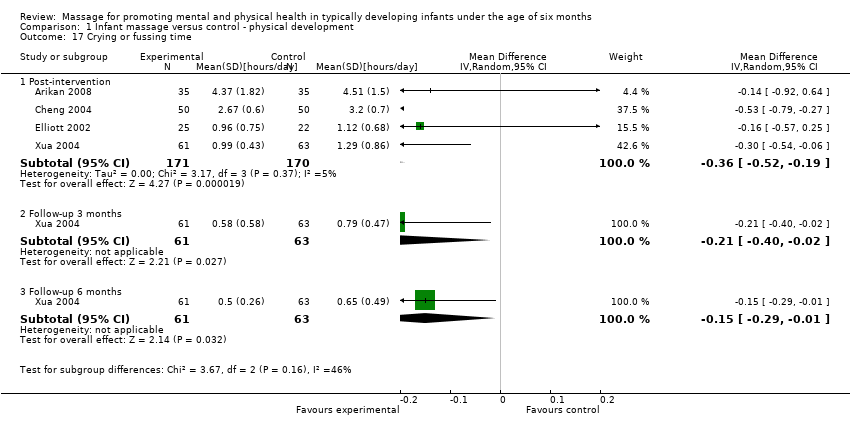
Comparison 1 Infant massage versus control ‐ physical development, Outcome 17 Crying or fussing time.

Comparison 1 Infant massage versus control ‐ physical development, Outcome 18 Crying frequency (times).

Comparison 1 Infant massage versus control ‐ physical development, Outcome 19 Sleep/wake behaviours (Thoman).

Comparison 1 Infant massage versus control ‐ physical development, Outcome 20 Behavioural state immediately post‐intervention (Thoman).
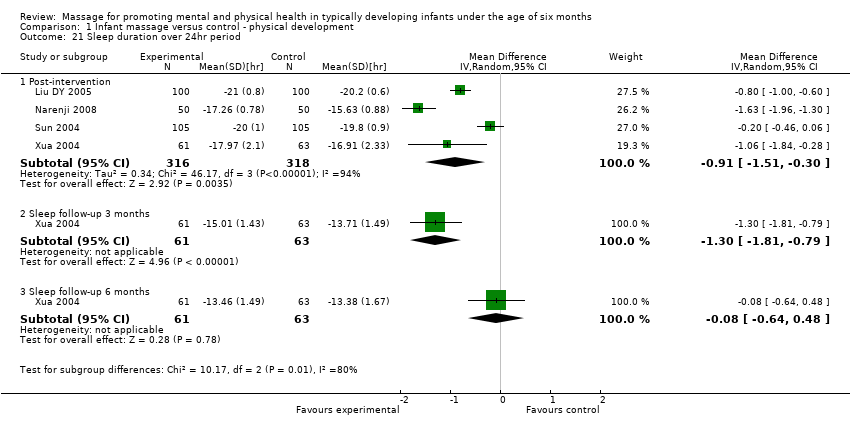
Comparison 1 Infant massage versus control ‐ physical development, Outcome 21 Sleep duration over 24hr period.

Comparison 1 Infant massage versus control ‐ physical development, Outcome 22 Mean increase in 24h sleep.
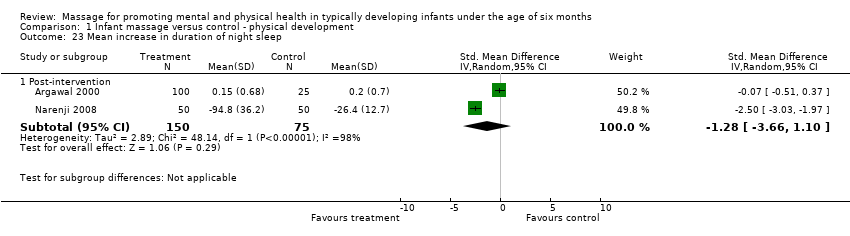
Comparison 1 Infant massage versus control ‐ physical development, Outcome 23 Mean increase in duration of night sleep.

Comparison 1 Infant massage versus control ‐ physical development, Outcome 24 Mean increase in duration of day sleep.

Comparison 1 Infant massage versus control ‐ physical development, Outcome 25 Mean increase in duration of first morning sleep after massage.

Comparison 1 Infant massage versus control ‐ physical development, Outcome 26 Sleep (total hours per night).

Comparison 1 Infant massage versus control ‐ physical development, Outcome 27 Number of naps (total number of naps).

Comparison 1 Infant massage versus control ‐ physical development, Outcome 28 Number of naps in day.

Comparison 1 Infant massage versus control ‐ physical development, Outcome 29 Number of naps at night.

Comparison 1 Infant massage versus control ‐ physical development, Outcome 30 Night Wake Frequency (times).

Comparison 1 Infant massage versus control ‐ physical development, Outcome 31 Night wake duration.
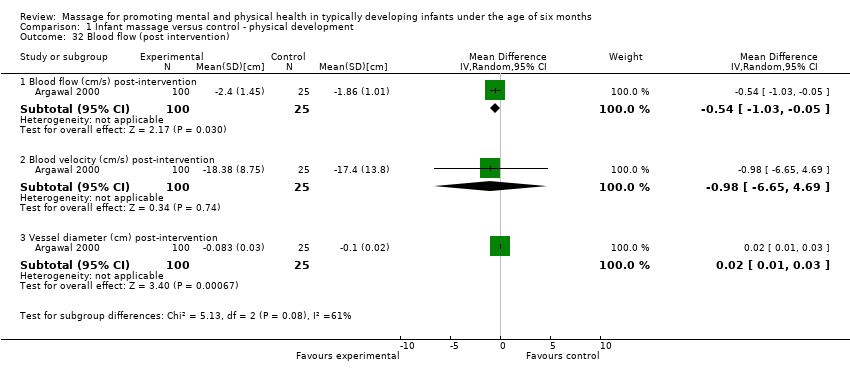
Comparison 1 Infant massage versus control ‐ physical development, Outcome 32 Blood flow (post intervention).
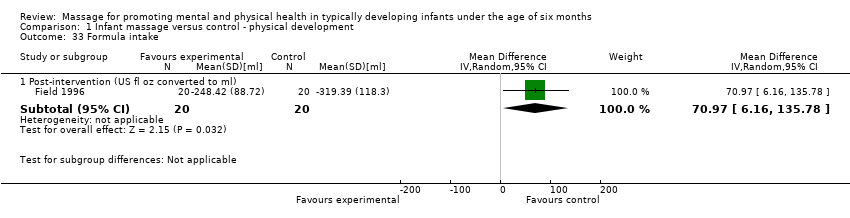
Comparison 1 Infant massage versus control ‐ physical development, Outcome 33 Formula intake.
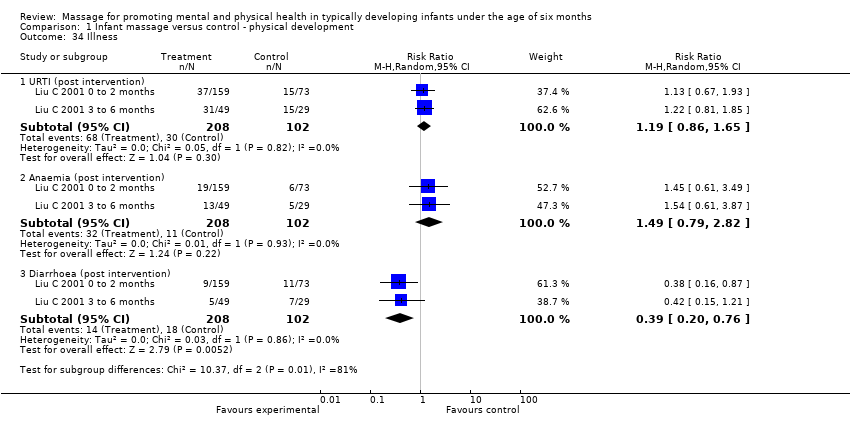
Comparison 1 Infant massage versus control ‐ physical development, Outcome 34 Illness.

Comparison 1 Infant massage versus control ‐ physical development, Outcome 35 Illness and clinic visits.

Comparison 2 Infant massage versus control ‐ mental health and development, Outcome 1 Infant temperament meta‐analyses.

Comparison 2 Infant massage versus control ‐ mental health and development, Outcome 2 Infant temperament (CCTI) post intervention.

Comparison 2 Infant massage versus control ‐ mental health and development, Outcome 3 Infant temperament (Infant behaviour questionnaire (IBQ) post intervention).
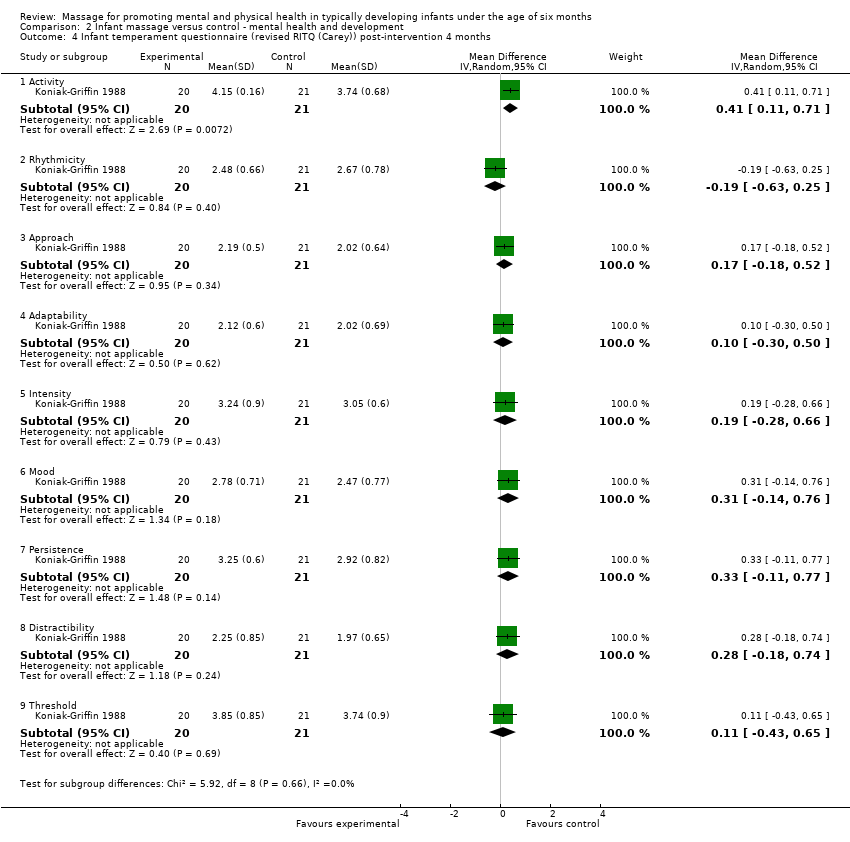
Comparison 2 Infant massage versus control ‐ mental health and development, Outcome 4 Infant temperament questionnaire (revised RITQ (Carey)) post‐intervention 4 months.

Comparison 2 Infant massage versus control ‐ mental health and development, Outcome 5 Infant temperament questionnaire (revised RITQ (Carey)) follow‐up 8 months.

Comparison 2 Infant massage versus control ‐ mental health and development, Outcome 6 Infant Care Questionnaire post‐intervention.

Comparison 2 Infant massage versus control ‐ mental health and development, Outcome 7 Infant Care Questionnaire follow‐up 1 year.

Comparison 2 Infant massage versus control ‐ mental health and development, Outcome 8 Infant attachment (Q set).

Comparison 2 Infant massage versus control ‐ mental health and development, Outcome 9 Child behaviour (HOME).

Comparison 2 Infant massage versus control ‐ mental health and development, Outcome 10 Eyberg Child Behaviour Inventory (ECBI) ‐ Intensity domain.

Comparison 2 Infant massage versus control ‐ mental health and development, Outcome 11 Eyberg Child Behaviour Inventory (ECBI) ‐ Problem domain.
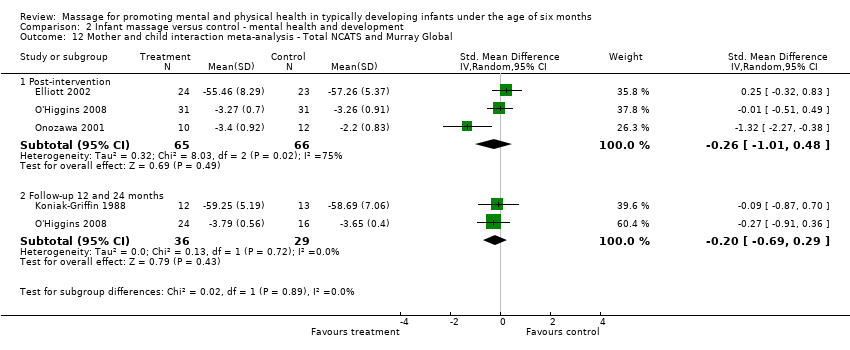
Comparison 2 Infant massage versus control ‐ mental health and development, Outcome 12 Mother and child interaction meta‐analysis ‐ Total NCATS and Murray Global.

Comparison 2 Infant massage versus control ‐ mental health and development, Outcome 13 Nursing Child Feeding Assessment Scale (NCAFS) ‐ Total.
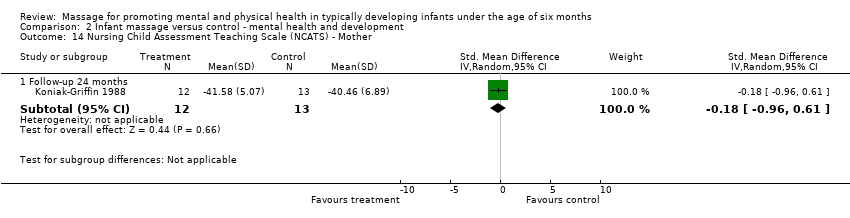
Comparison 2 Infant massage versus control ‐ mental health and development, Outcome 14 Nursing Child Assessment Teaching Scale (NCATS) ‐ Mother.

Comparison 2 Infant massage versus control ‐ mental health and development, Outcome 15 Nursing Child Assessment Teaching Scale (NCATS) ‐ Child.

Comparison 2 Infant massage versus control ‐ mental health and development, Outcome 16 Maternal sensitivity ‐ warm to cold (Murray).

Comparison 2 Infant massage versus control ‐ mental health and development, Outcome 17 Maternal sensitivity ‐ non‐intrusive to intrusive (Murray).
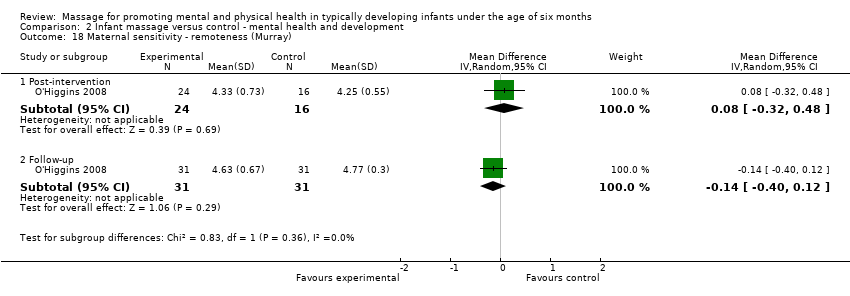
Comparison 2 Infant massage versus control ‐ mental health and development, Outcome 18 Maternal sensitivity ‐ remoteness (Murray).
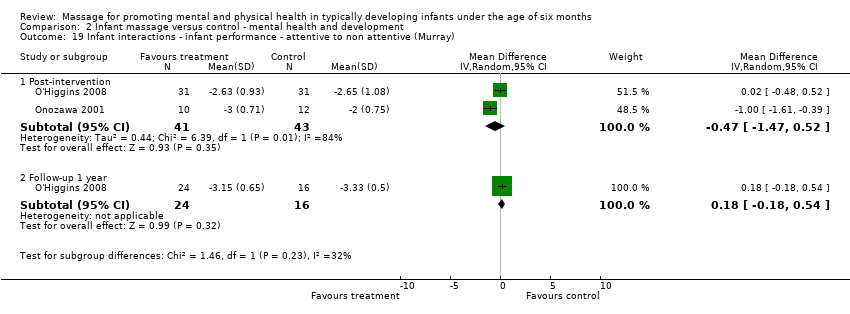
Comparison 2 Infant massage versus control ‐ mental health and development, Outcome 19 Infant interactions ‐ infant performance ‐ attentive to non attentive (Murray).

Comparison 2 Infant massage versus control ‐ mental health and development, Outcome 20 Infant interactions ‐ lively to inert (Murray).

Comparison 2 Infant massage versus control ‐ mental health and development, Outcome 21 Infant interactions ‐ happy to distressed (Murray).

Comparison 2 Infant massage versus control ‐ mental health and development, Outcome 22 Parenting stress (PSI Abidin) child characteristics subscale.

Comparison 2 Infant massage versus control ‐ mental health and development, Outcome 23 Psychomotor Development Indices (PDI) meta‐analysis post‐intervention.

Comparison 2 Infant massage versus control ‐ mental health and development, Outcome 24 Bayley Psychomotor Development Index (PDI) follow‐up.

Comparison 2 Infant massage versus control ‐ mental health and development, Outcome 25 Mental Development Indices (MDI) meta‐analysis post‐intervention.

Comparison 2 Infant massage versus control ‐ mental health and development, Outcome 26 Bayley Mental Development Index (MDI) follow‐up.

Comparison 2 Infant massage versus control ‐ mental health and development, Outcome 27 Gessel/Capital meta‐analysis (post intervention).
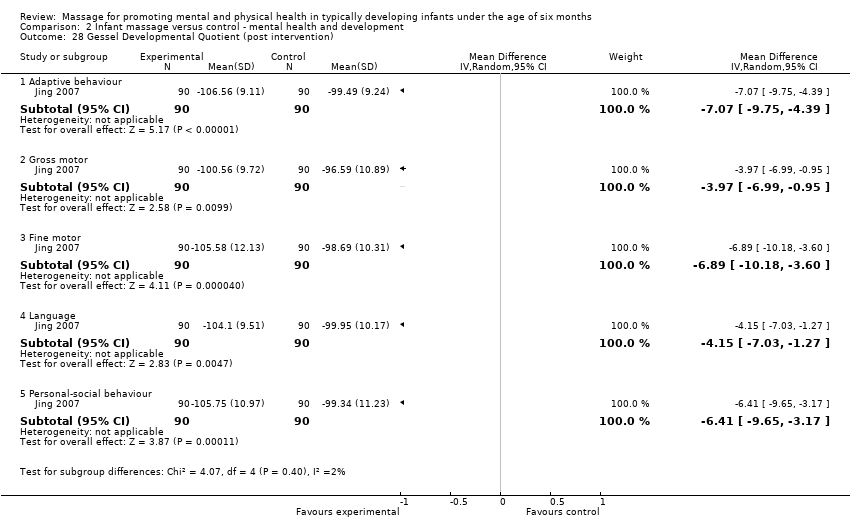
Comparison 2 Infant massage versus control ‐ mental health and development, Outcome 28 Gessel Developmental Quotient (post intervention).

Comparison 2 Infant massage versus control ‐ mental health and development, Outcome 29 Capital institute Mental Checklist (post intervention).

Comparison 2 Infant massage versus control ‐ mental health and development, Outcome 30 Gessel Developmental Quotient (follow‐up 6 months).

Comparison 2 Infant massage versus control ‐ mental health and development, Outcome 31 Attachment patterns (strange situation procedure).

Comparison 2 Infant massage versus control ‐ mental health and development, Outcome 32 Distractibility (toy) follow‐up 1 year.

Comparison 2 Infant massage versus control ‐ mental health and development, Outcome 33 Habituation.

Comparison 2 Infant massage versus control ‐ mental health and development, Outcome 34 Seconds to habituation.
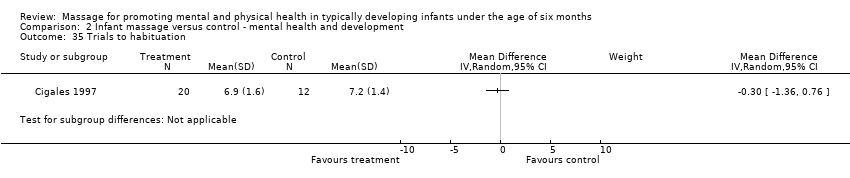
Comparison 2 Infant massage versus control ‐ mental health and development, Outcome 35 Trials to habituation.

Comparison 2 Infant massage versus control ‐ mental health and development, Outcome 36 Post habituation.

Comparison 2 Infant massage versus control ‐ mental health and development, Outcome 37 Habituation test.
| Survey time | Height | Weight | Head | Chest | Comment | |
| 4 months of age (1 month Post‐intervention) | t = 0.854; P = 0.396 | t = 1.120; P = 0.226 | t =‐0.343; P = 0.732 | t = 0.995; P = 0.322 | Through a six‐month vertical survey of the growth of all n = 310 (that is, all participants from both Liu C 2001 0 to 2 months; Liu C 2001 3 to 6 months) the infant participants over 0‐6 months, it was shown that the weight and the chest circumference of the infants who received the massage developed better than the control group. There was a significant difference between infants of the two groups by the six months. Height and head circumference were not significantly different. * Significantly different | |
| 6 months of age (3 months Post‐intervention) | t = 1.763; P = 0.081 | t = 2.295; *P = 0.025 | t = 0.411; P = 0.682 | t = 2.659; *P = 0.010 | ||
| n/a | n/a | n/a | n/a | n/a | Outcome assessments at Post‐intervention on weight, length and head circumference were presented using a χ2 sided test and were significantly different between massage and control group ( P > 0.05). |
| Study ID | Intervention | Good | Medium | Not good | Control | Good | Medium | Not good | Statistical significance X2 P |
| n = 159 | 136 | 23 | 0 | n = 73 | 49 | 20 | 4 | X2 = 15.353 P = 0.0000 (statistically significant between massage and control) | |
| n = 41 | 41 | 7 | 1 | n = 29 | 21 | 7 | 1 | X2 = 1.417 P = > 0.10 (not statistically significant between massage and control) |
| Study ID | Outcome measure (Post‐intervention) | Intervention | Control | Statistical tests X2 P |
| Rise from prone 0 degrees | 6 | 71 | X2= 4.212; P = < 0.05 Statistically significant between intervention and control. | |
| Rise from prone 45 degrees | 61 | 23 | ||
| Rise from prone 90 degrees | 33 | 6 | ||
| Sight tracking 30cm | 19 | 41 | X2 = 30.11; P = < 0.05 Statistically significant between intervention and control. | |
| Sight tracking 50cm | 42 | 39 | ||
| Sight tracking 100cm | 39 | 20 | ||
| Auditory tracking Can do | 91 | 86 | X2 = 4.735; P = < 0.05 Statistically significant between intervention and control. | |
| Auditory tracking Cannot do | 9 | 14 | ||
| Smiling for testers Can do | 34 | 19 | X2 = 4.568; P = 0.05 Statistically significant between intervention and control. | |
| Smiling for testers Cannot do | 66 | 81 |
| Outcome or subgroup title | No. of studies | No. of participants | Statistical method | Effect size |
| 1 Weight Show forest plot | 18 | Mean Difference (IV, Random, 95% CI) | Subtotals only | |
| 1.1 Post‐intervention | 18 | 2271 | Mean Difference (IV, Random, 95% CI) | ‐965.25 [‐1360.52, ‐569.98] |
| 1.2 Post‐intervention Western studies | 2 | 81 | Mean Difference (IV, Random, 95% CI) | ‐127.10 [‐575.14, 320.93] |
| 1.3 Post‐intervention sensitivity analysis for Kim 2003 | 17 | 2213 | Mean Difference (IV, Random, 95% CI) | ‐975.96 [‐1390.63, ‐561.30] |
| 1.4 Post‐intervention sensitivity analysis risk of bias | 3 | 405 | Mean Difference (IV, Random, 95% CI) | ‐203.55 [‐443.37, 36.26] |
| 1.5 Follow‐up 6 to 8 months | 3 | 202 | Mean Difference (IV, Random, 95% CI) | ‐758.29 [‐1364.67, ‐151.90] |
| 1.6 Follow‐up 6 months sensitivity analysis for Kim 2003 | 2 | 157 | Mean Difference (IV, Random, 95% CI) | ‐455.07 [‐823.80, ‐86.33] |
| 2 Weight: subgroup analyses (duration of intervention) Show forest plot | 18 | Mean Difference (IV, Random, 95% CI) | Subtotals only | |
| 2.1 Post‐intervention subgroup short term | 5 | 443 | Mean Difference (IV, Random, 95% CI) | ‐374.07 [‐654.84, ‐93.31] |
| 2.2 Post‐intervention subgroup medium term | 12 | 1648 | Mean Difference (IV, Random, 95% CI) | ‐1259.19 [‐1807.80, ‐710.58] |
| 2.3 Post‐intervention subgroup long term | 1 | 180 | Mean Difference (IV, Random, 95% CI) | ‐500.00 [‐811.25, ‐188.75] |
| 3 Length Show forest plot | 11 | Mean Difference (IV, Random, 95% CI) | Subtotals only | |
| 3.1 Post‐intervention | 11 | 1683 | Mean Difference (IV, Random, 95% CI) | ‐1.30 [‐1.60, 1.00] |
| 3.2 Post‐intervention sensitivity analysis risk of bias | 3 | 405 | Mean Difference (IV, Random, 95% CI) | ‐0.65 [‐1.20, ‐0.11] |
| 3.3 Follow‐up 6 months | 2 | 161 | Mean Difference (IV, Random, 95% CI) | ‐1.98 [‐4.69, 0.72] |
| 4 Length: subgroup analyses (duration of intervention) Show forest plot | 11 | Mean Difference (IV, Random, 95% CI) | Subtotals only | |
| 4.1 Post‐intervention subgroup short duration | 5 | 443 | Mean Difference (IV, Random, 95% CI) | ‐1.00 [‐1.54, ‐0.47] |
| 4.2 Post‐intervention subgroup medium‐term duration | 5 | 1060 | Mean Difference (IV, Random, 95% CI) | ‐1.51 [‐1.76, ‐1.27] |
| 4.3 Post‐intervention subgroup long duration | 1 | 180 | Mean Difference (IV, Random, 95% CI) | ‐1.13 [‐1.88, ‐0.38] |
| 5 Head circumference Show forest plot | 10 | Mean Difference (IV, Random, 95% CI) | Subtotals only | |
| 5.1 Post‐intervention | 9 | 1423 | Mean Difference (IV, Random, 95% CI) | ‐0.81 [‐1.18, ‐0.45] |
| 5.2 Post‐intervention sensitivity analysis risk of bias | 2 | 225 | Mean Difference (IV, Random, 95% CI) | ‐0.07 [‐0.27, 0.12] |
| 5.3 Follow‐up 6 months | 2 | 160 | Mean Difference (IV, Random, 95% CI) | ‐2.19 [‐3.88, ‐0.49] |
| 6 Head circumference: subgroup analyses (duration of intervention) Show forest plot | 9 | Mean Difference (IV, Random, 95% CI) | Subtotals only | |
| 6.1 Post‐intervention subgroup short | 4 | 363 | Mean Difference (IV, Random, 95% CI) | ‐0.70 [‐1.45, 0.05] |
| 6.2 Post‐intervention subgroup medium‐term | 5 | 1060 | Mean Difference (IV, Random, 95% CI) | ‐0.90 [‐1.16, ‐0.64] |
| 7 Mid arm circumference Show forest plot | 2 | Mean Difference (IV, Random, 95% CI) | Subtotals only | |
| 7.1 Post‐intervention | 2 | 225 | Mean Difference (IV, Random, 95% CI) | ‐0.47 [‐0.80, ‐0.13] |
| 8 Mid leg/thigh circumference Show forest plot | 2 | Mean Difference (IV, Random, 95% CI) | Subtotals only | |
| 8.1 Post‐intervention | 2 | 225 | Mean Difference (IV, Random, 95% CI) | ‐0.31 [‐0.49, ‐0.13] |
| 9 Abdominal circumference Show forest plot | 1 | 100 | Mean Difference (IV, Random, 95% CI) | ‐0.75 [‐1.09, ‐0.41] |
| 9.1 Post‐intervention | 1 | 100 | Mean Difference (IV, Random, 95% CI) | ‐0.75 [‐1.09, ‐0.41] |
| 10 Chest circumference Show forest plot | 1 | 100 | Mean Difference (IV, Random, 95% CI) | ‐0.88 [‐1.22, ‐0.54] |
| 10.1 Post‐intervention | 1 | 100 | Mean Difference (IV, Random, 95% CI) | ‐0.88 [‐1.22, ‐0.54] |
| 11 Hormones: cortisol Show forest plot | 2 | Std. Mean Difference (IV, Random, 95% CI) | Subtotals only | |
| 11.1 Salivary cortisol immediately post‐intervention | 1 | 19 | Std. Mean Difference (IV, Random, 95% CI) | 0.46 [‐0.45, 1.38] |
| 11.2 Salivary cortisol ‐ 10 to 20 min post‐intervention | 2 | 54 | Std. Mean Difference (IV, Random, 95% CI) | ‐0.24 [‐0.77, 0.30] |
| 11.3 Urinary cortisol ‐ day 12 of intervention | 1 | 40 | Std. Mean Difference (IV, Random, 95% CI) | ‐0.80 [‐1.45, ‐0.15] |
| 12 Hormones: norepinephrine Show forest plot | 1 | Mean Difference (IV, Random, 95% CI) | Subtotals only | |
| 12.1 Post‐intervention | 1 | 40 | Mean Difference (IV, Random, 95% CI) | ‐60.3 [‐111.88, ‐8.72] |
| 13 Hormones: epinephrine Show forest plot | 1 | Mean Difference (IV, Random, 95% CI) | Subtotals only | |
| 13.1 Post‐intervention | 1 | 40 | Mean Difference (IV, Random, 95% CI) | ‐13.00 [‐20.08, ‐5.92] |
| 14 Hormones: serotonin Show forest plot | 1 | Mean Difference (IV, Random, 95% CI) | Subtotals only | |
| 14.1 Post‐intervention | 1 | 40 | Mean Difference (IV, Random, 95% CI) | ‐295.5 [‐705.25, 114.25] |
| 15 Hormones: 6‐sulphatoxymelatonin secretion Show forest plot | 1 | Mean Difference (IV, Random, 95% CI) | Subtotals only | |
| 16 Biochemical markers: Bilirubin (7 days PN) Show forest plot | 2 | 410 | Mean Difference (IV, Random, 95% CI) | ‐38.11 [‐50.61, ‐25.61] |
| 17 Crying or fussing time Show forest plot | 4 | Mean Difference (IV, Random, 95% CI) | Subtotals only | |
| 17.1 Post‐intervention | 4 | 341 | Mean Difference (IV, Random, 95% CI) | ‐0.36 [‐0.52, ‐0.19] |
| 17.2 Follow‐up 3 months | 1 | 124 | Mean Difference (IV, Random, 95% CI) | ‐0.21 [‐0.40, ‐0.02] |
| 17.3 Follow‐up 6 months | 1 | 124 | Mean Difference (IV, Random, 95% CI) | ‐0.15 [‐0.29, ‐0.01] |
| 18 Crying frequency (times) Show forest plot | 1 | Mean Difference (IV, Random, 95% CI) | Subtotals only | |
| 18.1 Post‐intervention | 1 | 124 | Mean Difference (IV, Random, 95% CI) | ‐0.34 [‐0.56, ‐0.12] |
| 18.2 Follow‐up 3 months | 1 | 126 | Mean Difference (IV, Random, 95% CI) | ‐0.19 [‐0.36, ‐0.02] |
| 18.3 Follow‐up 6 months | 1 | 124 | Mean Difference (IV, Random, 95% CI) | ‐0.18 [‐0.35, ‐0.01] |
| 19 Sleep/wake behaviours (Thoman) Show forest plot | 1 | Mean Difference (IV, Random, 95% CI) | Subtotals only | |
| 19.1 Quiet sleep | 1 | 40 | Mean Difference (IV, Random, 95% CI) | ‐6.30 [‐20.16, 7.56] |
| 19.2 Active sleep | 1 | 40 | Mean Difference (IV, Random, 95% CI) | 0.0 [0.0, 0.0] |
| 19.3 Inactive alert | 1 | 40 | Mean Difference (IV, Random, 95% CI) | ‐12.70 [‐19.38, ‐6.02] |
| 19.4 Crying | 1 | 40 | Mean Difference (IV, Random, 95% CI) | ‐8.2 [‐12.24, ‐4.16] |
| 19.5 Drowsy | 1 | 40 | Mean Difference (IV, Random, 95% CI) | 2.0 [‐0.19, 4.19] |
| 19.6 Active awake | 1 | 40 | Mean Difference (IV, Random, 95% CI) | ‐15.00 [‐22.29, ‐7.71] |
| 19.7 REM sleep | 1 | 40 | Mean Difference (IV, Random, 95% CI) | 0.0 [0.0, 0.0] |
| 19.8 Movement | 1 | 40 | Mean Difference (IV, Random, 95% CI) | ‐12.60 [‐27.59, 2.39] |
| 20 Behavioural state immediately post‐intervention (Thoman) Show forest plot | 1 | Risk Ratio (M‐H, Random, 95% CI) | Subtotals only | |
| 20.1 Asleep | 1 | 26 | Risk Ratio (M‐H, Random, 95% CI) | 1.04 [0.55, 1.96] |
| 20.2 Awake | 1 | 26 | Risk Ratio (M‐H, Random, 95% CI) | 0.78 [0.27, 2.23] |
| 20.3 Crying | 1 | 26 | Risk Ratio (M‐H, Random, 95% CI) | 1.94 [0.09, 43.50] |
| 21 Sleep duration over 24hr period Show forest plot | 4 | Mean Difference (IV, Random, 95% CI) | Subtotals only | |
| 21.1 Post‐intervention | 4 | 634 | Mean Difference (IV, Random, 95% CI) | ‐0.91 [‐1.51, ‐0.30] |
| 21.2 Sleep follow‐up 3 months | 1 | 124 | Mean Difference (IV, Random, 95% CI) | ‐1.30 [‐1.81, ‐0.79] |
| 21.3 Sleep follow‐up 6 months | 1 | 124 | Mean Difference (IV, Random, 95% CI) | ‐0.08 [‐0.64, 0.48] |
| 22 Mean increase in 24h sleep Show forest plot | 2 | Std. Mean Difference (IV, Random, 95% CI) | Subtotals only | |
| 22.1 Post‐intervention | 2 | 225 | Std. Mean Difference (IV, Random, 95% CI) | ‐1.47 [‐4.43, 1.49] |
| 23 Mean increase in duration of night sleep Show forest plot | 2 | Std. Mean Difference (IV, Random, 95% CI) | Subtotals only | |
| 23.1 Post‐intervention | 2 | 225 | Std. Mean Difference (IV, Random, 95% CI) | ‐1.28 [‐3.66, 1.10] |
| 24 Mean increase in duration of day sleep Show forest plot | 1 | Mean Difference (IV, Random, 95% CI) | Subtotals only | |
| 24.1 Post‐intervention | 1 | 125 | Mean Difference (IV, Random, 95% CI) | 0.10 [‐0.21, 0.41] |
| 25 Mean increase in duration of first morning sleep after massage Show forest plot | 1 | Mean Difference (IV, Random, 95% CI) | Subtotals only | |
| 25.1 Post‐intervention | 1 | 125 | Mean Difference (IV, Random, 95% CI) | ‐1.52 [‐1.69, ‐1.35] |
| 26 Sleep (total hours per night) Show forest plot | 1 | 100 | Mean Difference (IV, Random, 95% CI) | ‐0.70 [1.00, ‐0.40] |
| 26.1 Post‐intervention | 1 | 100 | Mean Difference (IV, Random, 95% CI) | ‐0.70 [1.00, ‐0.40] |
| 27 Number of naps (total number of naps) Show forest plot | 1 | Mean Difference (IV, Random, 95% CI) | Subtotals only | |
| 28 Number of naps in day Show forest plot | 1 | Mean Difference (IV, Random, 95% CI) | Subtotals only | |
| 29 Number of naps at night Show forest plot | 1 | Mean Difference (IV, Random, 95% CI) | Subtotals only | |
| 30 Night Wake Frequency (times) Show forest plot | 1 | Mean Difference (IV, Random, 95% CI) | Subtotals only | |
| 30.1 Post‐intervention | 1 | 124 | Mean Difference (IV, Random, 95% CI) | ‐0.48 [‐0.81, ‐0.15] |
| 30.2 Follow‐up 3 months | 1 | 124 | Mean Difference (IV, Random, 95% CI) | ‐0.38 [‐0.63, ‐0.13] |
| 30.3 Follow‐up 6 months | 1 | 124 | Mean Difference (IV, Random, 95% CI) | ‐0.35 [‐0.56, ‐0.14] |
| 31 Night wake duration Show forest plot | 1 | Mean Difference (IV, Random, 95% CI) | Subtotals only | |
| 31.1 Post‐intervention | 1 | 124 | Mean Difference (IV, Random, 95% CI) | ‐0.27 [‐0.51, ‐0.03] |
| 31.2 Follow‐up 3 months | 1 | 124 | Mean Difference (IV, Random, 95% CI) | ‐0.18 [‐0.31, ‐0.05] |
| 31.3 Follow‐up 6 months | 1 | 124 | Mean Difference (IV, Random, 95% CI) | ‐0.26 [‐0.50, ‐0.02] |
| 32 Blood flow (post intervention) Show forest plot | 1 | Mean Difference (IV, Random, 95% CI) | Subtotals only | |
| 32.1 Blood flow (cm/s) post‐intervention | 1 | 125 | Mean Difference (IV, Random, 95% CI) | ‐0.54 [‐1.03, ‐0.05] |
| 32.2 Blood velocity (cm/s) post‐intervention | 1 | 125 | Mean Difference (IV, Random, 95% CI) | ‐0.98 [‐6.65, 4.69] |
| 32.3 Vessel diameter (cm) post‐intervention | 1 | 125 | Mean Difference (IV, Random, 95% CI) | 0.02 [0.01, 0.03] |
| 33 Formula intake Show forest plot | 1 | Mean Difference (IV, Random, 95% CI) | Subtotals only | |
| 33.1 Post‐intervention (US fl oz converted to ml) | 1 | 40 | Mean Difference (IV, Random, 95% CI) | 70.97 [6.16, 135.78] |
| 34 Illness Show forest plot | 2 | Risk Ratio (M‐H, Random, 95% CI) | Subtotals only | |
| 34.1 URTI (post intervention) | 2 | 310 | Risk Ratio (M‐H, Random, 95% CI) | 1.19 [0.86, 1.65] |
| 34.2 Anaemia (post intervention) | 2 | 310 | Risk Ratio (M‐H, Random, 95% CI) | 1.49 [0.79, 2.82] |
| 34.3 Diarrhoea (post intervention) | 2 | 310 | Risk Ratio (M‐H, Random, 95% CI) | 0.39 [0.20, 0.76] |
| 35 Illness and clinic visits Show forest plot | 1 | Mean Difference (IV, Random, 95% CI) | Subtotals only | |
| 35.1 Illness follow‐up 6 months | 1 | 45 | Mean Difference (IV, Random, 95% CI) | ‐8.82 [‐10.62, ‐7.02] |
| 35.2 Clinic visits follow‐up 6 months | 1 | 45 | Mean Difference (IV, Random, 95% CI) | ‐5.98 [‐7.07, ‐4.89] |
| Outcome or subgroup title | No. of studies | No. of participants | Statistical method | Effect size |
| 1 Infant temperament meta‐analyses Show forest plot | 3 | Std. Mean Difference (IV, Random, 95% CI) | Subtotals only | |
| 1.1 Activity (post‐intervention) | 3 | 121 | Std. Mean Difference (IV, Random, 95% CI) | 0.39 [‐0.34, 1.13] |
| 1.2 Persistence (post‐intervention) | 2 | 81 | Std. Mean Difference (IV, Random, 95% CI) | 0.24 [‐0.20, 0.67] |
| 1.3 Soothability (post‐intervention) | 2 | 80 | Std. Mean Difference (IV, Random, 95% CI) | ‐0.30 [‐0.94, 0.35] |
| 2 Infant temperament (CCTI) post intervention Show forest plot | 1 | Mean Difference (IV, Random, 95% CI) | Subtotals only | |
| 2.1 Activity | 1 | 40 | Mean Difference (IV, Random, 95% CI) | ‐1.60 [‐4.41, 1.21] |
| 2.2 Soothability | 1 | 40 | Mean Difference (IV, Random, 95% CI) | ‐2.90 [‐5.71, ‐0.09] |
| 2.3 Emotionality | 1 | 40 | Mean Difference (IV, Random, 95% CI) | ‐0.80 [‐3.61, 2.01] |
| 2.4 Sociability | 1 | 40 | Mean Difference (IV, Random, 95% CI) | ‐1.5 [‐3.98, 0.98] |
| 2.5 Persistence | 1 | 40 | Mean Difference (IV, Random, 95% CI) | 0.10 [‐2.38, 2.58] |
| 2.6 Food adaptation | 1 | 40 | Mean Difference (IV, Random, 95% CI) | 0.5 [‐1.98, 2.98] |
| 3 Infant temperament (Infant behaviour questionnaire (IBQ) post intervention) Show forest plot | 1 | Mean Difference (IV, Random, 95% CI) | Subtotals only | |
| 3.1 Activity | 1 | 40 | Mean Difference (IV, Random, 95% CI) | 0.56 [0.08, 1.04] |
| 3.2 Soothability | 1 | 40 | Mean Difference (IV, Random, 95% CI) | 0.03 [‐0.59, 0.65] |
| 3.3 Duration of orienting | 1 | 40 | Mean Difference (IV, Random, 95% CI) | 0.0 [‐0.82, 0.82] |
| 3.4 Distress to limitations | 1 | 40 | Mean Difference (IV, Random, 95% CI) | ‐0.08 [‐0.49, 0.33] |
| 3.5 Fear | 1 | 40 | Mean Difference (IV, Random, 95% CI) | ‐0.06 [‐0.63, 0.51] |
| 3.6 Amount of smiling | 1 | 40 | Mean Difference (IV, Random, 95% CI) | 0.30 [‐0.14, 0.74] |
| 4 Infant temperament questionnaire (revised RITQ (Carey)) post‐intervention 4 months Show forest plot | 1 | Mean Difference (IV, Random, 95% CI) | Subtotals only | |
| 4.1 Activity | 1 | 41 | Mean Difference (IV, Random, 95% CI) | 0.41 [0.11, 0.71] |
| 4.2 Rhythmicity | 1 | 41 | Mean Difference (IV, Random, 95% CI) | ‐0.19 [‐0.63, 0.25] |
| 4.3 Approach | 1 | 41 | Mean Difference (IV, Random, 95% CI) | 0.17 [‐0.18, 0.52] |
| 4.4 Adaptability | 1 | 41 | Mean Difference (IV, Random, 95% CI) | 0.10 [‐0.30, 0.50] |
| 4.5 Intensity | 1 | 41 | Mean Difference (IV, Random, 95% CI) | 0.19 [‐0.28, 0.66] |
| 4.6 Mood | 1 | 41 | Mean Difference (IV, Random, 95% CI) | 0.31 [‐0.14, 0.76] |
| 4.7 Persistence | 1 | 41 | Mean Difference (IV, Random, 95% CI) | 0.33 [‐0.11, 0.77] |
| 4.8 Distractibility | 1 | 41 | Mean Difference (IV, Random, 95% CI) | 0.28 [‐0.18, 0.74] |
| 4.9 Threshold | 1 | 41 | Mean Difference (IV, Random, 95% CI) | 0.11 [‐0.43, 0.65] |
| 5 Infant temperament questionnaire (revised RITQ (Carey)) follow‐up 8 months Show forest plot | 1 | 369 | Mean Difference (IV, Random, 95% CI) | 0.66 [0.48, 0.84] |
| 5.1 Activity | 1 | 41 | Mean Difference (IV, Random, 95% CI) | 0.25 [‐0.33, 0.83] |
| 5.2 Rhythmicity | 1 | 41 | Mean Difference (IV, Random, 95% CI) | 0.80 [0.12, 1.48] |
| 5.3 Approach | 1 | 41 | Mean Difference (IV, Random, 95% CI) | 0.88 [0.25, 1.51] |
| 5.4 Adaptability | 1 | 41 | Mean Difference (IV, Random, 95% CI) | 0.69 [0.01, 1.37] |
| 5.5 Intensity | 1 | 41 | Mean Difference (IV, Random, 95% CI) | 0.39 [0.02, 0.76] |
| 5.6 Mood | 1 | 41 | Mean Difference (IV, Random, 95% CI) | 1.08 [0.65, 1.51] |
| 5.7 Persistence | 1 | 41 | Mean Difference (IV, Random, 95% CI) | 0.65 [‐0.03, 1.33] |
| 5.8 Distractibility | 1 | 41 | Mean Difference (IV, Random, 95% CI) | 0.72 [0.32, 1.12] |
| 5.9 Threshold | 1 | 41 | Mean Difference (IV, Random, 95% CI) | 0.48 [‐0.27, 1.23] |
| 6 Infant Care Questionnaire post‐intervention Show forest plot | 1 | Mean Difference (IV, Random, 95% CI) | Subtotals only | |
| 6.1 ICQ fussy/difficult | 1 | 59 | Mean Difference (IV, Random, 95% CI) | 1.37 [‐2.53, 5.27] |
| 6.2 ICQ unadaptable | 1 | 59 | Mean Difference (IV, Random, 95% CI) | ‐0.19 [‐1.51, 1.13] |
| 6.3 ICQ dull | 1 | 59 | Mean Difference (IV, Random, 95% CI) | ‐1.08 [‐2.60, 0.44] |
| 6.4 ICQ unpredictable | 1 | 59 | Mean Difference (IV, Random, 95% CI) | 0.61 [‐1.78, 3.00] |
| 7 Infant Care Questionnaire follow‐up 1 year Show forest plot | 1 | Mean Difference (IV, Random, 95% CI) | Subtotals only | |
| 7.1 ICQ fussy/difficult | 1 | 50 | Mean Difference (IV, Random, 95% CI) | 1.05 [‐2.43, 4.53] |
| 7.2 ICQ unadaptable | 1 | 50 | Mean Difference (IV, Random, 95% CI) | ‐0.39 [‐1.63, 0.85] |
| 7.3 ICQ dull | 1 | 50 | Mean Difference (IV, Random, 95% CI) | 0.35 [‐1.54, 2.24] |
| 7.4 ICQ unpredictable | 1 | 50 | Mean Difference (IV, Random, 95% CI) | 1.89 [‐0.55, 4.33] |
| 8 Infant attachment (Q set) Show forest plot | 1 | Mean Difference (IV, Random, 95% CI) | Subtotals only | |
| 8.1 Follow‐up 1 year | 1 | 39 | Mean Difference (IV, Random, 95% CI) | ‐0.06 [‐0.17, 0.05] |
| 9 Child behaviour (HOME) Show forest plot | 1 | Mean Difference (IV, Random, 95% CI) | Subtotals only | |
| 9.1 Follow‐up (24 months) | 1 | 25 | Mean Difference (IV, Random, 95% CI) | 0.34 [‐1.92, 2.60] |
| 10 Eyberg Child Behaviour Inventory (ECBI) ‐ Intensity domain Show forest plot | 1 | Mean Difference (IV, Random, 95% CI) | Subtotals only | |
| 10.1 Follow‐up 24 months | 1 | 25 | Mean Difference (IV, Random, 95% CI) | 4.95 [‐9.94, 19.84] |
| 11 Eyberg Child Behaviour Inventory (ECBI) ‐ Problem domain Show forest plot | 1 | 25 | Mean Difference (IV, Random, 95% CI) | ‐0.19 [‐3.26, 2.88] |
| 11.1 Follow‐up 24 months | 1 | 25 | Mean Difference (IV, Random, 95% CI) | ‐0.19 [‐3.26, 2.88] |
| 12 Mother and child interaction meta‐analysis ‐ Total NCATS and Murray Global Show forest plot | 4 | Std. Mean Difference (IV, Random, 95% CI) | Subtotals only | |
| 12.1 Post‐intervention | 3 | 131 | Std. Mean Difference (IV, Random, 95% CI) | ‐0.26 [‐1.01, 0.48] |
| 12.2 Follow‐up 12 and 24 months | 2 | 65 | Std. Mean Difference (IV, Random, 95% CI) | ‐0.20 [‐0.69, 0.29] |
| 13 Nursing Child Feeding Assessment Scale (NCAFS) ‐ Total Show forest plot | 1 | Mean Difference (IV, Random, 95% CI) | Subtotals only | |
| 13.1 Post‐intervention (16 weeks) | 1 | 47 | Mean Difference (IV, Random, 95% CI) | ‐2.10 [‐6.16, 1.96] |
| 14 Nursing Child Assessment Teaching Scale (NCATS) ‐ Mother Show forest plot | 1 | Std. Mean Difference (IV, Random, 95% CI) | Subtotals only | |
| 14.1 Follow‐up 24 months | 1 | 25 | Std. Mean Difference (IV, Random, 95% CI) | ‐0.18 [‐0.96, 0.61] |
| 15 Nursing Child Assessment Teaching Scale (NCATS) ‐ Child Show forest plot | 1 | 25 | Std. Mean Difference (IV, Random, 95% CI) | 0.35 [‐0.44, 1.14] |
| 15.1 Follow‐up 24 months | 1 | 25 | Std. Mean Difference (IV, Random, 95% CI) | 0.35 [‐0.44, 1.14] |
| 16 Maternal sensitivity ‐ warm to cold (Murray) Show forest plot | 2 | Mean Difference (IV, Random, 95% CI) | Subtotals only | |
| 16.1 Post‐intervention | 2 | 84 | Mean Difference (IV, Random, 95% CI) | ‐0.34 [‐1.07, 0.40] |
| 16.2 Follow‐up 1 year | 1 | 40 | Mean Difference (IV, Random, 95% CI) | ‐0.84 [‐1.07, ‐0.61] |
| 17 Maternal sensitivity ‐ non‐intrusive to intrusive (Murray) Show forest plot | 2 | Mean Difference (IV, Random, 95% CI) | Subtotals only | |
| 17.1 Post‐intervention | 2 | 84 | Mean Difference (IV, Random, 95% CI) | ‐0.10 [‐0.85, 0.66] |
| 17.2 Follow‐up 1 year | 1 | 40 | Mean Difference (IV, Random, 95% CI) | ‐0.01 [‐0.30, 0.28] |
| 18 Maternal sensitivity ‐ remoteness (Murray) Show forest plot | 1 | Mean Difference (IV, Random, 95% CI) | Subtotals only | |
| 18.1 Post‐intervention | 1 | 40 | Mean Difference (IV, Random, 95% CI) | 0.08 [‐0.32, 0.48] |
| 18.2 Follow‐up | 1 | 62 | Mean Difference (IV, Random, 95% CI) | ‐0.14 [‐0.40, 0.12] |
| 19 Infant interactions ‐ infant performance ‐ attentive to non attentive (Murray) Show forest plot | 2 | Mean Difference (IV, Random, 95% CI) | Subtotals only | |
| 19.1 Post‐intervention | 2 | 84 | Mean Difference (IV, Random, 95% CI) | ‐0.47 [‐1.47, 0.52] |
| 19.2 Follow‐up 1 year | 1 | 40 | Mean Difference (IV, Random, 95% CI) | 0.18 [‐0.18, 0.54] |
| 20 Infant interactions ‐ lively to inert (Murray) Show forest plot | 2 | Mean Difference (IV, Random, 95% CI) | Subtotals only | |
| 20.1 Post‐intervention | 2 | 84 | Mean Difference (IV, Random, 95% CI) | ‐0.46 [‐1.45, 0.53] |
| 20.2 Follow‐up 1 year | 1 | 40 | Mean Difference (IV, Random, 95% CI) | ‐0.11 [‐0.31, 0.09] |
| 21 Infant interactions ‐ happy to distressed (Murray) Show forest plot | 2 | Mean Difference (IV, Random, 95% CI) | Subtotals only | |
| 21.1 Post intervention | 2 | 84 | Mean Difference (IV, Random, 95% CI) | ‐0.35 [‐1.29, 0.59] |
| 21.2 Follow‐up 1 year | 1 | 40 | Mean Difference (IV, Random, 95% CI) | ‐0.02 [‐0.26, 0.22] |
| 22 Parenting stress (PSI Abidin) child characteristics subscale Show forest plot | 2 | Mean Difference (IV, Random, 95% CI) | Subtotals only | |
| 22.1 Post‐intervention | 2 | 55 | Mean Difference (IV, Random, 95% CI) | ‐10.85 [‐53.86, 32.16] |
| 23 Psychomotor Development Indices (PDI) meta‐analysis post‐intervention Show forest plot | 4 | Std. Mean Difference (IV, Random, 95% CI) | Subtotals only | |
| 23.1 Post‐intervention | 4 | 466 | Std. Mean Difference (IV, Random, 95% CI) | ‐0.35 [‐0.54, ‐0.15] |
| 23.2 Post‐intervention sensitivity analysis Western studies | 1 | 41 | Std. Mean Difference (IV, Random, 95% CI) | 0.00 [‐0.61, 0.62] |
| 24 Bayley Psychomotor Development Index (PDI) follow‐up Show forest plot | 1 | Mean Difference (IV, Random, 95% CI) | Subtotals only | |
| 24.1 Follow‐up 8 months | 1 | 41 | Mean Difference (IV, Random, 95% CI) | ‐0.78 [‐11.89, 10.33] |
| 24.2 Follow‐up 24 months | 1 | 41 | Mean Difference (IV, Random, 95% CI) | ‐7.52 [‐16.53, 1.49] |
| 25 Mental Development Indices (MDI) meta‐analysis post‐intervention Show forest plot | 4 | Std. Mean Difference (IV, Random, 95% CI) | Subtotals only | |
| 25.1 Post‐intervention | 4 | 466 | Std. Mean Difference (IV, Random, 95% CI) | ‐0.27 [‐0.64, 0.11] |
| 25.2 Post‐intervention sensitivity analysis Western studies | 1 | 41 | Std. Mean Difference (IV, Random, 95% CI) | 0.38 [‐0.23, 1.00] |
| 26 Bayley Mental Development Index (MDI) follow‐up Show forest plot | 1 | Mean Difference (IV, Random, 95% CI) | Subtotals only | |
| 26.1 Follow‐up 8 months | 1 | 41 | Mean Difference (IV, Random, 95% CI) | 22.85 [4.26, 41.44] |
| 26.2 Follow‐up 24 months | 1 | 41 | Mean Difference (IV, Random, 95% CI) | ‐8.59 [‐18.80, 1.62] |
| 27 Gessel/Capital meta‐analysis (post intervention) Show forest plot | 2 | Std. Mean Difference (IV, Random, 95% CI) | Subtotals only | |
| 27.1 Gross motor | 2 | 237 | Std. Mean Difference (IV, Random, 95% CI) | ‐0.44 [‐0.70, ‐0.18] |
| 27.2 Fine motor | 2 | 237 | Std. Mean Difference (IV, Random, 95% CI) | ‐0.61 [‐0.87, ‐0.35] |
| 27.3 Language | 2 | 237 | Std. Mean Difference (IV, Random, 95% CI) | ‐0.82 [‐1.67, 0.03] |
| 27.4 Personal‐social behaviour | 2 | 237 | Std. Mean Difference (IV, Random, 95% CI) | ‐0.90 [‐1.61, ‐0.18] |
| 28 Gessel Developmental Quotient (post intervention) Show forest plot | 1 | Mean Difference (IV, Random, 95% CI) | Subtotals only | |
| 28.1 Adaptive behaviour | 1 | 180 | Mean Difference (IV, Random, 95% CI) | ‐7.07 [‐9.75, ‐4.39] |
| 28.2 Gross motor | 1 | 180 | Mean Difference (IV, Random, 95% CI) | ‐3.97 [‐6.99, ‐0.95] |
| 28.3 Fine motor | 1 | 180 | Mean Difference (IV, Random, 95% CI) | ‐6.89 [‐10.18, ‐3.60] |
| 28.4 Language | 1 | 180 | Mean Difference (IV, Random, 95% CI) | ‐4.15 [‐7.03, ‐1.27] |
| 28.5 Personal‐social behaviour | 1 | 180 | Mean Difference (IV, Random, 95% CI) | ‐6.41 [‐9.65, ‐3.17] |
| 29 Capital institute Mental Checklist (post intervention) Show forest plot | 1 | Mean Difference (IV, Random, 95% CI) | Subtotals only | |
| 29.1 Gross motor | 1 | 57 | Mean Difference (IV, Random, 95% CI) | ‐0.24 [‐0.44, ‐0.05] |
| 29.2 Fine motor | 1 | 57 | Mean Difference (IV, Random, 95% CI) | ‐0.28 [‐0.51, ‐0.05] |
| 29.3 Cognitive | 1 | 57 | Mean Difference (IV, Random, 95% CI) | ‐0.54 [‐0.92, ‐0.15] |
| 29.4 Language | 1 | 57 | Mean Difference (IV, Random, 95% CI) | ‐0.7 [‐0.99, ‐0.41] |
| 29.5 Social behaviour | 1 | 57 | Mean Difference (IV, Random, 95% CI) | ‐0.70 [‐0.97, ‐0.42] |
| 29.6 IQ | 1 | 57 | Mean Difference (IV, Random, 95% CI) | ‐27.18 [‐33.13, ‐21.23] |
| 30 Gessel Developmental Quotient (follow‐up 6 months) Show forest plot | 1 | Mean Difference (IV, Random, 95% CI) | Subtotals only | |
| 30.1 Adaptive behaviour | 1 | 116 | Mean Difference (IV, Random, 95% CI) | ‐5.79 [‐9.64, ‐1.94] |
| 30.2 Gross motor | 1 | 116 | Mean Difference (IV, Random, 95% CI) | ‐2.85 [‐8.18, 2.48] |
| 30.3 Fine motor | 1 | 116 | Mean Difference (IV, Random, 95% CI) | ‐8.12 [‐11.67, ‐4.57] |
| 30.4 Language | 1 | 116 | Mean Difference (IV, Random, 95% CI) | ‐7.90 [‐11.70, ‐4.10] |
| 30.5 Personal‐social behaviour | 1 | 116 | Mean Difference (IV, Random, 95% CI) | ‐6.19 [‐9.83, ‐2.55] |
| 31 Attachment patterns (strange situation procedure) Show forest plot | 1 | Risk Ratio (M‐H, Random, 95% CI) | Subtotals only | |
| 31.1 Secure (1 year follow‐up) | 1 | 39 | Risk Ratio (M‐H, Random, 95% CI) | 0.82 [0.50, 1.34] |
| 31.2 Avoidant (1 year follow‐up) | 1 | 39 | Risk Ratio (M‐H, Random, 95% CI) | 1.39 [0.14, 14.07] |
| 31.3 Resistant (1 year follow‐up) | 1 | 39 | Risk Ratio (M‐H, Random, 95% CI) | 3.48 [0.45, 27.02] |
| 31.4 Disorganised (1 year follow‐up) | 1 | 39 | Risk Ratio (M‐H, Random, 95% CI) | 0.70 [0.16, 3.02] |
| 32 Distractibility (toy) follow‐up 1 year Show forest plot | 1 | Risk Ratio (M‐H, Random, 95% CI) | Subtotals only | |
| 32.1 Mean looks greater than 14 secs | 1 | 32 | Risk Ratio (M‐H, Random, 95% CI) | 2.65 [0.31, 22.82] |
| 32.2 Mean looks less than 14 secs | 1 | 32 | Risk Ratio (M‐H, Random, 95% CI) | 0.88 [0.68, 1.14] |
| 32.3 Max looks greater than 14 secs | 1 | 32 | Risk Ratio (M‐H, Random, 95% CI) | 0.96 [0.66, 1.38] |
| 32.4 Max looks less than 14 secs | 1 | 32 | Risk Ratio (M‐H, Random, 95% CI) | 1.76 [0.37, 8.31] |
| 33 Habituation Show forest plot | 1 | 32 | Mean Difference (IV, Random, 95% CI) | ‐1.10 [‐4.79, 2.59] |
| 34 Seconds to habituation Show forest plot | 1 | 32 | Mean Difference (IV, Random, 95% CI) | ‐10.90 [‐69.41, 47.61] |
| 35 Trials to habituation Show forest plot | 1 | Mean Difference (IV, Random, 95% CI) | Subtotals only | |
| 36 Post habituation Show forest plot | 1 | 32 | Mean Difference (IV, Random, 95% CI) | 2.0 [‐2.43, 6.43] |
| 37 Habituation test Show forest plot | 1 | 32 | Mean Difference (IV, Random, 95% CI) | ‐12.40 [‐19.37, ‐5.43] |