Scolaris Content Display Scolaris Content Display

Comparison 1 Infant massage versus control, Outcome 1 Weight (gms).
Figuras y tablas -
Analysis 1.1

Comparison 1 Infant massage versus control, Outcome 1 Weight (gms).

Comparison 1 Infant massage versus control, Outcome 2 Length (cms).
Figuras y tablas -
Analysis 1.2

Comparison 1 Infant massage versus control, Outcome 2 Length (cms).

Comparison 1 Infant massage versus control, Outcome 3 Head circumference (cms).
Figuras y tablas -
Analysis 1.3

Comparison 1 Infant massage versus control, Outcome 3 Head circumference (cms).

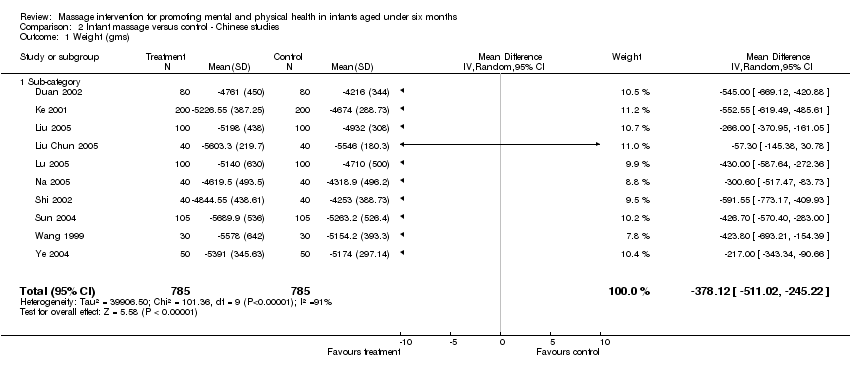
Comparison 2 Infant massage versus control ‐ Chinese studies, Outcome 1 Weight (gms).
Figuras y tablas -
Analysis 2.1

Comparison 2 Infant massage versus control ‐ Chinese studies, Outcome 1 Weight (gms).

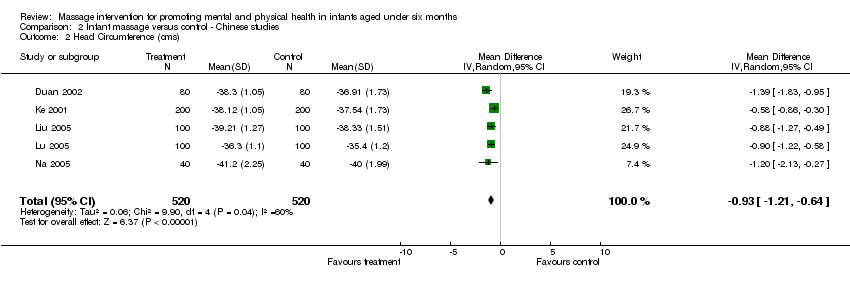
Comparison 2 Infant massage versus control ‐ Chinese studies, Outcome 2 Head Circumference (cms).
Figuras y tablas -
Analysis 2.2

Comparison 2 Infant massage versus control ‐ Chinese studies, Outcome 2 Head Circumference (cms).

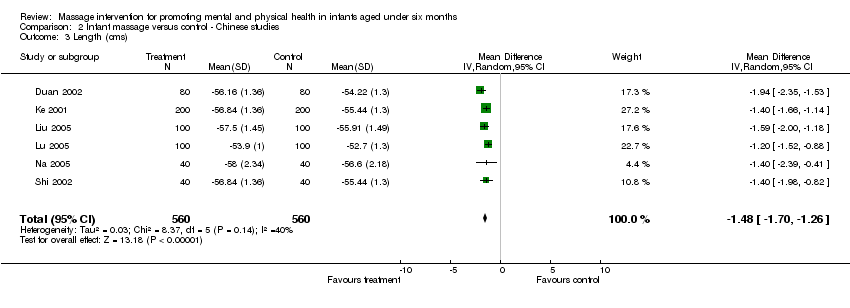
Comparison 2 Infant massage versus control ‐ Chinese studies, Outcome 3 Length (cms).
Figuras y tablas -
Analysis 2.3

Comparison 2 Infant massage versus control ‐ Chinese studies, Outcome 3 Length (cms).

Comparison 2 Infant massage versus control ‐ Chinese studies, Outcome 4 Sleep (hrs).
Figuras y tablas -
Analysis 2.4

Comparison 2 Infant massage versus control ‐ Chinese studies, Outcome 4 Sleep (hrs).

Comparison 2 Infant massage versus control ‐ Chinese studies, Outcome 5 Bilirubin (mmol/l) (7 days PN).
Figuras y tablas -
Analysis 2.5

Comparison 2 Infant massage versus control ‐ Chinese studies, Outcome 5 Bilirubin (mmol/l) (7 days PN).

Comparison 3 Sensitivity analysis, Outcome 1 Weight.
Figuras y tablas -
Analysis 3.1

Comparison 3 Sensitivity analysis, Outcome 1 Weight.

Comparison 1. Infant massage versus control

Outcome or subgroup title

No. of studies

No. of participants

Statistical method

Effect size

1 Weight (gms) Show forest plot

4

264

Mean Difference (IV, Random, 95% CI)

‐297.72 [‐859.26, 263.81]

2 Length (cms) Show forest plot

2

183

Mean Difference (IV, Random, 95% CI)

‐0.76 [‐2.67, 1.15]

3 Head circumference (cms) Show forest plot

2

183

Mean Difference (IV, Random, 95% CI)

‐0.87 [‐2.62, 0.87]

Figuras y tablas -
Comparison 1. Infant massage versus control
Comparison 2. Infant massage versus control ‐ Chinese studies

Outcome or subgroup title

No. of studies

No. of participants

Statistical method

Effect size

1 Weight (gms) Show forest plot

10

1570

Mean Difference (IV, Random, 95% CI)

‐378.12 [‐511.02, ‐245.22]

1.1 Sub‐category

10

1570

Mean Difference (IV, Random, 95% CI)

‐378.12 [‐511.02, ‐245.22]

2 Head Circumference (cms) Show forest plot

5

1040

Mean Difference (IV, Random, 95% CI)

‐0.93 [‐1.21, ‐0.64]

3 Length (cms) Show forest plot

6

1120

Mean Difference (IV, Random, 95% CI)

‐1.48 [‐1.70, ‐1.26]

4 Sleep (hrs) Show forest plot

3

534

Mean Difference (IV, Random, 95% CI)

‐0.62 [‐1.12, ‐0.12]

5 Bilirubin (mmol/l) (7 days PN) Show forest plot

2

410

Mean Difference (IV, Random, 95% CI)

‐38.11 [‐50.61, ‐25.61]

Figuras y tablas -
Comparison 2. Infant massage versus control ‐ Chinese studies
Comparison 3. Sensitivity analysis

Outcome or subgroup title

No. of studies

No. of participants

Statistical method

Effect size

1 Weight Show forest plot

3

206

Mean Difference (IV, Random, 95% CI)

4.12 [‐223.91, 232.16]

Figuras y tablas -
Comparison 3. Sensitivity analysis