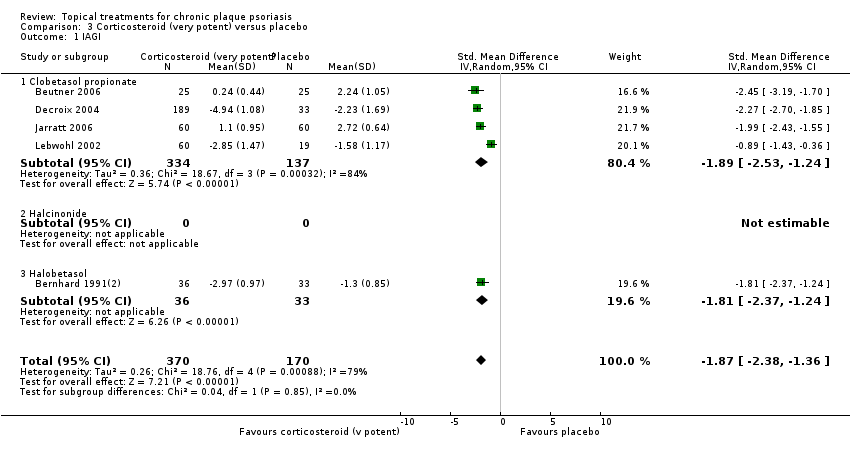
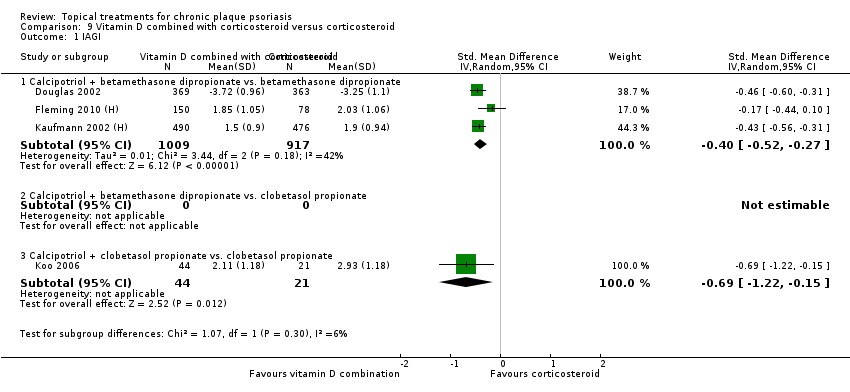
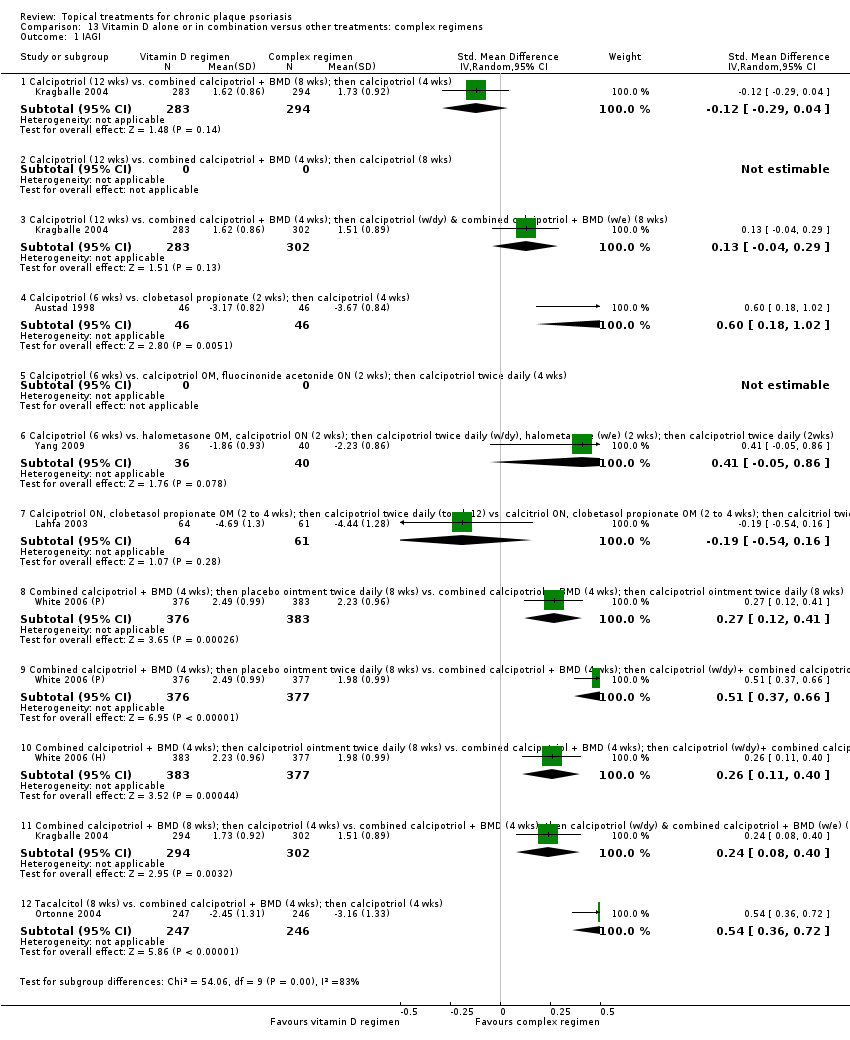
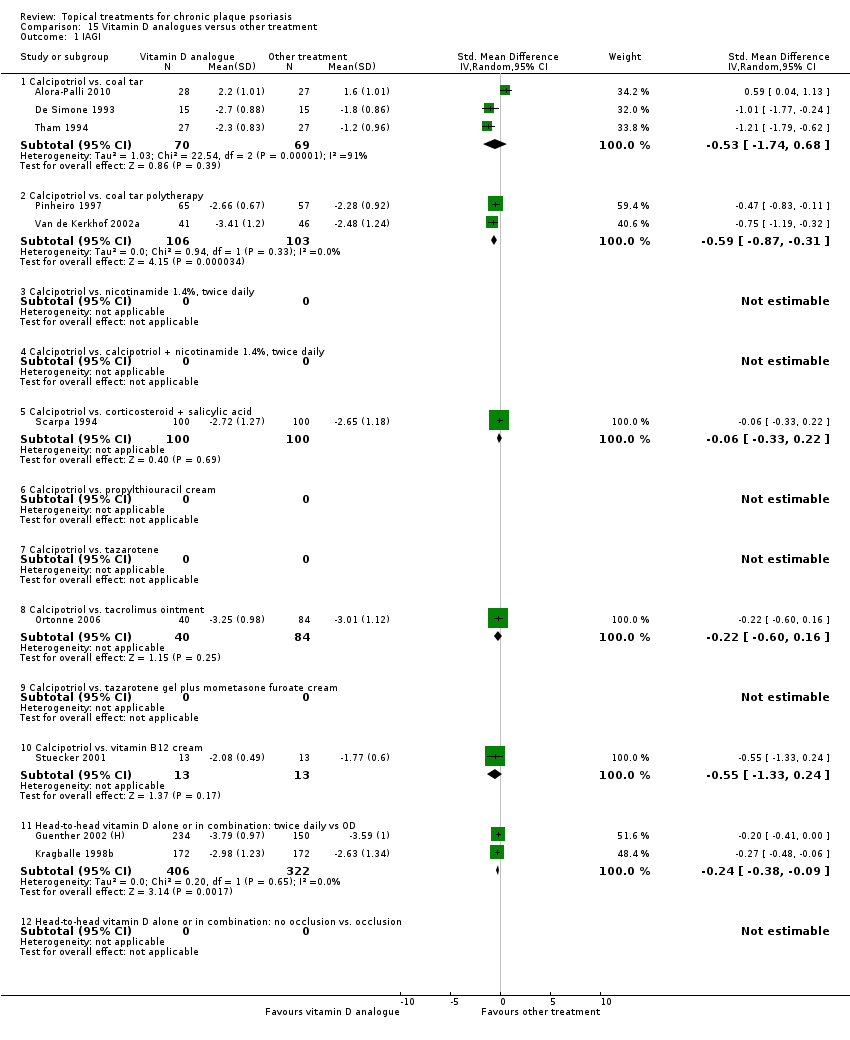
| 1 IAGI Show forest plot | 8 | | Std. Mean Difference (IV, Random, 95% CI) | Totals not selected |
|
| 1.1 Aloe vera extract 0.5% hydrophilic cream, three times per day | 0 | | Std. Mean Difference (IV, Random, 95% CI) | 0.0 [0.0, 0.0] |
| 1.2 Anti‐IL‐8 monoclonal antibody cream | 1 | | Std. Mean Difference (IV, Random, 95% CI) | 0.0 [0.0, 0.0] |
| 1.3 Betamethasone 17‐valerate 21‐acetate plus tretinoin plus salicylic acid | 1 | | Std. Mean Difference (IV, Random, 95% CI) | 0.0 [0.0, 0.0] |
| 1.4 Caffeine (topical) 10%, TD | 0 | | Std. Mean Difference (IV, Random, 95% CI) | 0.0 [0.0, 0.0] |
| 1.5 Calcipotriene 0.005% ointment + nicotinamide 0.05% or 0.1% or 0.7% or 1.4%, twice daily | 0 | | Std. Mean Difference (IV, Random, 95% CI) | 0.0 [0.0, 0.0] |
| 1.6 Dead Sea salts emollient lotion | 0 | | Std. Mean Difference (IV, Random, 95% CI) | 0.0 [0.0, 0.0] |
| 1.7 Fish oil plus occlusion | 0 | | Std. Mean Difference (IV, Random, 95% CI) | 0.0 [0.0, 0.0] |
| 1.8 Herbal skin care (Dr Michaels® cleansing gel, ointment and skin conditioner), twice daily | 0 | | Std. Mean Difference (IV, Random, 95% CI) | 0.0 [0.0, 0.0] |
| 1.9 Hexafluoro‐1,25‐dihydroxyvitamin D3 | 1 | | Std. Mean Difference (IV, Random, 95% CI) | 0.0 [0.0, 0.0] |
| 1.10 Indigo naturalis 1.4% ointment | 1 | | Std. Mean Difference (IV, Random, 95% CI) | 0.0 [0.0, 0.0] |
| 1.11 Kukui nut oil, TD | 1 | | Std. Mean Difference (IV, Random, 95% CI) | 0.0 [0.0, 0.0] |
| 1.12 Mahonia aquifolium (Reliéva™), twice daily | 0 | | Std. Mean Difference (IV, Random, 95% CI) | 0.0 [0.0, 0.0] |
| 1.13 Methotrexate gel | 1 | | Std. Mean Difference (IV, Random, 95% CI) | 0.0 [0.0, 0.0] |
| 1.14 Mycophenolic acid ointment | 0 | | Std. Mean Difference (IV, Random, 95% CI) | 0.0 [0.0, 0.0] |
| 1.15 NG‐monomethyl‐L‐arginine (L‐NMMA) cream | 0 | | Std. Mean Difference (IV, Random, 95% CI) | 0.0 [0.0, 0.0] |
| 1.16 Nicotinamide 1.4%, twice daily | 0 | | Std. Mean Difference (IV, Random, 95% CI) | 0.0 [0.0, 0.0] |
| 1.17 Oleum horwathiensis (Psoricur®) | 1 | | Std. Mean Difference (IV, Random, 95% CI) | 0.0 [0.0, 0.0] |
| 1.18 Omega‐3‐polyunsaturated fatty acids ointment | 0 | | Std. Mean Difference (IV, Random, 95% CI) | 0.0 [0.0, 0.0] |
| 1.19 Platelet aggregation activating factor (PAF)(Ro 24‐0238) | 1 | | Std. Mean Difference (IV, Random, 95% CI) | 0.0 [0.0, 0.0] |
| 1.20 Polymyxin B cream 200,000 U/g | 0 | | Std. Mean Difference (IV, Random, 95% CI) | 0.0 [0.0, 0.0] |
| 1.21 PTH (1‐34) in Novasome A® liposomal cream, twice daily | 0 | | Std. Mean Difference (IV, Random, 95% CI) | 0.0 [0.0, 0.0] |
| 1.22 Sirolimus (topical), 2.2% for 6 wks, then 8% for a further 6 wks | 0 | | Std. Mean Difference (IV, Random, 95% CI) | 0.0 [0.0, 0.0] |
| 1.23 Tacrolimus ointment | 0 | | Std. Mean Difference (IV, Random, 95% CI) | 0.0 [0.0, 0.0] |
| 1.24 Tar | 0 | | Std. Mean Difference (IV, Random, 95% CI) | 0.0 [0.0, 0.0] |
| 1.25 Tazarotene | 0 | | Std. Mean Difference (IV, Random, 95% CI) | 0.0 [0.0, 0.0] |
| 1.26 Theophylline 1% ointment, twice daily | 0 | | Std. Mean Difference (IV, Random, 95% CI) | 0.0 [0.0, 0.0] |
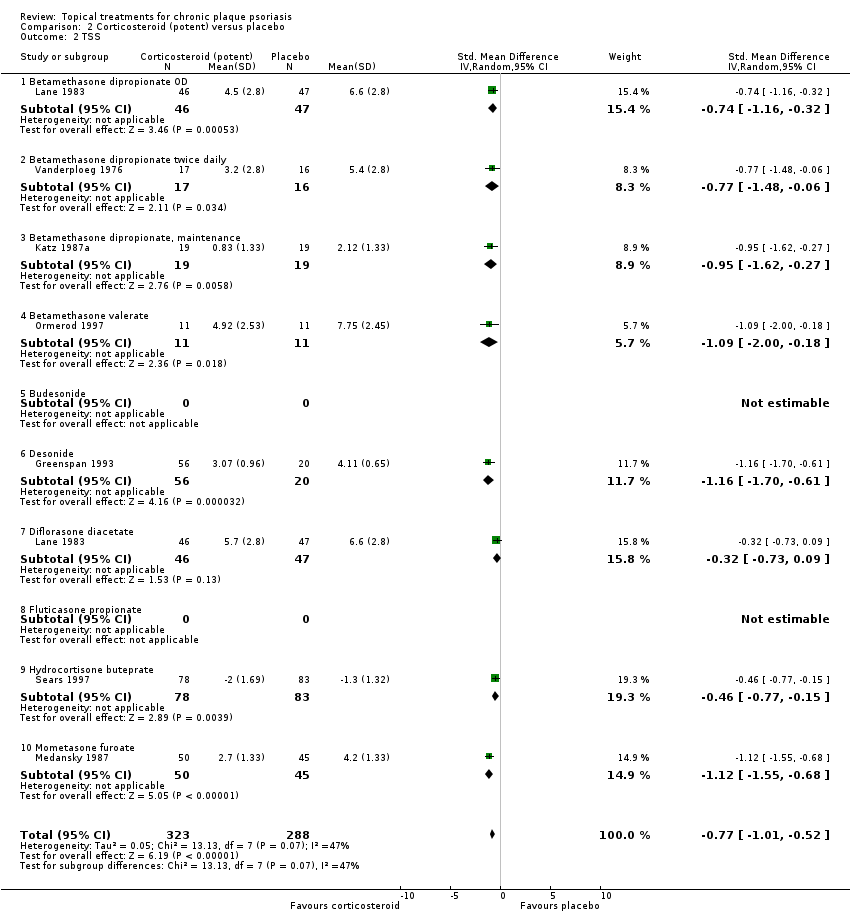
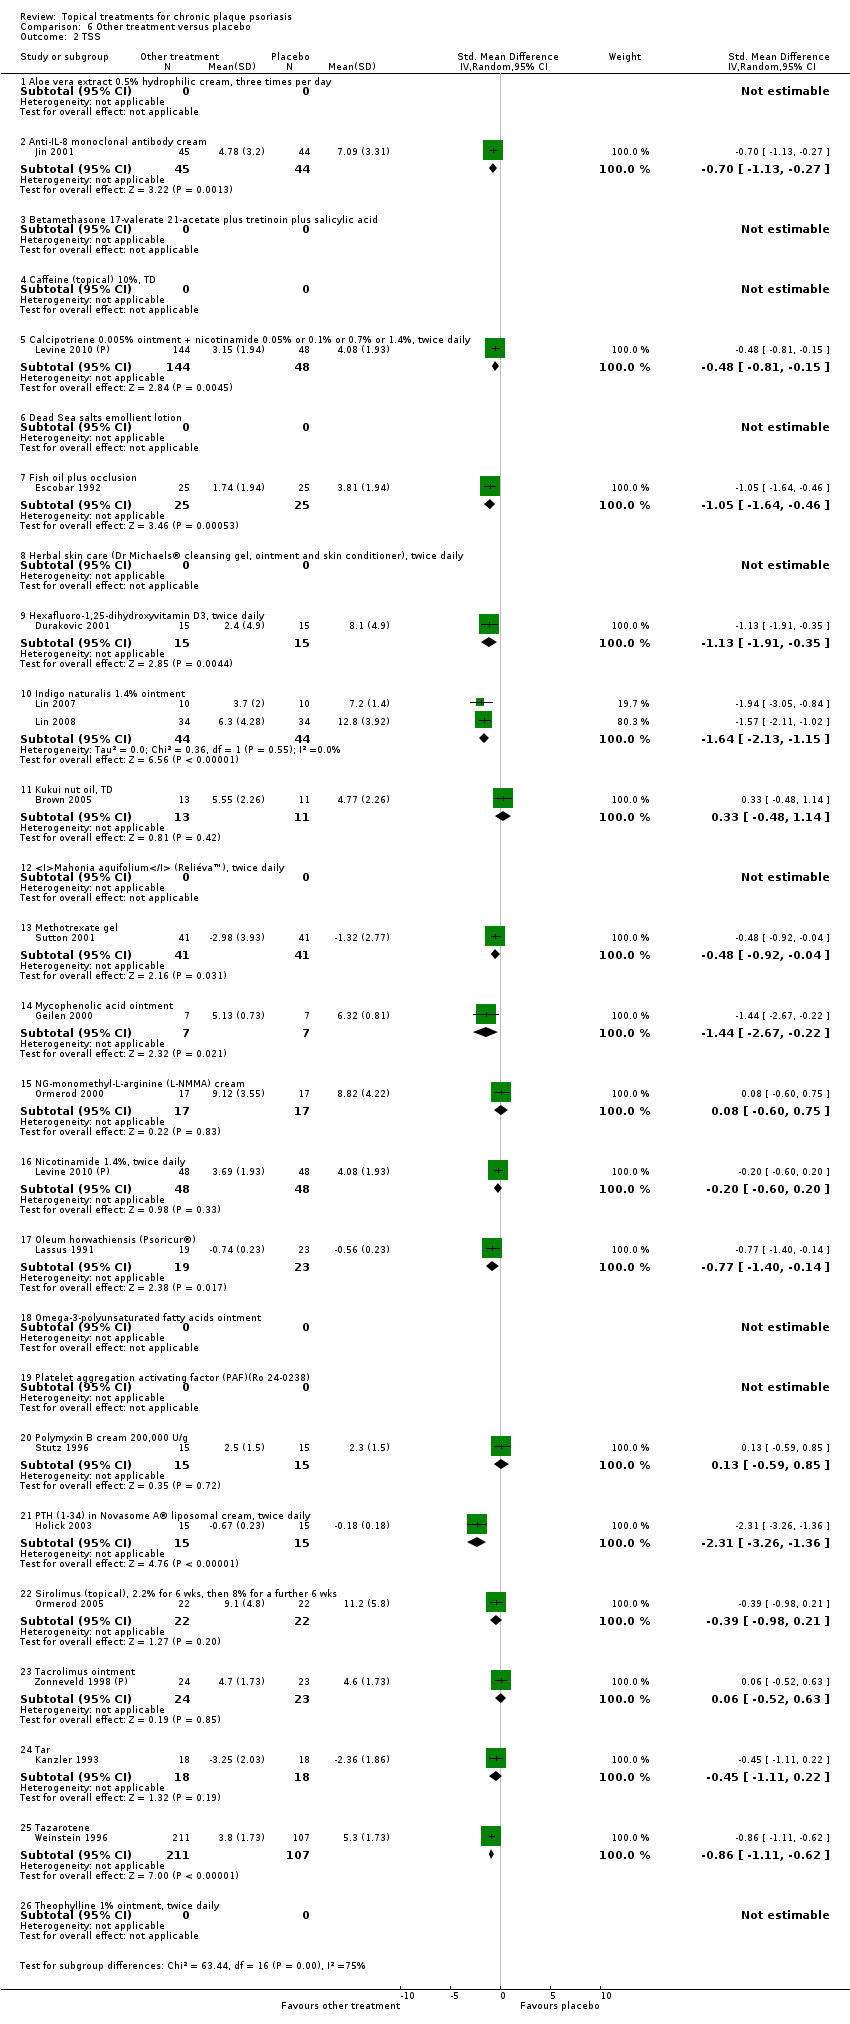
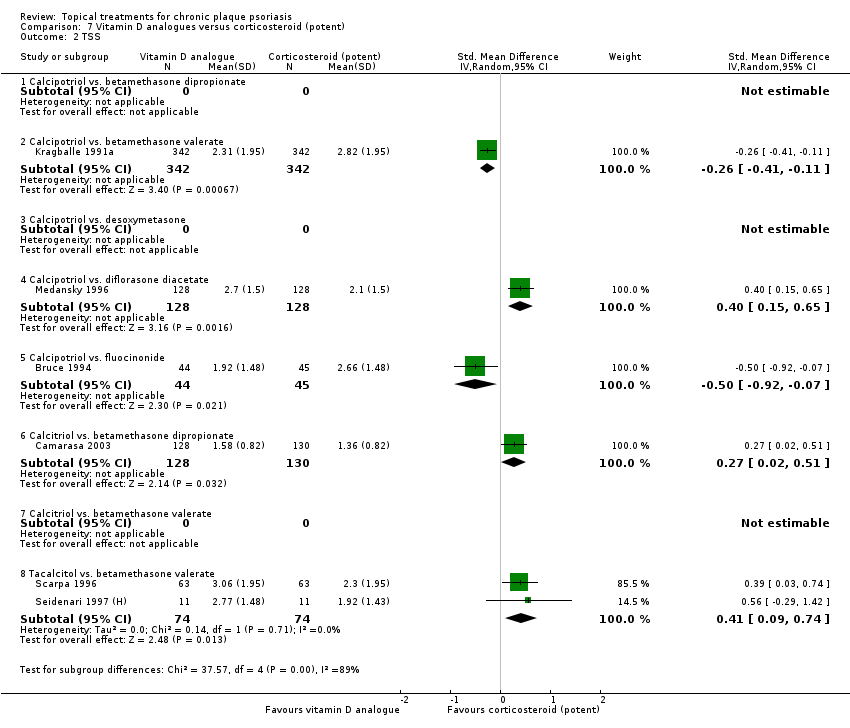
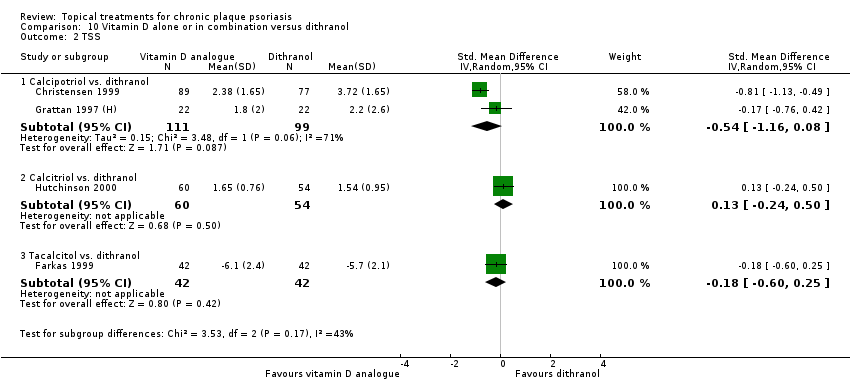
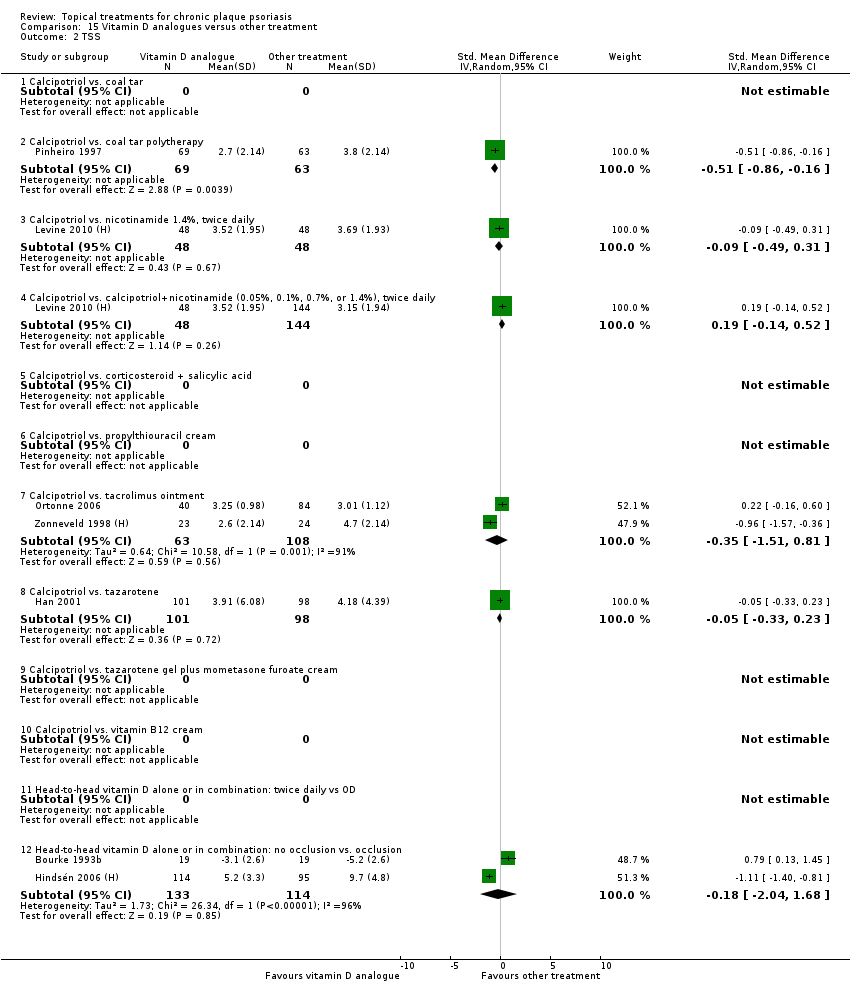
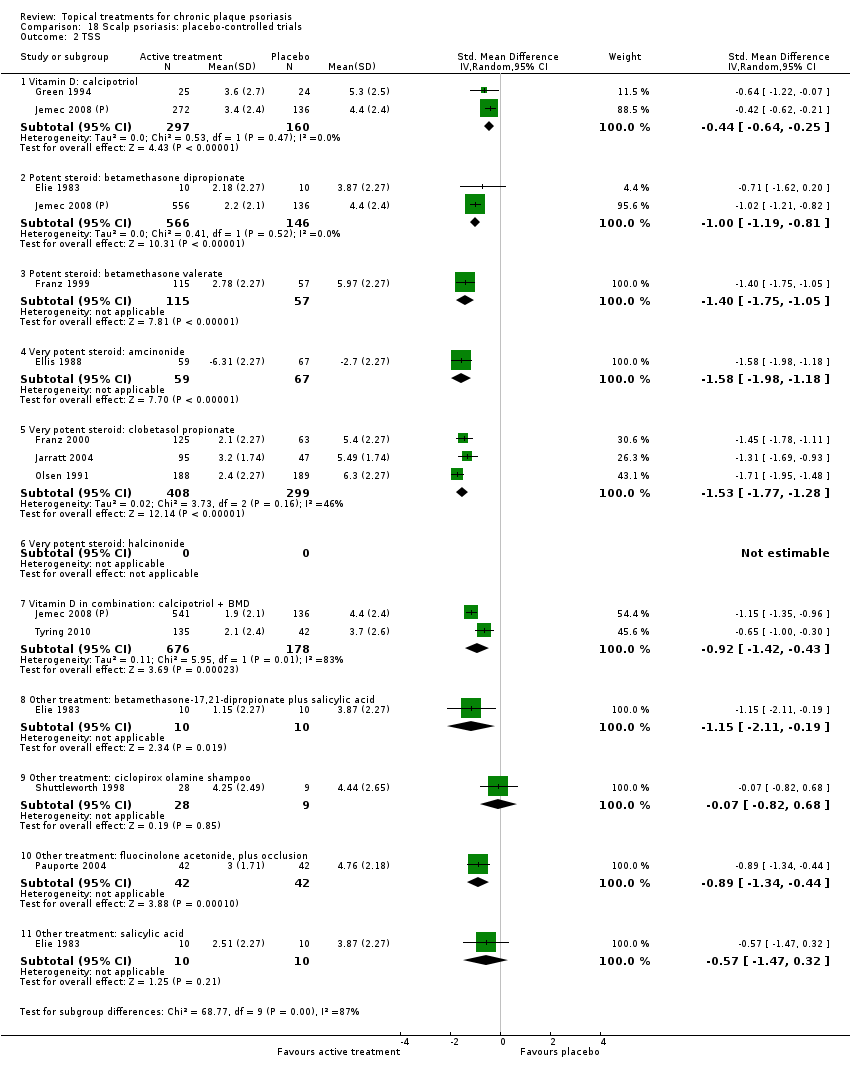
| 2 TSS Show forest plot | 17 | | Std. Mean Difference (IV, Random, 95% CI) | Subtotals only |
|
| 2.1 Aloe vera extract 0.5% hydrophilic cream, three times per day | 0 | 0 | Std. Mean Difference (IV, Random, 95% CI) | 0.0 [0.0, 0.0] |
| 2.2 Anti‐IL‐8 monoclonal antibody cream | 1 | 89 | Std. Mean Difference (IV, Random, 95% CI) | ‐0.70 [‐1.13, ‐0.27] |
| 2.3 Betamethasone 17‐valerate 21‐acetate plus tretinoin plus salicylic acid | 0 | 0 | Std. Mean Difference (IV, Random, 95% CI) | 0.0 [0.0, 0.0] |
| 2.4 Caffeine (topical) 10%, TD | 0 | 0 | Std. Mean Difference (IV, Random, 95% CI) | 0.0 [0.0, 0.0] |
| 2.5 Calcipotriene 0.005% ointment + nicotinamide 0.05% or 0.1% or 0.7% or 1.4%, twice daily | 1 | 192 | Std. Mean Difference (IV, Random, 95% CI) | ‐0.48 [‐0.81, ‐0.15] |
| 2.6 Dead Sea salts emollient lotion | 0 | 0 | Std. Mean Difference (IV, Random, 95% CI) | 0.0 [0.0, 0.0] |
| 2.7 Fish oil plus occlusion | 1 | 50 | Std. Mean Difference (IV, Random, 95% CI) | ‐1.05 [‐1.64, ‐0.46] |
| 2.8 Herbal skin care (Dr Michaels® cleansing gel, ointment and skin conditioner), twice daily | 0 | 0 | Std. Mean Difference (IV, Random, 95% CI) | 0.0 [0.0, 0.0] |
| 2.9 Hexafluoro‐1,25‐dihydroxyvitamin D3, twice daily | 1 | 30 | Std. Mean Difference (IV, Random, 95% CI) | ‐1.13 [‐1.91, ‐0.35] |
| 2.10 Indigo naturalis 1.4% ointment | 2 | 88 | Std. Mean Difference (IV, Random, 95% CI) | ‐1.64 [‐2.13, ‐1.15] |
| 2.11 Kukui nut oil, TD | 1 | 24 | Std. Mean Difference (IV, Random, 95% CI) | 0.33 [‐0.48, 1.14] |
| 2.12 Mahonia aquifolium (Reliéva™), twice daily | 0 | 0 | Std. Mean Difference (IV, Random, 95% CI) | 0.0 [0.0, 0.0] |
| 2.13 Methotrexate gel | 1 | 82 | Std. Mean Difference (IV, Random, 95% CI) | ‐0.48 [‐0.92, ‐0.04] |
| 2.14 Mycophenolic acid ointment | 1 | 14 | Std. Mean Difference (IV, Random, 95% CI) | ‐1.44 [‐2.67, ‐0.22] |
| 2.15 NG‐monomethyl‐L‐arginine (L‐NMMA) cream | 1 | 34 | Std. Mean Difference (IV, Random, 95% CI) | 0.08 [‐0.60, 0.75] |
| 2.16 Nicotinamide 1.4%, twice daily | 1 | 96 | Std. Mean Difference (IV, Random, 95% CI) | ‐0.20 [‐0.60, 0.20] |
| 2.17 Oleum horwathiensis (Psoricur®) | 1 | 42 | Std. Mean Difference (IV, Random, 95% CI) | ‐0.77 [‐1.40, ‐0.14] |
| 2.18 Omega‐3‐polyunsaturated fatty acids ointment | 0 | 0 | Std. Mean Difference (IV, Random, 95% CI) | 0.0 [0.0, 0.0] |
| 2.19 Platelet aggregation activating factor (PAF)(Ro 24‐0238) | 0 | 0 | Std. Mean Difference (IV, Random, 95% CI) | 0.0 [0.0, 0.0] |
| 2.20 Polymyxin B cream 200,000 U/g | 1 | 30 | Std. Mean Difference (IV, Random, 95% CI) | 0.13 [‐0.59, 0.85] |
| 2.21 PTH (1‐34) in Novasome A® liposomal cream, twice daily | 1 | 30 | Std. Mean Difference (IV, Random, 95% CI) | ‐2.31 [‐3.26, ‐1.36] |
| 2.22 Sirolimus (topical), 2.2% for 6 wks, then 8% for a further 6 wks | 1 | 44 | Std. Mean Difference (IV, Random, 95% CI) | ‐0.39 [‐0.98, 0.21] |
| 2.23 Tacrolimus ointment | 1 | 47 | Std. Mean Difference (IV, Random, 95% CI) | 0.06 [‐0.52, 0.63] |
| 2.24 Tar | 1 | 36 | Std. Mean Difference (IV, Random, 95% CI) | ‐0.45 [‐1.11, 0.22] |
| 2.25 Tazarotene | 1 | 318 | Std. Mean Difference (IV, Random, 95% CI) | ‐0.86 [‐1.11, ‐0.62] |
| 2.26 Theophylline 1% ointment, twice daily | 0 | 0 | Std. Mean Difference (IV, Random, 95% CI) | 0.0 [0.0, 0.0] |
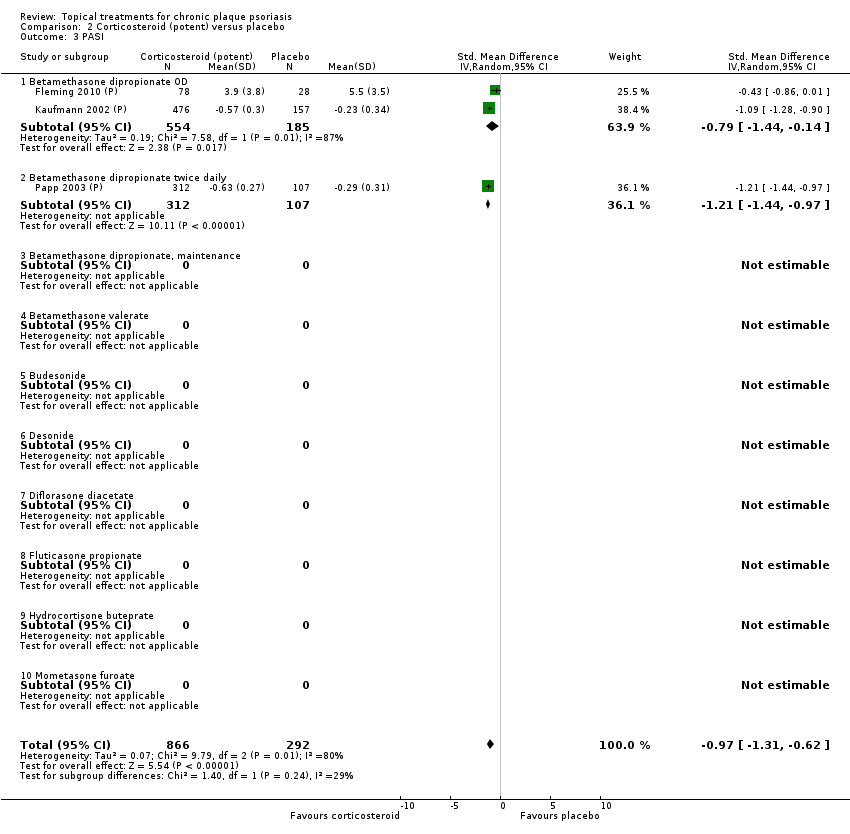
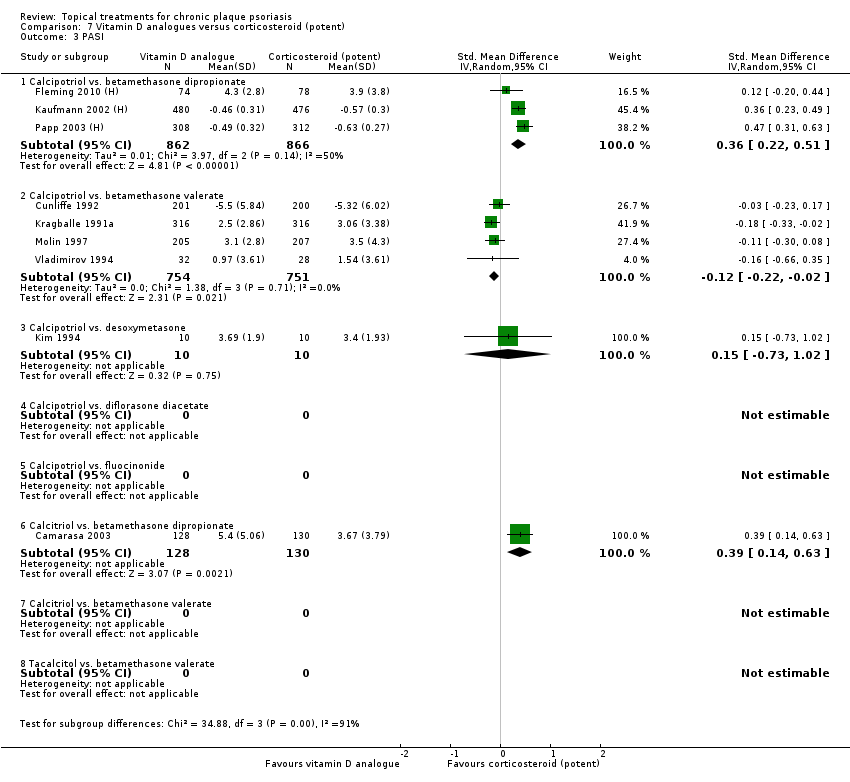
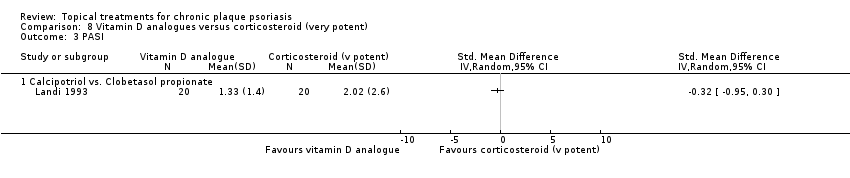
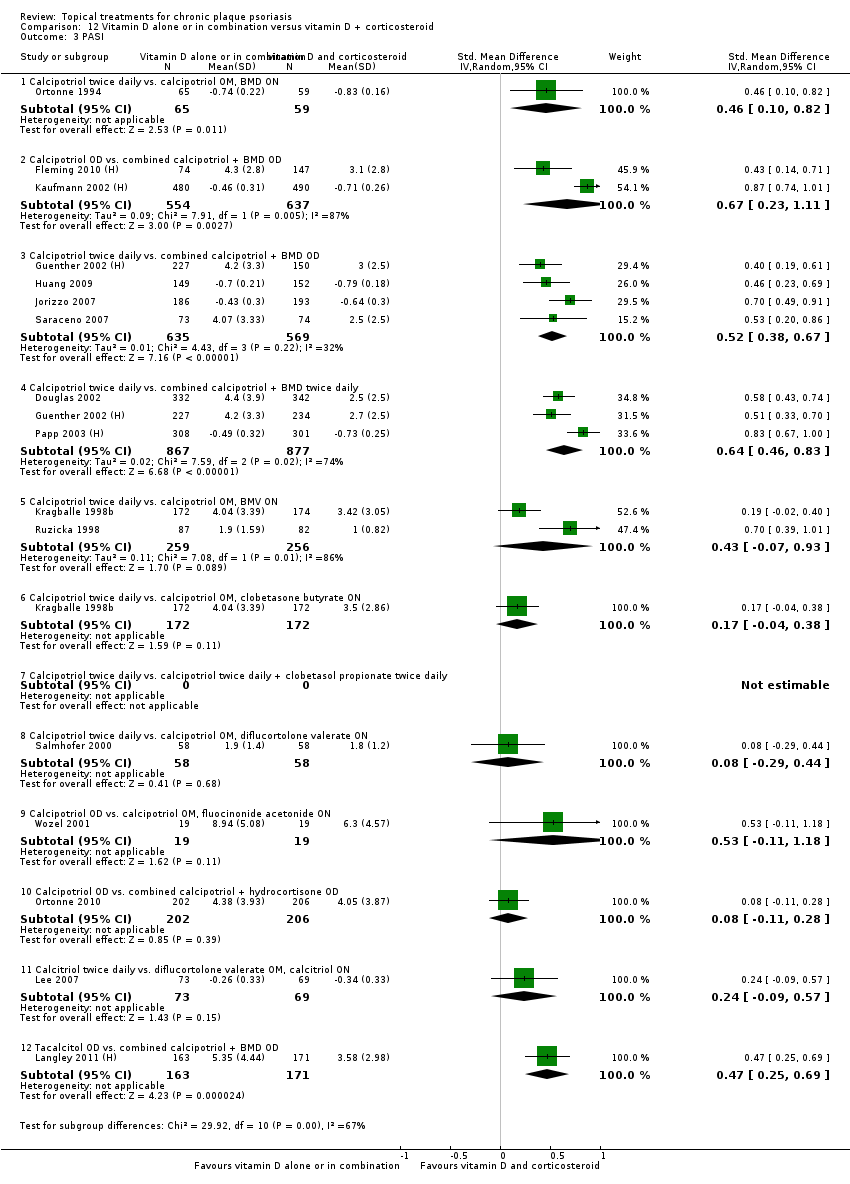
| 3 PASI Show forest plot | 9 | | Std. Mean Difference (IV, Random, 95% CI) | Totals not selected |
|
| 3.1 Aloe vera extract 0.5% hydrophilic cream, three times per day | 1 | | Std. Mean Difference (IV, Random, 95% CI) | 0.0 [0.0, 0.0] |
| 3.2 Anti‐IL‐8 monoclonal antibody cream | 0 | | Std. Mean Difference (IV, Random, 95% CI) | 0.0 [0.0, 0.0] |
| 3.3 Betamethasone 17‐valerate 21‐acetate plus tretinoin plus salicylic acid | 1 | | Std. Mean Difference (IV, Random, 95% CI) | 0.0 [0.0, 0.0] |
| 3.4 Caffeine (topical) 10%, TD | 1 | | Std. Mean Difference (IV, Random, 95% CI) | 0.0 [0.0, 0.0] |
| 3.5 Calcipotriene 0.005% ointment + nicotinamide 0.05% or 0.1% or 0.7% or 1.4%, twice daily | 0 | | Std. Mean Difference (IV, Random, 95% CI) | 0.0 [0.0, 0.0] |
| 3.6 Dead Sea salts emollient lotion, 30% | 1 | | Std. Mean Difference (IV, Random, 95% CI) | 0.0 [0.0, 0.0] |
| 3.7 Fish oil plus occlusion | 0 | | Std. Mean Difference (IV, Random, 95% CI) | 0.0 [0.0, 0.0] |
| 3.8 Herbal skin care (Dr Michaels® cleansing gel, ointment and skin conditioner), twice daily | 1 | | Std. Mean Difference (IV, Random, 95% CI) | 0.0 [0.0, 0.0] |
| 3.9 Hexafluoro‐1,25‐dihydroxyvitamin D3, twice daily | 0 | | Std. Mean Difference (IV, Random, 95% CI) | 0.0 [0.0, 0.0] |
| 3.10 Indigo naturalis 1.4% ointment | 0 | | Std. Mean Difference (IV, Random, 95% CI) | 0.0 [0.0, 0.0] |
| 3.11 Kukui nut oil, twice daily | 1 | | Std. Mean Difference (IV, Random, 95% CI) | 0.0 [0.0, 0.0] |
| 3.12 Mahonia aquifolium (Reliéva™), twice daily | 1 | | Std. Mean Difference (IV, Random, 95% CI) | 0.0 [0.0, 0.0] |
| 3.13 Methotrexate gel | 1 | | Std. Mean Difference (IV, Random, 95% CI) | 0.0 [0.0, 0.0] |
| 3.14 Mycophenolic acid ointment | 0 | | Std. Mean Difference (IV, Random, 95% CI) | 0.0 [0.0, 0.0] |
| 3.15 NG‐monomethyl‐L‐arginine (L‐NMMA) cream | 0 | | Std. Mean Difference (IV, Random, 95% CI) | 0.0 [0.0, 0.0] |
| 3.16 Nicotinamide 1.4%, twice daily | 0 | | Std. Mean Difference (IV, Random, 95% CI) | 0.0 [0.0, 0.0] |
| 3.17 Oleum horwathiensis (Psoricur®) | 0 | | Std. Mean Difference (IV, Random, 95% CI) | 0.0 [0.0, 0.0] |
| 3.18 Omega‐3‐polyunsaturated fatty acids ointment | 0 | | Std. Mean Difference (IV, Random, 95% CI) | 0.0 [0.0, 0.0] |
| 3.19 Platelet aggregation activating factor (PAF)(Ro 24‐0238) | 0 | | Std. Mean Difference (IV, Random, 95% CI) | 0.0 [0.0, 0.0] |
| 3.20 Polymyxin B cream 200,000 U/g | 0 | | Std. Mean Difference (IV, Random, 95% CI) | 0.0 [0.0, 0.0] |
| 3.21 PTH (1‐34) in Novasome A® liposomal cream, twice daily | 0 | | Std. Mean Difference (IV, Random, 95% CI) | 0.0 [0.0, 0.0] |
| 3.22 Sirolimus (topical), 2.2% for 6 wks, then 8% for a further 6 wks | 0 | | Std. Mean Difference (IV, Random, 95% CI) | 0.0 [0.0, 0.0] |
| 3.23 Tacrolimus ointment | 0 | | Std. Mean Difference (IV, Random, 95% CI) | 0.0 [0.0, 0.0] |
| 3.24 Tar | 0 | | Std. Mean Difference (IV, Random, 95% CI) | 0.0 [0.0, 0.0] |
| 3.25 Tazarotene | 0 | | Std. Mean Difference (IV, Random, 95% CI) | 0.0 [0.0, 0.0] |
| 3.26 Theophylline 1% ointment, twice daily | 1 | | Std. Mean Difference (IV, Random, 95% CI) | 0.0 [0.0, 0.0] |
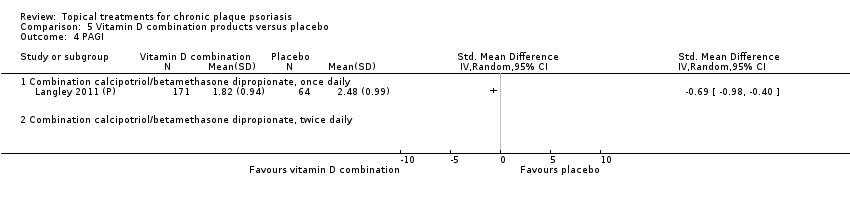
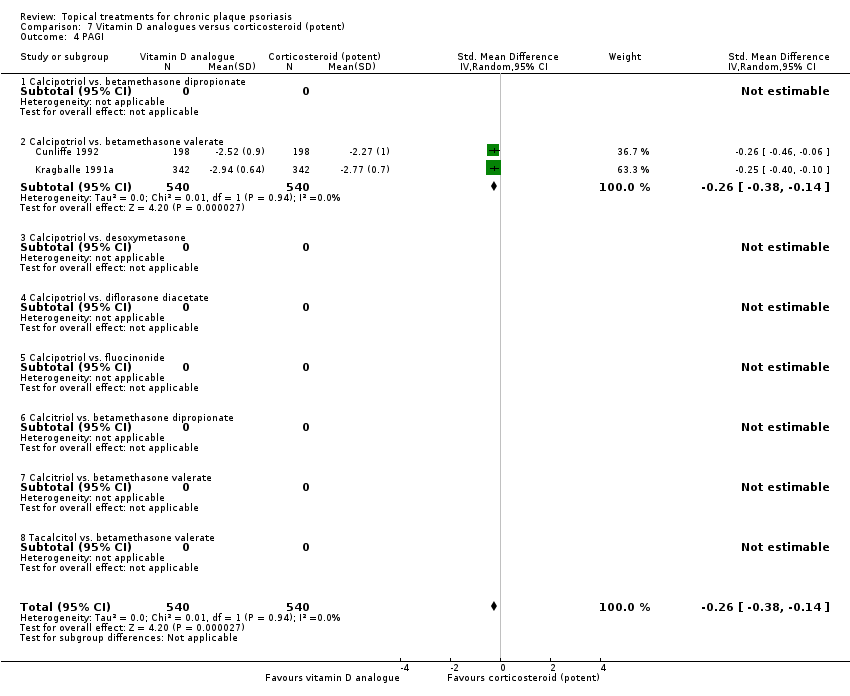
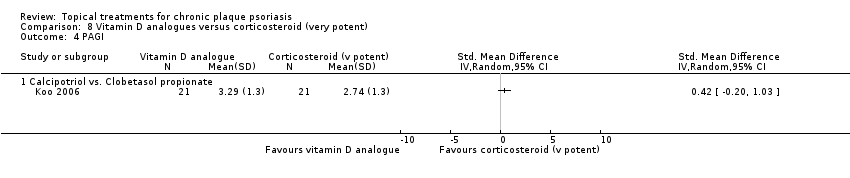
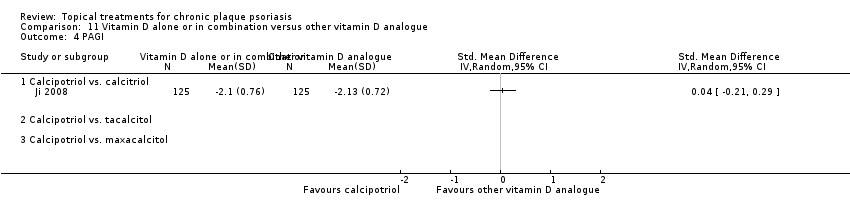
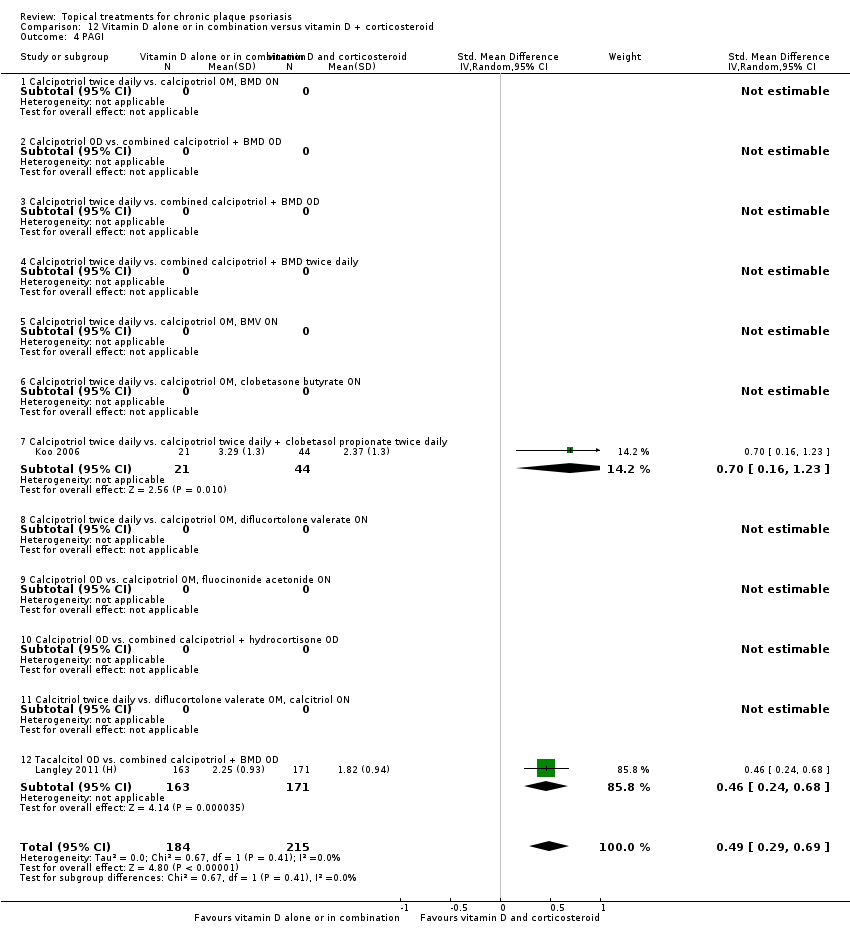
| 4 PAGI Show forest plot | 2 | | Std. Mean Difference (IV, Random, 95% CI) | Totals not selected |
|
| 4.1 Aloe vera extract 0.5% hydrophilic cream, three times per day | 0 | | Std. Mean Difference (IV, Random, 95% CI) | 0.0 [0.0, 0.0] |
| 4.2 Anti‐IL‐8 monoclonal antibody cream | 0 | | Std. Mean Difference (IV, Random, 95% CI) | 0.0 [0.0, 0.0] |
| 4.3 Betamethasone 17‐valerate 21‐acetate plus tretinoin plus salicylic acid | 1 | | Std. Mean Difference (IV, Random, 95% CI) | 0.0 [0.0, 0.0] |
| 4.4 Caffeine (topical) 10%, TD | 0 | | Std. Mean Difference (IV, Random, 95% CI) | 0.0 [0.0, 0.0] |
| 4.5 Calcipotriene 0.005% ointment + nicotinamide 0.05% or 0.1% or 0.7% or 1.4%, twice daily | 0 | | Std. Mean Difference (IV, Random, 95% CI) | 0.0 [0.0, 0.0] |
| 4.6 Dead Sea salts emollient lotion, 30% | 0 | | Std. Mean Difference (IV, Random, 95% CI) | 0.0 [0.0, 0.0] |
| 4.7 Fish oil plus occlusion | 0 | | Std. Mean Difference (IV, Random, 95% CI) | 0.0 [0.0, 0.0] |
| 4.8 Herbal skin care (Dr Michaels® cleansing gel, ointment and skin conditioner), twice daily | 0 | | Std. Mean Difference (IV, Random, 95% CI) | 0.0 [0.0, 0.0] |
| 4.9 Hexafluoro‐1,25‐dihydroxyvitamin D3, twice daily | 0 | | Std. Mean Difference (IV, Random, 95% CI) | 0.0 [0.0, 0.0] |
| 4.10 Indigo naturalis 1.4% ointment | 0 | | Std. Mean Difference (IV, Random, 95% CI) | 0.0 [0.0, 0.0] |
| 4.11 Kukui nut oil, TD | 1 | | Std. Mean Difference (IV, Random, 95% CI) | 0.0 [0.0, 0.0] |
| 4.12 Mahonia aquifolium (Reliéva™), twice daily | 0 | | Std. Mean Difference (IV, Random, 95% CI) | 0.0 [0.0, 0.0] |
| 4.13 Methotrexate gel | 0 | | Std. Mean Difference (IV, Random, 95% CI) | 0.0 [0.0, 0.0] |
| 4.14 Mycophenolic acid ointment | 0 | | Std. Mean Difference (IV, Random, 95% CI) | 0.0 [0.0, 0.0] |
| 4.15 NG‐monomethyl‐L‐arginine (L‐NMMA) cream | 0 | | Std. Mean Difference (IV, Random, 95% CI) | 0.0 [0.0, 0.0] |
| 4.16 Nicotinamide 1.4%, twice daily | 0 | | Std. Mean Difference (IV, Random, 95% CI) | 0.0 [0.0, 0.0] |
| 4.17 Oleum horwathiensis (Psoricur®) | 0 | | Std. Mean Difference (IV, Random, 95% CI) | 0.0 [0.0, 0.0] |
| 4.18 Omega‐3‐polyunsaturated fatty acids ointment | 0 | | Std. Mean Difference (IV, Random, 95% CI) | 0.0 [0.0, 0.0] |
| 4.19 Platelet aggregation activating factor (PAF)(Ro 24‐0238) | 0 | | Std. Mean Difference (IV, Random, 95% CI) | 0.0 [0.0, 0.0] |
| 4.20 Polymyxin B cream 200,000 U/g | 0 | | Std. Mean Difference (IV, Random, 95% CI) | 0.0 [0.0, 0.0] |
| 4.21 PTH (1‐34) in Novasome A® liposomal cream, twice daily | 0 | | Std. Mean Difference (IV, Random, 95% CI) | 0.0 [0.0, 0.0] |
| 4.22 Sirolimus (topical), 2.2% for 6 wks, then 8% for a further 6 wks | 0 | | Std. Mean Difference (IV, Random, 95% CI) | 0.0 [0.0, 0.0] |
| 4.23 Tacrolimus ointment | 0 | | Std. Mean Difference (IV, Random, 95% CI) | 0.0 [0.0, 0.0] |
| 4.24 Tar | 0 | | Std. Mean Difference (IV, Random, 95% CI) | 0.0 [0.0, 0.0] |
| 4.25 Tazarotene | 0 | | Std. Mean Difference (IV, Random, 95% CI) | 0.0 [0.0, 0.0] |
| 4.26 Theophylline 1% ointment, twice daily | 0 | | Std. Mean Difference (IV, Random, 95% CI) | 0.0 [0.0, 0.0] |
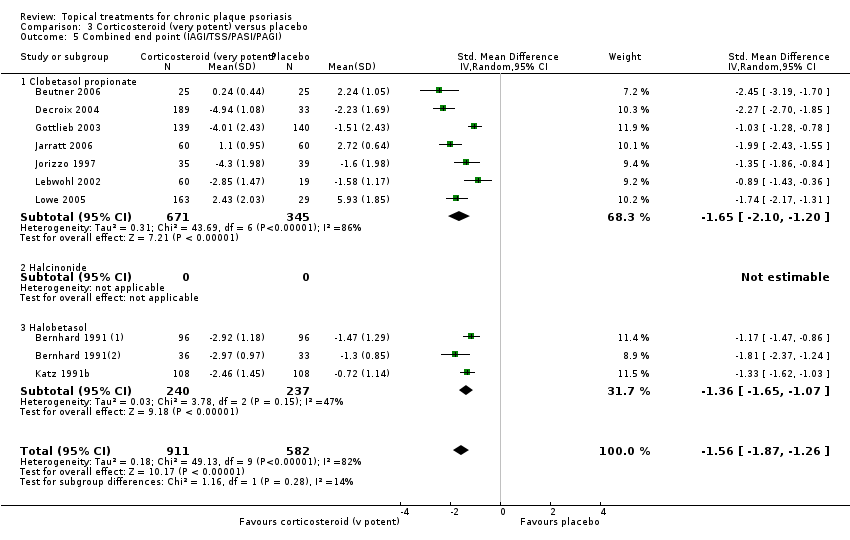
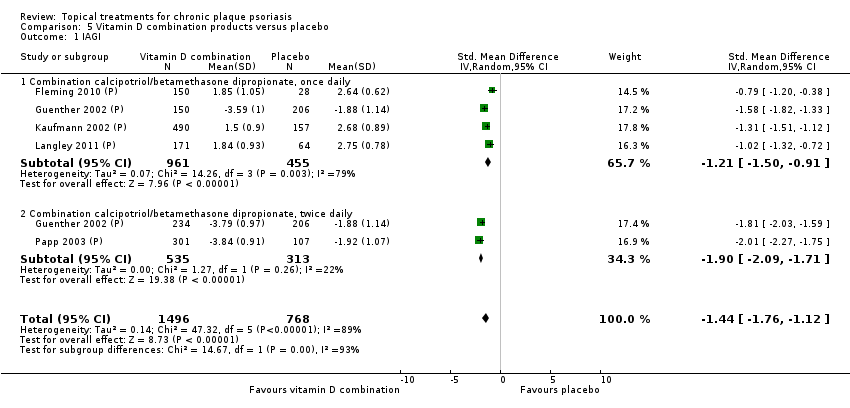
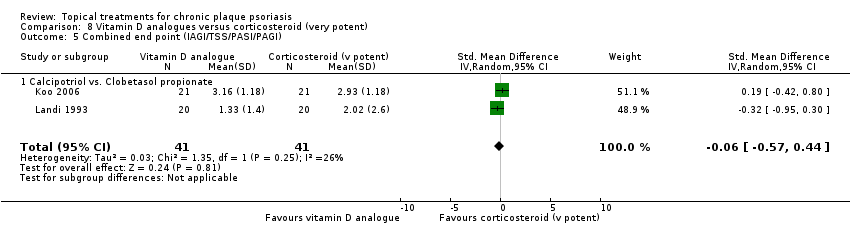
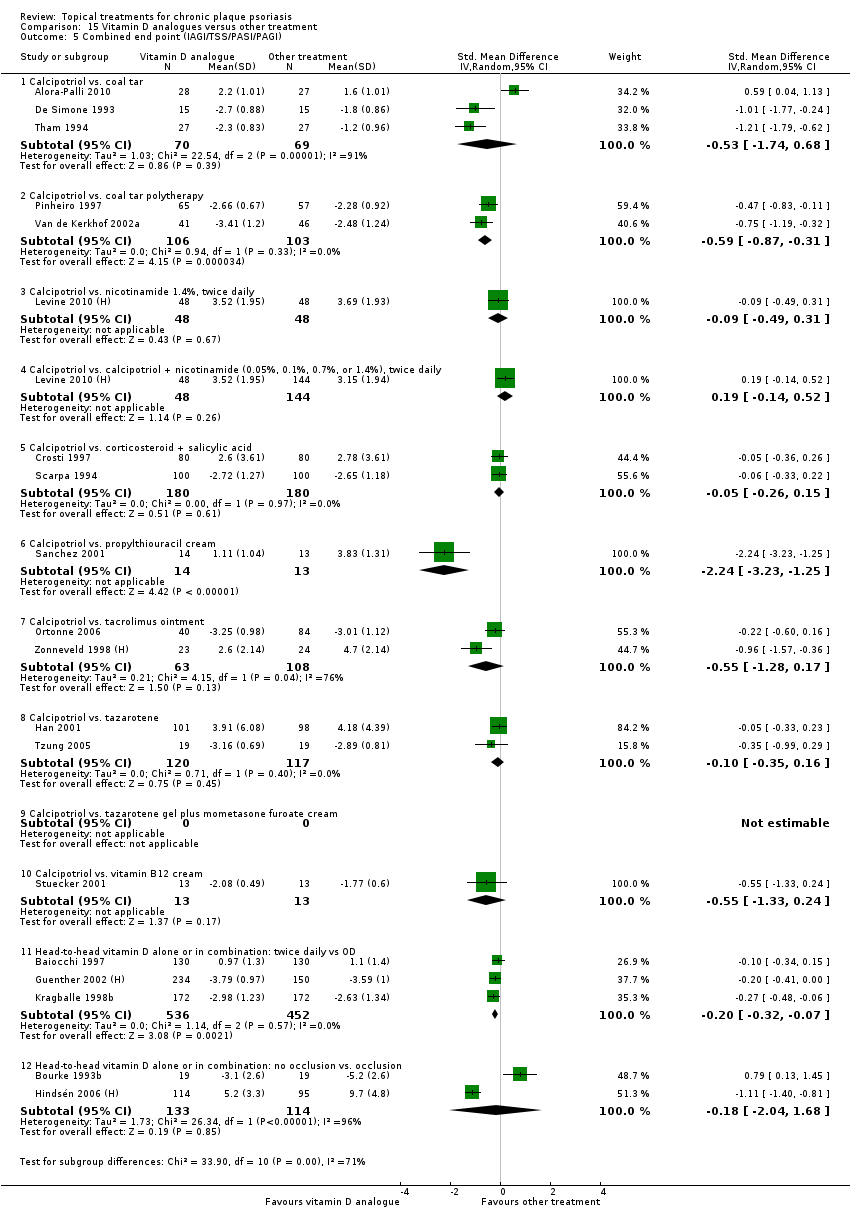
| 5 Combined end point (IAGI/TSS/PASI/PAGI) Show forest plot | 26 | | Std. Mean Difference (IV, Random, 95% CI) | Subtotals only |
|
| 5.1 Aloe vera extract 0.5% hydrophilic cream, three times per day | 1 | 60 | Std. Mean Difference (IV, Random, 95% CI) | ‐1.58 [‐2.16, ‐0.99] |
| 5.2 Anti‐IL‐8 monoclonal antibody cream | 1 | 89 | Std. Mean Difference (IV, Random, 95% CI) | ‐0.59 [‐1.01, ‐0.16] |
| 5.3 Betamethasone 17‐valerate 21‐acetate plus tretinoin plus salicylic acid | 1 | 81 | Std. Mean Difference (IV, Random, 95% CI) | ‐0.76 [‐1.21, ‐0.31] |
| 5.4 Caffeine (topical) 10%, TD | 1 | 78 | Std. Mean Difference (IV, Random, 95% CI) | ‐0.39 [‐0.84, 0.06] |
| 5.5 Calcipotriene 0.005% ointment + nicotinamide 0.05% or 0.1% or 0.7% or 1.4%, twice daily | 1 | 192 | Std. Mean Difference (IV, Random, 95% CI) | ‐0.48 [‐0.81, ‐0.15] |
| 5.6 Dead Sea salts emollient lotion, 30% | 1 | 19 | Std. Mean Difference (IV, Random, 95% CI) | 0.57 [‐0.36, 1.51] |
| 5.7 Fish oil plus occlusion | 1 | 50 | Std. Mean Difference (IV, Random, 95% CI) | ‐1.05 [‐1.64, ‐0.46] |
| 5.8 Herbal skin care (Dr Michaels® cleansing gel, ointment and skin conditioner), twice daily | 1 | 24 | Std. Mean Difference (IV, Random, 95% CI) | ‐2.96 [‐4.19, ‐1.74] |
| 5.9 Hexafluoro‐1,25‐dihydroxyvitamin D3 | 1 | 30 | Std. Mean Difference (IV, Random, 95% CI) | ‐0.62 [‐1.35, 0.12] |
| 5.10 Indigo naturalis 1.4% ointment | 2 | 88 | Std. Mean Difference (IV, Random, 95% CI) | ‐2.09 [‐2.62, ‐1.56] |
| 5.11 Kukui nut oil, TD | 1 | 24 | Std. Mean Difference (IV, Random, 95% CI) | 0.0 [‐0.80, 0.80] |
| 5.12 Mahonia aquifolium (Reliéva™), twice daily | 1 | 200 | Std. Mean Difference (IV, Random, 95% CI) | ‐0.77 [‐1.06, ‐0.48] |
| 5.13 Methotrexate gel | 2 | 142 | Std. Mean Difference (IV, Random, 95% CI) | ‐1.05 [‐2.04, ‐0.06] |
| 5.14 Mycophenolic acid ointment | 1 | 14 | Std. Mean Difference (IV, Random, 95% CI) | ‐1.44 [‐2.67, ‐0.22] |
| 5.15 NG‐monomethyl‐L‐arginine (L‐NMMA) cream | 1 | 34 | Std. Mean Difference (IV, Random, 95% CI) | 0.08 [‐0.60, 0.75] |
| 5.16 Nicotinamide 1.4%, twice daily | 1 | 96 | Std. Mean Difference (IV, Random, 95% CI) | ‐0.20 [‐0.60, 0.20] |
| 5.17 Oleum horwathiensis (Psoricur®) | 1 | 42 | Std. Mean Difference (IV, Random, 95% CI) | ‐0.02 [‐0.63, 0.58] |
| 5.18 Omega‐3‐polyunsaturated fatty acids ointment | 0 | 0 | Std. Mean Difference (IV, Random, 95% CI) | 0.0 [0.0, 0.0] |
| 5.19 Platelet aggregation activating factor (PAF)(Ro 24‐0238) | 1 | 80 | Std. Mean Difference (IV, Random, 95% CI) | ‐0.07 [‐0.50, 0.37] |
| 5.20 Polymyxin B cream 200,000 U/g | 1 | 30 | Std. Mean Difference (IV, Random, 95% CI) | 0.13 [‐0.59, 0.85] |
| 5.21 PTH (1‐34) in Novasome A® liposomal cream, twice daily | 1 | 30 | Std. Mean Difference (IV, Random, 95% CI) | ‐2.31 [‐3.26, ‐1.36] |
| 5.22 Sirolimus (topical), 2.2% for 6 wks, then 8% for a further 6 wks | 1 | 44 | Std. Mean Difference (IV, Random, 95% CI) | ‐0.39 [‐0.98, 0.21] |
| 5.23 Tacrolimus ointment | 1 | 47 | Std. Mean Difference (IV, Random, 95% CI) | 0.06 [‐0.52, 0.63] |
| 5.24 Tar | 1 | 36 | Std. Mean Difference (IV, Random, 95% CI) | ‐0.45 [‐1.11, 0.22] |
| 5.25 Tazarotene | 1 | 318 | Std. Mean Difference (IV, Random, 95% CI) | ‐0.86 [‐1.11, ‐0.62] |
| 5.26 Theophylline 1% ointment, twice daily | 1 | 22 | Std. Mean Difference (IV, Random, 95% CI) | ‐2.87 [‐4.13, ‐1.62] |
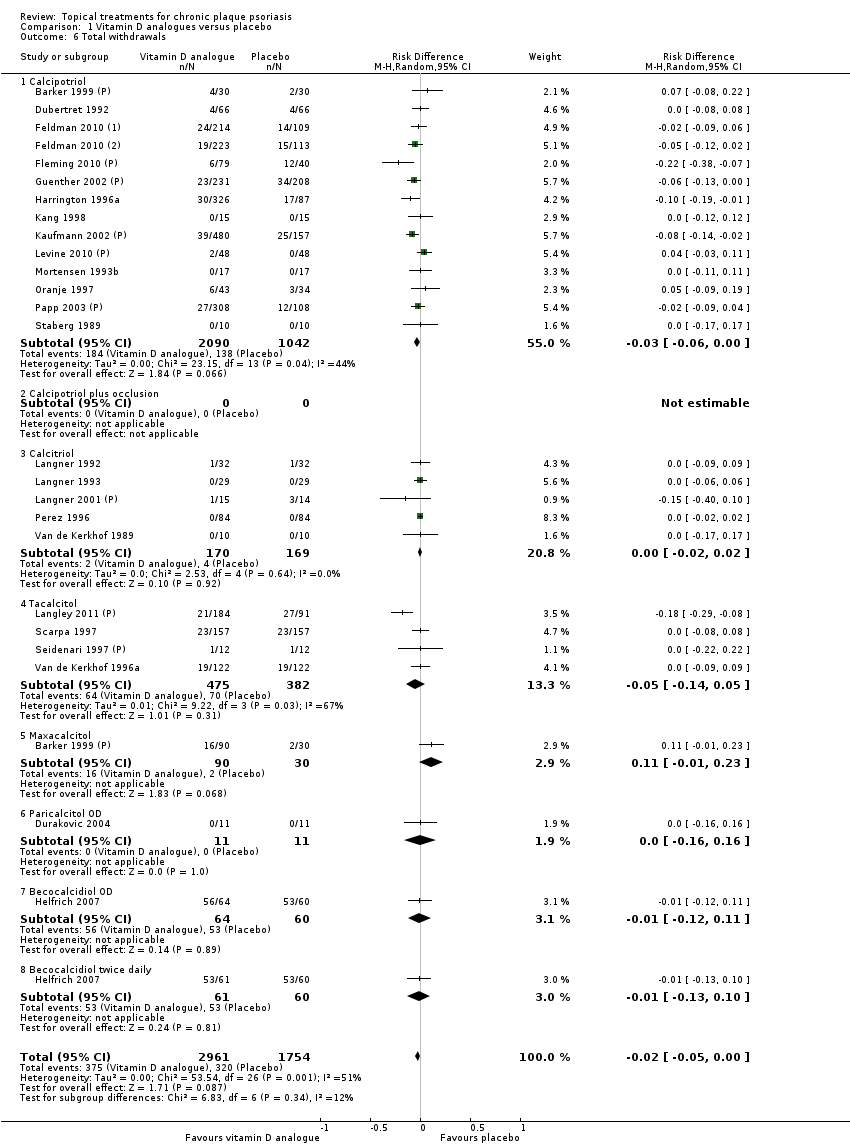
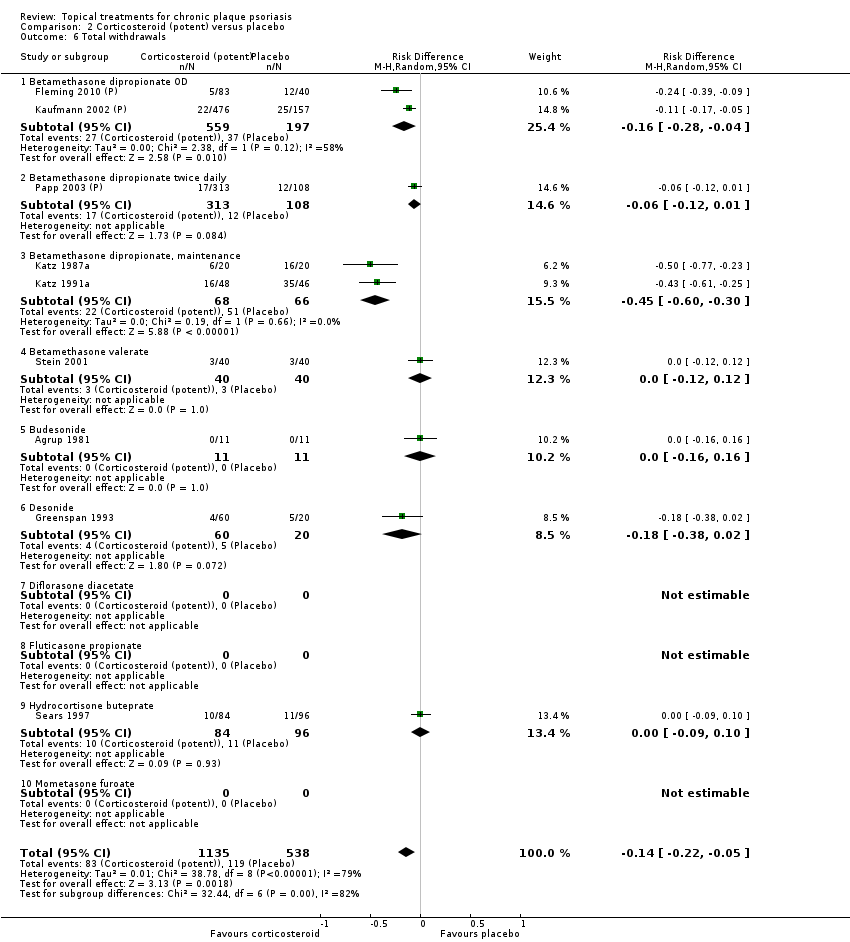
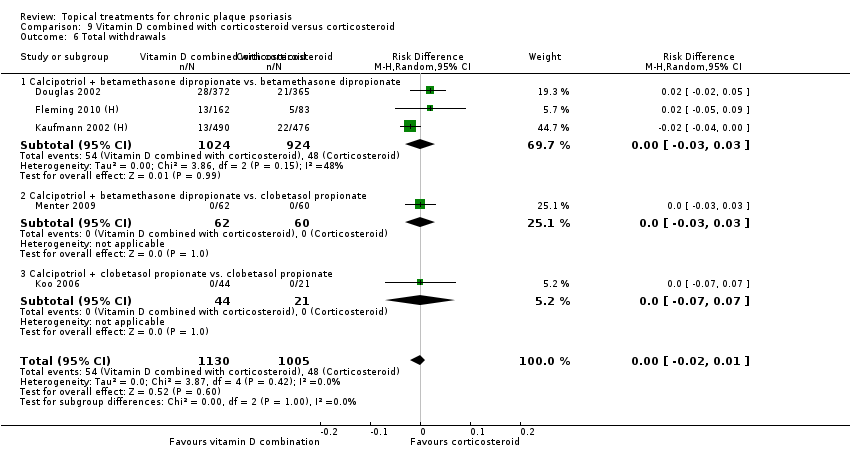
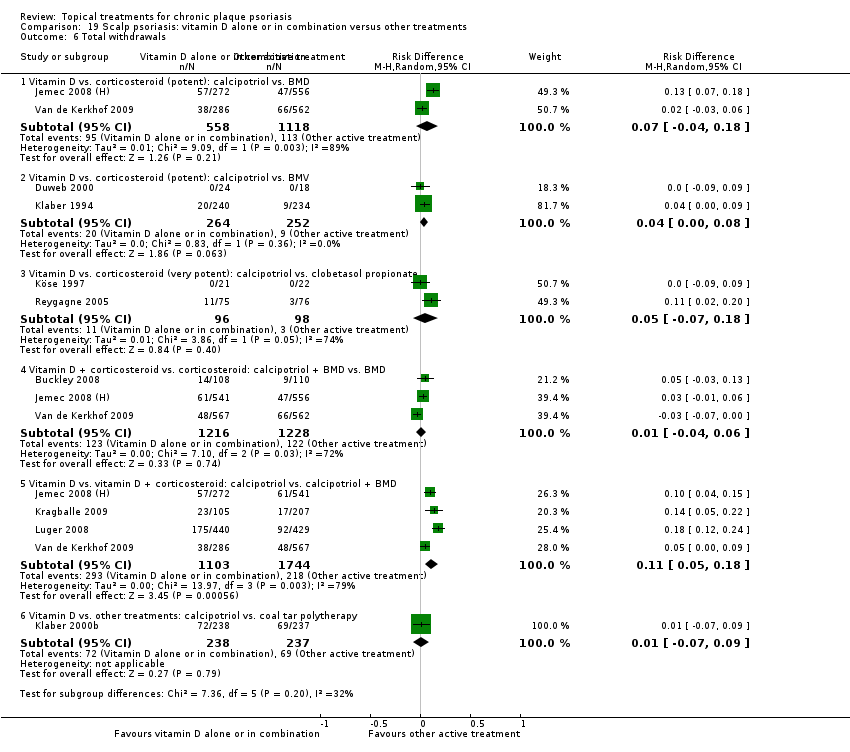
| 6 Total withdrawals Show forest plot | 23 | | Risk Difference (M‐H, Random, 95% CI) | Subtotals only |
|
| 6.1 Aloe vera extract 0.5% hydrophilic cream, three times per day | 1 | 60 | Risk Difference (M‐H, Random, 95% CI) | 0.0 [‐0.06, 0.06] |
| 6.2 Anti‐IL‐8 monoclonal antibody cream | 1 | 96 | Risk Difference (M‐H, Random, 95% CI) | ‐0.02 [‐0.12, 0.08] |
| 6.3 Betamethasone 17‐valerate 21‐acetate plus tretinoin plus salicylic acid | 1 | 85 | Risk Difference (M‐H, Random, 95% CI) | ‐0.00 [‐0.09, 0.09] |
| 6.4 Caffeine (topical) 10%, TD | 1 | 78 | Risk Difference (M‐H, Random, 95% CI) | 0.0 [‐0.12, 0.12] |
| 6.5 Calcipotriene 0.005% ointment + nicotinamide 0.05% or 0.1% or 0.7% or 1.4%, twice daily | 1 | 192 | Risk Difference (M‐H, Random, 95% CI) | 0.03 [‐0.01, 0.08] |
| 6.6 Dead Sea salts emollient lotion | 1 | 24 | Risk Difference (M‐H, Random, 95% CI) | 0.25 [‐0.06, 0.56] |
| 6.7 Fish oil plus occlusion | 1 | 50 | Risk Difference (M‐H, Random, 95% CI) | 0.0 [‐0.07, 0.07] |
| 6.8 Herbal skin care (Dr Michaels® cleansing gel, ointment and skin conditioner), twice daily | 0 | 0 | Risk Difference (M‐H, Random, 95% CI) | 0.0 [0.0, 0.0] |
| 6.9 Hexafluoro‐1,25‐dihydroxyvitamin D3 | 1 | 30 | Risk Difference (M‐H, Random, 95% CI) | 0.0 [‐0.12, 0.12] |
| 6.10 Indigo naturalis 1.4% ointment | 2 | 112 | Risk Difference (M‐H, Random, 95% CI) | 0.0 [‐0.15, 0.15] |
| 6.11 Kukui nut oil, TD | 1 | 30 | Risk Difference (M‐H, Random, 95% CI) | ‐0.13 [‐0.42, 0.15] |
| 6.12 Mahonia aquifolium (Reliéva™), twice daily | 1 | 200 | Risk Difference (M‐H, Random, 95% CI) | ‐0.23 [‐0.32, ‐0.14] |
| 6.13 Methotrexate gel | 1 | 60 | Risk Difference (M‐H, Random, 95% CI) | 0.0 [‐0.06, 0.06] |
| 6.14 Mycophenolic acid ointment | 1 | 14 | Risk Difference (M‐H, Random, 95% CI) | 0.0 [‐0.24, 0.24] |
| 6.15 NG‐monomethyl‐L‐arginine (L‐NMMA) cream | 1 | 34 | Risk Difference (M‐H, Random, 95% CI) | 0.0 [‐0.11, 0.11] |
| 6.16 Nicotinamide 1.4%, twice daily | 1 | 96 | Risk Difference (M‐H, Random, 95% CI) | 0.02 [‐0.04, 0.08] |
| 6.17 Oleum horwathiensis | 1 | 50 | Risk Difference (M‐H, Random, 95% CI) | 0.16 [‐0.04, 0.36] |
| 6.18 Omega‐3‐polyunsaturated fatty acids ointment | 1 | 146 | Risk Difference (M‐H, Random, 95% CI) | 0.0 [‐0.15, 0.15] |
| 6.19 Platelet aggregation activating factor (PAF)(Ro 24‐0238) | 1 | 104 | Risk Difference (M‐H, Random, 95% CI) | 0.0 [‐0.16, 0.16] |
| 6.20 Polymyxin B cream 200,000 U/g | 1 | 30 | Risk Difference (M‐H, Random, 95% CI) | 0.0 [‐0.24, 0.24] |
| 6.21 PTH (1‐34) in Novasome A® liposomal cream, twice daily | 1 | 30 | Risk Difference (M‐H, Random, 95% CI) | 0.0 [‐0.12, 0.12] |
| 6.22 Sirolimus (topical) | 0 | 0 | Risk Difference (M‐H, Random, 95% CI) | 0.0 [0.0, 0.0] |
| 6.23 Tacrolimus ointment | 0 | 0 | Risk Difference (M‐H, Random, 95% CI) | 0.0 [0.0, 0.0] |
| 6.24 Tar | 0 | 0 | Risk Difference (M‐H, Random, 95% CI) | 0.0 [0.0, 0.0] |
| 6.25 Tazarotene | 2 | 1627 | Risk Difference (M‐H, Random, 95% CI) | 0.04 [‐0.01, 0.09] |
| 6.26 Theophylline 1% ointment, twice daily | 1 | 22 | Risk Difference (M‐H, Random, 95% CI) | 0.0 [‐0.16, 0.16] |
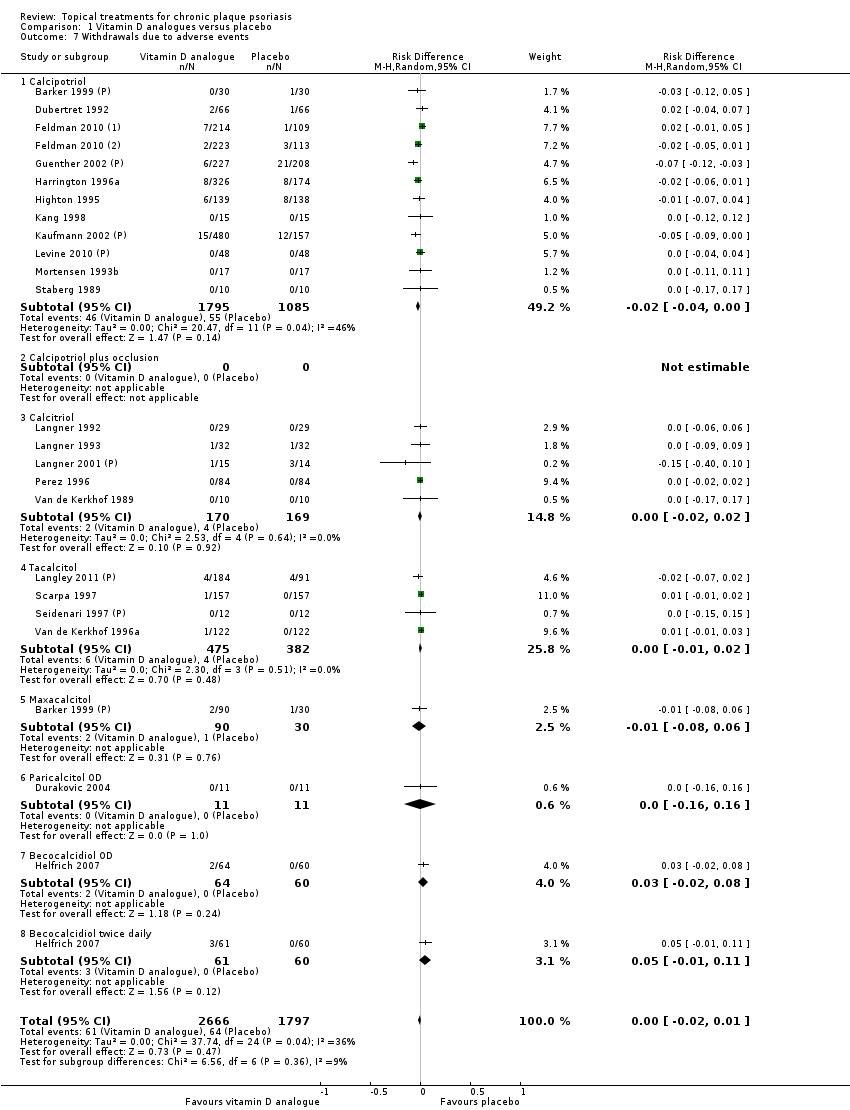
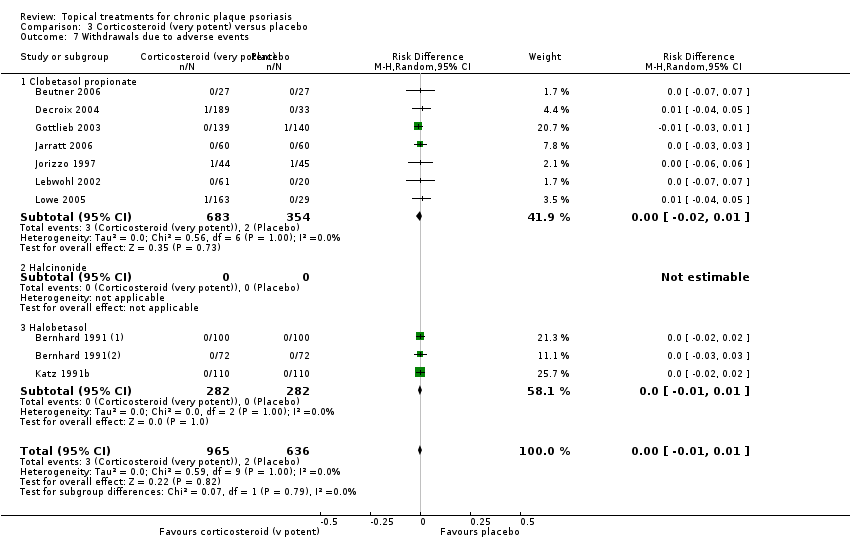
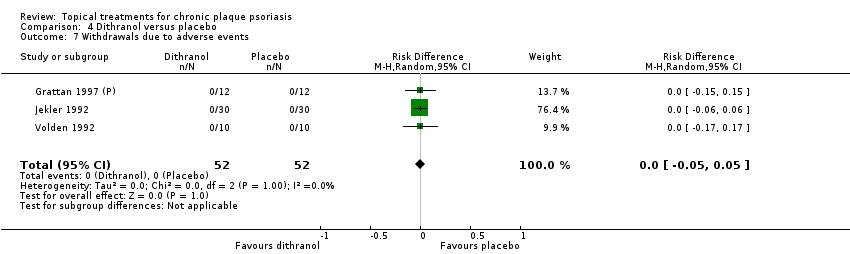
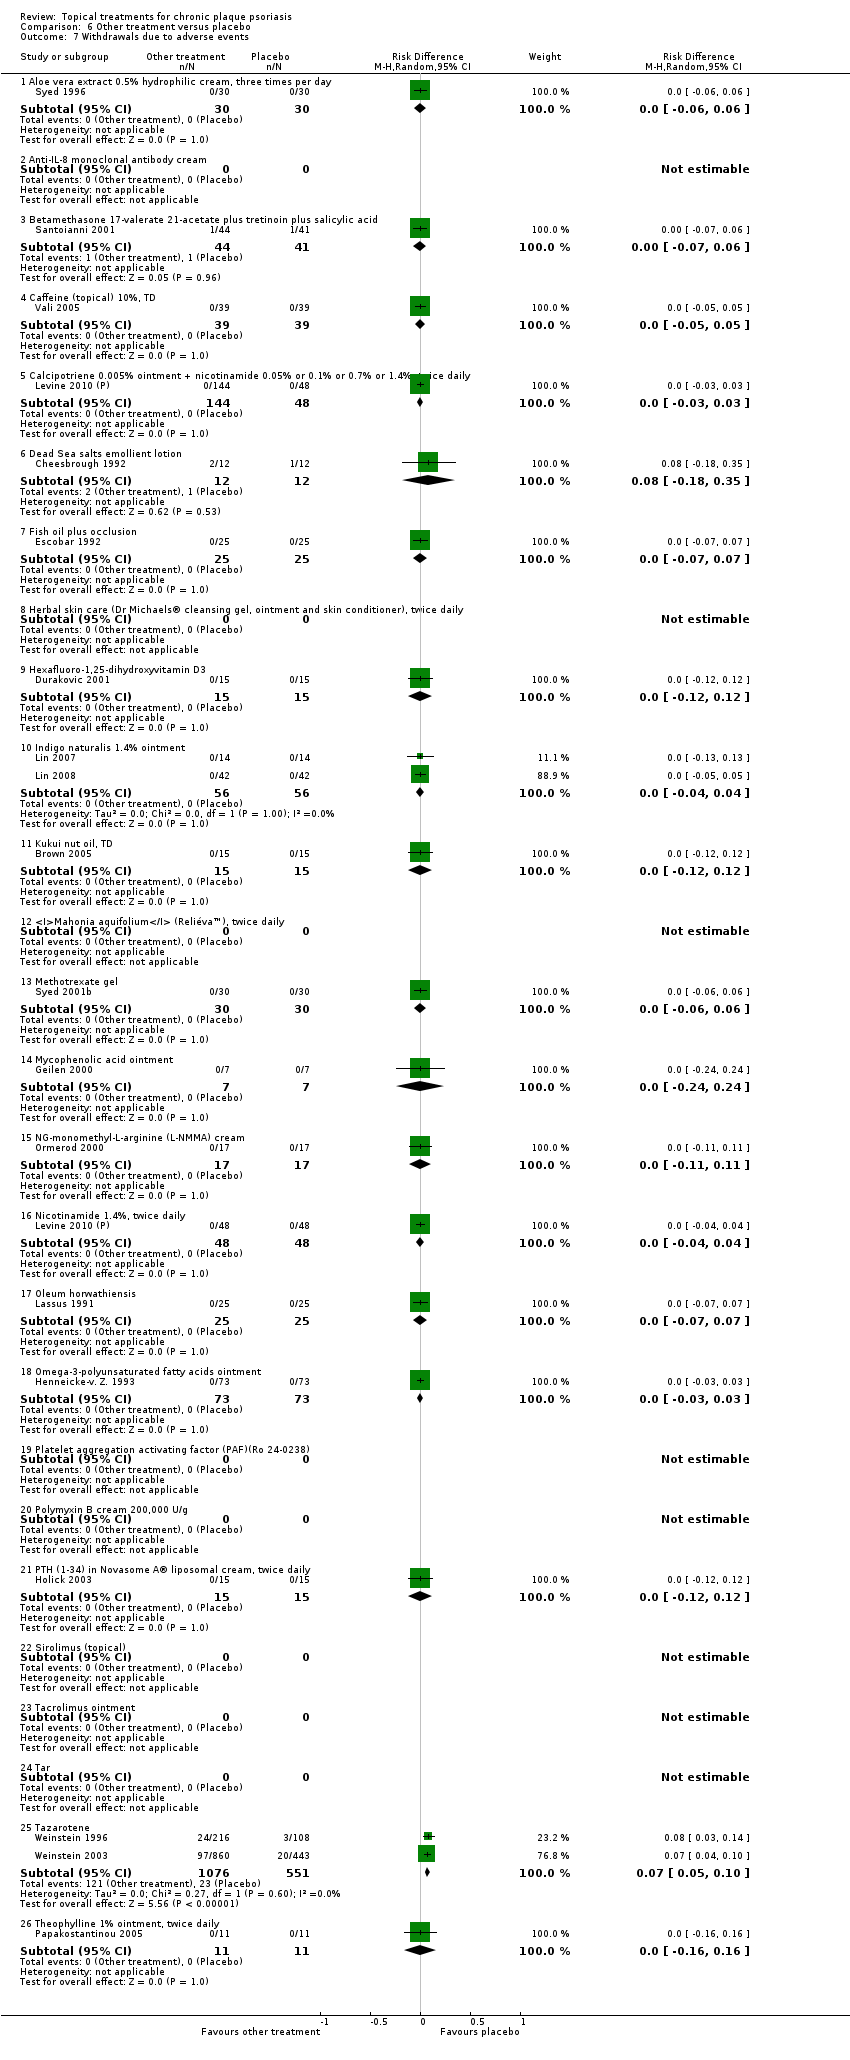
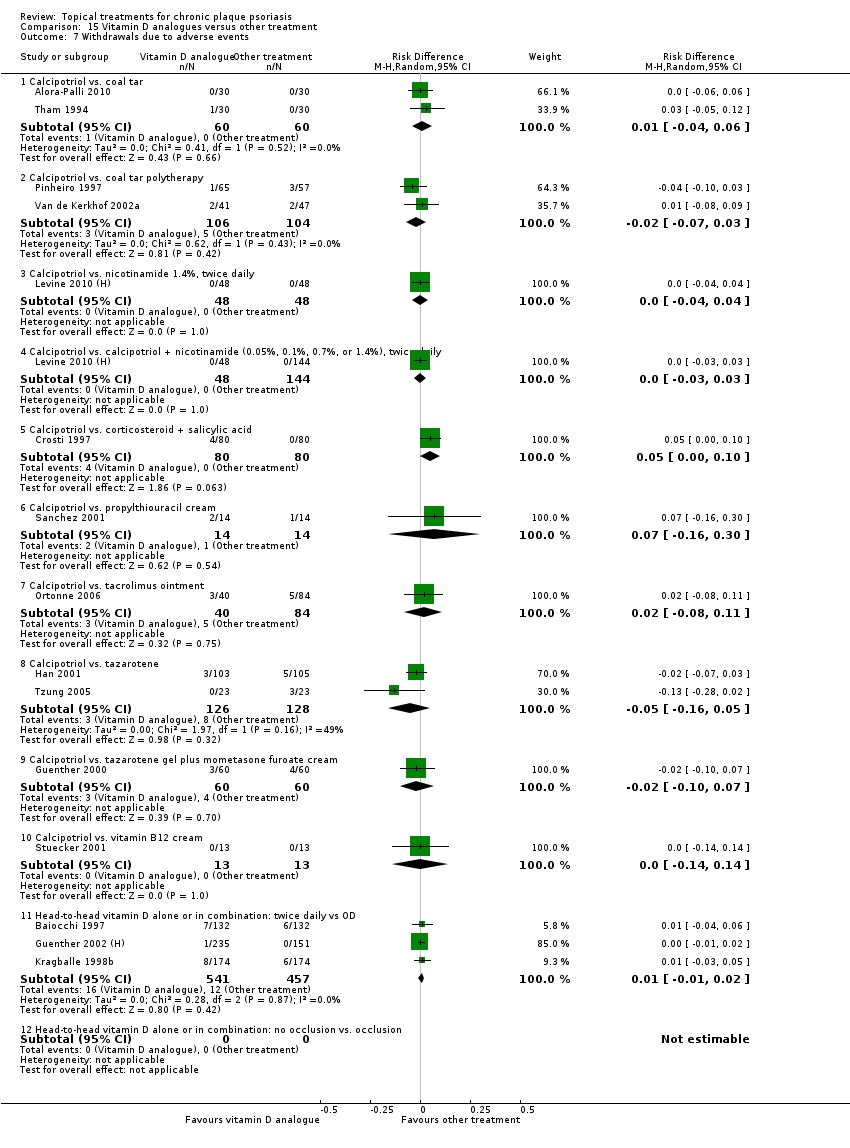
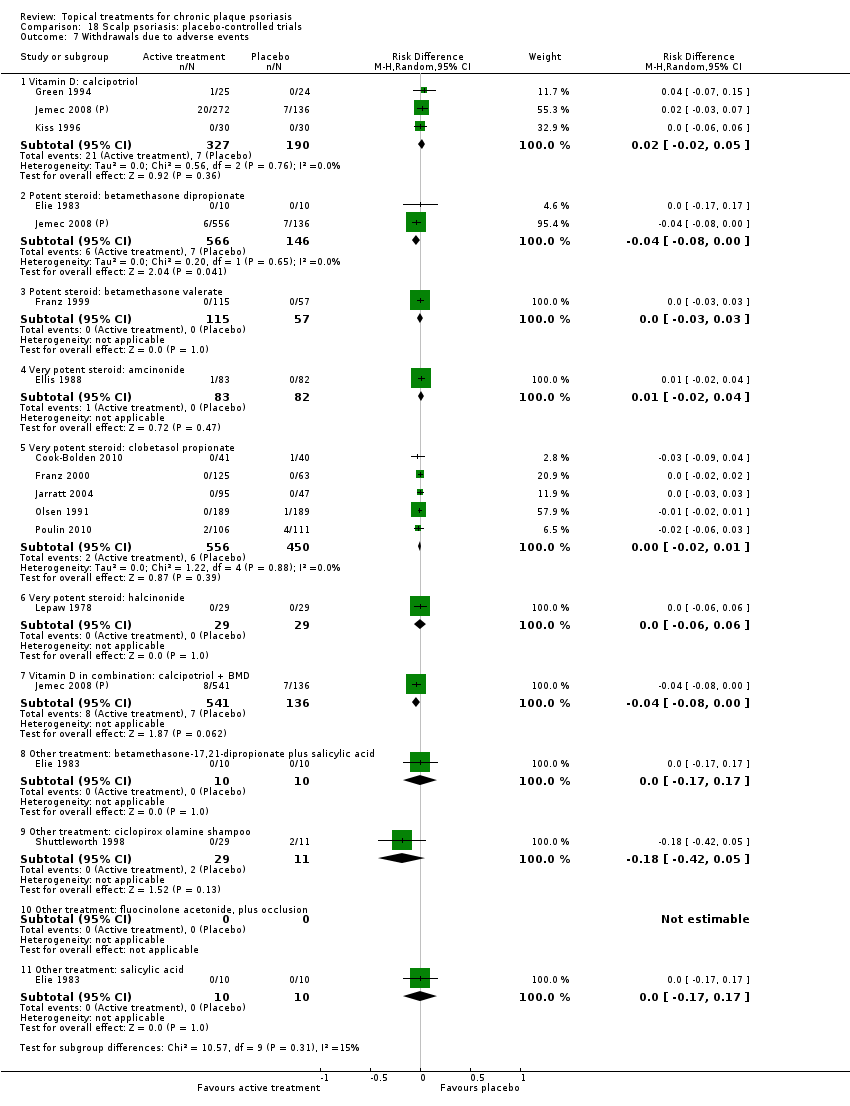
| 7 Withdrawals due to adverse events Show forest plot | 19 | | Risk Difference (M‐H, Random, 95% CI) | Subtotals only |
|
| 7.1 Aloe vera extract 0.5% hydrophilic cream, three times per day | 1 | 60 | Risk Difference (M‐H, Random, 95% CI) | 0.0 [‐0.06, 0.06] |
| 7.2 Anti‐IL‐8 monoclonal antibody cream | 0 | 0 | Risk Difference (M‐H, Random, 95% CI) | 0.0 [0.0, 0.0] |
| 7.3 Betamethasone 17‐valerate 21‐acetate plus tretinoin plus salicylic acid | 1 | 85 | Risk Difference (M‐H, Random, 95% CI) | ‐0.00 [‐0.07, 0.06] |
| 7.4 Caffeine (topical) 10%, TD | 1 | 78 | Risk Difference (M‐H, Random, 95% CI) | 0.0 [‐0.05, 0.05] |
| 7.5 Calcipotriene 0.005% ointment + nicotinamide 0.05% or 0.1% or 0.7% or 1.4%, twice daily | 1 | 192 | Risk Difference (M‐H, Random, 95% CI) | 0.0 [‐0.03, 0.03] |
| 7.6 Dead Sea salts emollient lotion | 1 | 24 | Risk Difference (M‐H, Random, 95% CI) | 0.08 [‐0.18, 0.35] |
| 7.7 Fish oil plus occlusion | 1 | 50 | Risk Difference (M‐H, Random, 95% CI) | 0.0 [‐0.07, 0.07] |
| 7.8 Herbal skin care (Dr Michaels® cleansing gel, ointment and skin conditioner), twice daily | 0 | 0 | Risk Difference (M‐H, Random, 95% CI) | 0.0 [0.0, 0.0] |
| 7.9 Hexafluoro‐1,25‐dihydroxyvitamin D3 | 1 | 30 | Risk Difference (M‐H, Random, 95% CI) | 0.0 [‐0.12, 0.12] |
| 7.10 Indigo naturalis 1.4% ointment | 2 | 112 | Risk Difference (M‐H, Random, 95% CI) | 0.0 [‐0.04, 0.04] |
| 7.11 Kukui nut oil, TD | 1 | 30 | Risk Difference (M‐H, Random, 95% CI) | 0.0 [‐0.12, 0.12] |
| 7.12 Mahonia aquifolium (Reliéva™), twice daily | 0 | 0 | Risk Difference (M‐H, Random, 95% CI) | 0.0 [0.0, 0.0] |
| 7.13 Methotrexate gel | 1 | 60 | Risk Difference (M‐H, Random, 95% CI) | 0.0 [‐0.06, 0.06] |
| 7.14 Mycophenolic acid ointment | 1 | 14 | Risk Difference (M‐H, Random, 95% CI) | 0.0 [‐0.24, 0.24] |
| 7.15 NG‐monomethyl‐L‐arginine (L‐NMMA) cream | 1 | 34 | Risk Difference (M‐H, Random, 95% CI) | 0.0 [‐0.11, 0.11] |
| 7.16 Nicotinamide 1.4%, twice daily | 1 | 96 | Risk Difference (M‐H, Random, 95% CI) | 0.0 [‐0.04, 0.04] |
| 7.17 Oleum horwathiensis | 1 | 50 | Risk Difference (M‐H, Random, 95% CI) | 0.0 [‐0.07, 0.07] |
| 7.18 Omega‐3‐polyunsaturated fatty acids ointment | 1 | 146 | Risk Difference (M‐H, Random, 95% CI) | 0.0 [‐0.03, 0.03] |
| 7.19 Platelet aggregation activating factor (PAF)(Ro 24‐0238) | 0 | 0 | Risk Difference (M‐H, Random, 95% CI) | 0.0 [0.0, 0.0] |
| 7.20 Polymyxin B cream 200,000 U/g | 0 | 0 | Risk Difference (M‐H, Random, 95% CI) | 0.0 [0.0, 0.0] |
| 7.21 PTH (1‐34) in Novasome A® liposomal cream, twice daily | 1 | 30 | Risk Difference (M‐H, Random, 95% CI) | 0.0 [‐0.12, 0.12] |
| 7.22 Sirolimus (topical) | 0 | 0 | Risk Difference (M‐H, Random, 95% CI) | 0.0 [0.0, 0.0] |
| 7.23 Tacrolimus ointment | 0 | 0 | Risk Difference (M‐H, Random, 95% CI) | 0.0 [0.0, 0.0] |
| 7.24 Tar | 0 | 0 | Risk Difference (M‐H, Random, 95% CI) | 0.0 [0.0, 0.0] |
| 7.25 Tazarotene | 2 | 1627 | Risk Difference (M‐H, Random, 95% CI) | 0.07 [0.05, 0.10] |
| 7.26 Theophylline 1% ointment, twice daily | 1 | 22 | Risk Difference (M‐H, Random, 95% CI) | 0.0 [‐0.16, 0.16] |
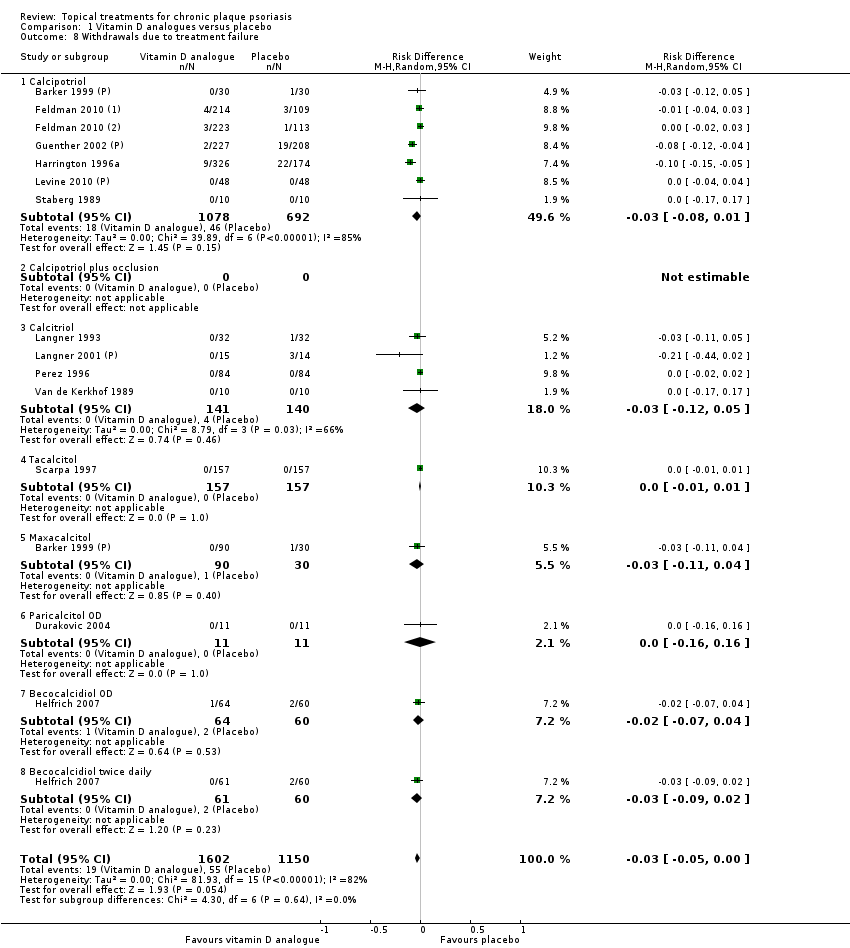
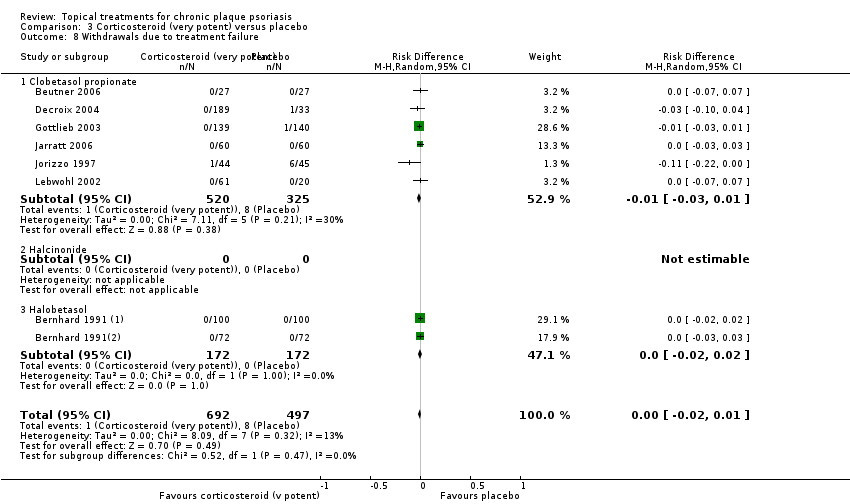
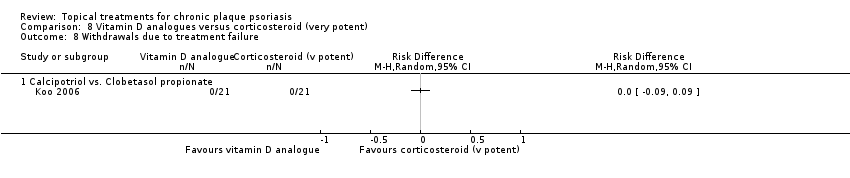
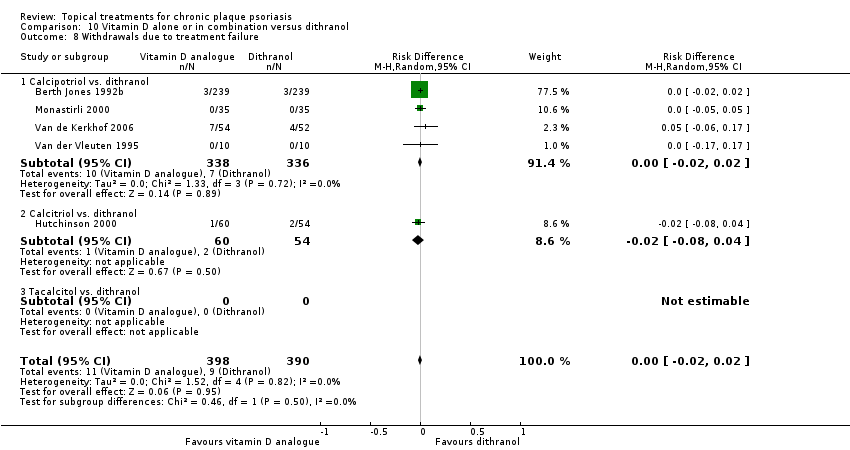
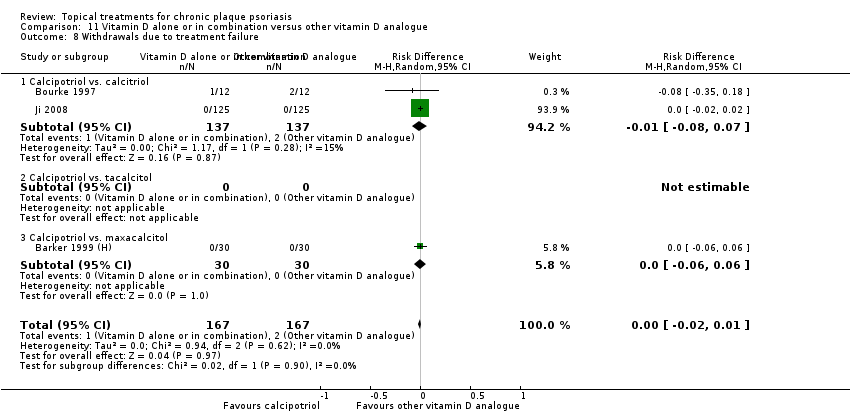
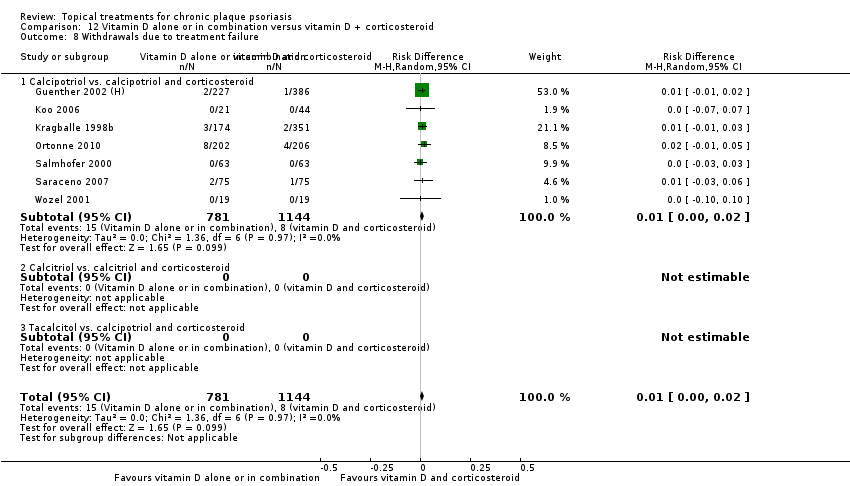
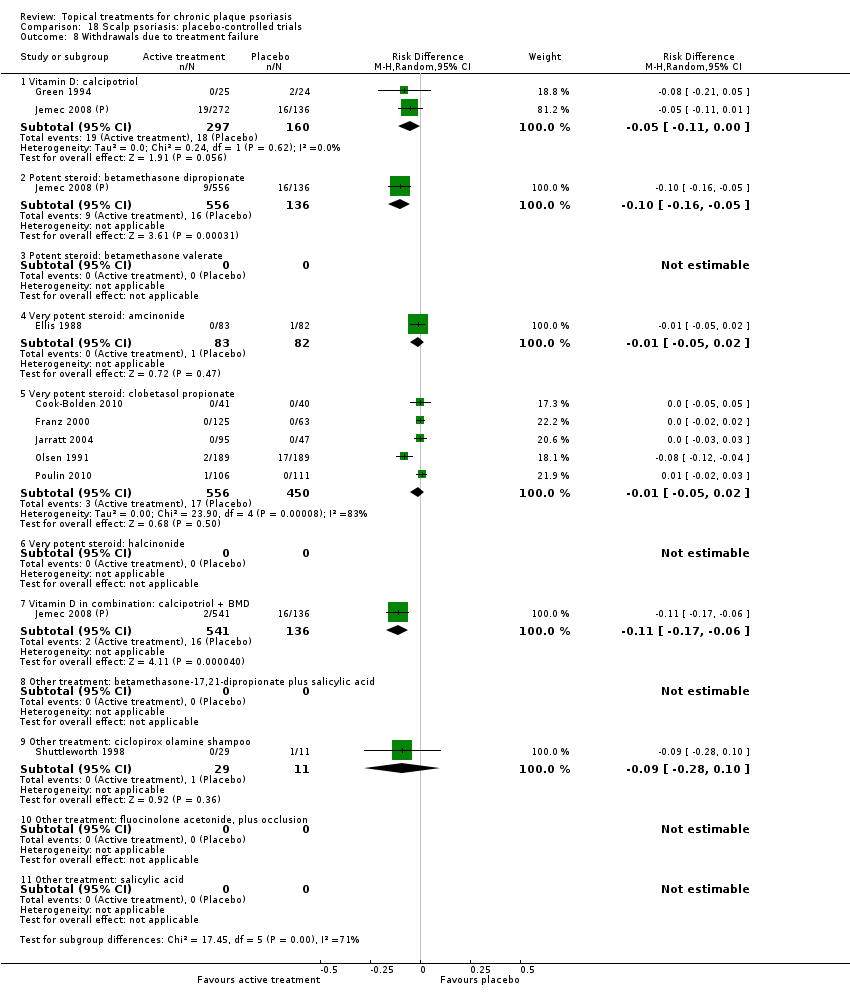
| 8 Withdrawals due to treatment failure Show forest plot | 18 | | Risk Difference (M‐H, Random, 95% CI) | Subtotals only |
|
| 8.1 Aloe vera extract 0.5% hydrophilic cream, three times per day | 1 | 60 | Risk Difference (M‐H, Random, 95% CI) | 0.0 [‐0.06, 0.06] |
| 8.2 Anti‐IL‐8 monoclonal antibody cream | 0 | 0 | Risk Difference (M‐H, Random, 95% CI) | 0.0 [0.0, 0.0] |
| 8.3 Betamethasone 17‐valerate 21‐acetate plus tretinoin plus salicylic acid | 1 | 85 | Risk Difference (M‐H, Random, 95% CI) | 0.02 [‐0.04, 0.08] |
| 8.4 Caffeine (topical) 10%, TD | 1 | 78 | Risk Difference (M‐H, Random, 95% CI) | 0.0 [‐0.05, 0.05] |
| 8.5 Calcipotriene 0.005% ointment + nicotinamide 0.05% or 0.1% or 0.7% or 1.4%, twice daily | 1 | 192 | Risk Difference (M‐H, Random, 95% CI) | 0.0 [‐0.03, 0.03] |
| 8.6 Dead Sea salts emollient lotion | 1 | 24 | Risk Difference (M‐H, Random, 95% CI) | 0.08 [‐0.12, 0.29] |
| 8.7 Fish oil plus occlusion | 1 | 50 | Risk Difference (M‐H, Random, 95% CI) | 0.0 [‐0.07, 0.07] |
| 8.8 Herbal skin care (Dr Michaels® cleansing gel, ointment and skin conditioner), twice daily | 0 | 0 | Risk Difference (M‐H, Random, 95% CI) | 0.0 [0.0, 0.0] |
| 8.9 Hexafluoro‐1,25‐dihydroxyvitamin D3 | 1 | 30 | Risk Difference (M‐H, Random, 95% CI) | 0.0 [‐0.12, 0.12] |
| 8.10 Indigo naturalis 1.4% ointment | 1 | 28 | Risk Difference (M‐H, Random, 95% CI) | 0.0 [‐0.13, 0.13] |
| 8.11 Kukui nut oil, TD | 1 | 30 | Risk Difference (M‐H, Random, 95% CI) | 0.0 [‐0.12, 0.12] |
| 8.12 Mahonia aquifolium (Reliéva™), twice daily | 0 | 0 | Risk Difference (M‐H, Random, 95% CI) | 0.0 [0.0, 0.0] |
| 8.13 Methotrexate gel | 1 | 60 | Risk Difference (M‐H, Random, 95% CI) | 0.0 [‐0.06, 0.06] |
| 8.14 Mycophenolic acid ointment | 1 | 14 | Risk Difference (M‐H, Random, 95% CI) | 0.0 [‐0.24, 0.24] |
| 8.15 NG‐monomethyl‐L‐arginine (L‐NMMA) cream | 1 | 34 | Risk Difference (M‐H, Random, 95% CI) | 0.0 [‐0.11, 0.11] |
| 8.16 Nicotinamide 1.4%, twice daily | 1 | 96 | Risk Difference (M‐H, Random, 95% CI) | 0.0 [‐0.04, 0.04] |
| 8.17 Oleum horwathiensis | 1 | 50 | Risk Difference (M‐H, Random, 95% CI) | 0.0 [‐0.07, 0.07] |
| 8.18 Omega‐3‐polyunsaturated fatty acids ointment | 1 | 146 | Risk Difference (M‐H, Random, 95% CI) | 0.0 [‐0.03, 0.03] |
| 8.19 Platelet aggregation activating factor (PAF)(Ro 24‐0238) | 0 | 0 | Risk Difference (M‐H, Random, 95% CI) | 0.0 [0.0, 0.0] |
| 8.20 Polymyxin B cream 200,000 U/g | 0 | 0 | Risk Difference (M‐H, Random, 95% CI) | 0.0 [0.0, 0.0] |
| 8.21 PTH (1‐34) in Novasome A® liposomal cream, twice daily | 1 | 30 | Risk Difference (M‐H, Random, 95% CI) | 0.0 [‐0.12, 0.12] |
| 8.22 Sirolimus (topical) | 0 | 0 | Risk Difference (M‐H, Random, 95% CI) | 0.0 [0.0, 0.0] |
| 8.23 Tacrolimus ointment | 0 | 0 | Risk Difference (M‐H, Random, 95% CI) | 0.0 [0.0, 0.0] |
| 8.24 Tar | 0 | 0 | Risk Difference (M‐H, Random, 95% CI) | 0.0 [0.0, 0.0] |
| 8.25 Tazarotene | 2 | 1627 | Risk Difference (M‐H, Random, 95% CI) | ‐0.02 [‐0.04, 0.01] |
| 8.26 Theophylline 1% ointment, twice daily | 1 | 22 | Risk Difference (M‐H, Random, 95% CI) | 0.0 [‐0.16, 0.16] |
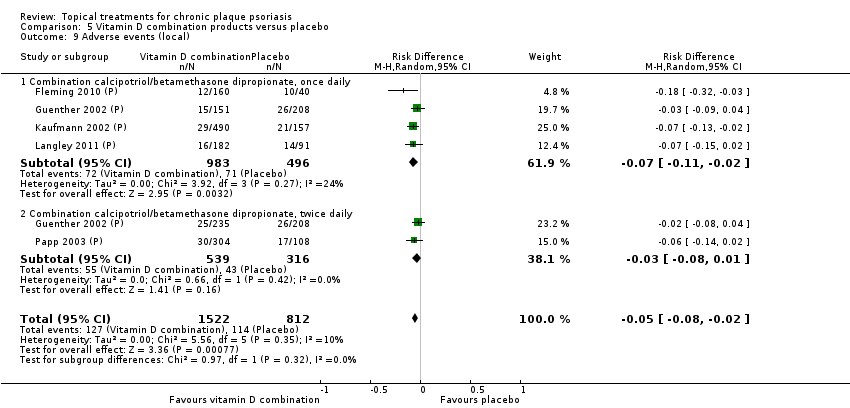
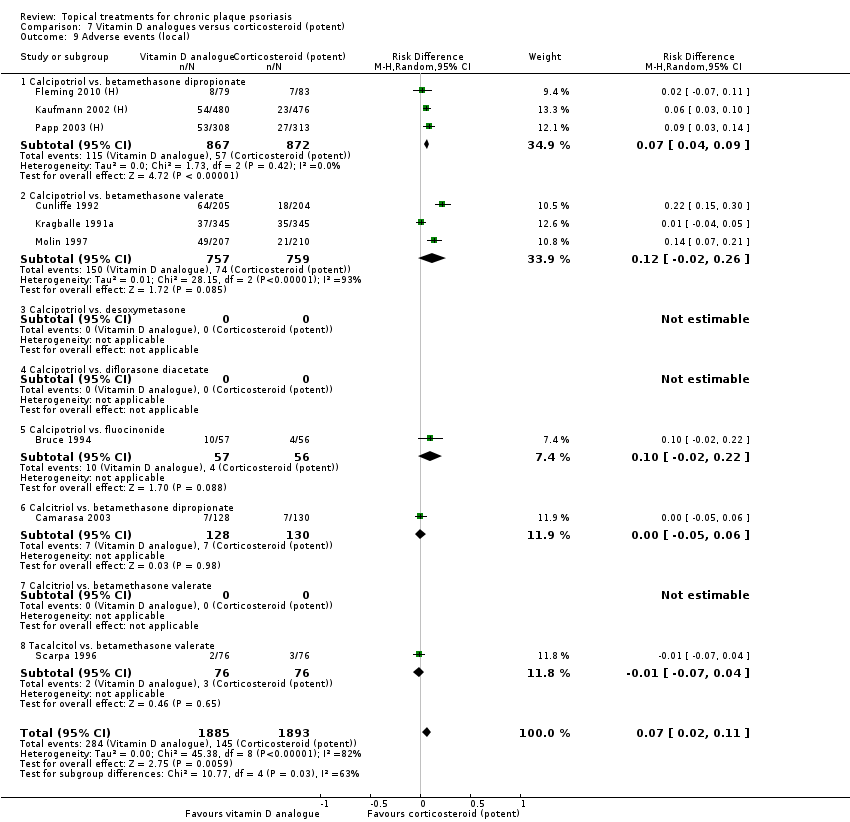
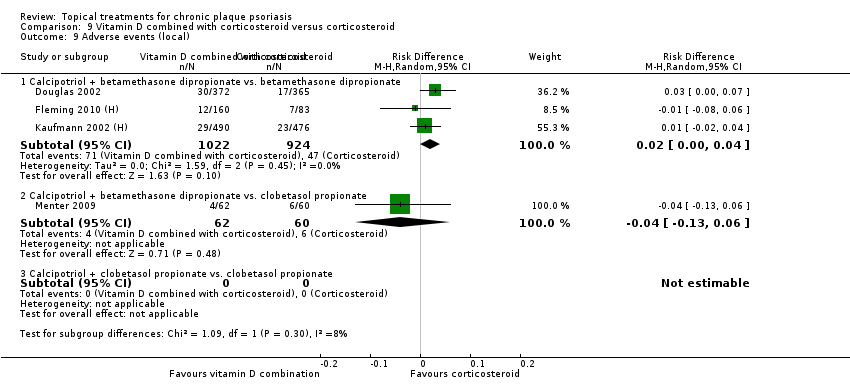
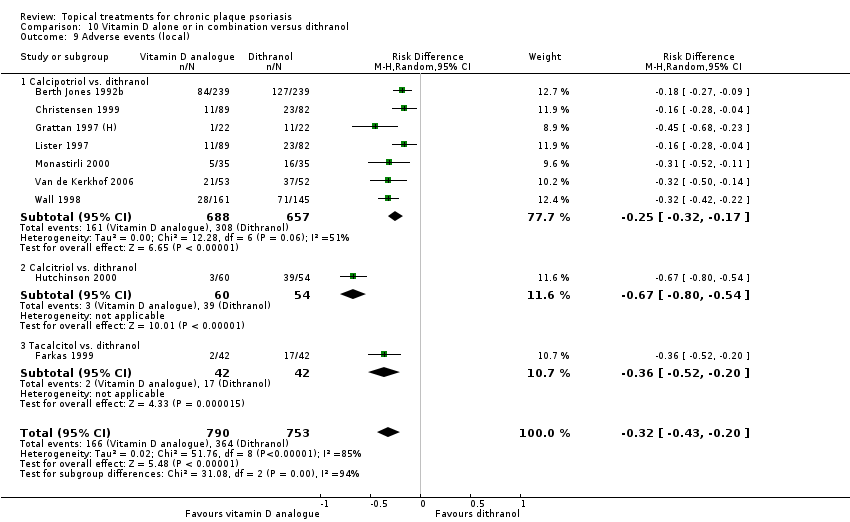
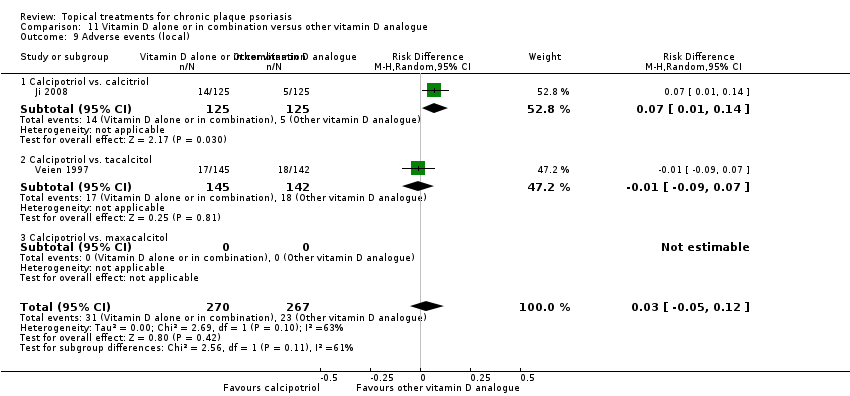
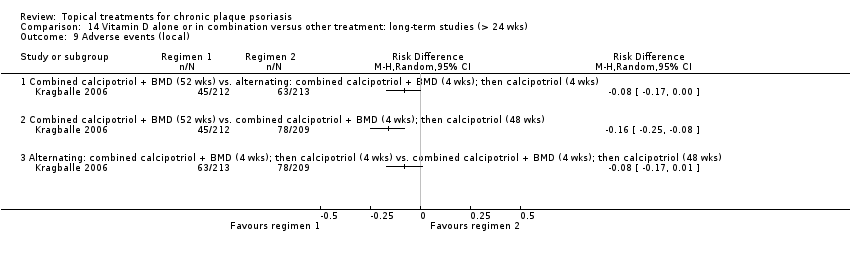
| 9 Adverse events (local) Show forest plot | 21 | | Risk Difference (M‐H, Random, 95% CI) | Subtotals only |
|
| 9.1 Aloe vera extract 0.5% hydrophilic cream, three times per day | 1 | 60 | Risk Difference (M‐H, Random, 95% CI) | 0.0 [‐0.06, 0.06] |
| 9.2 Anti‐IL‐8 monoclonal antibody cream | 1 | 92 | Risk Difference (M‐H, Random, 95% CI) | 0.02 [‐0.10, 0.14] |
| 9.3 Betamethasone 17‐valerate 21‐acetate plus tretinoin plus salicylic acid | 1 | 85 | Risk Difference (M‐H, Random, 95% CI) | ‐0.00 [‐0.07, 0.06] |
| 9.4 Caffeine (topical) 10%, TD | 1 | 78 | Risk Difference (M‐H, Random, 95% CI) | 0.05 [‐0.03, 0.13] |
| 9.5 Calcipotriene 0.005% ointment + nicotinamide 0.05% or 0.1% or 0.7% or 1.4%, twice daily | 1 | 192 | Risk Difference (M‐H, Random, 95% CI) | 0.13 [‐0.02, 0.27] |
| 9.6 Dead Sea salts emollient lotion | 1 | 24 | Risk Difference (M‐H, Random, 95% CI) | 0.08 [‐0.18, 0.35] |
| 9.7 Fish oil plus occlusion | 1 | 50 | Risk Difference (M‐H, Random, 95% CI) | 0.04 [‐0.06, 0.14] |
| 9.8 Herbal skin care (Dr Michaels® cleansing gel, ointment and skin conditioner), twice daily | 1 | 24 | Risk Difference (M‐H, Random, 95% CI) | ‐0.09 [‐0.44, 0.27] |
| 9.9 Hexafluoro‐1,25‐dihydroxyvitamin D3 | 1 | 30 | Risk Difference (M‐H, Random, 95% CI) | 0.13 [‐0.06, 0.33] |
| 9.10 Indigo naturalis 1.4% ointment | 2 | 88 | Risk Difference (M‐H, Random, 95% CI) | 0.0 [‐0.05, 0.05] |
| 9.11 Kukui nut oil, TD | 1 | 30 | Risk Difference (M‐H, Random, 95% CI) | 0.0 [‐0.12, 0.12] |
| 9.12 Mahonia aquifolium (Reliéva™), twice daily | 1 | 200 | Risk Difference (M‐H, Random, 95% CI) | ‐0.02 [‐0.06, 0.02] |
| 9.13 Methotrexate gel | 1 | 60 | Risk Difference (M‐H, Random, 95% CI) | 0.0 [‐0.06, 0.06] |
| 9.14 Mycophenolic acid ointment | 1 | 14 | Risk Difference (M‐H, Random, 95% CI) | 0.0 [‐0.24, 0.24] |
| 9.15 NG‐monomethyl‐L‐arginine (L‐NMMA) cream | 1 | 34 | Risk Difference (M‐H, Random, 95% CI) | 0.0 [‐0.11, 0.11] |
| 9.16 Nicotinamide 1.4%, twice daily | 1 | 96 | Risk Difference (M‐H, Random, 95% CI) | 0.10 [‐0.07, 0.28] |
| 9.17 Oleum horwathiensis | 1 | 50 | Risk Difference (M‐H, Random, 95% CI) | 0.04 [‐0.06, 0.14] |
| 9.18 Omega‐3‐polyunsaturated fatty acids ointment | 1 | 146 | Risk Difference (M‐H, Random, 95% CI) | 0.01 [‐0.02, 0.05] |
| 9.19 Platelet aggregation activating factor (PAF)(Ro 24‐0238) | 1 | 104 | Risk Difference (M‐H, Random, 95% CI) | 0.0 [‐0.19, 0.19] |
| 9.20 Polymyxin B cream 200,000 U/g | 0 | 0 | Risk Difference (M‐H, Random, 95% CI) | 0.0 [0.0, 0.0] |
| 9.21 PTH (1‐34) in Novasome A® liposomal cream, twice daily | 1 | 30 | Risk Difference (M‐H, Random, 95% CI) | 0.0 [‐0.12, 0.12] |
| 9.22 Sirolimus (topical) | 0 | 0 | Risk Difference (M‐H, Random, 95% CI) | 0.0 [0.0, 0.0] |
| 9.23 Tacrolimus ointment | 0 | 0 | Risk Difference (M‐H, Random, 95% CI) | 0.0 [0.0, 0.0] |
| 9.24 Tar | 0 | 0 | Risk Difference (M‐H, Random, 95% CI) | 0.0 [0.0, 0.0] |
| 9.25 Tazarotene | 0 | 0 | Risk Difference (M‐H, Random, 95% CI) | 0.0 [0.0, 0.0] |
| 9.26 Theophylline 1% ointment, twice daily | 1 | 22 | Risk Difference (M‐H, Random, 95% CI) | 0.0 [‐0.16, 0.16] |
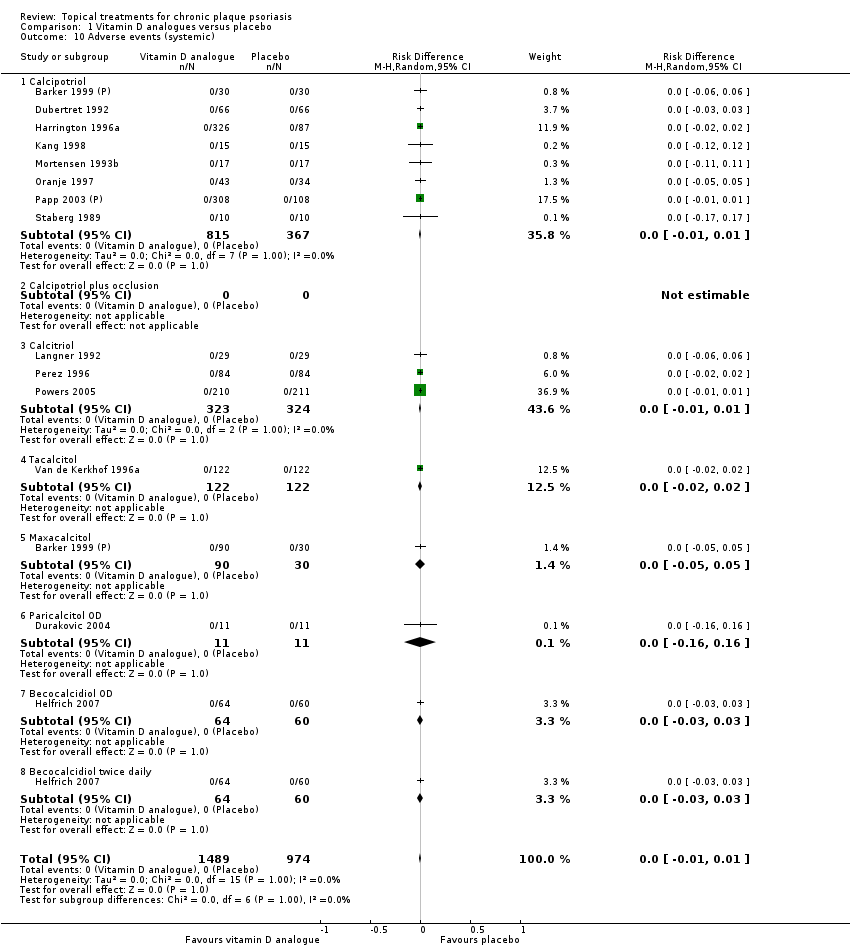
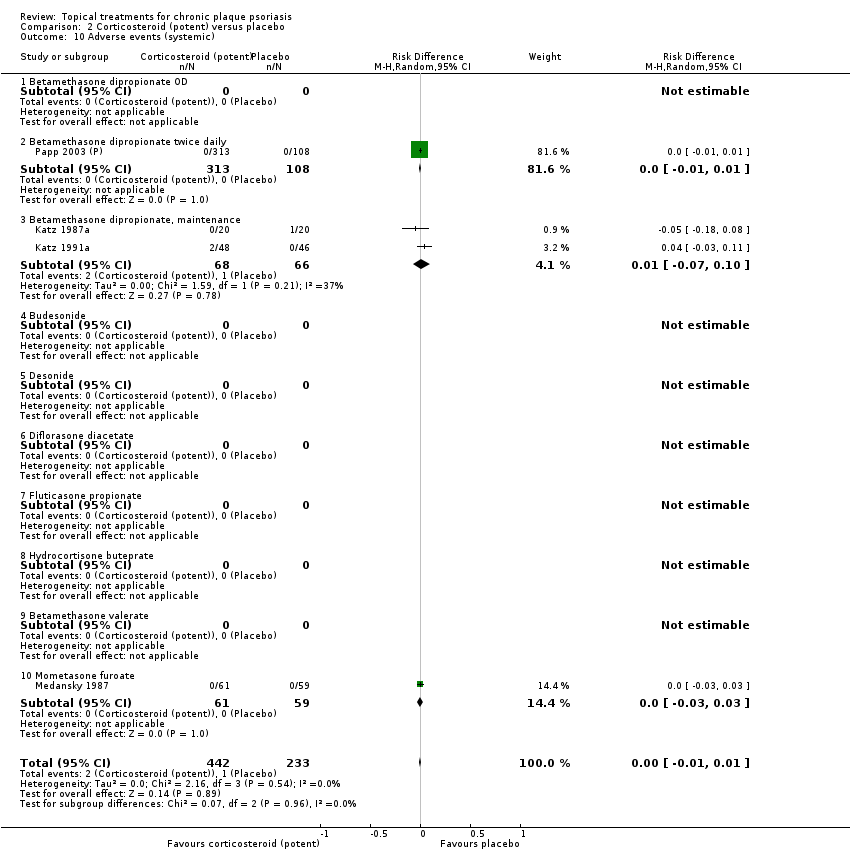
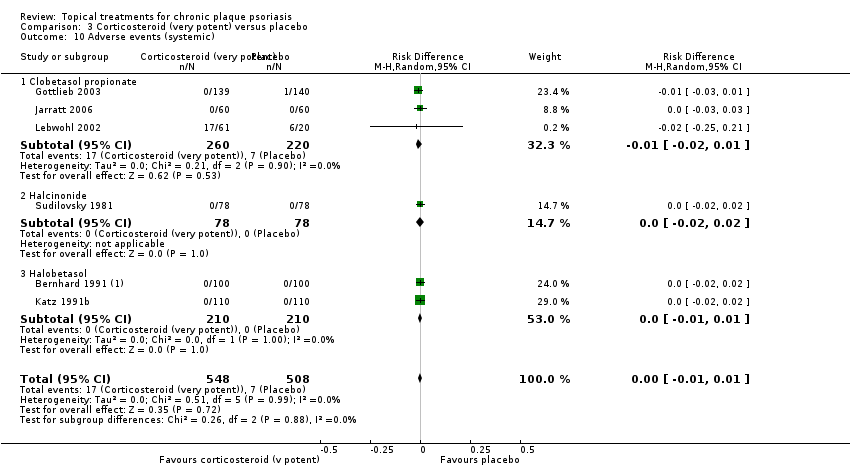
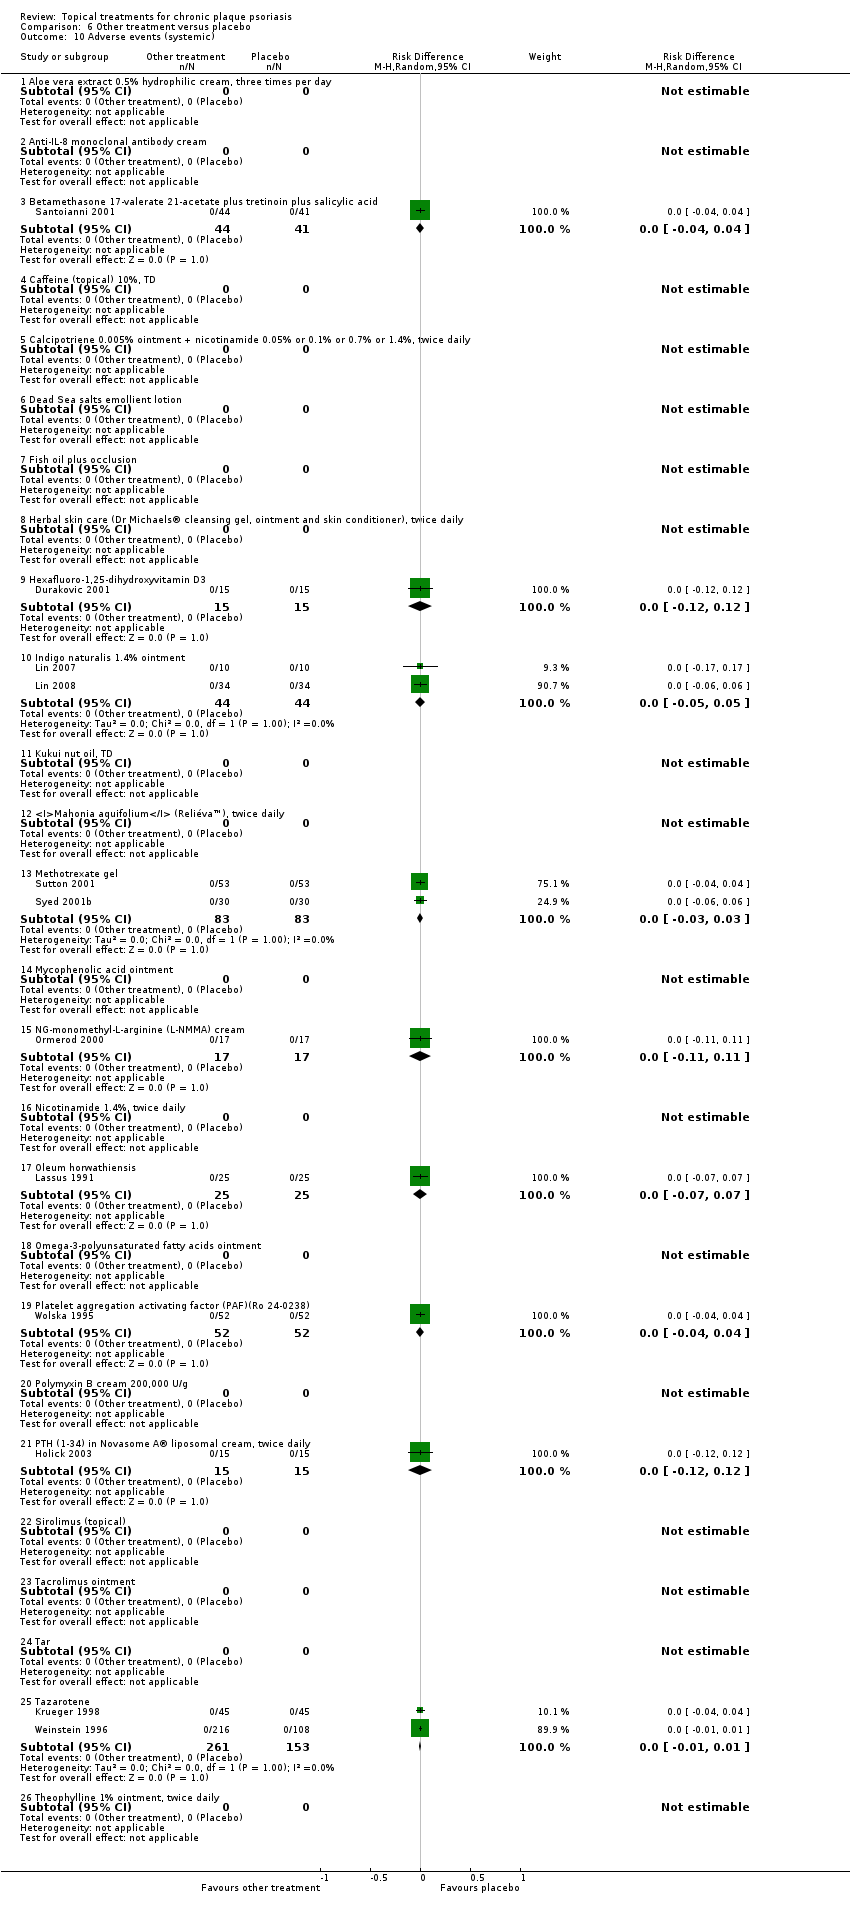
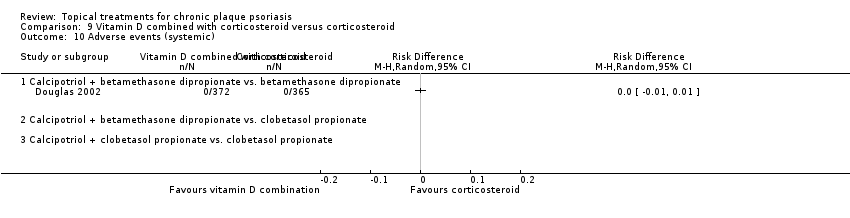
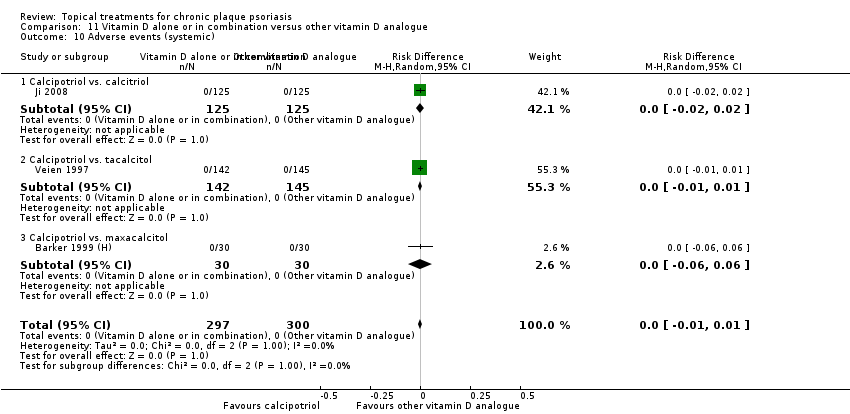
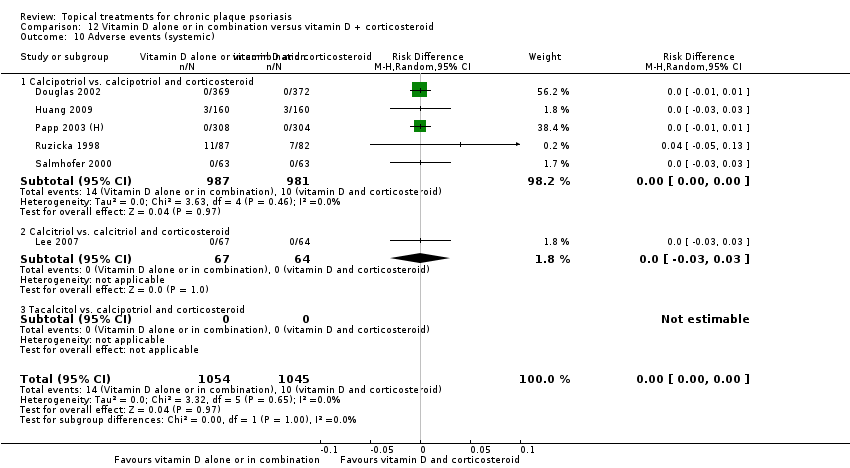
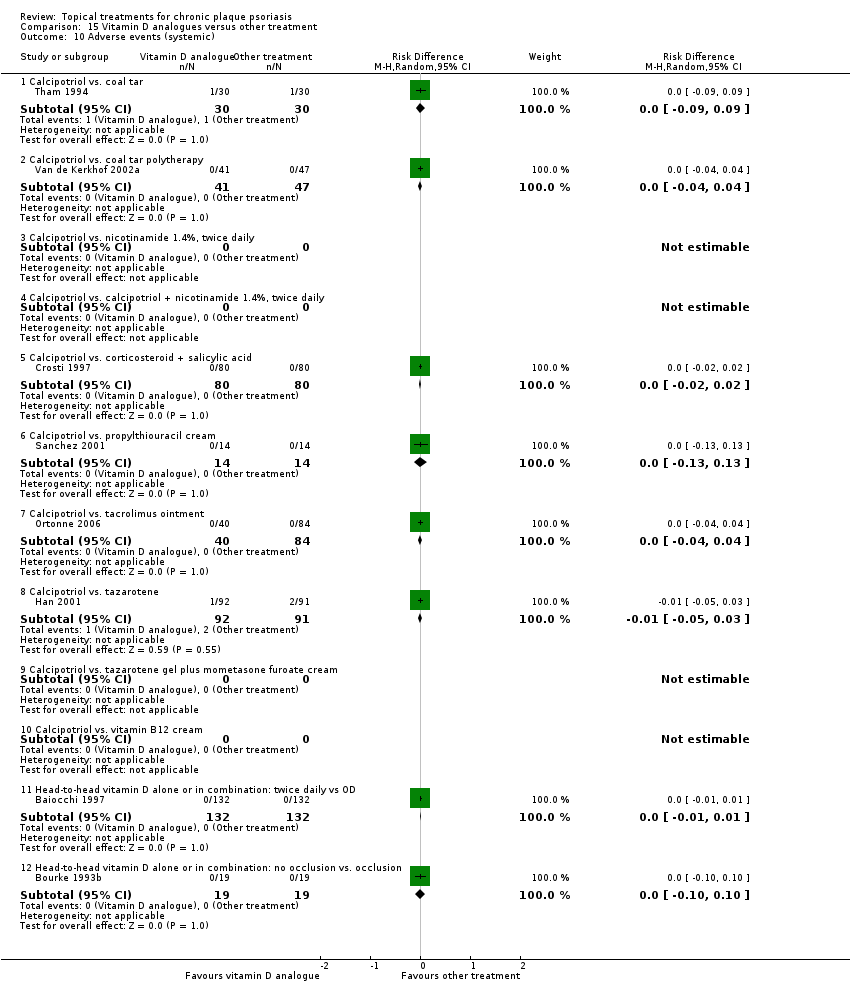
| 10 Adverse events (systemic) Show forest plot | 12 | | Risk Difference (M‐H, Random, 95% CI) | Subtotals only |
|
| 10.1 Aloe vera extract 0.5% hydrophilic cream, three times per day | 0 | 0 | Risk Difference (M‐H, Random, 95% CI) | 0.0 [0.0, 0.0] |
| 10.2 Anti‐IL‐8 monoclonal antibody cream | 0 | 0 | Risk Difference (M‐H, Random, 95% CI) | 0.0 [0.0, 0.0] |
| 10.3 Betamethasone 17‐valerate 21‐acetate plus tretinoin plus salicylic acid | 1 | 85 | Risk Difference (M‐H, Random, 95% CI) | 0.0 [‐0.04, 0.04] |
| 10.4 Caffeine (topical) 10%, TD | 0 | 0 | Risk Difference (M‐H, Random, 95% CI) | 0.0 [0.0, 0.0] |
| 10.5 Calcipotriene 0.005% ointment + nicotinamide 0.05% or 0.1% or 0.7% or 1.4%, twice daily | 0 | 0 | Risk Difference (M‐H, Random, 95% CI) | 0.0 [0.0, 0.0] |
| 10.6 Dead Sea salts emollient lotion | 0 | 0 | Risk Difference (M‐H, Random, 95% CI) | 0.0 [0.0, 0.0] |
| 10.7 Fish oil plus occlusion | 0 | 0 | Risk Difference (M‐H, Random, 95% CI) | 0.0 [0.0, 0.0] |
| 10.8 Herbal skin care (Dr Michaels® cleansing gel, ointment and skin conditioner), twice daily | 0 | 0 | Risk Difference (M‐H, Random, 95% CI) | 0.0 [0.0, 0.0] |
| 10.9 Hexafluoro‐1,25‐dihydroxyvitamin D3 | 1 | 30 | Risk Difference (M‐H, Random, 95% CI) | 0.0 [‐0.12, 0.12] |
| 10.10 Indigo naturalis 1.4% ointment | 2 | 88 | Risk Difference (M‐H, Random, 95% CI) | 0.0 [‐0.05, 0.05] |
| 10.11 Kukui nut oil, TD | 0 | 0 | Risk Difference (M‐H, Random, 95% CI) | 0.0 [0.0, 0.0] |
| 10.12 Mahonia aquifolium (Reliéva™), twice daily | 0 | 0 | Risk Difference (M‐H, Random, 95% CI) | 0.0 [0.0, 0.0] |
| 10.13 Methotrexate gel | 2 | 166 | Risk Difference (M‐H, Random, 95% CI) | 0.0 [‐0.03, 0.03] |
| 10.14 Mycophenolic acid ointment | 0 | 0 | Risk Difference (M‐H, Random, 95% CI) | 0.0 [0.0, 0.0] |
| 10.15 NG‐monomethyl‐L‐arginine (L‐NMMA) cream | 1 | 34 | Risk Difference (M‐H, Random, 95% CI) | 0.0 [‐0.11, 0.11] |
| 10.16 Nicotinamide 1.4%, twice daily | 0 | 0 | Risk Difference (M‐H, Random, 95% CI) | 0.0 [0.0, 0.0] |
| 10.17 Oleum horwathiensis | 1 | 50 | Risk Difference (M‐H, Random, 95% CI) | 0.0 [‐0.07, 0.07] |
| 10.18 Omega‐3‐polyunsaturated fatty acids ointment | 0 | 0 | Risk Difference (M‐H, Random, 95% CI) | 0.0 [0.0, 0.0] |
| 10.19 Platelet aggregation activating factor (PAF)(Ro 24‐0238) | 1 | 104 | Risk Difference (M‐H, Random, 95% CI) | 0.0 [‐0.04, 0.04] |
| 10.20 Polymyxin B cream 200,000 U/g | 0 | 0 | Risk Difference (M‐H, Random, 95% CI) | 0.0 [0.0, 0.0] |
| 10.21 PTH (1‐34) in Novasome A® liposomal cream, twice daily | 1 | 30 | Risk Difference (M‐H, Random, 95% CI) | 0.0 [‐0.12, 0.12] |
| 10.22 Sirolimus (topical) | 0 | 0 | Risk Difference (M‐H, Random, 95% CI) | 0.0 [0.0, 0.0] |
| 10.23 Tacrolimus ointment | 0 | 0 | Risk Difference (M‐H, Random, 95% CI) | 0.0 [0.0, 0.0] |
| 10.24 Tar | 0 | 0 | Risk Difference (M‐H, Random, 95% CI) | 0.0 [0.0, 0.0] |
| 10.25 Tazarotene | 2 | 414 | Risk Difference (M‐H, Random, 95% CI) | 0.0 [‐0.01, 0.01] |
| 10.26 Theophylline 1% ointment, twice daily | 0 | 0 | Risk Difference (M‐H, Random, 95% CI) | 0.0 [0.0, 0.0] |