Topičko liječenje kronične psorijaze s plakovima
Abstract
Background
Chronic plaque psoriasis is the most common type of psoriasis, and it is characterised by redness, thickness, and scaling. First‐line management of chronic plaque psoriasis is with topical treatments, including vitamin D analogues, topical corticosteroids, tar‐based preparations, dithranol, salicylic acid, and topical retinoids.
Objectives
To compare the effectiveness, tolerability, and safety of topical treatments for chronic plaque psoriasis, relative to placebo, and to similarly compare vitamin D analogues (used alone or in combination) with other topical treatments.
Search methods
We updated our searches of the following databases to February 2011: the Cochrane Skin Group Specialised Register, CENTRAL in The Cochrane Library (2011, Issue 2), MEDLINE (from 1948), EMBASE (from 1980), Science Citation Index (from 2008), Conference Proceedings Citation Index ‐ Science (from 2008), BIOSIS (from 1993), Dissertation Abstracts via DialogClassic (all publication years), and Inside Conferences (all publication years).
We identified ongoing and unpublished studies from the UK Clinical Research Network Study Portfolio and the metaRegister of Controlled Trials. We checked the bibliographies of published studies and reviews for further references to relevant trials, and we contacted trialists and companies for information about newly published studies.
A separate search for adverse effects was undertaken in February 2011 using MEDLINE and EMBASE (from 2005).
Final update searches for both RCTs and adverse effects were undertaken in August 2012. Although it has not been possible to incorporate RCTs and adverse effects studies identified through these final searches within this review, we will incorporate these into the next update.
Selection criteria
Randomised trials comparing active topical treatments against placebo or against vitamin D analogues (used alone or in combination) in people with chronic plaque psoriasis.
Data collection and analysis
One author extracted study data and assessed study quality. A second author checked these data. We routinely contacted trialists and companies for missing data. We also extracted data on withdrawals and on local and systemic adverse events. We defined long‐term trials as those with a duration of at least 24 weeks.
Main results
This update added 48 trials and provided evidence on 7 new active treatments. In total, the review included 177 randomised controlled trials, with 34,808 participants, including 26 trials of scalp psoriasis and 6 trials of inverse psoriasis, facial psoriasis, or both. The number of included studies counted by Review Manager (RevMan) is higher than these figures (190) because we entered each study reporting a placebo and an active comparison into the 'Characteristics of included studies' table as 2 studies.
When used on the body, most vitamin D analogues were significantly more effective than placebo, with the standardised mean difference (SMD) ranging from ‐0.67 (95% CI ‐1.04 to ‐0.30; 1 study, 119 participants) for twice‐daily becocalcidiol to SMD ‐1.66 (95% CI ‐2.66 to ‐0.67; 1 study, 11 participants) for once‐daily paricalcitol. On a 6‐point global improvement scale, these effects translate into 0.8 and 1.9 points, respectively. Most corticosteroids also performed better than placebo; potent corticosteroids (SMD ‐0.89; 95% CI ‐1.06 to ‐0.72; I² statistic = 65.1%; 14 studies, 2011 participants) had smaller benefits than very potent corticosteroids (SMD ‐1.56; 95% CI ‐1.87 to ‐1.26); I² statistic = 81.7%; 10 studies, 1264 participants). On a 6‐point improvement scale, these benefits equate to 1.0 and 1.8 points, respectively. Dithranol, combined treatment with vitamin D/corticosteroid, and tazarotene all performed significantly better than placebo.
Head‐to‐head comparisons of vitamin D for psoriasis of the body against potent or very potent corticosteroids had mixed findings. For both body and scalp psoriasis, combined treatment with vitamin D and corticosteroid performed significantly better than vitamin D alone or corticosteroid alone. Vitamin D generally performed better than coal tar, but findings relative to dithranol were mixed. When applied to psoriasis of the scalp, vitamin D was significantly less effective than both potent corticosteroids and very potent corticosteroids. Indirect evidence from placebo‐controlled trials supported these findings.
For both body and scalp psoriasis, potent corticosteroids were less likely than vitamin D to cause local adverse events, such as burning or irritation. Combined treatment with vitamin D/corticosteroid on either the body or the scalp was tolerated as well as potent corticosteroids, and significantly better than vitamin D alone. Only 25 trials assessed clinical cutaneous dermal atrophy; few cases were detected, but trials reported insufficient information to determine whether assessment methods were robust. Clinical measurements of dermal atrophy are insensitive and detect only the most severe cases. No comparison of topical agents found a significant difference in systemic adverse effects.
Authors' conclusions
Corticosteroids perform at least as well as vitamin D analogues, and they are associated with a lower incidence of local adverse events. However, for people with chronic plaque psoriasis receiving long‐term treatment with corticosteroids, there remains a lack of evidence about the risk of skin dermal atrophy. Further research is required to inform long‐term maintenance treatment and provide appropriate safety data.
PICO
Laički sažetak
Lijekovi koji se nanose na kožu za kroničnu psorijazu s plakovima
Kronična psorijaza s plakovima je najčešći tip psorijaze. Iako može zahvatiti bilo koji dio tijela, najčešće se pojavljuje na laktovima, koljenima i vlasištu. Najčešće se prvo proba topičko liječenje (tj. liječenje koje se primjenjuje na kožu). To uključuje proizvode koji sadrže vitamin D, lokalne kortikosteroide, preparate bazirane na katranu, dithranol, salicilnu kiselinu i proizvode koji sadrže vitamin A. Pošto je kronična psorijaza s plakovima dugotrajno stanje, važno je otkriti koje je liječenje najučinkovitije i kakve nuspojave ima. Ovaj Cochrane sustavni pregled analizirao je prosječnu djelotvornost različitih vrsta liječenja, pri čemu se uvažava činjenica da pojedini pacijenti mogu različito reagirati na liječenje.
Dokazi se temelje na 177 studija koje su uključile ukupno 34 808 ljudi. Studije su prosječno trajale oko 7 tjedana, ali je raspon trajanja bio između 1 i 52 tjedna. Pokazalo se da proizvodi koji sadrže vitamin D djeluju bolje od placeba (osnovna krema ili mast). Potentni topički kortikosteroidi (snažni, npr. betametazon dipropionat) i vrlo potentni (vrlo snažni, npr. klobetazol propionat) topički kortikosteroidi su također bili učinkoviti.
Neke studije su usporedile proizvode koje sadrže vitamin D s potentnim ili vrlo potentnim kortikosteroidima. Ti proizvodi imali su sličan učinak kada su se primijenili na tijelo, ali su kortikosteroidi bili učinkovitiji za psorijazu vlasišta. Liječenje koje kombinira vitamin D s kortikosteroidom je učinkovitije od samog vitamina D ili samog topičkog kortikosteroida. Proizvodi koji sadrže vitamin D su se pokazali boljima od katrana, ali su studije pokazale oprečne rezultate uspoređujući vitamin D s dithranolom.
Topički kortikosteroidi, namazani na tijelo ili vlasište, rjeđe su uzrokovali lokalne nuspojave kao što su iritacija kože ili osjećaj pečenja od vitamina D. Stoga su pacijenti bili skloniji prestati koristiti proizvode koje sadrže vitamin D. U studijama nije utvrđena razlika između placeba i drugih vrsta liječenja s obzirom na učinke tih vrsta liječenja na tijelo (sustavne nuspojave). Međutim, to bi moglo biti zato što mnoga istraživanja nisu propisno procijenila takve nuspojave, a ne zato što zbilja nije bilo razlike.
Potrebno je provesti više dugotrajnih studija koje bi pomogle liječnicima i oboljelima od psorijaze kako bi odlučili koji je najbolji način liječenja ovog kroničnog stanja.
Authors' conclusions
Background
Description of the condition
Psoriasis is a chronic inflammatory skin disease with a prevalence ranging from between 1% and 2% in the UK and northern European populations (Hellgren 1967; Krueger 1984) to 0.1% to 0.3% in the Far East (Simons 1949) and China (Yip 1984). Psoriasis comprises multiple phenotypes and may be localised (e.g. to the skin‐fold areas (inverse psoriasis), the palms, or the soles) or widespread. Types of widespread psoriasis include guttate, generalised pustular, and erythrodermic (Griffiths 2007). Chronic plaque psoriasis may be localised or widespread and accounts for 90% of psoriasis cases (Griffiths 2007); it is characterised by red patches of thickened skin (plaques) covered in silver scales (Figure 1). Any area of the body may be affected, but the main areas are the knees, elbows, lower back, and scalp. There is a wide spectrum of disease severity from a single plaque to involvement of more than 90% of the skin surface. Psoriasis may be classified as 'mild', 'moderate', or 'severe', although these categories are difficult to define precisely (Krueger 2000). Psoriatic arthritis accompanies the cutaneous (skin) manifestations of psoriasis in 5% to 30% of cases (Barisic‐Drusko 1994; Krueger 1984; Salvarani 1995; Zanolli 1992). Recent improvements in the classification criteria may reduce the wide variation in reported prevalence of psoriatic arthritis (Taylor 2006). Psoriasis occurs in 5% of people with Crohn's disease (Lee 1990).

Chronic plaque psoriasis
Source: Dermis Dermatology Atlas Online (used with permission)
Causes
The way that psoriasis develops is complicated and appears to be influenced by many factors, including genetic changes, local trauma, infections, certain drugs (such as beta‐blockers, lithium, chloroquine, and non‐steroidal anti‐inflammatory drugs (NSAIDs)), the duration of antipsoriatic treatments, endocrine factors, sunlight, alcohol, smoking, and stress (Tagami 1997). The skin lesions of psoriasis are shown in Figure 2, and they are characterised by cells multiplying too quickly (epidermal hyperproliferation), cells not maturing normally (abnormal keratinocyte differentiation), and the presence of cells that cause inflammation (a lymphocyte inflammatory infiltrate) (Barker 1991; Griffiths 2003; Stern 1997). Psoriasis is now recognised as an immune‐mediated disorder, with tumour necrosis factor alpha (TNFα), dendritic cells, and T‐cells all contributing to its pathogenesis (Griffiths 2007a). Several genes interact with environmental factors to induce the development of psoriasis, and different combinations of changes in several genes and environmental factors can produce the same clinical picture of psoriasis (Bhalerao 1998; Brandrup 1978; Farber 1974; Lomholt 1963; Willan 1808). A locus (plural = loci) is the specific location of a gene on a chromosome, and its position is defined using the letters 'p' (for a chromosome's short arm) and 'q' (for a long arm). At least nine chromosomal psoriasis susceptibility loci were originally identified (Griffiths 2007a). The strongest association and linkage is to a locus within the major histocompatibility complex, the area affecting immune response (Genetic Analysis of Psoriasis Consortium 2010; Henseler 1992; Russell 1972; Svejgaard 1974; Tazi‐Ahnini 1999a; Tazi‐Ahnini 1999b; Trembath 1997). Other linkage studies have reported linkage to 4q and 17q (Matthews 1996; Tomfohrde 1994) and 16q and 20q (Nair 1997; Trembath 1997). Proinflammatory CD4‐positive T helper cells produce interferon gamma (produced by Th1) or interleukin (IL)‐17 (produced by Th17). These cells interact with dendritic cells, macrophages, mast cells, and neutrophils, causing inflammation (Ghoreschi 2007). A meta‐analysis of 3 genome‐wide association studies (GWAS) has identified 15 new susceptibility loci (Tsoi 2012) for psoriasis. This brings the total number of loci associated with psoriasis to 36. Several of these loci are involved in the regulation of the skin's innate immune response. They provide confirmation of the role of several existing biologic therapies as well as new targets for drug development.

The epidermis in the skin of people with and without psoriasis
Impact
Until identified as a single disease by von Hebra in 1841, psoriasis was thought to be a variant of leprosy and regarded as contagious (de Jong 1997). The misconception may persist: In a survey of people with psoriasis in 1997, almost three‐quarters of respondents reported that others thought their condition was contagious, and a similar proportion feared swimming and taking part in sporting activities (Watts 1998). Psoriasis can lead to social isolation (van de Kerkhof 1997a), stigmatisation (Gupta 1998; van de Kerkhof 1997a), and fear of other people's reactions, adversely affecting the quality of daily life (Finlay 1994; Finlay 1995a; Finlay 1995b; Finlay 2001; McKenna 2003; Ortonne 2000; Richards 2003; Stern 1995). Psychological distress induced by psoriasis may also impair the response to treatment (Fortune 2003).
Description of the intervention
Treatment of psoriasis should always be appropriate to its severity and importance to that individual: It should never be more unpleasant, intolerable, or dangerous than the disease itself (Camp 1992). Topical treatments include vitamin D analogues, topical corticosteroids, tar‐based preparations, dithranol, salicylic acid, and topical retinoids (Baadsgaard 1995; Corbett 1976; Fredriksson 1980; Goeckerman 1931; Ingram 1953; Kragballe 1988; Kragballe 1989; Langner 1996; Staberg 1989; Unna 1916; Van de Kerkhof 1996a), but there is no evidence‐based 'treatment ladder' by which to sequence treatments (Van de Kerkhof 2008). Emollients are generally used in a supportive role as an addition to topical treatments, to normalise hyperproliferation, differentiation, and to exert anti‐inflammatory effects (Fluhr 2008). The two classes of topical treatment for psoriasis that are most commonly prescribed in developed countries are vitamin D analogues and topical corticosteroids, because they are considered more cosmetically acceptable than tar and dithranol preparations (Baadsgaard 1995; Kragballe 1988; Van de Kerkhof 1996a).
Topical corticosteroids (specifically glucocorticoids) are available in four potencies: mild, moderate, potent, and very potent, which are assessed using the vasoconstrictor assay (BMA 2012). The benefit of topical steroids is that in cream formulations, they are easy to apply, cosmetically acceptable, do not stain the skin, and rarely cause irritation. There are several adverse effects of corticosteroids, including cutaneous atrophy, rebound after discontinuation of treatment, and decreasing response to the drug (tachyphylaxis) (du Vivier 1975; Lee 1998; Kao 2003). Glucocorticoids (GC) exert their effects either via interaction with cell membranes (non‐genomic effects) or downstream with the genome and via interaction with intracellular fluid in GC receptors and downstream with the genome (genomic effects). The genomic effects are of two types: "transrepression (inhibition of synthesis of regulatory proteins) and transactivation (induction of the synthesis of regulatory proteins)" (Bos 2008). Transactivation appears to mediate certain adverse reactions, such as cutaneous atrophy. Immunomodulation seems to be the result of GC‐mediated transrepression, that is, silencing of proinflammatory genes, such as TNFα. Non‐steroidal GC receptor ligands (selective GC receptor agonists) have recently been identified and may reduce the side‐effects of GC without loss of immunosuppressive effects (Bos 2008).
The naturally occurring active metabolite of vitamin D, calcitriol (1a,25‐dihydroxyvitamin D3) (Langner 1996), and two synthetic vitamin D analogues, calcipotriol (Kragballe 1988; Kragballe 1989; Staberg 1989) and tacalcitol (1a,24‐dihydroxyvitamin D3) (Baadsgaard 1995; Van de Kerkhof 1996a), are effective when applied topically in psoriasis (Mason 2002a). These agents bind to vitamin D receptors (VDR), which in turn bind to vitamin D‐responsive elements (VDRE) in multiple genes. 'Switching on' (transactivation of) these genes inhibits the multiplication of cells and stimulates their differentiation (Figure 2). VDRs also suppress the inflammatory component of psoriasis by inhibiting the production of proinflammatory cytokines (small proteins that affect cell‐cell interaction), such as interleukin‐1 (IL‐1). Vitamin D analogues all have the potential to induce abnormally high levels of calcium in the blood serum (hypercalcaemia) and urine (hypercalciuria). Although calcipotriol ointment causes no elevation of total serum calcium when used at the recommended dose of 100 g per week (Mortensen 1993), there are significant elevations in both serum and urinary calcium when the dose is increased to 300 g per week (Bourke 1993a; Bourke 1994). Topical vitamin D analogues are cosmetically acceptable; they are not known to cause skin atrophy; and they are not usually associated with rebound when therapy is discontinued. However, at least 25% of people are reported to have little or no response to topical vitamin D analogues (Holick 1996; Mee 1998).
Urea or salicylic acid may be used to reduce thickness and scaling of the skin; combination with other products can improve their absorption. However, these can also irritate the skin. Topical immunosuppressants, such as methotrexate, and topical macrolactams, such as tacrolimus, are relatively new treatments, and their effectiveness, tolerability, and longer‐term effects are less clear than with the more established products. This review also considers combination products involving any of the above treatments.
The Cochrane Library has three published Cochrane reviews of interventions for psoriasis. Owen 2000 assessed the impact of antistreptococcal interventions for guttate and chronic plaque psoriasis. The review found that "although both antibiotics and tonsillectomy have frequently been advocated for patients with recurrent guttate psoriasis or chronic plaque psoriasis, there is to date no good evidence that either intervention is beneficial." Chalmers 2000 reviewed all treatments, excluding antistreptococcal interventions, for guttate psoriasis. The review identified only one relevant trial and no evidence of the effectiveness of any topical interventions. Chalmers 2006 assessed interventions, including topical treatments, for chronic palmoplantar pustulosis (a disease that is closely related to psoriasis and used to be considered a variant of psoriasis). Chalmers 2006 found that topical steroids under hydrocolloid occlusion were effective in inducing remission. In addition, The Cochrane Library has four published Cochrane review protocols, which cover interventions for nail psoriasis (Velema 2009), interventions for scalp psoriasis (Jales 2012), phototherapy (Chen 2011), and the biological agent ustekinumab (Roberts 2011).
Why it is important to do this review
Chronic plaque psoriasis is a condition for which there is no known cure, and currently, available treatments may only temporarily clear the skin (Bonifati 1998; Griffiths 2004). Clinical practice varies between and within different countries. By focusing on topical treatments for psoriasis, either as monotherapy or in combination, this review assesses the relative effectiveness, tolerability, and safety of these treatments and so helps to determine how best to induce remission and delay recurrence in people receiving topical treatment. Table 1 provides a list of acronyms used in the review.
| Acronym | Full name |
| BC | baseline comparability demonstrated (clinical/demographic) |
| BD | twice daily |
| BMD | betamethasone dipropionate |
| BMV | betamethasone valerate |
| BSA | Body Surface Area |
| Btw‐patient | Between‐patient |
| CI | confidence interval |
| dys | days |
| EQ‐5D | EuroQOL |
| FU | follow up (includes treatment period) |
| I² | heterogeneity statistic |
| IAGI | Investigator Assessment of Global Improvement (change score) |
| IGA | Investigator Global Assessment (static score) |
| IQR | interquartile range |
| ISGA | Investigator's Static Global Assessment Score |
| LAE | local adverse effects |
| LCD | liquor carbonis distillate |
| LF | loss to follow up (per cent of participants randomised, not contributing to primary outcome measure) |
| MEMS | Medication Event Monitoring System |
| mPASI | modified Psoriasis Area Severity Index |
| NA | not available/not applicable |
| NR | not reported |
| OD | once daily |
| OM | once in the morning |
| ON | once at night |
| ODS | overall disease severity |
| PAGI | Patient Assessment of Global Improvement (change score) |
| PASI | Psoriasis Area Severity Index |
| PDI | Psoriasis Disability Index |
| PGA | Patient Global Assessment (static score) |
| PMAQ‐3w | Medication Adherence Questionnaire, version 3W |
| pt | point |
| QOL | quality of life |
| RD | risk difference |
| SD | standard deviation |
| SMD | standardised mean difference |
| TCP | two‐compound product |
| TD | three times daily |
| TLPSS | Total Local Psoriasis Severity Score |
| TSS | Total Severity Score/total sum score |
| UV | ultra violet |
| VDRE | Vitamin D‐Responsive Element |
| wks | weeks |
| yrs | years |
Structure of the Review
The structure of the review is provided to facilitate navigation:
-
Objectives
-
Methods
-
Results
-
-
Description of the studies
-
Risk of bias in the included studies
-
Effects of the interventions
-
(1) Primary outcome measures
-
(a) Investigator's Assessment of Overall Global Improvement (IAGI)/Investigator's Global Assessment of Disease Severity (IGA)
-
(b) Total Severity Scores (TSS)
-
(c) Psoriasis Area and Severity Index (PASI)
-
(d) Patient Assessment of overall Global Improvement (PAGI)/Patient Global Assessment of Disease Severity (PGA)
-
(e) Combined end point (IAGI/TSS/PASI/PAGI)
-
-
(2) Secondary outcome measures
-
(a) Withdrawal rates (total rate; withdrawal because of adverse events; withdrawal because of treatment failure)
-
(b) Adverse events (local and systemic)
-
(i) Findings from the main review
-
(ii) Findings from the separate search for additional studies of adverse events
-
-
(c) Quality of life measures
-
(d) Economic outcomes (not updated in 2011)
-
(e) Concordance or adherence with treatment (not updated in 2011)
-
-
-
-
Discussion
-
Authors' conclusions
Under 'Primary outcome measures', we report findings for each of the 19 analyses (including sensitivity analyses). We also do this under 'Secondary outcome measures' for subsections (a) and (b). We did not update the sections on Economic outcomes (2d) and Concordance (2e) in 2011 because of resource constraints.
Objectives
To compare the effectiveness, tolerability, and safety of topical treatments for chronic plaque psoriasis, relative to placebo, and to similarly compare vitamin D analogues (used alone or in combination) with other topical treatments.
Methods
Criteria for considering studies for this review
Types of studies
We included randomised controlled trials in the review. Trials could be either placebo‐controlled or head‐to‐head with a vitamin D preparation (head‐to‐head trials compare two active treatments with each other). The types of study design eligible for inclusion were as follows: parallel‐group (between‐patient), cross‐over, and within‐patient designs. For within‐patient studies, where study participants serve as their own control, we included only those studies that clearly adopted a left‐right design, and we excluded studies where multiple plaques were treated with more than two products. If no useful effectiveness, withdrawal, or adverse events data were available, either from the published paper or from sponsors or trialists, we excluded the study.
In addition to findings on adverse events from the main review, we undertook separate searches for additional safety and tolerability studies. The searches for longer‐term adverse events included studies of any design that included humans (i.e. not only animals; either humans only or humans and animals). However, studies with fewer than 10 participants (including case reports) were not eligible for inclusion. We did not restrict the search for concordance/adherence studies by study design (i.e. non‐randomised studies were eligible for inclusion).
Types of participants
People of any age with chronic plaque psoriasis affecting the body, limbs, scalp, or a combination of the aforementioned. We did not limit participant type by area of involvement, disease severity, or skin area treated.
Types of interventions
Topical treatments, including the following:
-
vitamin D preparations, e.g. calcipotriol;
-
corticosteroids, e.g. betamethasone valerate;
-
coal tar;
-
dithranol, also known as anthralin;
-
salicylic acid;
-
urea;
-
topical retinoids;
-
topical immunosuppressants, e.g. methotrexate;
-
topical macrolactams, e.g. ascomycin derivatives, such as tacrolimus; and
-
combination products, e.g. corticosteroids with coal tar or corticosteroids with vitamin D.
We compared topical treatments with vehicle (placebo). We also compared vitamin D analogues with other topical treatments. We selected vitamin D analogues for this comparison because they are first‐line treatments in many developed countries (van de Kerkhof 1998). We based the potency of topical corticosteroids on classifications from a previous review (Mason 2002b).
The review included any topical treatment for psoriasis, except for products for which (a) no licence was obtained and (b) research into the product was discontinued. The reason for this exclusion criterion is that these products are unlikely to be of interest to people making decisions about health care, such as policy‐makers, people with psoriasis, or clinicians. Although they may be of interest to researchers, lessons from the research into 'failed' molecules are likely to have been reflected in the development of subsequent products.
Trials of systemic or ultraviolet (UV) (phototherapy) treatments with adjunctive topical treatment were not eligible for inclusion in the review.
Types of outcome measures
Table 2 provides an overview of the effectiveness outcome measures included in the review. We provide details of how we used the primary outcomes to derive a 'combined end point' in the section 'Measures of treatment effect'.
| Outcome | Acronym | Construct | Scale, minimum | Scale, maximum | Notes |
| * Investigator's Assessment of Overall Global Improvement | IAGI | Improvement from baseline variably defined. Common taxonomy ranges from worse to cleared | 4‐pt | 7‐pt | Calculated means and standard deviations by assigning zero to 'worse' (or equivalent). Higher scores indicate greater improvement |
| Investigator's Global Assessment of Disease Severity | IGA | Static equivalent of the IAGI | 4‐pt | 7‐pt | Calculated means and standard deviations by assigning zero to 'clear' (or equivalent). Higher scores indicate more severe disease |
| Total Severity Score | TSS | Redness (erythema), thickness (infiltration) and scaling (sometimes also itching (pruritis)) of target plaque(s). Scored separately then summed | 0 to 3 | 0 to 24 | Also known as the Local Psoriasis Severity Index or the Total Sum Score. Higher scores indicate more severe disease |
| Psoriasis Area and Severity Index | PASI | Redness, thickness, and scaliness of the lesions (each graded on a 0 to 4 scale), weighted by the area of involvement (0 to 6) and summed | 0 to 68 (without head) | 0 to 72 (including head) | Higher scores indicate more severe disease |
| * Patient's Assessment of Overall Global Improvement | PAGI | Assessed as IAGI | 4‐pt | 7‐pt | Less often reported than IAGI. Majority of included trials use 5‐pt scale |
| Patient's Global Assessment of Disease Severity | PGA | Assessed as IGA | 4‐pt | 5‐pt | Rarely reported (5/177 studies) |
| * IAGI/PAGI data are entered as a negative values; thus, a reduction denotes a positive improvement for the active treatment consistent with TSS and PASI measures. | |||||
Primary outcomes
-
Investigator's Assessment of Overall Global Improvement (IAGI)/Investigator's Global Assessment of Disease Severity (IGA).
-
Total Severity Scores (TSS).
-
Psoriasis Area and Severity Index (PASI).
-
Patient Assessment of overall Global Improvement (PAGI)/Patient Global Assessment of Disease Severity (PGA).
Secondary outcomes
-
Withdrawal rates (total rate; withdrawal due to adverse events; withdrawal due to treatment failure).
-
Adverse events (local and systemic).
-
Quality of life measures.
-
Economic outcomes.
-
Concordance or adherence with treatment.
Search methods for identification of studies
We aimed to identify all relevant randomised controlled trials (RCTs) regardless of language or publication status (published, unpublished, in press, or in progress).
Electronic searches
Search strategies used for the previous version of the review (Mason 2009; see also Acknowledgements) were revised where appropriate and rerun. We did not restrict the searches by body area affected. The information specialists updated the search strategies to reflect changes in the interfaces and MeSH (Medical Subject) headings, as well as to incorporate terms for newly licensed products.
In February 2011, the following databases were searched for effectiveness RCTs of psoriasis treatments:
-
the Cochrane Skin Group Specialised Skin Register (searched 8 February 2011) using the search strategy in Appendix 1;
-
the Cochrane Central Register of Controlled Trials (CENTRAL) in The Cochrane Library (2011, Issue 2) using the search strategy in Appendix 2;
-
MEDLINE via OVID (from 1948) using the strategy in Appendix 3;
-
EMBASE via OVID (from 1980) using the strategy in Appendix 4;
-
Science Citation Index (SCI) via the Institute for Scientific Information (ISI) Web of Knowledge interface (now known as Thomson Reuters) (from 2008) using the strategy in Appendix 5;
-
Conference Proceedings Citation Index ‐ Science (CPCI‐S) via the ISI web of Knowledge interface (from 2008) using the strategy in Appendix 5;
-
BIOSIS via the DialogClassic interface (from 1993) using the strategy in Appendix 6;
-
Dissertation Abstracts via DialogClassic interface (from inception) using the strategy in Appendix 7;
-
Inside Conferences via DialogClassic interface (from inception) using the strategy in Appendix 7;
-
System for Information on Grey Literature in Europe (SIGLE) via WebSPIRS interface (search not updated) using the strategy in Appendix 8;
-
National Research Register (NRR) (CD‐ROM interface, issue 2004/4) using the strategy in Appendix 2; and
-
the UK Clinical Research Network Study Portfolio (http://public.ukcrn.org.uk/search/) using the strategy in Appendix 2.
To comply with Cochrane policy (stipulating that reviews must be published within 12 months of the electronic searches being run), further searches for this update were run on 23, 24, and 29 August 2012. Although it was not possible to incorporate RCTs identified through this search within this review, we listed relevant references in the 'Characteristics of studies awaiting classification' tables. They will be incorporated into the next update of the review.
Searching other resources
References from published studies and reviews
We checked these for further references to relevant trials.
Unpublished literature
We routinely contacted trialists and companies for newly published studies and missing data.
The metaRegister of Controlled Trials (http://www.controlled‐trials.com/mrct/) was searched in August 2012 for ongoing and unpublished trials.
Adverse effects
On 2 February 2011, the following databases were searched for studies of adverse events of specific psoriasis treatments:
-
MEDLINE via OVID (see Appendix 9); and
-
EMBASE via OVID (see Appendix 10).
We limited searches to English‐language papers published in the years between 2005 to 2011. In MEDLINE, the search was designed to omit records with the following publication types: 'note', 'comment', and 'editorial'.
We also considered relevant adverse effects studies identified during the screening for effectiveness trials.
These searches were updated in August 2012, identifying 537 new references. We will incorporate these studies into the next update of this review.
Concordance/adherence
We did not undertake searches for concordance/adherence in the 2011 review update because of resource constraints.
Language restrictions
There were no language restrictions when searching for effectiveness RCTs or concordance/adherence studies. We restricted searches for studies of adverse events to those published in English.
Data collection and analysis
Selection of studies
Two authors (AM and JM) screened titles and (where available) abstracts identified from the searches, and another author (MC) acted as an arbiter when necessary. In our protocol, we stated our intention that we would exclude studies meeting only some of the inclusion criteria stated above. However, this was infeasible, because we would have needed to cite large numbers of studies (over 1000). Therefore, we listed as excluded only those studies that we deemed potentially eligible for inclusion and for which we retrieved full papers, but which subsequently failed to meet the inclusion criteria.
For the separate search for studies exploring adverse events, we deemed studies as eligible if they addressed safety or tolerability issues, focused on drugs included in the main review, and were longer‐term in follow‐up (> 12 weeks). Short‐term studies (with follow‐up < 12 weeks) were eligible for inclusion only if they were designed specifically to consider adverse effects, tolerability, or safety. Studies that included fewer than 10 participants (including case reports) were not eligible for inclusion.
For the separate search for studies of concordance/adherence with treatment, studies were eligible if they addressed adherence with topical treatment in people with any type of psoriasis. This section was not updated because of resource constraints.
Data extraction and management
Applying methods from our original review (Mason 2002a), we summarised the major attributes of trials, including treatment forms, doses and duration, inclusion and exclusion criteria, level of blinding, within‐patient or between‐patient (parallel‐group) design, method of generation of the randomisation sequence, concealment of allocation, numbers of participants randomised, baseline comparability, loss to follow up, primary and secondary outcomes, withdrawals, and adverse events. One reviewer (AM) extracted the data, and another reviewer (HH) checked these data.
We extracted data from trials on four primary outcomes:
-
IAGI (Investigator's Assessment of Global Improvement) or the IGA (Investigator's Global Assessment of Disease Severity).
-
TSS (Total Severity Score).
-
PASI (Psoriasis Area and Severity Index).
-
PAGI (Patient Assessment of Global Improvement) or the PGA (Patient Global Assessment of Disease Severity).
Where available, we also extracted data on quality of life, economic outcomes, and concordance/adherence.
In addition, we extracted data on withdrawal due to any reason, such as adverse events or treatment failure, as well as adverse events due to local and systemic effects.
For each outcome measure under a comparison, we included the same treatment options regardless of data availability (see Data and analyses). We did this for three reasons. Firstly, an inclusive approach makes clear that there is an absence of data, not that data have been omitted. Secondly, if data subsequently become available when the review is updated in future, the correct structure is in place for data entry. Thirdly, this approach ensures treatments are always ordered identically regardless of outcome.
Assessment of risk of bias in included studies
Assessment of methodological quality
The quality assessment included an evaluation of each included study, based on the following components, which are considered to be associated with biased estimates of treatment effect (Juni 2001):
(a) the method of generation of the randomisation sequence;
(b) the method of allocation concealment ‐ we considered this 'adequate' if the assignment could not be foreseen;
(c) who was blinded/not blinded (participants, clinicians, outcome assessors); and
(d) how many participants were lost to follow up.
In addition, the quality assessment included the following:
(e) baseline assessment of the participants for age, sex, duration, and severity of psoriasis; and
(f) baseline comparability of intervention and control groups.
We recorded the information in the 'Characteristics of included studies' section.
Measures of treatment effect
Summarising primary outcomes with standardised mean differences
We extracted data on four primary outcome measures:
-
IAGI (Investigator's Assessment of Global Improvement) or the IGA (Investigator's Global Assessment of Disease Severity)
-
TSS (Total Severity Score)
-
PASI (Psoriasis Area and Severity Index)
-
PAGI (Patient Assessment of Global Improvement) or the PGA (Patient Global Assessment of Disease Severity)
Trials often reported more than one measure, but none of the trials reported all measures. We therefore devised a 'combined end point', which allowed more data to contribute to an overall analysis and facilitated treatment comparisons. We labelled this 'super' outcome as outcome (e) throughout the review.
We constructed the combined end point by taking IAGI (or IGA) data when available, and failing this, TSS, PASI, or PAGI (PGA) data in that order of availability. For PASI and TSS, some included trials reported change scores and others reported end point scores. In view of the mix of end point/change scores and of the variation in scale, we analysed findings using a standardised mean difference statistic (SMD) in a random‐effects model. Table 2 summarises the characteristics of the outcome measures.
We also expressed SMDs in physical units adjusting by the appropriate pooled standard deviation estimate (Table 3).
| Type of study/score | Placebo IAGI (change)/IGA (end point) | Placebo TSS | Placebo PASI | Placebo PAGI (change)/PGA (end point) | H2H IAGI (change)/IGA (end point) | H2H TSS | H2H PASI | H2H PAGI (change)/PGA (end point) |
| Between‐patient (end point) | 0.93 | 1.33 | 3.76 | 1.13 | 1.01 | 1.65 | 3.61 | 1.12 |
| Within‐patient (end point) | 1.08 | 1.49 | 7.17 | NA | NA | 1.50 | 2.58 | NA |
| Between‐patient (change) | 1.17 | 1.52 | 5.75 | 1.31 | 1.10 | 1.73 | 7.85 | 1.20 |
| Within‐patient (change) | 1.02 | 1.58 | NA | 1.53 | 0.96 | 1.94 | NA | 0.83 |
| Within‐patient (% change) | NA | 0.18 | NA | NA | NA | NA | NA | NA |
| Between‐patient (% change) | NA | NA | 0.37 | NA | NA | 0.13 | 0.33 | NA |
| Scalp between‐patient (end point) | 1.08 | 1.74 | NA | 1.06 | 1.06 | 1.94 | NA | 1.18 |
| Scalp within‐patient (end point) | 1.33 | NA | NA | NA | NA | NA | NA | NA |
| Scalp between‐patient (change) | 1.20 | NA | NA | 1.28 | 1.30 | 1.75 | NA | 1.20 |
| Scalp between‐patient (% change) | NA | NA | NA | NA | NA | 0.25 | NA | NA |
| NA: not available; H2H: head‐to‐head; IGA [PGA]: Investigator [Patient] Global Assessment of Disease Severity; IAGI [PAGI]: Investigator (patient) Assessment of Global Improvement; TSS: Total Severity Score; PASI: Psoriasis Area and Severity Index | ||||||||
Secondary outcomes
We summarised data on adverse events, quality of life measures, economic outcomes, and concordance as narratives. We summarised withdrawal data using the risk difference (RD) metric and pooled using a random‐effects model. We felt this was more appropriate than a fixed‐effect model since definitions of withdrawal and adverse events vary between trials.
Unit of analysis issues
Within‐patient studies are statistically analogous to cross‐over studies, and results should be adjusted by the correlation coefficient (Section 16.4.6, Cochrane Handbook for Systematic Reviews of Interventions; Higgins 2011). No study included in the review reported this statistic, and we did not have access to patient‐level data, so could not estimate it directly.
On the subject of cross‐over studies, the Cochrane Handbook for Systematic Reviews of Interventions states (Section 16.4.5; Higgins 2011) the following: "A common situation is that means and standard deviations (or standard errors) are available only for measurements on E [experimental group] and C [control group] separately. A simple approach to incorporating cross‐over trials in a meta‐analysis is thus to take all measurements from intervention E periods and all measurements from intervention C periods and analyse these as if the trial were a parallel‐group trial of E versus C. This approach gives rise to a unit‐of‐analysis error (see Chapter 9, Section 9.3) and should be avoided unless it can be demonstrated that the results approximate those from a paired analysis, as described in Section 16.4.4. The reason for this is that confidence intervals are likely to be too wide, and the trial will receive too little weight, with the possible consequence of disguising clinically important heterogeneity. Nevertheless, this incorrect analysis is conservative, in that studies are under‐weighted rather than over‐weighted. While some argue against the inclusion of cross‐over trials in this way, the unit‐of‐analysis error might be regarded as less serious than some other types of unit‐of‐analysis error."
Consequently, we included within‐patient studies as though they were parallel‐group studies, accepting that they are under‐weighted. To explore whether it was appropriate to combine these trials, we undertook two sensitivity analyses. First, we considered how effect size varied for within‐ and between‐patient studies. If the magnitude of effect varied consistently between the two study designs, this strongly suggested a non‐zero correlation coefficient and an appropriateness to separate the trials. Second, we used sensitivity analysis to explore the impact on pooled findings of varying the correlation coefficient (rho) for within‐patient studies. This analysis used the generic inverse variance measure, with SMDs and their standard errors estimated from the formulae in the Cochrane Handbook for Systematic Reviews of Interventions (Section 16.4.6.4) (Higgins 2011). These estimated SMDs differ slightly from those that RevMan estimates for continuous outcomes, even when the correlation coefficient is zero (which is the assumption implicit in the latter model).
The analyses found no evidence that the magnitude of effect varied consistently. Within‐patient trials did not consistently demonstrate smaller or larger effects than between‐patient trials. Varying the value of rho had no significant effect on the findings: As rho increased, the effect size increased and the confidence intervals (usually) widened, but the magnitudes of changes were small and non‐significant at the 5% level.
In the interests of statistical purity, these trials could (a) be reported separately or (b) be removed altogether. The drawback of option (a) is that it makes an already complex review even more complex and less accessible; the disadvantage of option (b) is that it removes data that might be of interest to clinicians and people with psoriasis. On balance, we preferred to report relevant randomised data wherever possible to help inform pragmatic decision‐making.
Dealing with missing data
We routinely contacted trialists and companies for missing data.
Where studies did not report estimates of variance, we derived them from confidence intervals (CIs) or from P values where possible. Where we could not obtain estimates of variance, we imputed them deterministically by pooling the standard deviations of treatment cohorts fully reported in trials and adjusted for scale size.
We made separate imputations for each outcome measure (see Table 3):
-
for within‐patient studies;
-
for between‐patient (parallel‐group) studies;
-
for end point scores;
-
for change scores; and
-
for scalp trials.
Within‐patient designs are statistically analogous to cross‐over studies, and the precision of their findings within a meta‐analysis needs adjustment for within‐patient correlation. We attempted to explore this by sensitivity analysis.
Data synthesis
We analysed findings using a standardised mean difference statistic (SMD) in a random‐effects model. However, this model cannot perfectly address all the sources of design complexity that arise when summarising findings across studies. Three of the main sources of complexity are listed below. Other sources of complexity include variation in trial duration, disease severity, participant demographics, treatment application method, dosing frequency, drug potency and vehicle.
Study design (within‐ versus between‐patient)
Trials were either between‐patient or within‐patient designs. The former randomise participants into separate (parallel) groups; the latter randomise treatments to the left or right side of the same participant. Within‐ and between‐patient trials have different variance structures. Moreover, the two responses (left and right) of within‐patient studies may be correlated (See Unit of analysis issues for further details).
Absence of a simple one‐to‐one correspondence between papers, trials, and comparisons
There were instances of single papers reporting either multiple trials or multiple analyses within a single trial. Therefore, simple counts of numbers of participants and numbers of studies contributing data to the analysis were misleading, and we made adjustments accordingly (Table 4). Thus, these numbers may not match the numbers estimated in RevMan, which does not account for these factors.
| Comparison No. | Comparison Label | No. studies | Per cent studies with | No. |
| 01 | Vitamin D analogues vs. placebo | 30 | 60% | 4986 |
| 02 | Corticosteroid (potent) vs. placebo | 13 | 85% | 2216 |
| 03 | Corticosteroid (very potent) vs. placebo | 10 | 70% | 1264 |
| 04 | Dithranol vs. placebo | 3 | 0% | 47 |
| 05 | Vitamin D combination products vs. placebo | 5 | 100% | 2058 |
| 06 | Other treatment vs. placebo | 26 | 46% | 1450 |
| 07 | Vitamin D analogues vs. corticosteroid (potent) | 14 | 64% | 3542 |
| 08 | Vitamin D analogues vs. corticosteroid (very potent) | 2 | 100% | 82 |
| 09 | Vitamin D combined with corticosteroid vs. corticosteroid | 5 | 100% | 2113 |
| 10 | Vitamin D alone or in combination vs. dithranol | 8 | 88% | 1284 |
| 11 | Vitamin D alone or in combination vs. other vitamin D analogue | 4 | 75% | 513 |
| 12 | Vitamin D alone or in combination vs. vitamin D + corticosteroid | 17 | 94% | 5856 |
| 13 | Vitamin D alone or in combination vs. other treatments: complex regimens | 9 | 89% | 2936 |
| 14 | Vitamin D alone or in combination vs. other treatment: long‐term studies (> 24 wks) | 1 | 100% | 297 |
| 15 | Vitamin D analogues vs. other treatment | 19 | 68% | 2364 |
| 16 | Flexural/facial psoriasis: placebo‐controlled trials | 2 | 100% | 122 |
| 17 | Flexural/facial psoriasis: vitamin D alone or in combination vs. other treatment | 4 | 75% | 588 |
| 18 | Scalp psoriasis: placebo‐controlled trials | 14 | 93% | 3011 |
| 19 | Scalp psoriasis: vitamin D alone or in combination vs. other treatments | 12 | 100% | 5413 |
Body area targeted for treatment
Whereas the majority of trials investigated chronic plaque psoriasis on the body, some trials focused on scalp psoriasis; some reported findings for both scalp and body psoriasis; and some were of inverse (flexural) or facial psoriasis. One trial of body and scalp psoriasis reported overall outcomes (IAGI/PAGI), a scalp‐only outcome (TSS), and a body‐only outcome (modified PASI) (Van de Kerkhof 2002a). Ortonne 2010 reported findings separately for treatment of the body and treatment of the face. We previously used sensitivity analysis to investigate the scalp psoriasis trials (Mason 2009), but in this update we analysed trials of inverse psoriasis (comparisons 16 and 17) and scalp trials (comparisons 18 and 19) separately from the trials of body psoriasis (see Sensitivity analysis).
Subgroup analysis and investigation of heterogeneity
We examined findings by agent class (as our primary analysis) and individual topical agent (within‐class analysis).
When comparing trials both within and across therapeutic classes, the summary estimates may demonstrate substantial heterogeneity. Ideally, we would seek to identify the reasons for individual differences, but publications rarely report sufficient detail to make a robust investigation feasible. Reasons might include differences in trial design, length of follow‐up, disease severity, participant selection, adherence, adequacy of concealment of allocation, adequacy of blinding, and source of funding (Mason 2002a).
The Cochrane Handbook for Systematic Reviews of Interventions explicitly endorses the combination of 'apples and oranges' "if they are used to contribute to a wider question about fruit" (Section 9.5.1; Higgins 2011). Our purpose was to identify whether classes of topical treatments work and are safe. To this end, there is a fundamental difference between heterogeneity that makes it uncertain whether individual people with psoriasis will derive any benefit from a treatment and heterogeneity that makes the size of a positive benefit imprecise. Clinicians and those with psoriasis will still value information about a treatment that is beneficial even though its magnitude is poorly understood. However, we clearly stated the presence of heterogeneity where it occurred and used the Cochrane Handbook for Systematic Reviews of Interventions as a guide to interpretation (Section 8.5.2; Higgins 2011).
Sensitivity analysis
We used a meta‐analysis with a random‐effects estimation both for measures of effect and for pooling of risk differences for adverse events. We quantified heterogeneity using the I² statistic. If we identified outliers, we undertook a sensitivity analysis to investigate the implications of their exclusion on the pooled summary statistics. In addition, we undertook sensitivity analyses to investigate the impact of within‐patient versus between‐patient trials, and to explore the impact on pooled findings of varying the correlation coefficient (see Unit of analysis issues). In some comparisons, there were no, or relatively few, studies that included both within‐patient and between‐patient designs, few participants contributing data, or both. We used the following criteria to help decide whether we should have included an analysis in the sensitivity analysis:
-
frequently‐used products in clinical practice; and
-
for within‐/between‐patient sensitivity analysis: whether it included both within‐patient and between‐patient designs
Where at least two within‐patient trials were included in a pooled comparison, we explored the potential influence of the correlation coefficient.
Based on these criteria, we selected six comparisons (analyses 1, 2, 3, 4, 7, and 18) for sensitivity analysis. To ensure sufficient data were available, we analysed the combined end points. These analyses cover vitamin D analogues, dithranol, and corticosteroids, which are amongst the most frequently used products in clinical practice.
Other
We involved a consumer throughout the review process to help ensure the readability of the final review.
Results
Description of studies
Results of the search
For this update, the RCT searches identified 3749 records:
-
MEDLINE: 1312
-
EMBASE: 2008
-
SCI: 253
-
BIOSIS: 44
-
Dissertation Abstracts: 1
-
Inside Conferences: 0
-
CENTRAL: 70
-
UK Clinical Research Network: 20
-
Skin Group Specialised Register: 41
The total number of new records assessed after deduplication against each other and previously identified records was 2637.
We added records from the searches in February 2011 to those identified from searches run in 2008 (see Mason 2009). The total number of records screened for this review over time is now 5414.
From the 2011 searches, we retrieved 148 papers and screened these for eligibility. (Some papers were multiple reports of the same trial).
In 40 trials (some of which were consequently excluded), some or all outcome data were missing. We contacted trialists or sponsors to request missing data, receiving data for 25 of these trials. We excluded trials that reported no useable outcome data. We did not contact trialists or sponsors for missing adverse events or withdrawal data, although some sponsors provided this spontaneously.
We included 48 new randomised controlled trials in the updated review. Compared with the previous version of this review (Mason 2009), studies were larger (mean number of participants: 284 versus 164), had a longer treatment duration (10 weeks versus 6 weeks) and follow up (11 weeks versus 8 weeks), and were more likely to be parallel‐group in design (88% versus 63%). The new studies were also more likely to include an active control group (60% versus 43%) and patient‐reported outcomes (44% versus 24%), and there were relatively more scalp trials (21% versus 12%). The 48 trials provided evidence on 7 new active treatments.
Included studies
The updated review included 177 studies, with 34,808 participants.
The number of included studies counted by RevMan is 190, because we entered each study reporting a placebo and an active comparison into the 'Characteristics of included studies' table as two studies.
Of the included studies, 106 of these were placebo‐controlled; 84 compared treatments head‐to‐head, with 15 trials reporting both placebo‐controlled and head‐to‐head comparisons. The 15 trials reporting both head‐to‐head and placebo comparisons contributed only once to the analysis of study characteristics, unless the trial involved entirely distinct participants in its placebo‐controlled and active‐controlled analyses. For example, the trial by Guenther 2002 compared treatments against each other (Guenther 2002 (H)) and against placebo (Guenther 2002 (P)). This study contributed only once to the analysis of study characteristics (number of participants, proportion of males, etc). However, two trials reported placebo and head‐to‐head analyses involving entirely separate participants (Barker 1999 (H) and Barker 1999 (P); Grattan 1997 (H) and Grattan 1997 (P)). Therefore, the total number of studies contributing data to the analysis of study characteristics and quality assessment was 177 (106 placebo + 84 head‐to‐head ‐15 double‐counted trials (with placebo and active comparators) and 2 trials that each report 2 separate studies (Barker 1999 (H) and Barker 1999 (P); Grattan 1997 (H) and Grattan 1997 (P)).
There were 26 trials of scalp psoriasis (Barrett 2005; Buckley 2008; Cook‐Bolden 2010; Duweb 2000; Elie 1983; Ellis 1988; Franz 1999; Franz 2000; Green 1994; Jarratt 2004; Jemec 2008 (H) and Jemec 2008 (P); Kiss 1996; Klaber 1994; Klaber 2000b; Köse 1997; Kragballe 2009; Lepaw 1978; Luger 2008; Olsen 1991; Pauporte 2004; Poulin 2010; Reygagne 2005; Shuttleworth 1998; Tyring 2010; Van de Kerkhof 2002a; Van de Kerkhof 2009). Six trials investigated inverse psoriasis, facial psoriasis, or both (Gribetz 2004; Kreuter 2006 (H) and Kreuter 2006 (P); Lebwohl 2004; Liao 2007; Ortonne 2003; Ortonne 2010). One trial evaluated psoriasis in children (Oranje 1997). Most trials were conducted in ambulatory care settings, but four trials were of hospitalised participants (Grattan 1997 (H) and Grattan 1997 (P); Kragballe 1991a; Monastirli 2000; Van der Vleuten 1995).
One hundred and twenty‐three trials adopted a between‐patient (parallel‐group) design; 53 were within‐patient studies; and one trial used both designs (Henneicke‐v. Z. 1993). The trial by Levine (Levine 2010 (H) and Levine 2010 (P)) was a within‐patient trial that randomised participants to two of seven treatment options. Therefore, the pair‐wise comparisons we analysed (e.g. calcipotriol versus placebo) included a mixture of within‐ and between‐patient designs: Some participants received calcipotriol on one side and placebo on the other; other participants received calcipotriol on one side and another active treatment on the other side.
The 177 studies included 34,808 participants. Of these studies, 133 provided data on the age of participants. The mean age of all participants for which studies provided data was 47.2 years (range = 2 to 97 years) (N = 28,921). Data on the gender of participants (N = 28,941) were available from 140 studies. Overall, participants were more likely to be male; the mean proportion of males was 56.7% (range = 30% to 100%).
Almost half the studies (77/177 = 44%) did not clearly report the overall baseline severity of study participants (e.g. participants with mild to moderate disease) (Figure 3). One hundred studies explicitly reported baseline severity or reported sufficient information on global severity scores, such as the mean and variation in baseline PASI or the percentage of body surface area (BSA) affected, to allow us to infer global severity using guidance on the interpretation of severity scores (Finlay 2005; Krueger 2000). In the 100 trials where severity was assessable, we classified participant severity as mild (5 studies), mild to moderate (36 studies), mild to severe (6) or very severe (2 studies), moderate (12 studies), moderate to severe (27 studies), moderately severe (2 studies), moderately severe to very severe (2 studies), and severe (8 studies).

Risk of bias graph: review authors' judgements about each risk of bias item presented as percentages across all included studies.
Seventy‐seven studies provided insufficient information to allow an assessment of clinical severity to be made; we could not make assessments of the clinical characteristics of participants in studies reporting only the mean PASI (with no information about variation) or reporting only localised (e.g. TSS) scores. One example of a study that included participants with a wide range of severity scores is the trial by Cunliffe 1992, where the mean baseline PASI was 9.0 (suggesting moderately severe disease, according to Finlay 2005), but where individual participant scores ranged from 0.6 to 41.2. Another example is the study by Olsen 1996 (1), where participant BSA involvement averaged 12%, but ranged from 1% to 80%. It is unclear how participant severity was distributed within these ranges (i.e. whether these extremes were 'outliers' or whether a sizeable proportion of participants were clustered at the extreme ends of the distribution).
Even where trialists classified participant severity, it was not always clear that this was consistent with published guidance, which itself does not always provide consistent messages. For example, Finlay 2005 states that a PASI score > 10, a BSA involvement > 10%, or Dermatology Life Quality Index (DLQI) score > 10 constitutes severe disease. However, Krueger 2000 argues that BSA is unreliable as an indicator of severity, which is better proxied by quality of life assessments. However, the included studies rarely assessed quality of life. Given this lack of clarity and the absence of adequate severity data in around half (44%) of the included studies, we could not use sensitivity analysis to investigate the impact of baseline participant severity, nor could we reliably use severity to investigate inter‐study heterogeneity.
All 177 studies provided data on treatment duration (mean: 7 weeks; range = 1 to 52) and follow‐up duration (mean: 9 weeks; range = 2 to 52), where 'follow‐up duration' was defined as including the treatment period. Commonly used outcomes assessed by the studies included the following:
-
individual signs (erythema, scaling, induration) (105/177 studies = 59%);
-
Total Severity Score, Total Sign Score, or equivalent (83 studies = 47%);
-
PASI (65 studies = 37%);
-
IAGI/IGA (113 studies = 64%); and
-
PAGI/PGA (52 studies = 29%).
Outcome measures employed by small numbers (< 5) of trials included the following;
-
Local Psoriasis Severity Index (scale not reported);
-
Jacoby assessment score (0 to 7 score transformed to % clinical improvement); and
-
investigator assessment of skin staining.
Trials seldom assessed quality of life (9 trials = 5%).
Participant‐reported outcomes included the following:
-
overall participant assessment (relative efficacy, speed of response, irritation, staining, ease of application);
-
participant global assessment of acceptability of treatment, participant assessment of likely adherence; and
-
participant assessment of cosmetic acceptability.
We grouped placebo‐controlled trials by type of treatment (e.g. vitamin D products) and grouped head‐to‐head trials in a similar way (e.g. vitamin D versus potent corticosteroid). We included 19 comparisons in the review. Since many trials did not specify participants' disease severity, it was not possible to use severity to inform pooling decisions. The primary analysis explored the results of pooling within these 19 comparison groups using a random‐effects model. In addition, we undertook sensitivity analyses for five comparisons using the 'combined end point'. These analyses used pooled data to explore within‐ and between‐patient trial variation.
In 90% (159/177) of the studies included in the review, participants applied their own treatments. Nurses applied treatments in 1 trial (Geilen 2000); participants' parents delivered some care in a trial of childhood psoriasis (Oranje 1997); and the delivery method was unclear in 16 studies.
Excluded studies
We excluded 43 studies, of which we had newly added 16 studies in this update of the review (see 'Characteristics of excluded studies' tables). The most common reasons for exclusion from the update were that the study did not report adequate data and requests for missing data from trialists or sponsors were unsuccessful (N = 5), or that the study did not provide a comparison of interest (N = 6). Two studies were not randomised (Kaur 2004; Vena 2005); one study assessed multiple plaques (Buder 2010); and two evaluated unlicensed products that were not subsequently marketed (Agrawal 2010; Rhemus 2006). We also excluded trials of nail psoriasis that we had previously included (Mason 2009), as the topic is now covered by a separate Cochrane review (de Vries 2013).
Studies awaiting classification
Update searches were run on 23, 24, and 29 August 2012. For each database searched, we have shown below the numbers of records identified. The total number of new records assessed (after deduplication against each other and previously identified records) was 1865. Relevant studies from these searches (10 references) are listed in the Studies awaiting classification section, but we did not include them in the main review.
-
MEDLINE: 1203
-
EMBASE: 1140
-
SCI: 129
-
BIOSIS: 37
-
Dissertation Abstracts: 1
-
Inside Conferences: 0
-
CENTRAL: 26
-
UK Clinical Research Network: 0
-
Skin Group Specialised Register: 67
Ongoing studies
The metaRegister of Controlled Trials was searched for ongoing and unpublished trials during the final searches for this review in August 2012 http://www.controlled‐trials.com/mrct/ using the following phrases:
-
"psor* AND topical NOT completed", which retrieved 127 hits;
-
"psor* AND calcipot% NOT completed", which retrieved 7 hits;
-
"psor* AND vitamin D NOT completed", which retrieved 21 hits;
-
"(psor* AND topical AND corticost%) NOT completed", which retrieved 63 hits; and
-
"psor* AND tar NOT completed", which retrieved 8 hits.
In total, we identified 10 potentially relevant trials. We provide details in the 'Characteristics of ongoing studies' tables.
Risk of bias in included studies
We extracted and tabulated data on six quality indicators. Summary findings are presented narratively, with characteristics for all studies presented in the 'Characteristics of included studies' tables. Figure 3 is a graphical representation of the overview of the risk of bias. All included trials were randomised, but only 47/177 (27%) clearly reported the method used to randomise participants. Concealment of treatment allocation was explicitly adequate in 15 trials, but most trials (151/177 = 85%) blinded participants to treatment allocation. Most (164/77 = 93%) trials reported loss to follow up data, and 142 trials (80%) demonstrated that groups were comparable at baseline.
Allocation
Of the 177 studies assessed for quality, 15 (8.5%) explicitly achieved adequate concealment of treatment allocation (low risk of bias). Concealment was unclear in the majority of studies (160 studies = 90.4%), so the risk of bias was also unclear. Concealment was inadequate in 2 studies (1.1%) (high risk of bias) (Figure 3).
Blinding
Most (131/177 = 74%) studies were double‐blind, with 20 studies adopting a single‐blind (investigator‐only) approach. Eighteen studies were 'open' (no blinding), and in the remaining 8 studies, the blinding approach adopted was unclear (Figure 3). Twenty trials explicitly stated that the outcome assessor was blinded to treatment allocation. However, the outcome assessor will also have been blinded in double‐blind trials where the investigator also assessed outcomes.
Incomplete outcome data
We defined 'loss to follow up' as the number of enrolled participants who failed to contribute data for the analysis.
Of the 177 studies assessed for quality, 13 (7%) provided no data on loss to follow up. For the remaining 164 studies, the mean percentage loss to follow up was 6.1% (range = 0% to 31.5%). Fifty‐one studies reported that there was no loss to follow up. Four studies lost more than 25% of their participants to follow‐up, and we classified them as having high risk of bias for this dimension (Henneicke‐v. Z. 1993; Lin 2007; Maier 2004; Weinstein 2003) (see Figure 3).
Where studies did not report estimates of variance, we derived them from confidence intervals (CIs) or from P values where possible. Where we could not obtain estimates of variance, we imputed them (see Table 3). In total, we imputed estimates of variance for at least 1 outcome measure in 45 studies (7 of which were scalp trials); details are in the notes section of the 'Characteristics of included studies' tables.
Other potential sources of bias
Method of generation of the randomisation sequence
Only randomised controlled trials were eligible for inclusion in the review. However, 130 studies (73%) did not clearly report the randomisation method used. Fourteen studies reported a block randomisation design, and 27 studies used computerised methods (5 studies used both). Four reported that sequential allocation had been used (3 of these studies were published in the 1970s); 1 study used the toss of a coin; and another study used a sealed envelope method. It could be argued that we should have excluded trials with sequential allocation from the review, but this might discriminate against studies with better reporting methods in favour of those not stating the randomisation method.
Baseline assessment of the participants for age, gender, and clinical characteristics
We coded studies as follows: y (baseline assessments for age, gender, and clinical characteristics), p (at least one type of assessment), and NR (not reported or unclear). Most studies (121/177 = 68.4%) provided baseline assessments of age, gender, and clinical characteristics. Forty‐three studies (24.3%) provided a partial assessment, and 13 studies (7.3%) reported no relevant data.
Baseline comparability of intervention and control groups
We coded studies as follows: y (comparability demonstrated, low risk of bias), p (comparability partially demonstrated, risk of bias unclear), and NR (comparability not demonstrated or unclear, risk of bias unclear or high, depending on whether groups were clearly non‐comparable). Studies could demonstrate comparability by reporting data for each group, by reporting the outcome of statistical tests (e.g. P values), or both. One hundred and sixteen studies (65.5%) demonstrated that the groups were comparable at baseline; 27 studies (15.3%) demonstrated partial comparability; and 34 studies (19.2%) did not clearly demonstrate comparability between the groups. No study found that groups were non‐comparable (high risk of bias).
Data extraction method for the review
To minimise errors and reduce potential biases being introduced by review authors, the recommended approach is that data extraction should be undertaken independently by at least two people, preferably from complementary disciplines (Section 7.6.2, Higgins 2011). However, in this review, one reviewer (AM) extracted the data, and another reviewer (HH) checked these data.
Effects of interventions
Primary outcome measures
The review analyses 19 comparisons. Of these, 8 are topical treatment versus placebo analyses, and 11 are head‐to‐head analyses of a topical treatment against a vitamin D analogue (i.e. 1 commonly used class of treatments). Some analyses are a 'catch all' category; for example, analysis 6 includes 'Other treatment versus placebo', which covers 26 treatments for body psoriasis for which there is less research evidence (both in terms of numbers of studies and numbers of participants contributing data). Similarly, analysis 15 incorporates 12 head‐to‐head comparisons of vitamin D analogues for body psoriasis that are not easily classified under the other head‐to‐head comparisons. Scalp trials (comparisons 18 and 19) and trials of inverse psoriasis (comparisons 16 and 17) are analysed separately from the trials of body psoriasis.
Table 4 summarises the 19 analyses. Table 2 gives details of the outcome measures considered. The number of participants and number of studies are adjusted manually from those reported in the Tables and Figures to allow for within‐patient studies, studies contributing more than once to a single analysis, and studies contributing to multiple analyses. Therefore, numbers of participants and studies reported sometimes differ from the numbers estimated by RevMan.
For each of the 19 analyses, we analysed data on 5 effectiveness outcome measures, where available. The fifth measure is a 'combined end point' that uses data from the four primary outcome measures.
(a) Investigator's Assessment of Overall Global Improvement (IAGI)/Investigator's Global Assessment of Disease Severity (IGA)
Analysis 1: Vitamin D analogues versus placebo
This comparison included eight vitamin D analogues for body psoriasis (see Analysis 1.1 and Table 5). Twenty trials with 3771 participants reported IAGI data on 7 of these treatments. Thirteen trials were between‐patient design, and 7 were within‐patient studies. Treatment duration ranged from 4 weeks to 12 weeks. The pooled SMD across all treatments was ‐0.95 (95% CI ‐1.17 to ‐0.74; I² statistic = 89.0%), but there was considerable variation between treatments, so we removed pooling across subgroups. Six treatments were significantly more effective than placebo, with the effect size ranging from ‐0.67 (becocalcidiol twice daily) to ‐1.66 (paricalcitol once daily). There was considerable between‐study variation in the IAGI SMD for calcitriol. The pooled effect was ‐1.03 (95% CI ‐1.71 to ‐0.36), but this ranged from ‐0.26 (95% CI ‐0.99 to 0.47) for Langner 2001 (P) to ‐3.11 (95% CI ‐3.57 to ‐2.66) for Perez 1996. The magnitude of the IAGI SMD for the Perez study was the highest across all comparisons and treatments. For the 'combined end point' of this analysis, we explored the impact of removing this trial from the pooled findings using sensitivity analysis. The presence of considerable heterogeneity within this subgroup means that the estimated average benefit should be interpreted with caution (Higgins 2011).
| Subcategory | Measure | 01 IAGI/IGA | 02 TSS | 03 PASI | 04 PAGI/PGA | 05 Combined end point |
| 01 Calcipotriol OD/BD | Effect size [CI] | (SMD ‐0.93; 95% CI ‐1.17 to ‐0.68) | (SMD ‐1.15; 95% CI ‐1.41 to ‐0.89) | (SMD ‐0.65; 95% CI ‐0.75 to ‐0.55) | (SMD ‐0.64; 95% CI ‐0.97 to ‐0.30) | (SMD ‐0.96; 95% CI ‐1.15 to ‐0.77) |
| 02 Calcipotriol plus occlusion | Effect size [CI] | NA | (SMD ‐0.15; 95% CI ‐0.44 to 0.14) | ‐ | ‐ | (SMD ‐0.15; 95% CI ‐0.44 to 0.14) |
| 03 Calcitriol OD/BD | Effect size [CI] | (SMD ‐1.03; 95% CI ‐1.71 to ‐0.36) | (SMD ‐1.22; 95% CI ‐2.38 to ‐0.07) | ‐ | (SMD ‐0.59; 95% CI ‐0.76 to ‐0.41) | (SMD ‐0.92; 95% CI ‐1.54 to ‐0.29) |
| 04 Tacalcitol OD | Effect size [CI] | (SMD ‐0.84; 95% CI ‐1.41 to ‐0.26) | (SMD ‐0.66; 95% CI ‐0.95 to ‐0.36) | (SMD ‐0.27; 95% CI ‐0.56 to 0.03) | (SMD ‐0.24; 95% CI ‐0.53 to 0.05) | (SMD ‐0.73; 95% CI ‐1.09 to ‐0.37) |
| 05 Maxacalcitol OD | Effect size [CI] | (SMD ‐1.43; 95% CI ‐1.91 to ‐0.96) | (SMD ‐1.61; 95% CI ‐2.10 to ‐1.12) | ‐ | ‐ | (SMD ‐1.43; 95% CI ‐1.91 to ‐0.96) |
| 06 Paricalcitol OD | Effect size [CI] | (SMD ‐1.66; 95% CI ‐2.66 to ‐0.67) | (SMD ‐2.15; 95% CI ‐3.24 to ‐1.06) | ‐ | ‐ | (SMD ‐1.66; 95% CI ‐2.66 to ‐0.67) |
| 07 Becocalcidiol OD | Effect size [CI] | (SMD ‐0.22; 95% CI ‐0.58 to 0.14) | (SMD ‐0.02; 95% CI ‐0.37 to 0.34) | ‐ | ‐ | (SMD ‐0.22; 95% CI ‐0.58 to 0.14) |
| 08 Becocalcidiol BD | Effect size [CI] | (SMD ‐0.67; 95% CI ‐1.04 to ‐0.30) | (SMD ‐0.46; 95% CI ‐0.83 to ‐0.10) | ‐ | ‐ | (SMD ‐0.67; 95% CI ‐1.04 to ‐0.30) |
| All treatments | Effect size [CI]; I² statistic | (SMD ‐0.95; 95% CI ‐1.17 to ‐0.74): I² statistic: 89.0% | (SMD ‐1.04; 95% CI ‐1.33 to ‐0.74) I² statistic: 93.0% | (SMD ‐0.58; 95% CI ‐0.71 to ‐0.45): I² statistic: 42.3% | (SMD ‐0.54; 95% CI ‐0.72 to ‐0.36): I² statistic: 55.5% | (SMD ‐0.90; 95% CI ‐1.07 to ‐0.72); I² statistic: 87.5% |
| ‐ | No. participants | 3771 | 2647 | 2357 | 1467 | 4986 |
| ‐ | Between‐patient design | 13 | 9 | 8 | 5 | 18 |
| ‐ | Within‐patient design | 7 | 10 | 1 | 0 | 12 |
| ‐ | Treatment duration | 4 wks to 12 wks | 4 wks to 12 wks | 3 wks to 8 wks | 8 wks to 8 wks | 3 wks to 12 wks |
| Sensitivity analyses | Within‐patient trials | ‐ | ‐ | ‐ | ‐ | (SMD ‐1.11; 95% CI ‐1.58 to ‐0.64) |
| ‐ | Between‐patient trials | ‐ | ‐ | ‐ | ‐ | (SMD ‐0.80; 95% CI ‐0.96 to ‐0.63) |
| ‐ | Calcitriol, Perez 1996 removed | ‐ | ‐ | ‐ | (SMD ‐0.60; 95% CI ‐0.78 to ‐0.41) | |
| ‐ | Calcipotriol BD | ‐ | ‐ | ‐ | ‐ | (SMD ‐1.02; 95% CI ‐1.23 to ‐0.82) |
| ‐ | Calcipotriol OD | ‐ | ‐ | ‐ | ‐ | (SMD ‐0.76; 95% CI ‐1.13 to ‐0.40) |
| ‐ | correlation coefficient (rho) = 0 All trials | ‐ | ‐ | ‐ | ‐ | (SMD ‐0.85; 95% CI ‐1.00 to ‐0.71); |
| ‐ | rho = 0 Btw‐patient trials rho = 0.25 Within‐patient trials | ‐ | ‐ | ‐ | ‐ | (SMD ‐0.87; 95% CI ‐1.01 to ‐0.72); |
| ‐ | rho = 0 Btw‐patient trials rho = 0.50 Within‐patient trials | ‐ | ‐ | ‐ | ‐ | (SMD ‐0.88; 95% CI ‐1.03 to ‐0.73); |
| ‐ | rho = 0 Btw‐patient trials rho = 0.75 Within‐patient trials | ‐ | ‐ | ‐ | ‐ | (SMD ‐0.91; 95% CI ‐1.07 to ‐0.75); |
For acronyms, see Table 1.
Analysis 2: Corticosteroid (potent) versus placebo
This comparison included 10 potent corticosteroids for body psoriasis (see Analysis 2.1 and Table 6), although no effectiveness data were available for budesonide. Nine studies with 1867 participants reported IAGI data on 6 of these 10 treatments. Eight trials were between‐patient design, and one was a within‐patient study (Stein 2001). Treatment duration ranged from 3 to 12 weeks. The SMD across all 6 treatments for IAGI was ‐1.00 (95% CI ‐1.18 to ‐0.82; I² statistic = 57.6%). All six treatments performed statistically significantly better than placebo.
| Subcategory | Measure | 01 IAGI/IGA | 02 TSS | 03 PASI | 04 PAGI/PGA | 05 Combined end point |
| 01 Betamethasone dipropionate OD | Effect size [CI] | (SMD ‐0.81; 95% CI ‐0.98 to ‐0.64) | (SMD ‐0.74; 95% CI ‐1.16 to ‐0.32) | (SMD ‐0.79; 95% CI ‐1.44 to ‐0.14) | ‐ | (SMD ‐0.80; 95% CI ‐0.96 to ‐0.64) |
| 02 Betamethasone dipropionate BD | Effect size [CI] | (SMD ‐1.35; 95% CI ‐1.56 to ‐1.15) | (SMD ‐0.77; 95% CI ‐1.48 to ‐0.06) | (SMD ‐1.21; 95% CI ‐1.44 to ‐0.97) | ‐ | (SMD ‐1.35; 95% CI ‐1.56 to ‐1.15) |
| 03 Betamethasone dipropionate, maintenance | Effect size [CI] | (SMD ‐0.95; 95% CI ‐1.62 to ‐0.27) | ‐ | ‐ | (SMD ‐0.95; 95% CI ‐1.62 to ‐0.27) | |
| 04 Betamethasone valerate | Effect size [CI] | (SMD ‐1.41; 95% CI ‐1.92 to ‐0.90) | (SMD ‐1.09; 95% CI ‐2.00 to ‐0.18) | ‐ | ‐ | (SMD ‐1.33; 95% CI ‐1.78 to ‐0.89) |
| 05 Budesonide | Effect size [CI] | ‐ | ‐ | ‐ | ‐ | ‐ |
| 06 Desonide | Effect size [CI] | (SMD ‐0.81; 95% CI ‐1.34 to ‐0.28) | (SMD ‐1.16; 95% CI ‐1.70 to ‐0.61) | ‐ | ‐ | (SMD ‐0.81; 95% CI ‐1.34 to ‐0.28) |
| 07 Diflorasone diacetate | Effect size [CI] | ‐ | (SMD ‐0.32; 95% CI ‐0.73 to 0.09) | ‐ | ‐ | (SMD ‐0.32; 95% CI ‐0.73 to 0.09) |
| 08 Fluticasone propionate | Effect size [CI] | (SMD ‐0.93; 95% CI ‐1.14 to ‐0.72) | ‐ | ‐ | ‐ | (SMD ‐0.93; 95% CI ‐1.14 to ‐0.72) |
| 09 Hydrocortisone buteprate | Effect size [CI] | ‐ | (SMD ‐0.46; 95% CI ‐0.77 to ‐0.15) | ‐ | ‐ | (SMD ‐0.46; 95% CI ‐0.77 to ‐0.15) |
| 10 Mometasone furoate | Effect size [CI] | (SMD ‐0.75; 95% CI ‐1.17 to ‐0.34) | (SMD ‐1.12; 95% CI ‐1.55 to ‐0.68) | ‐ | ‐ | (SMD ‐0.75; 95% CI ‐1.17 to ‐0.34) |
| All treatments | Effect size [CI]; I² statistic | (SMD ‐1.00; 95% CI ‐1.18 to ‐0.82); I² statistic: 57.6% | (SMD ‐0.77; 95% CI ‐1.01 to ‐0.52); I² statistic: 46.7% | (SMD ‐0.97; 95% CI ‐1.31 to ‐0.62); I² statistic: 79.6% | ‐ | (SMD ‐0.89; 95% CI ‐1.06 to ‐0.72); I² statistic: 65.1% |
| ‐ | No. participants | 1867 | 553 | 1158 | 0 | 2216 |
| ‐ | Between‐patient design | 8 | 6 | 3 | 0 | 11 |
| ‐ | Within‐patient design | 1 | 1 | 0 | 0 | 2 |
| ‐ | Treatment duration | 3 wks to 12 wks | 2 wks to 12 wks | 4 wks to 8 wks | ‐ | 2 wks to 12 wks |
| Sensitivity analyses | Within‐patient trials | ‐ | ‐ | ‐ | ‐ | (SMD ‐1.33; 95% CI ‐1.78 to ‐0.89) |
| ‐ | Between‐patient trials | ‐ | ‐ | ‐ | ‐ | (SMD ‐0.85; 95% CI ‐1.03 to ‐0.67) |
| ‐ | correlation coefficient (rho) = 0 All trials | ‐ | ‐ | ‐ | ‐ | (SMD ‐0.89; 95% CI ‐1.06 to ‐0.72) I² statistic: 77.7% |
| ‐ | rho = 0 Btw‐patient trials rho = 0.25 Within‐patient trials | ‐ | ‐ | ‐ | ‐ | (SMD ‐0.89; 95% CI ‐1.06 to ‐0.72) I² statistic: 78.0% |
| ‐ | rho = 0 Btw‐patient trials rho = 0.50 Within‐patient trials | ‐ | ‐ | ‐ | ‐ | (SMD ‐0.90; 95% CI ‐1.07 to ‐0.73) I² statistic: 78.6% |
| ‐ | rho = 0 Btw‐patient trials rho = 0.75 Within‐patient trials | ‐ | ‐ | ‐ | ‐ | (SMD ‐0.91; 95% CI ‐1.08 to ‐0.74) I² statistic: 80.2% |
For acronyms, see Table 1. Both within‐patient trials compared betamethasone valerate with placebo.
Analysis 3: Corticosteroid (very potent) versus placebo
This comparison included three very potent corticosteroids for treatment of psoriasis of the body (see Analysis 3.1 and Table 7). Five studies with 515 participants reported IAGI data on 2 of the 3 treatments. There were four between‐patient trials and 1 within‐patient study (Beutner 2006). Treatment duration ranged from two to four weeks. The IAGI SMD across both treatments was ‐1.87 (95% CI ‐2.38 to ‐1.36; I² statistic = 78.7%). Both clobetasol propionate and halobetasol performed statistically significantly better than placebo. In Analysis 18.1, we present placebo‐controlled scalp trials of very potent corticosteroids.
| Subcategory | Measure | 01 IAGI/IGA | 02 TSS | 03 PASI | 04 PAGI/PGA | 05 Combined end point |
| 01 Clobetasol propionate | Effect size [CI] | (SMD ‐1.89; 95% CI ‐2.53 to ‐1.24) | (SMD ‐1.35; 95% CI ‐1.80 to ‐0.89) | ‐ | (SMD ‐1.01; 95% CI ‐1.55 to ‐0.47) | (SMD ‐1.65; 95% CI ‐2.10 to ‐1.20) |
| 02 Halcinonide | Effect size [CI] | ‐ | ‐ | ‐ | ‐ | ‐ |
| 03 Halobetasol | Effect size [CI] | (SMD ‐1.81; 95% CI ‐2.37 to ‐1.24) | ‐ | ‐ | (SMD ‐1.25; 95% CI ‐1.46 to ‐1.04) | (SMD ‐1.36; 95% CI ‐1.65 to ‐1.07) |
| All treatments | Effect size [CI], N, I² | (SMD ‐1.87; 95% CI ‐2.38 to ‐1.36); I² statistic: 78.7% | (SMD ‐1.35; 95% CI ‐1.80 to ‐0.89); I² statistic: 75.3% | ‐ | (SMD ‐1.22; 95% CI ‐1.42 to ‐1.02); I² statistic: 0% | (SMD ‐1.56; 95% CI ‐1.87 to ‐1.26); I² statistic: 81.7% |
| ‐ | No. participants | 515 | 545 | 0 | 283 | 1264 |
| ‐ | Between‐patient design | 4 | 3 | 0 | 1 | 7 |
| ‐ | Within‐patient design | 1 | 0 | 0 | 2 | 3 |
| ‐ | Treatment duration | 2 wks to 4 wks | 2 wks to 4 wks | 2 wks to 2 wks | 2 wks to 4 wks | |
| Sensitivity analyses | Within‐patient trials | ‐ | ‐ | ‐ | ‐ | (SMD ‐1.52; 95% CI ‐2.02 to ‐1.02) |
| ‐ | Between‐patient trials | ‐ | ‐ | ‐ | ‐ | (SMD ‐1.58; 95% CI ‐1.99 to ‐1.17) |
| ‐ | correlation coefficient (rho) = 0 All trials | ‐ | ‐ | ‐ | ‐ | (SMD ‐1.52; 95% CI ‐1.80 to ‐1.24) I² statistic: 81.6% |
| ‐ | rho = 0 Btw‐patient trials rho = 0.25 Within‐patient trials | ‐ | ‐ | ‐ | ‐ | (SMD ‐1.52; 95% CI ‐1.80 to ‐1.25) I² statistic: 82.2% |
| ‐ | rho = 0 Btw‐patient trials rho = 0.50 Within‐patient trials | ‐ | ‐ | ‐ | ‐ | (SMD ‐1.53; 95% CI ‐1.80 to ‐1.26) I² statistic: 83.3% |
| ‐ | rho = 0 Btw‐patient trials rho = 0.75 Within‐patient trials | ‐ | ‐ | ‐ | ‐ | (SMD ‐1.55; 95% CI ‐1.80 to ‐1.29) I² statistic: 85.9% |
For acronyms, see Table 1.
Analysis 4: Dithranol versus placebo
Our review did not identify any study comparing dithranol against placebo and which reported IAGI data.
Analysis 5: Vitamin D combination products versus placebo
This comparison included treatment with combined calcipotriol and betamethasone dipropionate used either once or twice daily on the body (see Analysis 5.1 and Table 8). Five parallel‐group studies with 2058 participants contributed data on both dosing options. Treatment duration ranged from four to eight weeks. The IAGI SMD across treatments was ‐1.44 (95% CI ‐1.76 to ‐1.12; I² statistic = 89.4%), with twice‐daily combination treatment (SMD ‐1.90; 95% CI ‐2.09 to ‐1.71) achieving a significantly larger effect than once‐daily treatment (SMD ‐1.21; 95% CI ‐1.50 to ‐0.91). However, the difference between once‐ and twice‐daily dosing was not statistically significant when benefit was assessed using the PASI (see Analysis 5.3). In Analysis 18.1, we report placebo‐controlled trials of combination vitamin D/steroid treatments for scalp psoriasis.
| Subcategory | Measure | 01 IAGI/IGA | 02 TSS | 03 PASI | 04 PAGI/PGA | 05 Combined end point |
| 01 Combination calcipotriol/betamethasone dipropionate, OD | Effect size [CI] | (SMD ‐1.21; 95% CI ‐1.50 to ‐0.91) | ‐ | (SMD ‐1.14; 95% CI ‐1.57 to ‐0.70) | (SMD ‐0.69; 95% CI ‐0.98 to ‐0.40) | (SMD ‐1.21; 95% CI ‐1.50 to ‐0.91) |
| 02 Combination calcipotriol/betamethasone dipropionate, BD | Effect size [CI] | (SMD ‐1.90; 95% CI ‐2.09 to ‐1.71) | ‐ | (SMD ‐1.41; 95% CI ‐1.86 to ‐0.97) | ‐ | (SMD ‐1.90; 95% CI ‐2.09 to ‐1.71) |
| All treatments | Effect size [CI], N, I² statistic | (SMD ‐1.44; 95% CI ‐1.76 to ‐1.12); I² statistic: 89.4% | ‐ | (SMD ‐1.24; 95% CI ‐1.53 to ‐0.95); I² statistic: 87.6% | (SMD ‐0.69; 95% CI ‐0.98 to ‐0.40); I² statistic: NA | (SMD ‐1.44; 95% CI ‐1.76 to ‐1.12); I² statistic: 89.4% |
| ‐ | No. participants | 2058 | 0 | 2056 | 235 | 2058 |
| ‐ | Between‐patient design | 5 | 0 | 5 | 1 | 5 |
| ‐ | Within‐patient design | 0 | 0 | 0 | 0 | 0 |
| ‐ | Treatment duration | 4 wks to 8 wks | ‐ | 4 wks to 8 wks | 8 wks | 4 wks to 8 wks |
For acronyms, see Table 1.
Analysis 6: Other treatment versus placebo
This comparison comprised all other treatments for psoriasis of the body not included in the first five analyses; therefore, we removed pooling. None of the studies assessed the same treatment, which means that findings should be interpreted with caution.
In total, we included 26 treatments in this analysis (see Analysis 6.1 and Table 9). Eight studies with 364 participants reported IAGI data on 8 of these 26 treatments. Four trials were between‐patient design, and four were within‐patient studies. Treatment duration ranged from 3 to 12 weeks.
| Subcategory | Measure | 01 IAGI/IGA | 02 TSS | 03 PASI | 04 PAGI/PGA | 05 Combined end point |
| 01 Aloe vera extract | Effect size [CI] | ‐ | ‐ | (SMD ‐1.58; 95% CI ‐2.16 to ‐0.99) | ‐ | (SMD ‐1.58; 95% CI ‐2.16 to ‐0.99) |
| 02 Anti‐IL‐8 monoclonal antibody cream | Effect size [CI] | (SMD ‐0.59; 95% CI ‐1.01 to ‐0.16) | (SMD ‐0.70; 95% CI ‐1.13 to ‐0.27) | ‐ | ‐ | (SMD ‐0.59; 95% CI ‐1.01 to ‐0.16) |
| 03 Betamethasone 17‐valerate 21‐acetate plus tretinoine plus salicylic acid | Effect size [CI] | (SMD ‐0.76; 95% CI ‐1.21 to ‐0.31) | ‐ | (SMD ‐0.54; 95% CI ‐0.99 to ‐0.10) | (SMD ‐0.80; 95% CI ‐1.26 to ‐0.35) | (SMD ‐0.76; 95% CI ‐1.21 to ‐0.31) |
| 04 Caffeine (topical) 10%, TD | Effect size [CI] | ‐ | ‐ | (SMD ‐0.39; 95% CI ‐0.84 to 0.06) | ‐ | (SMD ‐0.39; 95% CI ‐0.84 to 0.06) |
| 05 Calcipotriene 0.005% ointment + nicotinamide 0.05% or 0.1% or 0.7% or 1.4%, BD | Effect size [CI] | ‐ | (SMD ‐0.48; 95% CI ‐0.81 to ‐0.15) | ‐ | ‐ | (SMD ‐0.48; 95% CI ‐0.81 to ‐0.15) |
| 06 Dead sea salts emollient lotion | Effect size [CI] | ‐ | ‐ | (SMD 0.57; 95% CI ‐0.36 to 1.51) | ‐ | (SMD 0.57; 95% CI ‐0.36 to 1.51) |
| 07 Fish oil plus occlusion | Effect size [CI] | ‐ | (SMD ‐1.05; 95% CI ‐1.64 to ‐0.46) | ‐ | ‐ | (SMD ‐1.05; 95% CI ‐1.64 to ‐0.46) |
| 08 Herbal skin care (Dr Michaels® cleansing gel, ointment and skin conditioner), BD | Effect size [CI] | (SMD ‐2.96; 95% CI ‐4.19 to ‐1.74) | ‐ | (SMD ‐2.96; 95% CI ‐4.19 to ‐1.74) | ||
| 09 Hexafluoro‐1,25‐dihydroxyvitamin D3 | Effect size [CI] | (SMD ‐0.62; 95% CI ‐1.35 to 0.12) | (SMD ‐1.13; 95% CI ‐1.91 to ‐0.35) | ‐ | ‐ | (SMD ‐0.62; 95% CI ‐1.35 to 0.12) |
| 10 Indigo naturalis 1.4% ointment | Effect size [CI] | (SMD ‐2.14; 95% CI ‐2.74 to ‐1.53) | (SMD ‐1.64; 95% CI ‐2.13 to ‐1.15) | ‐ | ‐ | (SMD ‐2.09; 95% CI ‐2.62 to ‐1.56) |
| 11 Kukui nut oil, TD | Effect size [CI] | (SMD 0.00; 95% CI ‐0.80 to 0.80) | (SMD 0.33; 95% CI ‐0.48 to 1.14) | (SMD ‐0.03; 95% CI ‐0.84 to 0.77) | (SMD 0.00; 95% CI ‐0.80 to 0.80) | (SMD 0.00; 95% CI ‐0.80 to 0.80) |
| 12 Mahonia aquifolium (Reliéva™), BD | Effect size [CI] | ‐ | ‐ | ‐ | ‐ | (SMD ‐0.77; 95% CI ‐1.06 to ‐0.48) |
| 13 Methotrexate gel | Effect size [CI] | (SMD ‐0.56; 95% CI ‐1.01 to ‐0.12) | (SMD ‐0.48; 95% CI ‐0.92 to ‐0.04) | (SMD ‐1.58; 95% CI ‐2.16 to ‐0.99) | ‐ | (SMD ‐1.05; 95% CI ‐2.04 to ‐0.06) |
| 14 Mycophenolic acid ointment | Effect size [CI] | ‐ | (SMD ‐1.44; 95% CI ‐2.67 to ‐0.22) | ‐ | ‐ | (SMD ‐1.44; 95% CI ‐2.67 to ‐0.22) |
| 15 NG‐monomethyl‐L‐arginine (L‐NMMA) cream | Effect size [CI] | ‐ | (SMD 0.08; 95% CI ‐0.60 to 0.75) | ‐ | ‐ | (SMD 0.08; 95% CI ‐0.60 to 0.75) |
| 16 Nicotinamide 1.4%, BD | Effect size [CI] | ‐ | (SMD ‐0.20; 95% CI ‐0.60 to 0.20) | ‐ | ‐ | (SMD ‐0.20; 95% CI ‐0.60 to 0.20) |
| 17 Oleum horwathiensis | Effect size [CI] | (SMD ‐0.02; 95% CI ‐0.63 to 0.58) | (SMD ‐0.77; 95% CI ‐1.40 to ‐0.14) | ‐ | ‐ | (SMD ‐0.02; 95% CI ‐0.63 to 0.58) |
| 18 Omega‐3‐polyunsaturated fatty acids ointment | Effect size [CI] | ‐ | ‐ | ‐ | ‐ | ‐ |
| 19 Platelet aggregation activating factor (PAF) (Ro 24‐0238) | Effect size [CI] | (SMD ‐0.07; 95% CI ‐0.50 to 0.37) | ‐ | ‐ | (SMD ‐0.07; 95% CI ‐0.50 to 0.37) | |
| 20 Polymyxin B cream, 200,000 U/g | Effect size [CI] | ‐ | (SMD 0.13; 95% CI ‐0.59 to 0.85) | ‐ | ‐ | (SMD 0.13; 95% CI ‐0.59 to 0.85) |
| 21 PTH (1‐34) in Novasome A® liposomal cream, BD | Effect size [CI] | ‐ | (SMD ‐2.31; 95% CI ‐3.26 to ‐1.36) | ‐ | ‐ | (SMD ‐2.31; 95% CI ‐3.26 to ‐1.36) |
| 22 Sirolimus (topical), 2.2% for 6 wks, then 8% for a further 6 wks | Effect size [CI] | ‐ | (SMD ‐0.39; 95% CI ‐0.98 to 0.21) | ‐ | ‐ | (SMD ‐0.39; 95% CI ‐0.98 to 0.21) |
| 23 Tacrolimus ointment | Effect size [CI] | ‐ | (SMD 0.06; 95% CI ‐0.52 to 0.63) | ‐ | ‐ | (SMD 0.06; 95% CI ‐0.52 to 0.63) |
| 24 Tar | Effect size [CI] | ‐ | (SMD ‐0.45; 95% CI ‐1.11 to 0.22) | ‐ | ‐ | (SMD ‐0.45; 95% CI ‐1.11 to 0.22) |
| 25 Tazarotene | Effect size [CI] | ‐ | (SMD ‐0.86; 95% CI ‐1.11 to ‐0.62) | ‐ | ‐ | (SMD ‐0.86; 95% CI ‐1.11 to ‐0.62) |
| 26 Theophylline 1% ointment, BD | Effect size [CI] | ‐ | ‐ | (SMD ‐2.87; 95% CI ‐4.13 to ‐1.62) | ‐ | (SMD ‐2.87; 95% CI ‐4.13 to ‐1.62) |
| All treatments | (not pooled) | ‐ | ‐ | ‐ | ‐ | ‐ |
| ‐ | No. participants | 364 | 907 | 529 | 105 | 1450 |
| ‐ | Between‐patient design | 4 | 5 | 8 | 2 | 12 |
| ‐ | Within‐patient design | 4 | 12 | 1 | 0 | 14 |
| ‐ | Treatment duration | 3 wks to 12 wks | 3 wks to 12 wks | 2 wks to 12 wks | 3 wks to 12 wks | 2 wks to 12 wks |
For acronyms, see Table 1.
Four treatments performed statistically significantly better than placebo: anti‐IL‐8 monoclonal antibody cream; betamethasone 17‐valerate 21‐acetate plus tretinoin plus salicylic acid, indigo naturalise 1.4% ointment, and methotrexate gel. The effect size for the IAGI ranged from ‐0.56 (Sutton 2001; methotrexate gel) to ‐2.14 (Lin 2008; indigo naturalise 1.4% ointment).
In four treatments, the difference relative to placebo was not statistically significant: hexafluoro‐1,25‐dihydroxyvitamin D3, kukui nut oil, oleum horwathiensis, and platelet aggregation activating factor (PAF). No treatment was statistically significantly less effective than placebo.
Analysis 7: Vitamin D analogues versus corticosteroid (potent)
This comparison included eight vitamin D analogue‐potent corticosteroid contrasts for body psoriasis (see Table 10). Eight studies with 2655 participants reported IAGI data for 6 of the 8 intervention‐comparator contrasts (see Analysis 7.1). Seven trials were between‐patient design, and one was a within‐patient study (Medansky 1996). Treatment duration ranged from three to eight weeks. Overall, there was no statistically significant difference between vitamin D analogues and potent corticosteroids: The SMD across all 6 treatments for IAGI was 0.17 (95% CI ‐0.04 to 0.37; I² statistic = 83.4%). In light of the high level of heterogeneity and inconsistency across treatments (Higgins 2011). We removed pooling. Vitamin D analogues performed statistically significantly better than one potent corticosteroid. This finding came from a single between‐patient study in which 99 participants contributed data (Bruce 1994). The SMD for calcipotriol against fluocinonide 0.05% ointment was ‐0.58 (95% CI ‐0.99 to ‐0.18; I² statistic = NA). Calcipotriol was statistically significantly less effective than both diflorasone diacetate 0.05% ointment (SMD 0.27; 95% CI 0.02 to 0.52) and betamethasone dipropionate (SMD 0.43; 95% CI 0.28 to 0.58; I² statistic = 50.3%). We found no statistically significant difference between calcipotriol and betamethasone valerate, calcitriol and betamethasone dipropionate, or calcitriol and betamethasone valerate.
| Subcategory | Measure | 01 IAGI/IGA | 02 TSS | 03 PASI | 04 PAGI/PGA | 05 Combined end point |
| 01 Calcipotriol vs. betamethasone dipropionate | Effect size [CI] | (SMD 0.43; 95% CI 0.28 to 0.58) | ‐ | (SMD 0.36; 95% CI 0.22 to 0.51) | ‐ | (SMD 0.43; 95% CI 0.28 to 0.58) |
| 02 Calcipotriol vs. betamethasone valerate | Effect size [CI] | (SMD ‐0.02; 95% CI ‐0.21 to 0.17) | (SMD ‐0.26; 95% CI ‐0.41 to ‐0.11) | (SMD ‐0.12; 95% CI ‐0.22 to ‐0.02) | (SMD ‐0.26; 95% CI ‐0.38 to ‐0.14) | (SMD ‐0.12; 95% CI ‐0.26 to 0.02) |
| 03 Calcipotriol vs. desoxymetasone | Effect size [CI] | ‐ | ‐ | (SMD 0.15; 95% CI ‐0.73 to 1.02) | ‐ | (SMD 0.15; 95% CI ‐0.73 to 1.02) |
| 04 Calcipotriol vs. diflorasone diacetate | Effect size [CI] | (SMD 0.27; 95% CI 0.02 to 0.52) | (SMD 0.40; 95% CI 0.15 to 0.65) | ‐ | ‐ | (SMD 0.27; 95% CI 0.02 to 0.52) |
| 05 Calcipotriol vs. fluocinonide | Effect size [CI] | (SMD ‐0.58; 95% CI ‐0.99 to ‐0.18) | (SMD ‐0.50; 95% CI ‐0.92 to ‐0.07) | ‐ | ‐ | (SMD ‐0.58; 95% CI ‐0.99 to ‐0.18) |
| 06 Calcitriol vs. betamethasone dipropionate | Effect size [CI] | (SMD 0.21; 95% CI ‐0.04 to 0.45) | (SMD 0.27; 95% CI 0.02 to 0.51) | (SMD 0.39; 95% CI 0.14 to 0.63) | ‐ | (SMD 0.21; 95% CI ‐0.04 to 0.45) |
| 07 Calcitriol vs. betamethasone valerate | Effect size [CI] | (SMD ‐0.19; 95% CI ‐0.91 to 0.53) | ‐ | ‐ | ‐ | (SMD ‐0.19; 95% CI ‐0.91 to 0.53) |
| 08 Tacalcitol vs. betamethasone valerate | Effect size [CI] | ‐ | (SMD 0.41; 95% CI 0.09 to 0.74) | ‐ | ‐ | (SMD 0.41; 95% CI 0.09 to 0.74) |
| All treatments | Effect size [CI]; I² statistic | (SMD 0.17; 95% CI ‐0.04 to 0.37); I² statistic: 83.4% | (SMD 0.11; 95% CI ‐0.22 to 0.44); I² statistic: 86.7% | (SMD 0.12; 95% CI ‐0.07 to 0.32); I² statistic: 86.2% | (SMD ‐0.26; 95% CI ‐0.38 to ‐0.14); I² statistic: 0% | (SMD 0.11; 95% CI ‐0.07 to 0.30); I² statistic: 85.6% |
| ‐ | No. participants | 2655 | 891 | 3185 | 738 | 3542 |
| ‐ | Between‐patient design | 7 | 2 | 7 | 1 | 9 |
| ‐ | Within‐patient design | 1 | 4 | 2 | 1 | 5 |
| ‐ | Treatment duration | 3 wks to 8 wks | 3 wks to 6 wks | 4 wks to 8 wks | 6 wks | 3 wks to 8 wks |
| Sensitivity analyses | Within‐patient trials | ‐ | ‐ | ‐ | ‐ | (SMD 0.17; 95% CI ‐0.20 to 0.54) |
| ‐ | Between‐patient trials | ‐ | ‐ | ‐ | ‐ | (SMD 0.10; 95% CI ‐0.11 to 0.31) |
| ‐ | correlation coefficient (rho) = 0 All trials | ‐ | ‐ | ‐ | ‐ | (SMD 0.10; 95% CI ‐0.08 to 0.28); |
| ‐ | rho = 0 Btw‐patient trials rho = 0.25 Within‐patient trials | ‐ | ‐ | ‐ | ‐ | (SMD 0.10; 95% CI ‐0.07 to 0.28) |
| ‐ | rho = 0 Btw‐patient trials rho = 0.50 Within‐patient trials | ‐ | ‐ | ‐ | ‐ | (SMD 0.11; 95% CI ‐0.07 to 0.29) |
| ‐ | rho = 0 Btw‐patient trials rho = 0.75 Within‐patient trials | ‐ | ‐ | ‐ | ‐ | (SMD 0.12; 95% CI ‐0.06 to 0.30) |
For acronyms, see Table 1.
Analysis 8: Vitamin D analogues versus corticosteroid (very potent)
This comparison included one vitamin D analogue, calcipotriol ointment, versus a very potent corticosteroid contrast, clobetasol propionate foam, for psoriasis of the body (see Table 11 and Analysis 8.1). One study with 42 participants reported IAGI data. Koo 2006 was a between‐patient study with a treatment duration of two weeks, which found no significant difference between the treatments (SMD 0.19; 95% CI ‐0.42 to 0.80).
| Subcategory | Measure | 01 IAGI/IGA | 02 TSS | 03 PASI | 04 PAGI/PGA | 05 Combined end point |
| 01 Calcipotriol vs. clobetasol propionate | Effect size [CI] | (SMD 0.19; 95% CI ‐0.42 to 0.80) | ‐ | (SMD ‐0.32; 95% CI ‐0.95 to 0.30) | (SMD 0.42; 95% CI ‐0.20 to 1.03) | (SMD ‐0.06; 95% CI ‐0.57 to 0.44); I² statistic: 25.7% |
| All treatments | No. participants | 42 | 0 | 40 | 42 | 82 |
| ‐ | Between‐patient design | 1 | 0 | 1 | 1 | 2 |
| ‐ | Within‐patient design | 0 | 0 | 0 | 0 | 0 |
| ‐ | Treatment duration | 2 wks | ‐ | 6 wks | 2 wks | 2 wks to 6 wks |
Analysis 9: Vitamin D combined with corticosteroid versus corticosteroid
This comparison considered vitamin D analogues‐steroid combination against potent or very potent corticosteroids for body psoriasis (see Analysis 9.1 and Table 12). The comparison included three contrasts: calcipotriol plus betamethasone dipropionate versus betamethasone dipropionate, calcipotriol plus betamethasone dipropionate versus clobetasol propionate, and calcipotriol plus clobetasol propionate versus clobetasol propionate.
| Subcategory | Measure | 01 IAGI/IGA | 02 TSS | 03 PASI | 04 PAGI/PGA | 05 Combined end point |
| 01 Calcipotriol + betamethasone dipropionate vs. betamethasone dipropionate | Effect size [CI] | (SMD ‐0.40; 95% CI ‐0.52 to ‐0.27) | ‐ | (SMD ‐0.44; 95% CI ‐0.55 to ‐0.33) | ‐ | (SMD ‐0.40; 95% CI ‐0.52 to ‐0.27) |
| 02 Calcipotriol + betamethasone dipropionate vs. clobetasol propionate | Effect size [CI] | ‐ | (SMD 0.45; 95% CI 0.09 to 0.81) | ‐ | ‐ | (SMD 0.45; 95% CI 0.09 to 0.81) |
| 03 Calcipotriol + clobetasol propionate vs. clobetasol propionate | Effect size [CI] | (SMD ‐0.69; 95% CI ‐1.22 to ‐0.15) | ‐ | ‐ | (SMD ‐0.28; 95% CI ‐0.80 to 0.24) | (SMD ‐0.69; 95% CI ‐1.22 to ‐0.15) |
| ‐ | Effect size [CI], I² | (SMD ‐0.41; 95% CI ‐0.53 to ‐0.29); I² statistic: 32.0% | (SMD 0.45; 95% CI 0.09 to 0.81): I² statistic: NA | (SMD ‐0.44; 95% CI ‐0.55 to ‐0.33) I² statistic: 22.4% | (SMD ‐0.28; 95% CI ‐0.80 to 0.24) I² statistic: NA | (SMD ‐0.26; 95% CI ‐0.52 to ‐0.00); I² statistic: 84.4% |
| ‐ | No. participants | 1991 | 122 | 1876 | 65 | 2113 |
| ‐ | Between‐patient design | 4 | 1 | 3 | 1 | 5 |
| ‐ | Within‐patient design | 0 | 0 | 0 | 0 | 0 |
| ‐ | Treatment duration | 2 wks to 8 wks | 4 wks | 4 wks to 8 wks | 2 wks | 2 wks to 8 wks |
Four between‐patient trials reported IAGI data for 1991 participants on 2 of the 3 intervention‐comparator contrasts. Treatment duration ranged between two and eight weeks. As these treatment comparisons were very different, we only pooled subtotals. In all but one trial (Fleming 2010 (H)), combination treatment was significantly more effective than corticosteroid alone. Three of the four trials compared calcipotriol/betamethasone dipropionate against betamethasone dipropionate (SMD ‐0.40; 95% CI ‐0.52 to ‐0.27; I² statistic = 41.8%), and one trial compared combined treatment with calcipotriol and clobetasol against clobetasol alone (SMD ‐0.69; 95% CI ‐1.22 to ‐0.15).
Analysis 10: Vitamin D alone or in combination versus dithranol
This comparison considered vitamin D analogues against dithranol (Analysis 10.1 and Table 13). We identified three intervention‐comparator contrasts: calcipotriol versus dithranol, calcitriol versus dithranol, and tacalcitol versus dithranol. Five between‐patient trials reported IAGI data for 1108 participants on 2 of these 3 intervention‐comparator contrasts. Treatment duration ranged from 8 weeks to 12 weeks. There was some variation in the dithranol regimens employed by trials and in the baseline severity of trial participants. These factors may help explain the high level of heterogeneity found in the pooled results.
| Subcategory | Measure | 01 IAGI/IGA | 02 TSS | 03 PASI | 04 PAGI/PGA | 05 Combined end point |
| 01 Calcipotriol vs. dithranol | Effect size [CI] | (SMD ‐0.43; 95% CI ‐0.85 to ‐0.01) | (SMD ‐0.54; 95% CI ‐1.16 to 0.08) | (SMD 0.73; 95% CI ‐0.55 to 2.00) | (SMD ‐0.05; 95% CI ‐0.90 to 0.80) | (SMD 0.07; 95% CI ‐0.57 to 0.71) |
| 02 Calcitriol vs. dithranol | Effect size [CI] | (SMD 0.51; 95% CI 0.13 to 0.88) | (SMD 0.13; 95% CI ‐0.24 to 0.50) | (SMD ‐0.21; 95% CI ‐0.58 to 0.16) | ‐ | (SMD 0.51; 95% CI 0.13 to 0.88) |
| 03 Tacalcitol vs. dithranol | Effect size [CI] | ‐ | (SMD ‐0.18; 95% CI ‐0.60 to 0.25) | (SMD ‐0.07; 95% CI ‐0.50 to 0.36) | ‐ | (SMD ‐0.18; 95% CI ‐0.60 to 0.25) |
| All treatments | Effect size [CI], I² statistic | (SMD ‐0.24; 95% CI ‐0.72 to 0.25); I² statistic:93.0% | (SMD ‐0.27; 95% CI ‐0.73 to 0.20); I² statistic: 80.6% | (SMD 0.36; 95% CI ‐0.33 to 1.04); I² statistic: 94.5% | (SMD ‐0.05; 95% CI ‐0.90 to 0.80); I² statistic: 92.5% | (SMD 0.09; 95% CI ‐0.44 to 0.63); I² statistic: 94.9% |
| ‐ | No. participants | 1108 | 386 | 796 | 544 | 1284 |
| ‐ | Between‐patient design | 5 | 3 | 5 | 2 | 7 |
| ‐ | Within‐patient design | 0 | 1 | 0 | 0 | 1 |
| ‐ | Treatment duration | 8 wks to 12 wks | 4 wks to 8 wks | 8 wks to 12 wks | 8 wks to 12 wks | 4 wks to 12 wks |
The SMD for the IAGI was ‐0.24 (95% CI ‐0.72 to 0.25; I² statistic = 93.0%). The presence of considerable heterogeneity means that the estimated average benefit should be treated with caution and pooling was therefore removed (Higgins 2011). Data from four trials contributed to the SMD for the calcipotriol versus dithranol: ‐0.43 (95% CI ‐0.85 to ‐0.01; I² statistic = 89.3%), indicating that calcipotriol was statistically significantly more effective than dithranol. Three of these four trials found a significant difference in favour of calcipotriol (Berth Jones 1992b; Christensen 1999; Wall 1998), but the trial by Van de Kerkhof 2006 found outpatient treatment with short contact dithranol to be significantly more effective than calcipotriol alone.
Data from one trial contributed to the SMD for the calcitriol versus dithranol: 0.51 (95% CI 0.13 to 0.88; I² statistic = NA), indicating that dithranol was statistically significantly more effective than calcitriol.
Analysis 11: Vitamin D alone or in combination versus other vitamin D analogue
Our review identified three intervention‐comparator contrasts in this comparison: calcipotriol versus calcitriol, calcipotriol versus tacalcitol, and calcipotriol versus maxacalcitol for body psoriasis (see Analysis 11.1 and Table 14). Three trials involving 498 participants contributed IAGI data for all 3 intervention‐comparator contrasts (one trial for each contrast). Two trials were between‐patient, and one was within‐patient in design (Barker 1999 (H)). Treatment duration ranged from 8 to 12 weeks. The SMD for the IAGI was ‐0.06 (95% CI ‐0.51 to 0.38; I² statistic = 82.2%). The presence of substantial heterogeneity reflects differences in the findings from the two intervention‐comparator contrasts underlying this statistic. We found a statistically significant difference in favour of calcipotriol in the analysis against tacalcitol (SMD ‐0.47; 95% CI ‐0.73 to ‐0.21), but there was no significant difference relative to calcitriol (SMD 0.00; 95% CI ‐0.25 to 0.25) or between calcipotriol and maxacalcitol (SMD 0.43; 95% CI ‐0.12 to 0.98). In light of the inconsistency of results across treatments, we only pooled subtotals (Higgins 2011).
| Subcategory | Measure | 01 IAGI/IGA | 02 TSS | 03 PASI | 04 PAGI/PGA | 05 Combined end point |
| 01 Calcipotriol vs. calcitriol | Effect size [CI] | (SMD 0.00; 95% CI ‐0.25 to 0.25) | (SMD ‐0.32; 95% CI ‐0.57 to ‐0.07) | (SMD ‐1.11; 95% CI ‐2.22 to 0.01) | (SMD 0.04; 95% CI ‐0.21 to 0.29) | (SMD ‐0.41; 95% CI ‐1.46 to 0.64) |
| 02 Calcipotriol vs. tacalcitol | Effect size [CI] | (SMD ‐0.47; 95% CI ‐0.73 to ‐0.21) | (SMD ‐0.45; 95% CI ‐0.68 to ‐0.22) | ‐ | ‐ | (SMD ‐0.47; 95% CI ‐0.73 to ‐0.21) |
| 03 Calcipotriol vs. maxacalcitol | Effect size [CI] | (SMD 0.43; 95% CI ‐0.12 to 0.98) | (SMD 0.13; 95% CI ‐0.41 to 0.68) | ‐ | ‐ | (SMD 0.43; 95% CI ‐0.12 to 0.98) |
| All treatments | Effect size [CI], I² | (SMD ‐0.06; 95% CI ‐0.51 to 0.38); I² statistic: 82.2% | (SMD ‐0.31; 95% CI ‐0.55 to ‐0.06); I² statistic: 46.9% | (SMD ‐1.11; 95% CI ‐2.22 to 0.01); I² statistic: NA | (SMD 0.04; 95% CI ‐0.21 to 0.29); I² statistic: NA | (SMD ‐0.17; 95% CI ‐0.62 to 0.27); I² statistic: 78.5% |
| ‐ | No. participants | 498 | 563 | 15 | 250 | 513 |
| ‐ | Between‐patient design | 2 | 2 | 1 | 1 | 3 |
| ‐ | Within‐patient design | 1 | 1 | 0 | 0 | 1 |
| ‐ | Treatment duration | 8 wks to 12 wks | 8 wks to 12 wks | 8 wks | 12 wks | 8 wks to 12 wks |
| Sensitivity analyses | TSS data from Ji 2008 used in combined end point: 01 Calcipotriol vs. calcitriol | ‐ | ‐ | ‐ | (SMD ‐0.52; 95% CI ‐1.19 to 0.15; I² statistic: 44.9%) | |
| ‐ | TSS data from Ji 2008 used in combined end point: all treatments | ‐ | ‐ | ‐ | (SMD ‐0.28; 95% CI ‐0.66 to 0.10; I² statistic: 70.6%) |
Analysis 12: Vitamin D alone or in combination versus vitamin D + corticosteroid
Our review identified 12 intervention‐comparator contrasts for body psoriasis, involving 3 vitamin D analogues, 2 combination products, and 7 different corticosteroids (see Analysis 12.1 and Table 15 ). Eleven parallel‐group trials involving 4791 participants contributed IAGI data for 9 of these 12 intervention‐comparator contrasts. Treatment duration ranged from two to eight weeks. There were no IAGI data for three contrasts: calcipotriol versus calcipotriol plus diflucortolone valerate, calcipotriol versus calcipotriol plus fluocinonide acetonide, and calcitriol versus calcitriol plus diflucortolone valerate.
| Subcategory | Measure | 01 IAGI/IGA | 02 TSS | 03 PASI | 04 PAGI/PGA | 05 Combined end point |
| 01 Calcipotriol BD vs. calcipotriol OM, BMD ON | Effect size [CI] | (SMD 0.56; 95% CI 0.23 to 0.88) | ‐ | (SMD 0.46; 95% CI 0.10 to 0.82) | ‐ | (SMD 0.56; 95% CI 0.23 to 0.88) |
| 02 Calcipotriol OD vs. combined calcipotriol + BMD OD | Effect size [CI] | (SMD 0.66; 95% CI 0.31 to 1.02) | ‐ | (SMD 0.67; 95% CI 0.23 to 1.11) | ‐ | (SMD 0.66; 95% CI 0.31 to 1.02) |
| 03 Calcipotriol BD vs. combined calcipotriol + BMD OD | Effect size [CI] | (SMD 0.27; 95% CI 0.06 to 0.48) | (SMD 0.25; 95% CI 0.03 to 0.48) | (SMD 0.52; 95% CI 0.38 to 0.67) | ‐ | (SMD 0.43; 95% CI 0.20 to 0.66) |
| 04 Calcipotriol BD vs. combined calcipotriol + BMD BD | Effect size [CI] | (SMD 0.66; 95% CI 0.40 to 0.93) | ‐ | (SMD 0.64; 95% CI 0.46 to 0.83) | ‐ | (SMD 0.66; 95% CI 0.40 to 0.93) |
| 05 Calcipotriol BD vs. calcipotriol OM, BMV ON | Effect size [CI] | (SMD 0.27; 95% CI ‐0.19 to 0.74) | ‐ | (SMD 0.43; 95% CI ‐0.07 to 0.93) | ‐ | (SMD 0.27; 95% CI ‐0.19 to 0.74) |
| 06 Calcipotriol BD vs. calcipotriol OM, clobetasone butyrate ON | Effect size [CI] | (SMD 0.27; 95% CI 0.05 to 0.48) | ‐ | (SMD 0.17; 95% CI ‐0.04 to 0.38) | ‐ | (SMD 0.27; 95% CI 0.05 to 0.48) |
| 07 Calcipotriol BD vs. calcipotriol BD + clobetasol propionate BD | Effect size [CI] | (SMD 0.88; 95% CI 0.34 to 1.42) | ‐ | ‐ | (SMD 0.70; 95% CI 0.16 to 1.23) | (SMD 0.88; 95% CI 0.34 to 1.42) |
| 08 Calcipotriol BD vs. calcipotriol OM, diflucortolone valerate ON | Effect size [CI] | ‐ | ‐ | (SMD 0.08; 95% CI ‐0.29 to 0.44) | ‐ | (SMD 0.08; 95% CI ‐0.29 to 0.44) |
| 09 Calcipotriol OD vs. calcipotriol OM, fluocinonide acetonide ON | Effect size [CI] | ‐ | ‐ | (SMD 0.53; 95% CI ‐0.11 to 1.18) | ‐ | (SMD 0.53; 95% CI ‐0.11 to 1.18) |
| 10 Calcipotriol OD vs. combined calcipotriol + hydrocortisone OD | Effect size [CI] | (SMD 0.14; 95% CI ‐0.06 to 0.33) | ‐ | (SMD 0.08; 95% CI ‐0.11 to 0.28) | ‐ | (SMD 0.14; 95% CI ‐0.06 to 0.33) |
| 11 calcitriol BD vs. diflucortolone valerate OM, calcitriol ON | Effect size [CI] | ‐ | ‐ | (SMD 0.24; 95% CI ‐0.09 to 0.57) | ‐ | (SMD 0.24; 95% CI ‐0.09 to 0.57) |
| 12 Tacalcitol OD vs. combined calcipotriol + BMD OD | Effect size [CI] | (SMD 0.48; 95% CI 0.26 to 0.70) | ‐ | (SMD 0.47; 95% CI 0.25 to 0.69) | (SMD 0.46; 95% CI 0.24 to 0.68) | (SMD 0.48; 95% CI 0.26 to 0.70) |
| All treatments | Effect size [CI], I² statistic | (SMD 0.48; 95% CI 0.32 to 0.65), I² statistic: 86.9% | (SMD 0.25; 95% CI 0.03 to 0.48) | (SMD 0.47; 95% CI 0.34 to 0.59), I² statistic: 82.3% | (SMD 0.49; 95% CI 0.29 to 0.69), I² statistic: 0% | (SMD 0.46; 95% CI 0.33 to 0.59), I² statistic: 83.3% |
| ‐ | No. participants | 4791 | 301 | 5703 | 399 | 5856 |
| ‐ | Between‐patient design | 11 | 1 | 15 | 2 | 16 |
| ‐ | Within‐patient design | 0 | 0 | 1 | 0 | 1 |
| ‐ | Treatment duration | 2 wks to 8 wks | 4 wks | 2 wks to 12 wks | 2 wks to 8 wks | 2 wks to 12 wks |
For acronyms, see Table 1.
Overall, vitamin D alone appeared to be less effective than vitamin D plus corticosteroid: The SMD for the IAGI was 0.48 (95% CI 0.32 to 0.65; I² statistic = 86.9%). This finding applied to all but two of the intervention‐comparator contrasts: There was no statistically significant difference between twice‐daily calcipotriol and a regimen of calcipotriol (morning) plus betamethasone valerate (night time) (SMD 0.27; 95% CI ‐0.19 to 0.74) (Kragballe 1998b), or between once‐daily calcipotriol and once‐daily treatment with a combined product containing calcipotriol and hydrocortisone (SMD 0.14; 95% CI ‐0.06 to 0.33) (Ortonne 2010). The study by Ortonne 2010 also reported findings separately for the face (see Analysis 17.1).
In light of the observed heterogeneity between the intervention‐comparator contrasts, we only pooled subtotals (Higgins 2011).
Analysis 13: Vitamin D alone or in combination versus other treatments: complex regimens
This comparison summarises findings on complex regimens for body psoriasis, defined here as treatment sequences that do not consist of a simple head‐to‐head comparison between two active treatments (see Analysis 13.1 and Table 16). We identified 12 intervention‐comparator contrasts, and IAGI data were available for 10 of these. Data from 2755 participants contributed to the IAGI analysis, based on findings from seven trials. Six of the trials were between‐patient (parallel‐group) in design, and one was a within‐patient study (Austad 1998). Trial duration varied between 6 and 12 weeks. As the interventions and comparators were highly variable and because two trials each contributed three pair‐wise contrasts, we did not pool the data.
| Subcategory | Measure | 01 IAGI/IGA | 02 TSS | 03 PASI | 04 PAGI/PGA | 05 Combined end point |
| 01 Calcipotriol (12 wks) vs. combined calcipotriol + BMD (8 wks); then calcipotriol (4 wks) | Effect size [CI] | (SMD ‐0.12; 95% CI ‐0.29 to 0.04) | ‐ | (SMD ‐0.04; 95% CI ‐0.19 to 0.11) | (SMD ‐0.14; 95% CI ‐0.30 to 0.02) | (SMD ‐0.12; 95% CI ‐0.29 to 0.04) |
| 02 Calcipotriol (12 wks) vs. combined calcipotriol + BMD (4 wks); then calcipotriol (8 wks) | Effect size [CI] | ‐ | ‐ | (SMD 0.29; 95% CI ‐0.04 to 0.62) | ‐ | (SMD 0.29; 95% CI ‐0.04 to 0.62) |
| 03 Calcipotriol (12 wks) vs. combined calcipotriol + BMD (4 wks); then calcipotriol (w/dy) & combined calcipotriol + BMD (w/e) (8 wks) | Effect size [CI] | (SMD 0.13; 95% CI ‐0.04 to 0.29) | ‐ | (SMD 0.10; 95% CI ‐0.05 to 0.25) | (SMD 0.10; 95% CI ‐0.06 to 0.26) | (SMD 0.13; 95% CI ‐0.04 to 0.29) |
| 04 Calcipotriol (6 wks) vs. clobetasol propionate (2 wks); then calcipotriol (4 wks) | Effect size [CI] | (SMD 0.60; 95% CI 0.18 to 1.02) | (SMD 0.63; 95% CI 0.21 to 1.05) | ‐ | ‐ | (SMD 0.60; 95% CI 0.18 to 1.02) |
| 05 Calcipotriol (6 wks) vs. calcipotriol OM, fluocinonide acetonide ON (2 wks); then calcipotriol BD (4 wks) | Effect size [CI] | ‐ | ‐ | (SMD 0.66; 95% CI 0.01 to 1.32) | ‐ | (SMD 0.66; 95% CI 0.01 to 1.32) |
| 06 Calcipotriol (6 wks) vs. halometasone OM, calcipotriol ON (2 wks); then calcipotriol BD (w/dy), halometasone (w/e) (2 wks); then calcipotriol BD (2wks) | Effect size [CI] | (SMD 0.41; 95% CI ‐0.05 to 0.86) | ‐ | (SMD 1.13; 95% CI 0.64 to 1.62) | ‐ | (SMD 0.41; 95% CI ‐0.05 to 0.86) |
| 07 Calcipotriol ON, clobetasol propionate OM (2 to 4 wks); then calcipotriol BD (to wk12) vs. calcitriol ON, clobetasol propionate OM (2 to 4 wks); then calcitriol BD (to wk12) | Effect size [CI] | (SMD ‐0.19; 95% CI ‐0.54 to 0.16) | ‐ | (SMD ‐0.27; 95% CI ‐0.62 to 0.09) | ‐ | (SMD ‐0.19; 95% CI ‐0.54 to 0.16) |
| 08 Combined calcipotriol + BMD (4 wks); then placebo ointment BD (8 wks) vs. combined calcipotriol + BMD (4 wks); then calcipotriol ointment BD (8 wks) | Effect size [CI] | (SMD 0.27; 95% CI 0.12 to 0.41) | ‐ | (SMD 0.25; 95% CI 0.10 to 0.39) | (SMD 0.28; 95% CI 0.13 to 0.42) | (SMD 0.27; 95% CI 0.12 to 0.41) |
| 09 Combined calcipotriol + BMD (4 wks); then placebo ointment BD (8 wks) vs. combined calcipotriol + BMD (4 wks); then calcipotriol (w/dy)+ combined calcipotriol + BMD (w/e) (8 wks) | Effect size [CI] | (SMD 0.51; 95% CI 0.37 to 0.66) | ‐ | (SMD 0.59; 95% CI 0.45 to 0.74) | (SMD 0.71; 95% CI 0.56 to 0.85) | (SMD 0.51; 95% CI 0.37 to 0.66) |
| 10 combined calcipotriol + BMD (4 wks); then calcipotriol ointment BD (8 wks) vs. combined calcipotriol + BMD (4 wks); then calcipotriol (w/dy) + combined calcipotriol + BMD (w/e) (8 wks) | Effect size [CI] | (SMD 0.26; 95% CI 0.11 to 0.40) | ‐ | (SMD 0.30; 95% CI 0.16 to 0.45) | (SMD 0.44; 95% CI 0.29 to 0.58) | (SMD 0.26; 95% CI 0.11 to 0.40) |
| 11 Combined calcipotriol + BMD (8 wks); then calcipotriol (4 wks) vs. combined calcipotriol + BMD (4 wks); then calcipotriol (w/dy) & combined calcipotriol + BMD (w/e) (8 wks) | Effect size [CI] | (SMD 0.24; 95% CI 0.08 to 0.40) | ‐ | (SMD 0.15; 95% CI ‐0.01 to 0.30) | (SMD 0.23; 95% CI 0.07 to 0.39) | (SMD 0.24; 95% CI 0.08 to 0.40) |
| 12 Tacalcitol (8 wks) vs. combined calcipotriol + BMD (4 wks); then calcipotriol (4 wks) | Effect size [CI] | (SMD 0.54; 95% CI 0.36 to 0.72) | ‐ | (SMD 0.49; 95% CI 0.31 to 0.67) | (SMD 0.54; 95% CI 0.36 to 0.72) | (SMD 0.54; 95% CI 0.36 to 0.72) |
| All treatments | (not pooled) | ‐ | ‐ | ‐ | ‐ | ‐ |
| ‐ | No. participants | 2755 | 46 | 2991 | 2508 | 2936 |
| ‐ | Between‐patient design | 6 | 0 | 8 | 4 | 8 |
| ‐ | Within‐patient design | 1 | 1 | 0 | 0 | 1 |
| ‐ | Treatment duration | 6 wks to 12 wks | 6 wks | 2 wks to 12 wks | 8 wks to 12 wks | 2 wks to 12 wks |
For acronyms, see Table 1.
Six intervention‐comparator contrasts for which IAGI data were available found a significant difference between regimens. A two‐week regimen with clobetasol propionate followed by four weeks' treatment with calcipotriol was more effective than six weeks of monotherapy with calcipotriol (SMD 0.60; 95% CI 0.18 to 1.02). All treatments were applied twice‐daily in this within‐patient study (Austad 1998).
The remaining five more effective regimens all involved once‐daily treatment with a combined product containing calcipotriol and betamethasone dipropionate, and the same study (White 2006 (P)) reported three contrasts. This study involved an initial 'treatment' phase consisting of 4 weeks' treatment with the combined product, followed by an 8‐week maintenance phase. In one maintenance phase, participants received placebo ointment for 8 weeks. This was significantly less effective than maintenance with once‐daily calcipotriol (SMD 0.27; 95% CI 0.12 to 0.41), and it was also less effective than maintenance with once‐daily calcipotriol on weekdays and the combined product at the weekend (SMD 0.51; 95% CI 0.37 to 0.66). When these two comparator regimens were compared directly (White 2006 (H)), the alternating regimen using weekday/weekend treatments during the maintenance phase was significantly more effective than once‐daily calcipotriol for maintenance (SMD 0.26; 95% CI 0.11 to 0.40). Kragballe 2004 compared 3 12‐week treatment regimens, 2 of which were 'complex'. When we compared these complex regimens, eight weeks' once‐daily combination treatment with calcipotriol and betamethasone dipropionate, followed by four weeks of once‐daily calcipotriol was significantly less effective than a regimen consisting of four weeks' once‐daily combination treatment, followed by eight weeks of once‐daily calcipotriol on weekdays and the combined product at weekends (SMD 0.24; 95% CI 0.08 to 0.40). A separate trial compared 8 weeks with tacalcitol to combination ointment for 4 weeks, followed by calcipotriol for 4 weeks (Ortonne 2004). Participants applied all treatments once daily (at night time). Monotherapy with tacalcitol was significantly less effective than the complex regimen (SMD 0.54; 95% CI 0.36 to 0.72).
In 4 of the 10 intervention‐comparator contrasts for which IAGI data were available, there was no significant difference in effect. The study by Kragballe 2004 (see paragraph above) found no difference between twice‐daily calcipotriol and the two comparator complex regimens. One regimen consisted of eight weeks' once‐daily treatment with a combined product containing calcipotriol and betamethasone dipropionate, followed by four weeks of once‐daily calcipotriol. Relative to calcipotriol monotherapy, the SMD for the IAGI was ‐0.12 (95% CI ‐0.29 to 0.04). When compared with a regimen consisting of four weeks' once‐daily treatment with a combined product containing calcipotriol and betamethasone dipropionate, followed by eight weeks of once‐daily calcipotriol on weekdays and the combined product at weekends, twice‐daily calcipotriol appeared to be slightly less effective, although the difference was not statistically significant (SMD 0.13; 95% CI ‐0.04 to 0.29).
Yang 2009 compared a six‐week course of twice‐daily calcipotriol with a complex routine using halometasone and calcipotriol. For two weeks participants applied halometasone in the morning and calcipotriol at night; over the next two weeks, halometasone was applied twice daily at weekends and calcipotriol twice daily during the week. For the final two weeks, treatment reverted to twice‐daily calcipotriol. Although there was a trend in favour of the complex regimen (SMD 0.41; 95% CI ‐0.05 to 0.86), the difference was not statistically significant.
Lahfa 2003 compared two different vitamin D products combined with a very potent corticosteroid. In the initial phase, participants applied dual therapy (clobetasol propionate in the mornings and the vitamin D analogue (calcipotriol or calcitriol) at night) until achieving clearance or marked improvement or until 4 weeks had elapsed. Participants then switched to a monotherapy maintenance phase with the vitamin D product for the remainder of the 12‐week study period. The IAGI results showed the 2 treatment regimens to be equivalent: ‐0.19 (95% CI ‐0.54 to 0.16).
Analysis 14: Vitamin D alone or in combination versus other treatment: long‐term studies (> 24 weeks)
This comparison included active‐controlled studies of psoriasis of the body that were at least 24 weeks in duration (see Analysis 14.1 and Table 17). One longer‐term placebo‐controlled trial of the body (Katz 1991a) and two long‐term scalp trials (Luger 2008; Poulin 2010) did not meet the inclusion criteria for this comparison, and they are evaluated elsewhere (Analysis 2, Analysis 19, and Analysis 18, respectively).
| Subcategory | Measure | 01 IAGI/IGA | 02 TSS | 03 PASI | 04 PAGI/PGA | 05 Combined end point |
| 01 Combined calcipotriol + BMD (52 wks) vs. alternating: combined calcipotriol + BMD (4 wks); then calcipotriol (4 wks) | Effect size [CI] | (SMD ‐0.09; 95% CI ‐0.36 to 0.18) | ‐ | ‐ | ‐ | (SMD ‐0.09; 95% CI ‐0.36 to 0.18) |
| 02 Combined calcipotriol+BMD (52 wks) vs. combined calcipotriol+ BMD (4 wks); then calcipotriol (48 wks) | Effect size [CI] | (SMD ‐0.18; 95% CI ‐0.47 to 0.10) | ‐ | ‐ | ‐ | (SMD ‐0.18; 95% CI ‐0.47 to 0.10) |
| 03 Alternating: combined calcipotriol + BMD (4 wks); then calcipotriol (4 wks) vs. combined calcipotriol + BMD (4 wks); then calcipotriol (48 wks) | Effect size [CI] | (SMD ‐0.09; 95% CI ‐0.37 to 0.19) | ‐ | ‐ | ‐ | (SMD ‐0.09; 95% CI ‐0.37 to 0.19) |
| All treatments | (no pooling) | ‐ | ‐ | ‐ | ‐ | ‐ |
| ‐ | No. participants | 297 | 0 | 0 | 0 | 297 |
| ‐ | Between‐patient design | 1 | 0 | 0 | 0 | 1 |
| ‐ | Within‐patient design | 0 | 0 | 0 | 0 | 0 |
| ‐ | Treatment duration | 52 wks | ‐ | ‐ | ‐ | 52 wks |
For acronyms, see Table 1.
One trial was included in this comparison; Kragballe 2006 was a between‐patient trial that compared three 52‐week regimens with all treatments used once daily:
-
first, combination treatment with calcipotriol and betamethasone dipropionate;
-
second, alternating treatment with combination therapy for 4 weeks, then calcipotriol for 4 weeks; and
-
third, combination therapy for 4 weeks, then calcipotriol for 48 weeks.
In total, 297 participants contributed IGA data to the analysis. Data were unsuitable for pooling because the same participants contributed to more than one analysis.
According to the investigators' assessment, there was no significant difference between the three long‐term regimens. One year's combination therapy was not significantly better than either the alternating regimen (SMD ‐0.09; 95% CI ‐0.36 to 0.18) or the regimen of treatment with 4 weeks of combination therapy followed by 48 weeks of calcipotriol (SMD ‐0.18; 95% CI ‐0.47 to 0.10). In both these comparisons, combination therapy achieved a larger absolute benefit, but the difference was not statistically significant. When alternating therapy was compared with the regimen of 4 weeks' combination therapy followed by 48 weeks of calcipotriol, the SMD for the IAGI also indicated the two regimens were not statistically significantly different: ‐0.09 (95% CI ‐0.37 to 0.19).
Analysis 15: Vitamin D analogues versus other treatment
This comparison incorporated all other vitamin D head‐to‐head comparisons of treatments for psoriasis of the body (excluding inverse psoriasis) that had not already been included (see Analysis 15.1 and Table 18). We included 12 intervention‐comparator contrasts, with IAGI data available for 6 of these contrasts. Eight between‐patient trials and 2 within‐patient trials provided data for 1386 participants. Trial duration ranged between 4 and 12 weeks. In light of the pharmacological diversity amongst the comparators, we only pooled data within subgroups.
| Subcategory | Measure | 01 IAGI/IGA | 02 TSS | 03 PASI | 04 PAGI/PGA | 05 Combined end point |
| 01 Calcipotriol vs. coal tar | Effect size [CI] | (SMD ‐0.53; 95% CI ‐1.74 to 0.68) | ‐ | (SMD ‐0.10; 95% CI ‐1.54 to 1.35) | (SMD ‐0.10; 95% CI ‐1.54 to 1.35) | (SMD ‐0.53; 95% CI ‐1.74 to 0.68) |
| 02 Calcipotriol vs. coal tar polytherapy | Effect size [CI] | (SMD ‐0.59; 95% CI ‐0.87 to ‐0.31) | (SMD ‐0.51; 95% CI ‐0.86 to ‐0.16) | (SMD ‐0.63; 95% CI ‐1.06 to ‐0.20) | (SMD ‐0.63; 95% CI ‐1.06 to ‐0.20) | (SMD ‐0.59; 95% CI ‐0.87 to ‐0.31) |
| 03 Calcipotriol vs. nicotinamide 1.4%, BD | Effect size [CI] | ‐ | (SMD ‐0.09; 95% CI ‐0.49 to 0.31) | ‐ | ‐ | (SMD ‐0.09; 95% CI ‐0.49 to 0.31) |
| 04 Calcipotriol vs. calcipotriol + nicotinamide 1.4%, BD | Effect size [CI] | ‐ | (SMD 0.19; 95% CI ‐0.14 to 0.52) | ‐ | ‐ | (SMD 0.19; 95% CI ‐0.14 to 0.52) |
| 05 Calcipotriol vs. corticosteroid + salicylic acid | Effect size [CI] | (SMD ‐0.06; 95% CI ‐0.33 to 0.22) | ‐ | (SMD ‐0.05; 95% CI ‐0.36 to 0.26) | (SMD ‐0.49; 95% CI ‐0.79 to ‐0.20) | (SMD ‐0.05; 95% CI ‐0.26 to 0.15) |
| 06 Calcipotriol vs. propylthiouracil cream | Effect size [CI] | ‐ | ‐ | (SMD ‐2.24; 95% CI ‐3.23 to ‐1.25) | ‐ | (SMD ‐2.24; 95% CI ‐3.23 to ‐1.25) |
| 07 Calcipotriol vs. tacrolimus ointment | Effect size [CI] | ‐ | (SMD ‐0.35; 95% CI ‐1.51 to 0.81) | (SMD ‐0.13; 95% CI ‐0.51 to 0.24) | (SMD ‐0.55; 95% CI ‐1.28 to 0.17) | |
| 08 Calcipotriol vs. tazarotene | Effect size [CI] | (SMD ‐0.22; 95% CI ‐0.60 to 0.16) | (SMD ‐0.05; 95% CI ‐0.33 to 0.23) | ‐ | (SMD ‐0.35; 95% CI ‐0.99 to 0.29) | (SMD ‐0.10; 95% CI ‐0.35 to 0.16) |
| 09 Calcipotriol vs. tazarotene gel plus mometasone furoate cream | Effect size [CI] | ‐ | ‐ | ‐ | ‐ | ‐ |
| 10 Calcipotriol vs. vitamin B12 cream | Effect size [CI] | (SMD ‐0.55; 95% CI ‐1.33 to 0.24) | ‐ | (SMD ‐0.01; 95% CI ‐0.78 to 0.75) | (SMD ‐0.55; 95% CI ‐1.33 to 0.24) | (SMD ‐0.55; 95% CI ‐1.33 to 0.24) |
| 11 Head‐to‐head vitamin D alone or in combination: dosing | Effect size [CI] | (SMD ‐0.24; 95% CI ‐0.38 to ‐0.09) | ‐ | (SMD ‐0.12; 95% CI ‐0.25 to 0.00) | ‐ | (SMD ‐0.20; 95% CI ‐0.32 to ‐0.07) |
| 12 Head‐to‐head vitamin D alone or in combination: occlusion | Effect size [CI] | ‐ | (SMD ‐0.18; 95% CI ‐2.04 to 1.68) | ‐ | ‐ | (SMD ‐0.18; 95% CI ‐2.04 to 1.68) |
| All treatments | (not pooled) | ‐ | ‐ | ‐ | ‐ | ‐ |
| ‐ | No. participants | 1386 | 898 | 1228 | 456 | 2364 |
| ‐ | Between‐patient design | 8 | 5 | 6 | 3 | 13 |
| ‐ | Within‐patient design | 2 | 2 | 3 | 3 | 6 |
| ‐ | Treatment duration | 4 wks to 12 wks | 6 wks to 12 wks | 4 wks to 12 wks | 4 wks to 12 wks | 4 wks to 12 wks |
For acronyms, see Table 1.
According to the investigator's global assessment, twice‐daily calcipotriol was significantly more effective than coal tar polytherapy (SMD ‐0.59; 95% CI ‐0.87 to ‐0.31; I² statistic = 0%). Once‐daily vitamin D was significantly less effective than a twice‐daily application (SMD ‐0.24; 95% CI ‐0.38 to ‐0.09; I² statistic = 0%). This contrast included a comparison of once‐ versus twice‐daily dosing of calcipotriol (SMD ‐0.27; 95% CI ‐0.48 to ‐0.06) and a dosing comparison combination treatment with calcipotriol and betamethasone dipropionate (SMD ‐0.20; 95% CI ‐0.41 to 0.00).
In the remaining four intervention‐comparator contrasts, no significant difference was found between twice‐daily calcipotriol and the comparators. This finding held for the comparison against coal tar monotherapy (SMD ‐0.53; 95% CI ‐1.74 to 0.68; I² statistic = 91.1%), against betamethasone dipropionate ointment and salicylic acid (SMD ‐0.06; 95% CI ‐0.33 to 0.22; I² statistic = NA), against tacrolimus ointment (SMD ‐0.22; 95% CI ‐0.60 to 0.16; I² statistic = NA), and against vitamin B12 cream (SMD ‐0.55; 95% CI ‐1.33 to 0.24; I² statistic = NA).
Two of the three trials comparing calcipotriol with coal tar monotherapy found a significant difference in favour of calcipotriol; the other trial found a significant difference in favour of coal tar (Alora‐Palli 2010). This apparent contradiction may reflect different formulations of coal tar, treatment durations, or different baseline disease severity.
Analysis 16: Flexural/facial psoriasis: placebo‐controlled trials
This comparison included placebo‐controlled trials of topical treatments for inverse or facial psoriasis (see Analysis 16.1 and Table 19). Evidence on four treatments was found in this comparison: the potent steroid betamethasone valerate; the vitamin D analogue calcipotriol; and two topical calcineurin inhibitors, pimecrolimus and tacrolimus. We only found one trial that evaluated tacrolimus ointment (Lebwohl 2004), but the study did not report any effectiveness data suitable for this review. However, the study did contribute data on adverse events and withdrawal rates.
| Subcategory | Measure | 01 IAGI/IGA | 02 TSS | 03 PASI | 04 PAGI/PGA | 05 Combined end point |
| 01 Betamethasone valerate 0.1%, OD | Effect size [CI] | ‐ | ‐ | (SMD ‐2.83; 95% CI ‐3.79 to ‐1.88) | ‐ | (SMD ‐2.83; 95% CI ‐3.79 to ‐1.88) |
| 02 Calcipotriol ointment, OD | Effect size [CI] | ‐ | ‐ | (SMD ‐1.08; 95% CI ‐1.77 to ‐0.40) | ‐ | (SMD ‐1.08; 95% CI ‐1.77 to ‐0.40) |
| 03 Pimecrolimus cream, 1% OD/BD | Effect size [CI] | (SMD ‐1.07; 95% CI ‐1.69 to ‐0.45) | (SMD ‐1.37; 95% CI ‐1.95 to ‐0.79) | (SMD ‐0.62; 95% CI ‐1.27 to 0.02) | (SMD ‐0.65; 95% CI ‐1.24 to ‐0.06) | (SMD ‐0.86; 95% CI ‐1.30 to ‐0.41) |
| 04 Tacrolimus ointment 0.1%, BD | Effect size [CI] | ‐ | ‐ | ‐ | ‐ | ‐ |
| All treatments | (no pooling) | ‐ | ‐ | ‐ | ‐ | ‐ |
| ‐ | No. participants | 47 | 57 | 75 | 47 | 122 |
| ‐ | Between‐patient design | 1 | 1 | 1 | 1 | 2 |
| ‐ | Within‐patient design | 0 | 0 | 0 | 0 | 0 |
| ‐ | Treatment duration | 8 wks | 8 wks | 4 wks | 8 wks | 4 wks to 8 wks |
For acronyms, see Table 1.
IAGI outcome data were available for one of the four topical treatments for inverse psoriasis. One 8‐week between‐patient study with 47 participants (Gribetz 2004) reported placebo‐controlled data on pimecrolimus 1% cream, which demonstrated a statistically significant difference in favour of twice‐daily pimecrolimus (SMD ‐1.07; 95% CI ‐1.69 to ‐0.45).
Analysis 17: Flexural/facial psoriasis: vitamin D alone or in combination versus other treatment
This comparison included head‐to‐head trials of treatments for inverse psoriasis, which compared vitamin D with an active control (see Analysis 17.1 and Table 20). We identified five intervention‐comparator contrasts. Four treatments were compared with calcipotriol: once‐daily betamethasone valerate, combined treatment with calcipotriol and hydrocortisone, calcitriol, and pimecrolimus. Calcitriol was compared with tacrolimus.
| Subcategory | Measure | 01 IAGI/IGA | 02 TSS | 03 PASI | 04 PAGI/PGA | 05 Combined end point |
| 01 Calcipotriol vs. BMV | Effect size [CI] | ‐ | ‐ | (SMD 2.02; 95% CI 1.20 to 2.84) | ‐ | (SMD 2.02; 95% CI 1.20 to 2.84) |
| 02 Calcipotriol vs. calcipotriol + hydrocortisone | Effect size [CI] | (SMD 0.30; 95% CI 0.11 to 0.50) | ‐ | (SMD 0.32; 95% CI 0.12 to 0.51) | ‐ | (SMD 0.30; 95% CI 0.11 to 0.50) |
| 03 Calcipotriol vs. calcitriol | Effect size [CI] | ‐ | (SMD 0.61; 95% CI 0.28 to 0.94) | ‐ | ‐ | (SMD 0.61; 95% CI 0.28 to 0.94) |
| 04 Calcipotriol vs. pimecrolimus | Effect size [CI] | ‐ | ‐ | (SMD ‐0.53; 95% CI ‐1.17 to 0.11) | (SMD ‐0.53; 95% CI ‐1.17 to 0.11) | |
| 05 Calcitriol vs. tacrolimus | Effect size [CI] | (SMD 0.42; 95% CI ‐0.15 to 0.98) | (SMD 0.29; 95% CI ‐0.27 to 0.85) | ‐ | ‐ | (SMD 0.42; 95% CI ‐0.15 to 0.98) |
| All treatments | (no pooling) | ‐ | ‐ | ‐ | ‐ | ‐ |
| ‐ | No. participants | 457 | 124 | 464 | 0 | 588 |
| ‐ | Between‐patient design | 2 | 1 | 2 | 0 | 3 |
| ‐ | Within‐patient design | 0 | 1 | 0 | 0 | 1 |
| ‐ | Treatment duration | 6 wks to 8 wks | 6 wks | 4 wks to 8 wks | 0 | 4 wks to 8 wks |
For acronyms, see Table 1.
Two between‐patient studies contributed IAGI data from 457 study participants on 2 of the 5 intervention‐comparator contrasts. Trial duration ranged from six to eight weeks. When applied once daily to inverse psoriasis, calcipotriol was significantly less effective than combined treatment with calcipotriol and hydrocortisone (SMD 0.30; 95% CI 0.11 to 0.50) (Ortonne 2010). However, there was no significant difference in effect between twice daily treatment with calcitriol and tacrolimus (SMD 0.42; 95% CI ‐0.15 to 0.98) (Liao 2007).
Analysis 18: Scalp psoriasis: placebo‐controlled trials
This comparison included placebo‐controlled trials of treatments for scalp psoriasis (see Analysis 18.1 and Table 21). We included evidence on 11 treatments in this comparison, with IAGI data available for 9 treatments. Ten trials, 9 of which were between‐patient studies, contributed data from 2472 participants. One study was a within‐patient trial (Lepaw 1978). Trial duration ranged between two and eight weeks. IAGI data were not available for betamethasone valerate or ciclopirox olamine shampoo.
| Subcategory | Measure | 01 IAGI/IGA | 02 TSS | 03 PASI | 04 PAGI/PGA | 05 Combined end point |
| 01 Vitamin D: calcipotriol | Effect size [CI] | (SMD ‐0.72; 95% CI ‐1.28 to ‐0.16) | (SMD ‐0.44; 95% CI ‐0.64 to ‐0.25) | ‐ | (SMD ‐0.66; 95% CI ‐1.28 to ‐0.05) | (SMD ‐0.72; 95% CI ‐1.28 to ‐0.16) |
| 02 Potent steroid: betamethasone dipropionate | Effect size [CI] | (SMD ‐1.09; 95% CI ‐1.29 to ‐0.90) | (SMD ‐1.00; 95% CI ‐1.19 to ‐0.81) | ‐ | (SMD ‐1.23; 95% CI ‐1.43 to ‐1.03) | (SMD ‐1.09; 95% CI ‐1.29 to ‐0.90) |
| 03 Potent steroid: betamethasone valerate | Effect size [CI] | ‐ | (SMD ‐1.40; 95% CI ‐1.75 to ‐1.05) | ‐ | ‐ | (SMD ‐1.40; 95% CI ‐1.75 to ‐1.05) |
| 04 Very potent steroid: amcinonide | Effect size [CI] | (SMD ‐1.42; 95% CI ‐1.80 to ‐1.04) | (SMD ‐1.58; 95% CI ‐1.98 to ‐1.18) | ‐ | (SMD ‐0.97; 95% CI ‐1.33 to ‐0.61) | (SMD ‐1.42; 95% CI ‐1.80 to ‐1.04) |
| 05 Very potent steroid: clobetasol propionate | Effect size [CI] | (SMD ‐1.73; 95% CI ‐1.99 to ‐1.48) | (SMD ‐1.53; 95% CI ‐1.77 to ‐1.28) | ‐ | ‐ | (SMD ‐1.57; 95% CI ‐1.81 to ‐1.34) |
| 06 Very potent steroid: halcinonide | Effect size [CI] | (SMD ‐1.11; 95% CI ‐1.69 to ‐0.53) | ‐ | ‐ | ‐ | (SMD ‐1.11; 95% CI ‐1.69 to ‐0.53) |
| 07 Vitamin D in combination: calcipotriol + BMD | Effect size [CI] | (SMD ‐0.97; 95% CI ‐1.61 to ‐0.32) | (SMD ‐0.92; 95% CI ‐1.42 to ‐0.43) | ‐ | (SMD ‐1.00; 95% CI ‐1.79 to ‐0.22) | (SMD ‐0.97; 95% CI ‐1.61 to ‐0.32) |
| 08 Other treatment: betamethasone‐17,21‐dipropionate plus salicylic acid | Effect size [CI] | (SMD ‐1.48; 95% CI ‐2.50 to ‐0.47) | (SMD ‐1.15; 95% CI ‐2.11 to ‐0.19) | ‐ | ‐ | (SMD ‐1.48; 95% CI ‐2.50 to ‐0.47) |
| 09 Other treatment: ciclopirox olamine shampoo | Effect size [CI] | ‐ | (SMD ‐0.07; 95% CI ‐0.82 to 0.68) | ‐ | (SMD ‐0.11; 95% CI ‐0.86 to 0.64) | (SMD ‐0.07; 95% CI ‐0.82 to 0.68) |
| 10 Other treatment: fluocinolone acetonide, plus occlusion | Effect size [CI] | (SMD ‐1.22; 95% CI ‐1.69 to ‐0.76) | (SMD ‐0.89; 95% CI ‐1.34 to ‐0.44) | ‐ | ‐ | (SMD ‐1.22; 95% CI ‐1.69 to ‐0.76) |
| 11 Other treatment: salicylic acid | Effect size [CI] | (SMD ‐0.86; 95% CI ‐1.79 to 0.06) | (SMD ‐0.57; 95% CI ‐1.47 to 0.32) | ‐ | ‐ | (SMD ‐0.86; 95% CI ‐1.79 to 0.06) |
| All treatments | No. participants | 2472 | 2897 | 0 | 1875 | 3011 |
| ‐ | Between‐patient design | 9 | 12 | 0 | 5 | 13 |
| ‐ | Within‐patient design | 1 | 0 | 0 | 0 | 1 |
| ‐ | Treatment duration | 2 wks to 8 wks | 2 wks to 8 wks | ‐ | 3 wks to 8 wks | 2 wks to 8 wks |
| Sensitivity analysis: potent corticosteroids | Effect size [CI]; I² statistic | ‐ | ‐ | ‐ | ‐ | (SMD ‐1.18; 95% CI ‐1.40 to ‐0.96); I² statistic: 19.9% |
| Sensitivity analysis: very potent corticosteroids | Effect size [CI]; I² statistic | ‐ | ‐ | ‐ | ‐ | (SMD ‐1.51; 95% CI ‐1.70 to ‐1.31); I² statistic: 37.5% |
For acronyms, see Table 1.
Eight treatments for scalp psoriasis that were assessed using the IAGI scale were significantly more effective than placebo. The least effective treatment was calcipotriol (SMD ‐0.72; 95% CI ‐1.28 to ‐0.16; I² statistic = 69.2%), and the most effective treatment was clobetasol propionate (SMD ‐1.73; 95% CI ‐1.99 to ‐1.48; I² statistic = 14.3%). Combination treatment with calcipotriol and betamethasone dipropionate was also effective (SMD ‐0.97; 95% CI ‐1.61 to ‐0.32; I² statistic = 90.2%). Data from the three very potent corticosteroids were pooled (amcinonide, clobetasol propionate, halcinonide). The SMD across these treatments was ‐1.57 (95% CI ‐1.85 to ‐1.28; I² statistic = 49.7%). Only salicylic acid was not significantly more effective than placebo (SMD ‐0.86; 95% CI ‐1.79 to 0.06).
Analysis 19: Scalp psoriasis: vitamin D alone or in combination versus other treatment
This comparison included head‐to‐head trials of treatments for scalp psoriasis in which one of the interventions was a vitamin D product (used either as monotherapy or in combination with another product) (see Analysis 19.1 and Table 22). We identified six intervention‐comparator contrasts, and IAGI data were available for five of these contrasts. All studies were parallel‐group in design (between‐patient). Ten studies contributed IAGI data from 5175 participants, and trial duration ranged from 4 to 52 weeks.
| Subcategory | Measure | 01 IAGI/IGA | 02 TSS | 03 PASI | 04 PAGI/PGA | 05 Combined end point |
| 01 Vitamin D vs. corticosteroid (potent): calcipotriol vs. BMD | Effect size [CI] | (SMD 0.48; 95% CI 0.32 to 0.64) | (SMD 0.45; 95% CI 0.28 to 0.63) | ‐ | (SMD 0.56; 95% CI 0.31 to 0.81) | (SMD 0.48; 95% CI 0.32 to 0.64) |
| 02 Vitamin D vs. corticosteroid (potent): calcipotriol vs. BMV | Effect size [CI] | (SMD 0.37; 95% CI 0.20 to 0.55) | (SMD 0.09; 95% CI ‐0.09 to 0.27) | ‐ | (SMD 0.41; 95% CI 0.22 to 0.59) | (SMD 0.37; 95% CI 0.20 to 0.55) |
| 03 Vitamin D vs. corticosteroid (very potent): calcipotriol vs. clobetasol propionate | Effect size [CI] | ‐ | (SMD 0.37; 95% CI 0.05 to 0.69) | ‐ | ‐ | (SMD 0.37; 95% CI 0.05 to 0.69) |
| 04 Vitamin D + corticosteroid vs. corticosteroid: calcipotriol + BMD vs. BMD | Effect size [CI] | (SMD ‐0.18; 95% CI ‐0.26 to ‐0.10) | (SMD ‐0.19; 95% CI ‐0.27 to ‐0.11) | ‐ | (SMD ‐0.17; 95% CI ‐0.25 to ‐0.09) | (SMD ‐0.18; 95% CI ‐0.26 to ‐0.10) |
| 05 Vitamin D vs. vitamin D + corticosteroid: calcipotriol vs. calcipotriol + BMD | Effect size [CI] | (SMD 0.64; 95% CI 0.44 to 0.84) | (SMD 0.70; 95% CI 0.56 to 0.84) | ‐ | (SMD 0.84; 95% CI 0.61 to 1.08) | (SMD 0.64; 95% CI 0.44 to 0.84) |
| 06 Vitamin D vs. other treatments: calcipotriol vs. coal tar polytherapy | Effect size [CI] | (SMD ‐0.24; 95% CI ‐0.73 to 0.25) | (SMD ‐0.30; 95% CI ‐0.84 to 0.24) | ‐ | ‐ | (SMD ‐0.45; 95% CI ‐0.92 to 0.02) |
| All treatments | No. participants | 5175 | 4877 | 0 | 3742 | 5413 |
| ‐ | Between‐patient design | 10 | 11 | 0 | 6 | 12 |
| ‐ | Within‐patient design | 0 | 0 | 0 | 0 | 0 |
| ‐ | Treatment duration | 4 wks to 52 wks | 4 wks to 8 wks | 0 | 4 wks to 8 wks | 4 wks to 52 wks |
For acronyms, see Table 1.
Vitamin D for scalp psoriasis was significantly less effective than potent steroids, either alone or in combination with vitamin D. Specifically, calcipotriol was less effective than three comparator treatments: betamethasone dipropionate (SMD 0.48; 95% CI 0.32 to 0.64; I² statistic = 60.4%), betamethasone valerate (SMD 0.37; 95% CI 0.20 to 0.55; I² statistic = 0%), and combination treatment with calcipotriol and betamethasone dipropionate (SMD 0.64; 95% CI 0.44 to 0.84; I² statistic = 82.3%). Combination treatment (calcipotriol/betamethasone dipropionate) was significantly more effective than betamethasone dipropionate alone (SMD ‐0.18; 95% CI ‐0.26 to ‐0.10; I² statistic = 0%). The efficacy of calcipotriol and coal tar polytherapy was similar: SMD ‐0.24 (95% CI ‐0.73 to 0.25; I² statistic = 91.1%).
(b) Total Severity Scores (TSS)
Analysis 1: Vitamin D analogues versus placebo
Our review included eight vitamin D analogues for body psoriasis in this comparison (see Analysis 1.2 and Table 5). Nineteen studies reported TSS data with 2647 participants contributing data. Nine trials were between‐patient design, and 10 were within‐patient studies. Treatment duration ranged from 4 weeks to 12 weeks. The average effect size across all 8 treatments for TSS was ‐1.04; (95% CI ‐1.33 to ‐0.74; I² statistic = 93.0%), but two of these treatments were not significantly more effective than placebo. The high level of heterogeneity means that the estimated average benefit should be treated with caution; there was considerable variation between effective treatments, with the TSS ranging from ‐0.46 (becocalcidiol twice daily) to ‐2.15 (paricalcitol once daily). Therefore, we removed pooling across subgroups (Higgins 2011).
Four studies contributed data for the SMD for the TSS of calcitriol (SMD ‐1.22; 95% CI ‐2.38 to ‐0.07), but there was considerable heterogeneity within the subgroup (I² statistic = 98.3%). One of the studies (Van de Kerkhof 1989) found no statistically significant difference between calcitriol and placebo (SMD ‐0.06; 95% CI ‐0.94 to 0.81), whereas the study by Perez 1996 found a large and statistically significant difference (‐4.03; 95% CI ‐4.56 to ‐3.50). We considered this finding in more detail in the 'combined end point' section (e) below.
Analysis 2: Corticosteroid (potent) versus placebo
Our review included 10 potent corticosteroids for body psoriasis in this comparison (see Analysis 2.2 and Table 6). Seven studies reported TSS data contributed by 553 participants on 8 of these 10 treatments. Six trials were between‐patient studies, and there was one within‐patient design (Ormerod 1997). Treatment duration ranged from 2 to 12 weeks. The average effect size across all 8 treatments for TSS was ‐0.77 (95% CI ‐1.01 to ‐0.52; I² statistic = 46.7%). We found all treatments, except for diflorasone diacetate, to be statistically significantly superior to placebo: SMD ‐0.32; 95% CI ‐0.73 to 0.09).
Analysis 3: Corticosteroid (very potent) versus placebo
Of the three very potent corticosteroids for body psoriasis included in this comparison, TSS data were available only for clobetasol propionate (see Analysis 3.2 and Table 7). Three studies, all of which were between‐patient trials, reported TSS data for 545 participants. Treatment duration ranged from two to four weeks. The SMD for the TSS was ‐1.35 (95% CI ‐1.80 to ‐0.89; I² statistic = 75.3%). In Analysis 18.2, we reported TSS data on the use of very potent steroids on the scalp.
Analysis 4: Dithranol versus placebo
This comparison considered dithranol against placebo (see Analysis 4.2 and Table 23). Three within‐patient trials reported TSS data for 47 participants. Treatment duration ranged from three to eight weeks. The SMD for the TSS was ‐1.06 (95% CI ‐1.66 to ‐0.46; I² statistic = 37.4%).
| Subcategory | Measure | 01 IAGI/IGA | 02 TSS | 03 PASI | 04 PAGI/PGA | 05 Combined end point |
| 01 Dithranol | Effect size [CI], N, I² statistic | ‐ | (SMD ‐1.06; 95% CI ‐1.66 to ‐0.46); I² statistic: 37.4% | ‐ | ‐ | (SMD ‐1.06; 95% CI ‐1.66 to ‐0.46); I² statistic: 37.4% |
| ‐ | No. participants | 0 | 47 | 0 | 0 | 47 |
| ‐ | Between‐patient design | 0 | 0 | 0 | 0 | 0 |
| ‐ | Within‐patient design | 0 | 3 | 0 | 0 | 3 |
| ‐ | Treatment duration | 3 wks to 8 wks | ‐ | ‐ | 3 wks to 8 wks | |
| ‐ | correlation coefficient (rho) = 0 All trials | ‐ | ‐ | ‐ | (SMD ‐0.98; 95% CI ‐1.56 to ‐0.41) I² statistic: 13.9% | |
| ‐ | rho = 0 Btw‐patient trials rho = 0.25 Within‐patient trials | ‐ | ‐ | ‐ | ‐ | (SMD ‐1.05; 95% CI ‐1.67 to ‐0.44) I² statistic: 35.4% |
| ‐ | rho = 0 Btw‐patient trials rho = 0.50 Within‐patient trials | ‐ | ‐ | ‐ | ‐ | (SMD ‐1.12; 95% CI ‐1.75 to ‐0.48) I² statistic: 56.9% |
| ‐ | rho = 0 Btw‐patient trials rho = 0.75 Within‐patient trials | ‐ | ‐ | ‐ | ‐ | (SMD ‐1.17; 95% CI ‐1.81 to ‐0.52) I² statistic: 78.5% |
For acronyms, see Table 1.
Analysis 5: Vitamin D combination products versus placebo
Our review did not identify any trial reporting TSS data for this comparison.
Analysis 6: Other treatment versus placebo
This comparison comprised all other treatments for body psoriasis that were not included in the first five comparisons. None of the studies assessed the same treatment, which means that findings should be interpreted with caution.
In total, we included 26 treatments in this analysis (see Analysis 6.2 and Table 9). Seventeen studies with 907 participants reported TSS data on 17 of these 26 treatments. Five trials were between‐patient design, and 12 were within‐patient studies. Treatment duration ranged from 3 to 12 weeks.
Ten treatments performed significantly better than placebo: anti‐IL‐8 monoclonal antibody cream, calcipotriene 0.005% ointment + nicotinamide, fish oil plus occlusion, hexafluoro‐1,25‐dihydroxyvitamin D3, indigo naturalise 1.4% ointment, methotrexate gel, mycophenolic acid ointment, oleum horwathiensis, PTH (1‐34) in Novasome cream®, and tazarotene. The effect size for the TSS ranged from ‐0.48 (Levine 2010 (P); calcipotriene 0.005% ointment + nicotinamide) to ‐2.31 (Holick 2003; PTH (1‐34) in Novasome cream®).
In seven treatments, the difference relative to placebo was not statistically significant: kukui nut oil, NG‐monomethyl‐L‐arginine (L‐NMMA) cream, nicotinamide 1.4%, polymyxin B cream, topical sirolimus, topical tacrolimus, and tar.
Analysis 7: Vitamin D analogues versus corticosteroid (potent)
There were eight vitamin D analogue‐potent corticosteroid comparisons for body psoriasis (see Analysis 7.2 and Table 10). Six studies with 891 participants reported TSS data for 5 of the 8 intervention‐comparator contrasts. Two trials were between‐patient design, and four were within‐patient studies. Treatment duration ranged from three to six weeks. The SMD across all 5 treatments for TSS indicated that there was no significant difference between the vitamin D derivatives and potent corticosteroid: SMD 0.11 (95% CI ‐0.22 to 0.44; I² statistic = 86.7%). However, there was considerable variation between the individual contrasts underlying the pooled effect. In light of this heterogeneity, we removed pooling (Higgins 2011).
In two of the five vitamin D‐potent corticosteroid comparisons, the vitamin D analogue performed statistically significantly better than the potent corticosteroid: The SMD for calcipotriol against fluocinonide 0.05% ointment was ‐0.50 (95% CI ‐0.92 to ‐0.07; I² statistic = NA) (Bruce 1994). Similarly, the comparison of calcipotriol against betamethasone valerate showed a significant difference in favour of calcipotriol (SMD ‐0.26; 95% CI ‐0.41 to ‐0.11), a finding also based on a single study (Kragballe 1991a).
In three comparisons, the vitamin D analogue was statistically significantly less effective than the potent corticosteroid: calcipotriol versus diflorasone diacetate (SMD 0.40; 95% CI 0.15 to 0.65), calcitriol versus betamethasone dipropionate (SMD 0.27; 95% CI 0.02 to 0.51), and tacalcitol versus betamethasone valerate (SMD 0.41; 95% CI 0.09 to 0.74).
Analysis 8: Vitamin D analogues versus corticosteroid (very potent)
Our review did not identify any study of psoriasis of the body that compared vitamin D analogues against very potent corticosteroids and that reported TSS data.
Analysis 9: Vitamin D combined with corticosteroid versus corticosteroid
This comparison considered vitamin D analogues‐steroid combination against potent or very potent corticosteroid for body psoriasis (see Analysis 9.2 and Table 12). One four‐week between‐patient trial reported TSS data for 122 participants with moderate to severe psoriasis (Menter 2009). The combined treatment with calcipotriol and betamethasone dipropionate was found to be significantly less effective than clobetasol propionate spray alone (0.45; 95% CI 0.09 to 0.81).
Analysis 10: Vitamin D alone or in combination versus dithranol
This comparison considered vitamin D analogues against dithranol (see Analysis 10.2 and Table 13). We identified three intervention‐comparator contrasts: calcipotriol versus dithranol, calcitriol versus dithranol, and tacalcitol versus dithranol. Three between‐patient trials and 1 within‐patient trial (Grattan 1997 (H)) reported TSS data for 386 participants. Treatment duration ranged from four weeks to eight weeks. There was some variation in the dithranol regimens employed by trials and in the baseline severity of trial participants. These factors may help explain the substantial heterogeneity found in the pooled results (Higgins 2011).
The SMD for the TSS was ‐0.27 (95% CI ‐0.73 to 0.20; I² statistic = 80.6%). Data from two trials contributed to the SMD for the calcipotriol versus dithranol: ‐0.54 (95% CI ‐1.16 to 0.08; I² statistic = 71.2%) (Christensen 1999; Grattan 1997 (H)). Data from one trial contributed to the SMD for the calcitriol versus dithranol: 0.13 (95% CI ‐0.24 to 0.50; I² statistic = NA) (Hutchinson 2000). Data from one trial contributed to the SMD for the tacalcitol versus dithranol: ‐0.18 (95% CI ‐0.60 to 0.25; I² statistic = NA) (Farkas 1999). Therefore, neither the summary statistic for the TSS nor the pooled data for individual intervention‐comparator contrasts provided evidence of a statistically significant advantage of a vitamin D analogue over dithranol or vice versa.
Analysis 11: Vitamin D alone or in combination versus other vitamin D analogue
Our review identified three intervention‐comparator contrasts for body psoriasis in this comparison: calcipotriol versus calcitriol, calcipotriol versus tacalcitol, and calcipotriol versus maxacalcitol (see Analysis 11.2 and Table 14). Three trials involving 563 participants contributed TSS data for all 3 of these intervention‐comparator contrasts. Two trials were between‐patient, and one was within‐patient in design (Barker 1999 (H)). Treatment duration ranged from 8 to 12 weeks. The SMD for the TSS indicated that there was a statistically significant difference in favour of calcipotriol: SMD ‐0.31; 95% CI ‐0.55 to ‐0.06; I² statistic = 46.9%. When assessed by the TSS, calcipotriol was statistically significantly more effective than calcitriol (SMD ‐0.32; 95% CI ‐0.57 to ‐0.07). This finding contrasts with the IAGI assessment from the same study, which found no significant difference (see Ji 2008;Analysis 11.1). Calcipotriol was also significantly more effective than tacalcitol (SMD ‐0.45; 95% CI ‐0.68 to ‐0.22) and similar in efficacy relative to maxacalcitol (SMD 0.13; 95% CI ‐0.41 to 0.68).
Analysis 12: Vitamin D alone or in combination versus vitamin D + corticosteroid
Our review identified 12 intervention‐comparator contrasts for body psoriasis, involving 3 vitamin D analogues, 2 combination products, and 7 different corticosteroids (see Analysis 12.1 and Table 15). One 4‐week parallel‐group trial contributed TSS data from 301 participants for 1 of these 12 intervention‐comparator contrasts (Huang 2009). Twice‐daily calcipotriol was found to be statistically significantly less effective than once‐daily treatment with a combined product containing calcipotriol and betamethasone dipropionate (SMD 0.25; 95% CI 0.03 to 0.48).
Analysis 13: Vitamin D alone or in combination versus other treatments: complex regimens
This comparison summarises findings on complex regimens for body psoriasis, defined here as treatment sequences that do not consist of a simple head‐to‐head comparison between two active treatments (see Analysis 13.2 and Table 16). We identified 12 intervention‐comparator contrasts and TSS data were available for one of these. Data from 1 6‐week within‐patient trial with 46 participants (Austad 1998) contributed to the TSS analysis. Austad 1998 compared six weeks of twice‐daily calcipotriol with a regimen of two weeks' treatment with clobetasol propionate followed by four weeks with calcipotriol. The complex regimen was significantly more effective than monotherapy with calcipotriol (SMD 0.63; 95% CI 0.21 to 1.05).
Analysis 14: Vitamin D alone or in combination versus other treatment: long‐term studies (> 24 weeks)
We did not identify any relevant study that provided TSS data for this comparison.
Analysis 15: Vitamin D analogues versus other treatment
This comparison incorporated all other vitamin D head‐to‐head comparisons of treatments for psoriasis of the body (excluding inverse psoriasis) that had not already been included (see Analysis 15.2 and Table 18). We included 12 intervention‐comparator contrasts, with TSS data available for 6 of these contrasts. Five between‐patient trials and 2 within‐patient trials provided data from 898 participants. Trial duration ranged between 6 and 12 weeks. In light of the pharmacological diversity of the comparators, we only pooled data within subgroups.
According to the TSS assessment, twice‐daily calcipotriol was significantly more effective than coal tar polytherapy (SMD ‐0.51; 95% CI ‐0.86 to ‐0.16; I² statistic = NA). In the remaining five intervention‐comparator contrasts, we found no significant difference between twice‐daily calcipotriol and the comparators.
Analysis 16: Flexural/facial psoriasis: placebo‐controlled trials
This comparison included placebo‐controlled trials of topical treatments for inverse or facial psoriasis (see Analysis 16.2 and Table 19). Evidence on four treatments was found in this comparison: the potent steroid betamethasone valerate; the vitamin D analogue calcipotriol; and two topical calcineurin inhibitors, pimecrolimus and tacrolimus. We found only one placebo‐controlled trial that evaluated tacrolimus ointment (Lebwohl 2004), but the study did not report any effectiveness data suitable for this review. However, the study did contribute data on adverse events and withdrawal rates.
TSS data were available for one of the four topical treatments for inverse psoriasis. One 8‐week between‐patient study contributed data on pimecrolimus 1% cream from 57 participants (Gribetz 2004), 10 participants more than those with an investigator's assessment (see Analysis 16.1). Findings from the TSS were consistent with those of the IAGI: the SMD for the TSS also found a statistically significant difference in favour of twice‐daily pimecrolimus (SMD ‐1.37; 95% CI ‐1.95 to ‐0.79).
Analysis 17: Flexural/facial psoriasis: vitamin D alone or in combination versus other treatment
This comparison included head‐to‐head trials of treatments for inverse psoriasis, which compared vitamin D with an active control (see Analysis 17.2 and Table 20). We identified five intervention‐comparator contrasts. Four treatments were compared with calcipotriol: once‐daily betamethasone valerate, combined treatment with calcipotriol and hydrocortisone, calcitriol, and pimecrolimus. Calcitriol was compared with tacrolimus.
Two 6‐week studies contributed TSS data from 124 study participants on 2 of the 5 intervention‐comparator contrasts. Calcipotriol was significantly less effective than calcitriol (SMD 0.61; 95% CI 0.28 to 0.94) (Ortonne 2003). In this within‐patient study, participants applied treatments twice daily to 'sensitive areas', including the face, hairline, retro‐auricular, and flexural areas. When they applied treatments to the facial and genitofemoral areas, there was no significant difference in effect between twice‐daily treatment with calcitriol and tacrolimus (SMD 0.29; 95% CI ‐0.27 to 0.85) (Liao 2007). In this between‐patient study, participants applied both treatments twice daily.
Analysis 18: Scalp psoriasis: placebo‐controlled trials
This comparison included placebo‐controlled trials of treatments for scalp psoriasis (see Analysis 18.2 and Table 21). We included evidence on 11 treatments in this comparison, with TSS data available for 10 treatments. Twelve between‐patient trials contributed data from 2897 participants. Trial duration ranged between two and eight weeks. TSS data were not available for halcinonide (classed as a very potent corticosteroid).
Eight of the 10 treatments for scalp psoriasis that were assessed using the TSS scale were significantly more effective than placebo. The least effective treatment was calcipotriol (SMD ‐0.44; 95% CI ‐0.64 to ‐0.25; I² statistic = 0%), and the most effective were the 2 very potent steroids, amcinonide (SMD ‐1.58; 95% CI ‐1.98 to ‐1.18) and clobetasol propionate (SMD ‐1.53; 95% CI ‐1.77 to ‐1.28; I² statistic = 46.3%). Combination treatment with calcipotriol and betamethasone dipropionate was also effective (SMD ‐0.92; 95% CI ‐1.42 to ‐0.43; I² statistic = 83.2%).
We pooled data from the two potent corticosteroids, betamethasone valerate and betamethasone dipropionate (SMD ‐1.13; 95% CI ‐1.44 to ‐0.81; I² statistic = 52.2%). We also pooled data from the two very potent corticosteroids, amcinonide and clobetasol propionate (SMD ‐1.55; 95% CI ‐1.73 to ‐1.37; I² statistic = 19.6%).
Two treatments were not significantly different to placebo: ciclopirox olamine shampoo (SMD ‐0.07; 95% CI ‐0.82 to 0.68) and salicylic acid (SMD ‐0.57; 95% CI ‐1.47 to 0.32).
Analysis 19: Scalp psoriasis: vitamin D alone or in combination versus other treatment
This comparison included head‐to‐head trials of treatments for scalp psoriasis in which one of the interventions was a vitamin D product (used either as monotherapy or in combination with another product) (see Analysis 19.2 and Table 22).
We identified six intervention‐comparator contrasts, and TSS data were available for all six of these contrasts. All studies were parallel‐group in design (between‐patient). Eleven studies contributed TSS data from 4877 participants, and trial duration ranged from 4 to 8 weeks.
Based on Total Severity Scores, calcipotriol was significantly less effective than betamethasone dipropionate (SMD 0.45; 95% CI 0.28 to 0.63; I² statistic = 66.3%), clobetasol propionate (SMD 0.37; 95% CI 0.05 to 0.69; I² statistic = NA), and combination treatment with calcipotriol and betamethasone dipropionate (SMD 0.70; 95% CI 0.56 to 0.84; I² statistic = 49.6%). There was no statistically significant difference between calcipotriol and betamethasone valerate (SMD 0.09; 95% CI ‐0.09 to 0.27; I² statistic = 0%). Combination treatment (calcipotriol/betamethasone dipropionate) was significantly more effective than betamethasone dipropionate alone (SMD ‐0.19; 95% CI ‐0.27 to ‐0.11; I² statistic = 0%). The efficacy of calcipotriol and coal tar polytherapy was not significantly different (SMD ‐0.30; 95% CI ‐0.84 to 0.24; I² statistic = 93.1%).
(c) Psoriasis Area and Severity Index (PASI)
Analysis 1: Vitamin D analogues versus placebo
Our review included eight vitamin D analogues for body psoriasis in this comparison (see Analysis 1.3 and Table 5). Nine studies reported PASI data, with 2357 participants contributing data on 2 (calcipotriol and tacalcitol) of these 8 treatments. Eight trials were between‐patient design, and one was a within‐patient study (Dubertret 1992). Treatment duration ranged from three weeks to eight weeks. The average effect size across the 2 treatments for PASI was SMD ‐0.58 (95% CI ‐0.71 to ‐0.45; I² statistic = 42.3%).
Analysis 2: Corticosteroid (potent) versus placebo
Our review included 10 potent corticosteroids for body psoriasis in this comparison (see Analysis 2.3 and Table 6). Three between‐patient studies reported PASI data from 1158 participants on once‐daily or twice‐daily doses of betamethasone dipropionate (2 of the 10 potent steroid regimens considered in this group). Trial duration ranged between four and eight weeks. The average PASI effect size across both application frequencies was ‐0.97 (95% CI ‐1.31 to ‐0.62; I² statistic = 79.6%).
Analysis 3: Corticosteroid (very potent) versus placebo
Our review did not identify any study that compared very potent corticosteroids against placebo and also reported PASI data. This may be because whole‐body application of very potent corticosteroids is not recommended, so a whole‐body assessment measure like the PASI is inappropriate.
Analysis 4: Dithranol versus placebo
Our review did not identify any study that compared dithranol against placebo and also reported PASI data.
Analysis 5: Vitamin D combination products versus placebo
This comparison included treatment with combined calcipotriol and betamethasone dipropionate used either once or twice daily on the body (see Analysis 5.3 and Table 8). Five parallel‐group studies with 2056 participants contributed PASI data on both dosing options. Treatment duration ranged from four to eight weeks. The PASI SMD across treatments was ‐1.24 (95% CI ‐1.53 to ‐0.95; I² statistic = 87.6%). Although twice‐daily combination treatment (SMD ‐1.41; 95% CI ‐1.86 to ‐0.97) achieved a larger effect than once‐daily treatment (SMD ‐1.14; 95% CI ‐1.57 to ‐0.70), the difference was not statistically significant at the 5% level. This finding contrasts with the assessment of the relative benefit of once‐ versus twice‐daily dosing using the IAGI metric (see Analysis 5.1).
Analysis 6: Other treatment versus placebo
This comparison comprised all other treatments for body psoriasis that were not included in the first five comparisons; therefore, we removed pooling. None of the studies assessed the same treatment, which means that findings should be interpreted with caution.
In total, we included 26 treatments in this analysis (see Analysis 6.3 and Table 9). Nine studies with 529 participants reported PASI data on 9 of these 26 treatments. Eight trials were between‐patient studies, and one was within‐patient in design (Vali 2005). Treatment duration ranged from 2 to 12 weeks.
Six treatments performed statistically significantly better than placebo: aloe vera extract, betamethasone 17‐valerate 21‐acetate plus tretinoin plus salicylic acid, a herbal skin care product, Mahonia aquifolium, methotrexate gel, and theophylline ointment. Effects sizes ranged from ‐0.54 (95% CI ‐0.99 to ‐0.10) for the betamethasone 17‐valerate 21 product (Santoianni 2001) to ‐2.96 (95% CI ‐4.19 to ‐1.74) for the herbal skin care treatment (Maier 2004).
In three treatments, we found no statistically significant difference relative to placebo in the PASI assessments. These comprised topical caffeine (Vali 2005), dead sea salts emollient lotion (Cheesbrough 1992), and kukui nut oil (Brown 2005).
Analysis 7: Vitamin D analogues versus corticosteroid (potent)
Our review identified eight vitamin D analogue‐potent corticosteroid comparisons for body psoriasis (see Analysis 7.3 and Table 10). Nine studies with 3185 participants reported PASI data for 4 of the 8 intervention‐comparator contrasts. Seven trials were between‐patient design, and two were within‐patient studies. Treatment duration ranged from four to eight weeks. The PASI SMD across all four intervention‐comparator contrasts indicated that there was no statistically significant difference between the vitamin D derivatives and potent corticosteroid (SMD 0.12; 95% CI ‐0.07 to 0.32; I² statistic = 86.2%).
In one vitamin D analogue versus potent corticosteroid comparison, the vitamin D analogue performed statistically significantly better than the potent corticosteroid: four studies contributed data to analysis of calcipotriol versus betamethasone valerate (SMD ‐0.12; 95% CI ‐0.22 to ‐0.02; I² statistic = 0%).
In two intervention‐comparator contrasts, the vitamin D analogue was statistically significantly less effective than the potent corticosteroid: Betamethasone dipropionate was more effective than both calcipotriol (SMD 0.36; 95% CI 0.22 to 0.51; I² statistic = 49.6%) and calcitriol (SMD 0.39; 95% CI 0.14 to 0.63; I² statistic = NA).
We found no statistically significant difference between calcipotriol and desoxymetasone.
Analysis 8: Vitamin D analogues versus corticosteroid (very potent)
This comparison considered vitamin D analogues against very potent corticosteroids for treating psoriasis of the body (see Analysis 8.3 and Table 11). We found data on one intervention‐comparator contrast: calcipotriol versus clobetasol propionate. One between‐patient trial reported PASI data for 40 participants. This trial had a treatment duration of six weeks (Landi 1993). The SMD for the PASI indicated that there was no statistically significant difference between the very potent corticosteroid and the vitamin D analogue: SMD ‐0.32 (95% CI ‐0.95 to 0.30; I² statistic = NA).
Analysis 9: Vitamin D combined with corticosteroid versus corticosteroid
This comparison considered vitamin D analogue‐steroid combination against potent or very potent corticosteroid for body psoriasis (Table 12). Three between‐patient trials reported PASI data for 1876 participants (see Analysis 9.3). All 3 trials compared combination treatment with calcipotriol and betamethasone dipropionate with betamethasone dipropionate as monotherapy, but varied in their treatment duration (4 to 8 weeks). The SMD for the PASI was ‐0.44 (95% CI ‐0.55 to ‐0.33; I² statistic = 22.4%), indicating a significantly greater effect for combination treatment.
Analysis 10: Vitamin D alone or in combination versus dithranol
This comparison considered vitamin D analogues against dithranol (see Analysis 10.3 and Table 13). We identified three intervention‐comparator contrasts: calcipotriol versus dithranol, calcitriol versus dithranol, and tacalcitol versus dithranol. Five between‐patient trials reported PASI data for 796 participants. Treatment duration ranged from 8 to 12 weeks. There was some variation in the dithranol regimens employed by trials and in the baseline severity of trial participants. These factors may explain the considerable level of heterogeneity found in the pooled results (Higgins 2011).
The SMD for the PASI was 0.36 (95% CI ‐0.33 to 1.04; I² statistic = 94.5%). Data from three trials contributed to the SMD for the calcipotriol versus dithranol: 0.73 (95% CI ‐0.55 to 2.00; I² statistic = 97.2%) (Berth Jones 1992b; Monastirli 2000; Van de Kerkhof 2006). One of these three trials found a large and statistically significant difference in favour of calcipotriol (Berth Jones 1992b); Monastirli 2000 found a significant difference in favour of dithranol, and the trial by Van de Kerkhof 2006 found no difference between the two treatments. In the light of this heterogeneity, we removed all pooling from this comparison.
Analysis 11: Vitamin D alone or in combination versus other vitamin D analogue
Our review identified three intervention‐comparator contrasts for body psoriasis in this comparison: calcipotriol versus calcitriol, calcipotriol versus tacalcitol, and calcipotriol versus maxacalcitol (see Analysis 11.3 and Table 14). One between‐patient trial involving 15 participants contributed PASI data for the comparison of calcipotriol and calcitriol (Bourke 1997). Treatment duration was eight weeks. Although there was a trend towards a greater effect for calcipotriol, the SMD for the PASI was not statistically significant: ‐1.11 (95% CI ‐2.22 to 0.01; I² statistic = NA).
Analysis 12: Vitamin D alone or in combination versus vitamin D + corticosteroid
Our review identified 12 intervention‐comparator contrasts, involving 3 vitamin D analogues, 2 combination products, and 7 different corticosteroids (see Analysis 12.3 and Table 15). Sixteen trials involving 5703 participants contributed PASI data for 11 of these 12 intervention‐comparator contrasts. Fifteen trials were between‐patient, and 1 was within‐patient in design (Salmhofer 2000). Treatment duration ranged from 2 to 12 weeks. We did not identify any PASI data for the comparison of calcipotriol against clobetasol propionate then calcipotriol. Overall, vitamin D plus corticosteroid appeared to be more effective than vitamin D alone: The SMD for the PASI was 0.47 (95% CI 0.34 to 0.59; I² statistic = 82.3%). However, there was considerable variation between the findings of the intervention‐comparator contrasts. In light of the observed heterogeneity, we only pooled subtotals (Higgins 2011).
In six of the intervention‐comparator contrasts, the analysis of the PASI measure found no significant difference between the treatments. This was the case for twice‐daily calcipotriol compared with the following:
-
a regimen with calcipotriol applied in the morning and the night‐time application of betamethasone valerate (Kragballe 1998b; Ruzicka 1998);
-
clobetasone butyrate (Kragballe 1998b); or
-
diflucortolone valerate (Salmhofer 2000).
Once‐daily calcipotriol was no more effective than combined treatment with fluocinonide acetonide (Wozel 2001) or combined with hydrocortisone (Ortonne 2010). Lastly, no significant difference was found between twice‐daily calcitriol and combined treatment with diflucortolone valerate (mornings) and calcitriol (night time) (Lee 2007).
In contrast, combined treatment with calcipotriol and betamethasone dipropionate was significantly more effective than twice‐daily calcipotriol alone. This finding held for regimens involving night‐time applications of betamethasone dipropionate (SMD 0.46; 95% CI 0.10 to 0.82; I² statistic = NA) and for treatment with a combined product, whether applied once daily (SMD 0.52; 95% CI 0.38 to 0.67; I² statistic = 32.3%) or twice daily (SMD 0.64; 95% CI 0.46 to 0.83; I² statistic = 73.6%). Once‐daily treatment with the combined calcipotriol/betamethasone dipropionate product was also significantly more effective than once‐daily calcipotriol (SMD 0.67; 95% CI 0.23 to 1.11; I² statistic = 87.4%) as well as once‐daily tacalcitol (SMD 0.47; 95% CI 0.25 to 0.69; I² statistic = NA).
Analysis 13: Vitamin D alone or in combination versus other treatments: complex regimens
This comparison summarises findings on complex regimens for body psoriasis, defined here as treatment sequences that do not consist of a simple head‐to‐head comparison between two active treatments (see Analysis 13.3 and Table 16). PASI data were available for 11 of the 12 intervention‐comparator contrasts identified. Data from 2991 participants contributed to the PASI analysis, based on findings from 8 between‐patient trials. Trial duration varied between 2 and 12 weeks. Because the interventions and comparators were highly variable and two trials each contributed three pair‐wise contrasts, we did not pool the data.
Six intervention‐comparator contrasts for which PASI data were available found a significant difference between regimens. A six‐week course of calcipotriol was compared with two different complex regimens. Monotherapy with calcipotriol was significantly less effective than two weeks of treatment with calcipotriol and fluocinonide acetonide followed by four weeks of calcipotriol (SMD 0.66; 95% CI 0.01 to 1.32) (Wozel 2001). Calcipotriol monotherapy was also less effective than treatment with calcipotriol to which halometasone was added (SMD 1.13; 95% CI 0.64 to 1.62) (Yang 2009). Monotherapy with tacalcitol (8 weeks) was less effective than sequential treatment with a combined calcipotriol and betamethasone dipropionate product (4 weeks) followed by calcipotriol monotherapy for a further 4 weeks (SMD 0.49; 95% CI 0.31 to 0.67) (Ortonne 2004). White 2006 (P) compared three regimens, all of which included an initial phase in which participants applied combination treatment with calcipotriol and betamethasone dipropionate once a day for four weeks. The subsequent eight‐week maintenance phase using placebo ointment was significantly less effective than maintenance with either twice‐daily calcipotriol (SMD 0.25; 95% CI 0.10 to 0.39), or maintenance with calcipotriol on weekdays and combination treatment at weekends (SMD 0.59; 95% CI 0.45 to 0.74). When the two active maintenance regimens were compared directly, the alternating (weekday/weekend) regimen was significantly more efficacious (SMD 0.30; 95% CI 0.16 to 0.45) (White 2006 (H)).
In the remaining four intervention‐comparator contrasts, we did not detect any significant difference in the PASI assessments (see Analysis 13.3). PASI assessments in the study by Kragballe 2004 found the difference between two complex regimens not to be significant (SMD 0.15; 95% CI ‐0.01 to 0.30). This result was on the borderline of significance and contrasted with the IAGI assessment in the same study, which was statistically significant in favour of the complex regimen (see Analysis 13.1).
Analysis 14: Vitamin D alone or in combination versus other treatment: long‐term studies (> 24 weeks)
We did not identify any relevant study that provided PASI data for this analysis.
Analysis 15: Vitamin D analogues versus other treatment
This comparison incorporated all other vitamin D head‐to‐head comparisons of treatments for psoriasis of the body (excluding inverse psoriasis) that had not already been included (see Analysis 15.3 and Table 18). We included 12 intervention‐comparator contrasts, with PASI data available for 6 of these contrasts. There were six between‐patient trials and three within‐patient trials, with data for 1228 participants. Trial duration ranged between 4 and 12 weeks. In light of the pharmacological diversity of the comparators, we only pooled data within subgroups (Higgins 2011).
According to the PASI assessment, twice‐daily calcipotriol was significantly more effective than coal tar polytherapy (SMD ‐0.63; 95% CI ‐1.06 to ‐0.20; I² statistic = NA) as well as propylthiouracil cream (SMD ‐2.24; 95% CI ‐3.23 to ‐1.25; I² statistic = NA). Twice‐daily calcipotriol was not significantly more effective than coal tar (SMD ‐0.10; 95% CI ‐1.54 to 1.35; I² statistic = 92.8%), betamethasone dipropionate and salicylic acid (SMD ‐0.05; 95% CI ‐0.36 to 0.26; I² statistic = NA), or vitamin B12 cream (SMD ‐0.01; 95% CI ‐0.78 to 0.75; I² statistic = NA). The high level of heterogeneity observed in the pooled analysis of calcipotriol versus coal tar reflects contradictory findings from two studies, one finding in favour of calcipotriol (Tham 1994) and the other in favour of coal tar (Alora‐Palli 2010).
When compared with once‐daily dosing, twice‐daily vitamin D was borderline in demonstrating a significantly better effect (SMD ‐0.12; 95% CI ‐0.25 to 0.00; I² statistic = 0%). The subgroups contributing to this result were dosing comparisons of calcipotriol (SMD ‐0.12; 95% CI ‐0.28 to 0.03; I² statistic = 0%) and combination treatment with calcipotriol and betamethasone dipropionate (SMD ‐0.12; 95% CI ‐0.32 to 0.09; I² statistic = NA).
Analysis 16: Flexural/facial psoriasis: placebo‐controlled trials
This comparison included placebo‐controlled trials of topical treatments for inverse or facial psoriasis (see Analysis 16.3 and Table 19). We found evidence on four treatments in this comparison: the potent steroid betamethasone valerate; the vitamin D analogue calcipotriol; and two topical calcineurin inhibitors, pimecrolimus and tacrolimus. We only identified one placebo‐controlled trial evaluating tacrolimus ointment (Lebwohl 2004), but the study did not report any effectiveness data suitable for this review. However, the study did contribute data on adverse events and withdrawal rates.
PASI data were available for 3 of the 4 topical treatments for inverse psoriasis, all reported by 1 4‐week between‐patient study with 75 participants (Kreuter 2006 (P)). In this study, participants applied all treatments once daily. The SMD for the PASI found a statistically significant difference in favour of betamethasone valerate 0.1% (SMD ‐2.83; 95% CI ‐3.79 to ‐1.88) as well as calcipotriol ointment (SMD ‐1.08; 95% CI ‐1.77 to ‐0.40). However, PASI data on once‐daily pimecrolimus cream indicated the difference relative to vehicle was not statistically significant (SMD ‐0.62; 95% CI ‐1.27 to 0.02).
Analysis 17: Flexural/facial psoriasis: vitamin D alone or in combination versus other treatment
This comparison included head‐to‐head trials of treatments for inverse psoriasis, where vitamin D was compared with an active control (see Analysis 17.3 and Table 20). We identified five intervention‐comparator contrasts. We compared four treatments with calcipotriol: once‐daily betamethasone valerate, combined treatment with calcipotriol and hydrocortisone, calcitriol, and pimecrolimus. Calcitriol was compared with tacrolimus.
Two between‐patient studies contributed PASI data from 464 study participants on 3 of the 5 intervention‐comparator contrasts. Kreuter 2006 (H) found that calcipotriol was significantly less effective than betamethasone valerate (SMD 2.02; 95% CI 1.20 to 2.84), but not significantly different in effect to pimecrolimus (SMD ‐0.53; 95% CI ‐1.17 to 0.11). Participants in the Kreuter 2006 (H) trial applied all treatments once daily. When assessed using the PASI, Ortonne 2010 found that calcipotriol was significantly less effective on inverse psoriasis than combined treatment with calcipotriol and hydrocortisone (SMD 0.32; 95% CI 0.12 to 0.51). This finding was consistent with the IAGI assessment in the same trial (see Analysis 17.1).
Analysis 18: Scalp psoriasis: placebo‐controlled trials
No PASI data were available for this comparison.
Analysis 19: Scalp psoriasis: vitamin D alone or in combination versus other treatment
No PASI data were available for this comparison.
(d) Patient Assessment of overall Global Improvement (PAGI)/Patient Global Assessment of Disease Severity (PGA)
Analysis 1: Vitamin D analogues versus placebo
Our review included eight vitamin D analogues for body psoriasis in this comparison, with PAGI data available for three treatments (see Analysis 1.4 and Table 5). Five studies reported PAGI data, all of which were between‐patient design, and 1467 participants contributed data. In all six studies, treatment duration was eight weeks. The pooled effect across the 3 studies reporting PAGI data was SMD ‐0.54; 95% CI ‐0.72 to ‐0.36; I² statistic = 55.5%.
Analysis 2: Corticosteroid (potent) versus placebo
Our review did not identify any study that compared potent corticosteroids against placebo and reported PAGI data.
Analysis 3: Corticosteroid (very potent) versus placebo
We included three very potent corticosteroids for body psoriasis in this comparison for this outcome (see Analysis 3.4 and Table 7). Three studies reported PAGI data for 283 participants on 2 of these 3 treatments. There was one between‐patient trial (Lebwohl 2002) and two within‐patient studies. In all three studies, treatment duration was two weeks. The pooled effect across both treatments for PAGI was (SMD ‐1.22; 95% CI ‐1.42 to ‐1.02; I² statistic = 0%). Both treatments performed statistically significantly better than placebo. PAGI data on the use of very potent steroids on the scalp are reported in Analysis 18.4.
Analysis 4: Dithranol versus placebo
Our review did not identify any study comparing dithranol against placebo and that reported PAGI data.
Analysis 5: Vitamin D combination products versus placebo
This comparison included treatment with combined calcipotriol and betamethasone dipropionate used either once or twice daily on the body (see Analysis 5.4 and Table 8). None of the studies of twice‐daily treatment reported PAGI data, but one parallel‐group study with 235 participants contributed data on once‐daily treatment (Langley 2011 (P)). Treatment duration was eight weeks. The PAGI SMD was ‐0.69 (95% CI ‐0.98 to ‐0.40; I² statistic = NA). Placebo‐controlled trials of combination vitamin D/steroid treatments for scalp psoriasis are reported in Analysis 18.4.
Analysis 6: Other treatment versus placebo
This comparison comprised all other treatments for body psoriasis that we did not include in the first five comparisons; therefore, we removed pooling. None of the studies assessed the same treatment, which means that findings should be interpreted with caution.
In total, we included 26 treatments in this analysis (see Analysis 6.4 and Table 9). Two studies with 105 participants reported PAGI data on 2 of these 26 treatments. Both trials were between‐patient studies. Treatment duration ranged from 3 to 12 weeks. According to participants' assessments (PAGI), betamethasone 17‐valerate 21 acetate plus tretinoin plus salicylic acid performed significantly better than placebo (SMD ‐0.80; 95% CI ‐1.26 to ‐0.35), whilst kukui nut oil was no more effective than placebo (SMD 0.00; 95% CI ‐0.80 to 0.80). These findings were very similar to the investigators' assessments (see Analysis 6.1).
Analysis 7: Vitamin D analogues versus corticosteroid (potent)
Our review identified eight vitamin D analogue‐potent corticosteroid comparisons for body psoriasis (see Analysis 7.4 and Table 10). Two studies with 738 participants reported PAGI data for 1 of these 8 comparisons. One trial was a parallel‐group study (Cunliffe 1992), and one was a within‐patient study (Kragballe 1991a), both with a treatment duration of six weeks. The PAGI SMD indicated that the vitamin D analogue calcipotriol was significantly more effective than betamethasone valerate (SMD ‐0.26; 95% CI ‐0.38 to ‐0.14; I² statistic = 0%).
Analysis 8: Vitamin D analogues versus corticosteroid (very potent)
This comparison included one vitamin D analogue and a very potent corticosteroid contrast, calcipotriol ointment versus clobetasol propionate foam for body psoriasis (see Table 11 and Analysis 8.4). One study with 42 participants reported PAGI data. Koo 2006 was a between‐patient study with a treatment duration of two weeks. Findings for the participant‐reported assessment (SMD 0.42; 95% CI ‐0.20 to 1.03) were similar, the investigators' assessment from the same study (SMD 0.19; 95% CI ‐0.42 to 0.80; see Analysis 8.1).
Analysis 9: Vitamin D combined with corticosteroid versus corticosteroid
We found one study comparing a vitamin D analogue‐steroid combination against corticosteroids for body psoriasis that reported PAGI/PGA data (see Table 12 and Analysis 9.4). This two‐week between‐patient study reported PAGI data for 65 participants (Koo 2006), comparing combined treatment with calcipotriol and clobetasol propionate against the very potent corticosteroid alone. According to the participants' assessment (PAGI), there was no statistically significant difference between the treatment options (SMD ‐0.28; 95% CI ‐0.80 to 0.24). This finding contrasts with the investigators' assessment (IAGI), which found in favour of combination treatment (SMD ‐0.69; 95% CI ‐1.22 to ‐0.15) (see Analysis 9.1).
Analysis 10: Vitamin D alone or in combination versus dithranol
This comparison considered vitamin D analogues against dithranol (see Analysis 10.4 and Table 13). We identified three intervention‐comparator contrasts: calcipotriol versus dithranol, calcitriol versus dithranol, and tacalcitol versus dithranol. PAGI data were available only for the intervention‐comparator contrast of calcipotriol versus dithranol. Two between‐patient trials reported PAGI data for 544 participants (Berth Jones 1992b; Van de Kerkhof 2006). Treatment duration ranged from 8 to 12 weeks. The SMD for the PAGI was ‐0.05 (95% CI ‐0.90 to 0.80; I² statistic = 92.5%), indicating no statistically significant advantage for calcipotriol or dithranol according to the participants' assessment.
Analysis 11: Vitamin D alone or in combination versus other vitamin D analogue
Our review identified three intervention‐comparator contrasts for body psoriasis in this comparison: calcipotriol versus calcitriol, calcipotriol versus tacalcitol, and calcipotriol versus maxacalcitol (see Analysis 11.4 and Table 14). One between‐patient trial involving 250 participants contributed PAGI data for the comparison of calcipotriol and calcitriol (Ji 2008). Treatment duration was 12 weeks. The SMD for the PAGI indicated that there was no statistically significant difference between calcipotriol and calcitriol (SMD 0.04; 95% CI ‐0.21 to 0.29; I² statistic = NA). This study used three measures to assess the effects of calcipotriol and calcitriol. The investigators' assessment supported the participant assessment (no difference) (see Analysis 11.1), but the TSS found a significant difference in favour of calcipotriol (Analysis 11.2).
Analysis 12: Vitamin D alone or in combination versus vitamin D + corticosteroid
Our review identified 12 intervention‐comparator contrasts for body psoriasis, involving 3 vitamin D analogues, 2 combination products, and 7 different corticosteroids (see Analysis 12.4 and Table 15). Two parallel‐group trials contributed PAGI data from 399 participants for 2 of these 12 intervention‐comparator contrasts. Treatment duration ranged between two and eight weeks. According to the participant assessment, twice‐daily calcipotriol was significantly less effective than twice‐daily treatment with calcipotriol and clobetasol propionate (SMD 0.70; 95% CI 0.16 to 1.23). Treatment with tacalcitol was also less effective than treatment with a combined product containing calcipotriol and betamethasone dipropionate, when both treatments were applied once daily (SMD 0.46; 95% CI 0.24 to 0.68). The pooled SMD for these two trials (0.49; 95% CI 0.29 to 0.69; I² statistic = 0%) gave greater weight to the comparison with tacalcitol, since this was the larger trial (334 participants; Langley 2011 (H)).
Analysis 13: Vitamin D alone or in combination versus other treatments: complex regimens
This comparison summarises findings on complex regimens for body psoriasis, defined here as treatment sequences that do not consist of a simple head‐to‐head comparison between two active treatments (see Analysis 13.4 and Table 16). We identified 12 intervention‐comparator contrasts and data from the Patient Assessment of Global Improvement (PAGI) or Patient Global Assessment of Disease Severity (PGA) were available for 7 of these. Data from 2508 participants contributed to the PAGI analysis, based on findings from 4 between‐patient trials. Trial duration varied between 8 and 12 weeks. Because the interventions and comparators were highly variable and two trials each contributed three pair‐wise contrasts, we did not pool the data.
Four intervention‐comparator contrasts for which PAGI data were available found a significant difference between regimens. Ortonne 2004 found that four weeks of treatment with a combination product of calcipotriol and betamethasone dipropionate, followed by monotherapy with calcipotriol for four weeks, was significantly more effective than monotherapy with tacalcitol (SMD 0.54; 95% CI 0.36 to 0.72). Findings from the patient‐reported outcome were identical to the investigators' assessment (Analysis 13.1). The trial by White 2006 (H)/White 2006 (P) compared three regimens. All included an initial phase in which participants applied once‐daily combination treatment with calcipotriol and betamethasone dipropionate for four weeks, but differed in their subsequent eight‐week maintenance phase. According to the participants' assessment, maintenance therapy with twice‐daily placebo ointment was significantly less effective than maintenance with either calcipotriol ointment (SMD 0.28; 95% CI 0.13 to 0.42) or maintenance with calcipotriol on weekdays and combination treatment at weekends (SMD 0.71; 95% CI 0.56 to 0.85). We compared the 2 regimens with active maintenance options directly; the alternating (weekday/weekend) approach was significantly more effective (SMD 0.44; 95% CI 0.29 to 0.58). These findings, based on the participants' assessment of severity, were aligned with those of both the investigators' assessment (Analysis 13.1) and the PASI assessment (Analysis 13.3).
A head‐to‐head comparison of two complex regimens found a significant difference (Kragballe 2004). Once‐daily combination treatment (calcipotriol/betamethasone dipropionate) for 8 weeks followed by once‐daily calcipotriol for 4 weeks was significantly less effective than a regimen consisting of combined treatment for 4 weeks, followed by 8 weeks of once‐daily therapy with calcipotriol on weekdays and combined therapy at weekends (SMD 0.23; 95% CI 0.07 to 0.39).
In three of the seven intervention‐comparator contrasts, no significant difference was found. Kragballe 2004 also compared 12 weeks of calcipotriol monotherapy with the 2 complex regimens described in the paragraph above. Compared with monotherapy, participants who applied once‐daily combination treatment (calcipotriol/betamethasone dipropionate) for 8 weeks followed by once‐daily calcipotriol for 4 weeks did not experience a significantly greater improvement in their psoriasis (SMD ‐0.14; 95% CI ‐0.30 to 0.02). Similarly, the psoriasis of participants on monotherapy with twice‐daily calcipotriol did not improve significantly differently compared to those who applied once‐daily combination treatment (calcipotriol/betamethasone dipropionate) for 4 weeks, followed by 8 weeks using calcipotriol once daily (weekdays) and combination therapy (weekends) (SMD 0.10; 95% CI ‐0.06 to 0.26).
Analysis 14: Vitamin D alone or in combination versus other treatment: long‐term studies (> 24 weeks)
We did not identify any relevant study that provided PAGI data for this analysis.
Analysis 15: Vitamin D analogues versus other treatment
This comparison incorporated all other vitamin D head‐to‐head comparisons of treatments for psoriasis of the body (excluding inverse psoriasis) that we had not already included (see Analysis 15.4 and Table 18). We included 12 intervention‐comparator contrasts, with PAGI data available for 6 of these contrasts: 3 between‐patient trials and 3 within‐patient trials data for 456 participants. Trial duration ranged between 4 and 12 weeks. In light of the pharmacological diversity of the comparators, we only pooled data within subgroups.
According to the participants' assessment, twice‐daily calcipotriol was significantly more effective than three comparators, with evidence on each based on a single trial. Calcipotriol was more effective than coal tar both as monotherapy (SMD ‐1.51; 95% CI ‐2.12 to ‐0.90; Tham 1994) and as polytherapy (SMD ‐0.56; 95% CI ‐0.99 to ‐0.13; Van de Kerkhof 2002a), and more effective than betamethasone dipropionate and salicylic acid (SMD ‐0.49; 95% CI ‐0.79 to ‐0.20; Scarpa 1994). No significant difference was evident when calcipotriol was compared to tacrolimus ointment (Ortonne 2006), tazarotene (Tzung 2005), or vitamin B12 cream (Stuecker 2001).
Analysis 16: Flexural/facial psoriasis: placebo‐controlled trials
This comparison included placebo‐controlled trials of topical treatments for inverse or facial psoriasis (see Analysis 16.4 and Table 19). We found evidence on four treatments in this comparison: the potent steroid betamethasone valerate; the vitamin D analogue calcipotriol; and two topical calcineurin inhibitors, pimecrolimus and tacrolimus. We identified only one placebo‐controlled trial evaluating tacrolimus ointment (Lebwohl 2004), but the study did not report any effectiveness data suitable for this review. However, the study did contribute data on adverse events and withdrawal rates.
PAGI (patient‐assessment) data were available for one of the four topical treatments for inverse psoriasis. One 8‐week between‐patient study (Gribetz 2004) reported data from 47 participants. Relative to placebo, the SMD for the PAGI found a statistically significant difference in favour of twice‐daily pimecrolimus cream (SMD ‐0.65; 95% CI ‐1.24 to ‐0.06).
Analysis 17: Flexural/facial psoriasis: vitamin D alone or in combination versus other treatment
We did not identify any relevant study that provided PAGI data for this analysis.
Analysis 18: Scalp psoriasis: placebo‐controlled trials
This comparison included placebo‐controlled trials of treatments for scalp psoriasis (see Analysis 18.4 and Table 21). We included evidence on 11 treatments in this comparison, with PAGI data available for 5 treatments. Five between‐patient trials contributed data from 1875 participants. Trial duration ranged between three and eight weeks.
Four of the five treatments for scalp psoriasis that were evaluated using the Patient Global Assessment Scale were significantly more effective than placebo. The least effective treatment was calcipotriol (SMD ‐0.66; 95% CI ‐1.28 to ‐0.05; I² statistic = 74.5%), and the most effective was betamethasone dipropionate (SMD ‐1.23; 95% CI ‐1.43 to ‐1.03; I² statistic = NA). Effects for the very potent steroid amcinonide (SMD ‐0.97; 95% CI ‐1.33 to ‐0.61 I² statistic = NA) and combination treatment with calcipotriol and betamethasone dipropionate (SMD ‐1.00; 95% CI ‐1.79 to ‐0.22; I² statistic = 93.2%) fell between these two extremes. There were no data suitable for pooling across subcategories.
Only for ciclopirox olamine shampoo was the difference relative to placebo found to be non‐significant: SMD ‐0.11 (95% CI ‐0.86 to 0.64; I² statistic = NA).
Analysis 19: Scalp psoriasis: vitamin D alone or in combination versus other treatment
This comparison included head‐to‐head trials of treatments for scalp psoriasis in which one of the interventions was a vitamin D product (used either as monotherapy or in combination with another product) (see Analysis 19.4 and Table 22).
We identified six intervention‐comparator contrasts, and PAGI data were available for four of these contrasts (there were no participant‐assessed outcomes data for the comparison of calcipotriol against either clobetasol propionate or against coal tar polytherapy). All studies were parallel‐group in design (between‐patient). Six studies contributed PAGI data from 3742 participants, and trial duration ranged from 4 to 8 weeks.
Based on the participant assessment scores, calcipotriol was significantly less effective than betamethasone dipropionate (SMD 0.56; 95% CI 0.31 to 0.81; I² statistic = 82.8%), betamethasone valerate (SMD 0.41; 95% CI 0.22 to 0.59; I² statistic = NA), and combination treatment with calcipotriol and betamethasone dipropionate (SMD 0.84; 95% CI 0.61 to 1.08; I² statistic = 81.5%). Combination treatment (calcipotriol/betamethasone dipropionate) was significantly more effective than betamethasone dipropionate alone (SMD ‐0.17; 95% CI ‐0.25 to ‐0.09; I² statistic = 0%).
(e) Combined end point (IAGI/TSS/PASI/PAGI)
Analysis 1: Vitamin D analogues versus placebo
Our review included eight vitamin D analogues for body psoriasis in this comparison (see Analysis 1.5 and Table 5). Thirty studies, involving 4986 participants, contributed data. Eighteen trials were between‐patient design, and 12 were within‐patient studies. Treatment duration ranged from 3 to 12 weeks. Six studies had adequately concealed treatment allocation. The pooled effect across all 30 studies was ‐0.90 (95% CI ‐1.07 to ‐0.72; I² statistic = 87.5%), which equates to 1.03 on a 6‐point IAGI scale. However, the summary statistic conceals considerable variation between treatments. In two treatments, the effect was not statistically significantly different to placebo (twice‐daily calcipotriol plus occlusion for 2 weeks followed by 4 weeks with no treatment, and once‐daily becocalcidiol). In treatments that were significantly more effective than placebo, the effect ranged from ‐0.67 (twice‐daily becocalcidiol) to ‐1.66 (once‐daily paricalcitol); on a 6‐point IAGI scale, these effects translate into 0.80 and 1.91 points, respectively. However, given the high level of heterogeneity found in the meta‐analysis, it may be more informative to look at individual products within the class, rather than treating this class as a single group. We removed the pooling across the class, so that we only pooled subtotals.
We reported placebo‐controlled trials of vitamin D products for scalp psoriasis (Analysis 18.5) and inverse psoriasis (Analysis 16.5) elsewhere.
Sensitivity analyses
We explored differences in within‐patient and between‐patient designs using one‐way sensitivity analysis (Table 5). The SMD for the 12 within‐patient studies (600 participants) was ‐1.11 (95% CI ‐1.58 to ‐0.64; I² statistic = 91.5%). This translates into a change of 1.27 on a 6‐point IAGI scale, slightly larger than the effect size for all studies. The SMD for the 18 between‐patient studies (4386 participants) was ‐0.80 (95% CI ‐0.96 to ‐0.63; I² statistic = 83.2%). This translates into a change of 0.91 on a 6‐point IAGI scale, slightly smaller than the effect size for the within‐patient studies.
We also used sensitivity analysis to explore the impact of varying the correlation coefficient (rho) for the 12 within‐patient studies. As no trial in the review reported this statistic, we tested values of 0, 0.25, 0.50, and 0.75. Varying the value of rho for the within‐patient studies had no significant effect on the findings: The pooled SMD ranged from ‐0.85 (95% CI ‐1.00 to ‐0.71; I² statistic = 87.8%; 30 studies), when we assumed the correlation to be zero, to ‐0.91 (95% CI ‐1.07 to ‐0.75; I² statistic = 93.2%; 30 studies), when we assumed the correlation to be 0.75.
The study by Perez 1996 comparing calcitriol and placebo reported large and statistically significant differences for both TSS and IAGI outcomes. In both outcomes, the magnitude of the effect was the largest across all comparisons and treatments. Perez 1996 was a 10‐week within‐patient study involving 84 participants. The study included people with severe disease (mean TSS at baseline: 7.6 on a 10‐point scale, with at least 10% of body surface area affected) who had previously had an unsatisfactory response to at least 1 previous treatment including topical steroids, UVB, PUVA, and methotrexate. The dramatic improvement observed in the intervention group is difficult to interpret in the context of findings from other trials, and we explored the impact of removing this study in a sensitivity analysis. When we removed Perez 1996 from the pooled analysis for calcitriol, the effect size was smaller but still statistically significantly different from placebo: SMD with Perez 1996 was ‐0.92 (95% CI ‐1.54 to ‐0.29; I² statistic = 94.9%; 7 studies), and SMD without Perez 1996 was ‐0.60 (95% CI ‐0.78 to ‐0.41; I² statistic = 30%; 6 studies). On a 6‐point IAGI scale, these effect sizes equate to 1.05 and 0.68, respectively (Table 5).
The trials of calcipotriol varied by dose, treatment duration, and dosing frequency; where trials reported more than one dose (Kragballe 1988b) or type of vehicle (Harrington 1996a), we estimated the weighted mean and standard deviation across the trial. The effect size for twice‐daily regimens was ‐1.02 (95% CI ‐1.23 to ‐0.82 I² statistic = 73.5%; 13 studies); this equates to 1.18 on a 6‐point IAGI scale. For once‐daily calcipotriol, the corresponding figures were ‐0.76 (95% CI ‐1.13 to ‐0.40; I² statistic = 82.3%; 4 studies) and 0.87 on a 6‐point IAGI scale. Therefore, both dosing frequencies were more effective than placebo, but once‐daily applications had a smaller effect (Table 5).
Analysis 2: Corticosteroid (potent) versus placebo
Our review identified 10 potent corticosteroids for body psoriasis in this comparison (see Analysis 2.5 and Table 6). The treatments included three betamethasone dipropionate regimens, but we identified no effectiveness evidence for budesonide and no study reporting PAGI data. Therefore, 13 studies involving 2216 participants contributed data on 9 of the 10 treatments. Eleven trials were between‐patient design, and two were within‐patient studies. Treatment allocation was adequately concealed in four studies. Treatment duration ranged from 2 to 12 weeks. Participant numbers for individual studies ranged from 9 (Wortzel 1975 (2)) to 633 (Kaufmann 2002 (P)). The pooled effect across all 13 studies was ‐0.89 (95% CI ‐1.06 to ‐0.72; I² statistic = 65.1%). This equates to 1.02 on a 6‐point IAGI scale. With the exception of diflorasone diacetate (Lane 1983), all potent corticosteroids were significantly more effective than placebo at the 5% level of significance. We reported elsewhere placebo‐controlled trials of potent corticosteroid products for scalp psoriasis (Analysis 18.5) and inverse psoriasis (Analysis 16.5).
Sensitivity analyses
We explored differences in within‐patient and between‐patient designs using one‐way sensitivity analysis (Table 6). The SMD for the 2 within‐patient studies was ‐1.33 (95% CI ‐1.78 to ‐0.89; I² statistic = 0%). This translates into a change of 1.53 on a 6‐point IAGI scale, which is larger than the effect for all studies. However, as just 48 participants contributed data to this analysis, robust inferences cannot be drawn. The SMD for the 11 between‐patient studies (2168 participants) was ‐0.85 (95% CI ‐1.03 to ‐0.67; I² statistic = 66.7%). This translates into a change of 0.98 on a 6‐point IAGI scale, slightly smaller than the effect for all studies.
We also used sensitivity analysis to explore the impact of varying the correlation coefficient (rho) for the 2 within‐patient studies. As no trial in the review reported this statistic, we tested values of 0, 0.25, 0.50, and 0.75. Varying the value of rho for the within‐patient studies had no significant effect on the findings: the pooled SMD ranged from ‐0.89 (95% CI ‐1.06 to ‐0.72; I² statistic = 77.7%; 14 studies), when we assumed the correlation was to be zero, to ‐0.91 (95% CI ‐1.08 to ‐0.74; I² statistic = 80.2%; 13 studies), when we assumed the correlation to be 0.75.
Analysis 3: Corticosteroid (very potent) versus placebo
Our review identified three very potent corticosteroids for body psoriasis in this comparison (see Analysis 3.5 and Table 7), but effectiveness data were not available for one of these treatments (halcinonide). Ten studies reported data for 1264 participants. There were seven between‐patient trials and three within‐patient studies. Treatment duration ranged from two to four weeks. In no study was treatment allocation adequately concealed. The SMD across the 2 treatments was ‐1.56 (95% CI ‐1.87 to ‐1.26; I² statistic = 81.7%; 10 studies). This equates to 1.80 points on a 6‐point IAGI scale. Both clobetasol propionate (SMD ‐1.65; 95% CI ‐2.10 to ‐1.20; I² statistic = 86.3%; 7 studies) and halobetasol (SMD ‐1.36; 95% CI ‐1.65 to ‐1.07 I² statistic = 47.1%; 3 studies) performed significantly better than placebo.
We reported elsewhere placebo‐controlled trials of very potent corticosteroid products for scalp psoriasis (Analysis 18.5).
Sensitivity analyses
We explored differences in within‐patient and between‐patient designs using one‐way sensitivity analysis (Table 7). The SMD for the 3 within‐patient studies (229 participants) was ‐1.52 (95% CI ‐2.02 to ‐1.02; I² statistic = 79.3%). This translates into a change of 1.74 on a 6‐point IAGI scale. The SMD for the 7 between‐patient studies (1035 participants) was ‐1.58 (95% CI ‐1.99 to ‐1.17; I² statistic = 84.4%). This translates into a change of 1.81 on a 6‐point IAGI scale.
We also used sensitivity analysis to explore the impact of varying the correlation coefficient (rho) for the 3 within‐patient studies. As no trial in the review reported this statistic, we tested values of 0, 0.25, 0.50, and 0.75. Varying the value of rho for the within‐patient studies had no significant effect on the findings: The pooled SMD ranged from ‐1.52 (95% CI ‐1.80 to ‐1.24; I² statistic = 81.6%; 10 studies), when we assumed the correlation to be zero, to ‐1.55 (95% CI ‐1.80 to ‐1.29; I² statistic = 85.9%; 10 studies), when we assumed the correlation to be 0.75.
Analysis 4: Dithranol versus placebo
This comparison considered dithranol against placebo (see Analysis 4.5 and Table 23). Three within‐patient trials reported data for 47 participants. The only outcome reported by these trials was the TSS, so results for the combined end point are identical to the TSS results section. The types of treatment comprised the following: dithranol 0.1% in a carbamide (17% urea) base twice daily (Buckley 1978), dithranol in aqueous gel (dose titration 0.1% to 2.0%) twice daily (Grattan 1997 (P)), and dithranol 2% ointment 'one minute therapy' once daily (Jekler 1992).
Treatment duration ranged from three to eight weeks. In all three studies, the adequacy of the concealment of treatment allocation was unclear. The SMD for the combined end point was ‐1.06 (95% CI ‐1.66 to ‐0.46; I² statistic = 37.4%; 3 studies), which equates to 1.22 on a 6‐point IAGI scale. All three trials found a statistically significant effect in favour of dithranol.
Sensitivity analysis
We used sensitivity analysis to explore the impact of varying the correlation coefficient (rho) for the 3 within‐patient studies. As no trial in the review reported this statistic, we tested values of 0, 0.25, 0.50, and 0.75. Varying the value of rho for the within‐patient studies had no significant effect on the findings: The pooled SMD ranged from ‐0.98 (95% CI ‐1.56 to ‐0.41; I² statistic = 13.9%; 3 studies), when we assumed the correlation to be zero, to ‐1.17 (95% CI ‐1.81 to ‐0.52; I² statistic = 78.5%), when we assumed the correlation to be 0.75.
Analysis 5: Vitamin D combination products versus placebo
This comparison included treatment with combined calcipotriol and betamethasone dipropionate used either once or twice daily on the body (see Analysis 5.5 and Table 8). As all five studies reported IAGI data, results for the combined end point are identical to those in Analysis 5.1. Five parallel‐group studies with 2058 participants contributed data. Treatment duration ranged from four to eight weeks. Three trials adequately concealed treatment allocation. The SMD for the combined end point across treatments was ‐1.44 (95% CI ‐1.76 to ‐1.12; I² statistic = 89.4%; 5 studies), with twice‐daily combination treatment (SMD ‐1.90; 95% CI ‐2.09 to ‐1.71; 2 studies) achieving a significantly larger effect than once‐daily treatment (SMD ‐1.21; 95% CI ‐1.50 to ‐0.91; 3 studies). On a 6‐point IAGI scale, these equate to improvements of 2.18 and 1.39 points, respectively.
However, the PASI assessments differed from the IAGI: although twice‐daily combination treatment achieved a larger effect than once‐daily treatment (SMD ‐1.41 and ‐1.14, respectively), the difference was not statistically significant (see Analysis 5.3).
In Analysis 18.5, we reported placebo‐controlled trials of combination vitamin D/steroid treatments for scalp psoriasis.
Analysis 6: Other treatment versus placebo
This comparison comprised all other treatments for psoriasis of the body that we did not include in the first five comparisons; therefore, we removed pooling. None of the studies assessed the same treatment, which means that findings should be interpreted with caution.
In total, we included 26 treatments in this analysis (see Analysis 6.5 and Table 9). Twenty‐six studies, with 1450 participants, reported data on 25 of these 26 treatments. The study of omega‐3‐polyunsaturated fatty acids ointment (Henneicke‐v. Z. 1993) did not report usable effectiveness data, but did contribute data to the analysis of withdrawals. Twelve trials were between‐patient design, and 14 were within‐patient studies. Treatment duration ranged from 2 to 12 weeks. Two studies adequately concealed treatment allocation (Levine 2010 (P); Stutz 1996).
As assessed by the combined end point, just over half the treatments (13/25) performed statistically significantly better than placebo: aloe vera cream, anti‐IL‐8 monoclonal antibody cream, betamethasone 17‐valerate 21‐acetate plus tretinoin plus salicylic acid, combined treatment with calcipotriene and nicotinamide, fish oil plus occlusion, herbal skin care products, indigo naturalise 1.4% ointment, Mahonia aquifolium, methotrexate gel, mycophenolic acid ointment, PTH (1‐34) in Novasome cream®, tazarotene, and theophylline 1% ointment. The effect size (SMD) for the combined end point ranged from ‐0.48 (Levine 2010 (P); calcipotriene combined with nicotinamide) to ‐2.96 (Maier 2004; herbal skin care products), or 0.55 to 3.40, respectively, on a 6‐point IAGI scale.
The trial of herbal skin care products enrolled just 34 participants, of which 24 contributed data (Maier 2004), so this study is classed as having a high risk of attrition bias (Figure 3; see Risk of bias in included studies). The results of this study were published as an abstract, and our searches failed to locate a full publication. Therefore, findings should be treated with caution.
In the remaining 12 treatments, the difference relative to placebo using the combined end point was not statistically significant. These included topical caffeine, Dead Sea salts emollient lotion, hexafluoro‐1,25‐dihydroxyvitamin D3, kukui nut oil, NG‐monomethyl‐L‐arginine (L‐NMMA) cream, nicotinamide 1.4%, oleum horwathiensis, platelet aggregation activating factor (PAF), polymyxin B cream, topical sirolimus, topical tacrolimus, and tar.
In two treatments, findings by different outcomes were inconsistent. When assessed by the TSS, hexafluoro‐1,25‐dihydroxyvitamin D3 was significantly more effective than placebo (‐1.13; 95% CI ‐1.91 to ‐0.35) (Analysis 6.2), whereas the difference assessed by the IAGI was non‐significant (‐0.62; 95% CI ‐1.35 to 0.12) (Analysis 6.1). We based these findings on a single trial (Durakovic 2001). Similarly, the difference for oleum horwathiensis was statistically significant using the TSS (‐0.77; 95% CI ‐1.40 to ‐0.14) (Analysis 6.2) whereas the difference assessed by the IAGI was not (‐0.02; 95% CI ‐0.63 to 0.58) (Analysis 6.1). We also based findings for this treatment on a single trial (Lassus 1991).
We reported elsewhere placebo‐controlled trials of other treatments for scalp psoriasis (Analysis 18.5) and inverse psoriasis (Analysis 16.5).
Analysis 7: Vitamin D analogues versus corticosteroid (potent)
Our review identified eight vitamin D analogue‐potent corticosteroid comparisons for body psoriasis for this comparison (see Analysis 7.5 and Table 10). Fourteen studies with 3542 participants reported data for these 8 intervention‐comparator contrasts. Nine trials were between‐patient design, and five were within‐patient studies. Treatment duration ranged from three to eight weeks. One study adequately concealed treatment allocation (Papp 2003 (H)).
The combined end point SMD indicated that, overall, there was no statistically significant difference between vitamin D and potent corticosteroids: SMD 0.11 (95% CI ‐0.07 to 0.30; I² statistic = 85.6%; 14 studies). There was however substantial heterogeneity and variation in effect underlying this summary statistic. Therefore, we only pooled subtotals.
The difference between the vitamin D analogue and the potent corticosteroid was not statistically significant for four intervention‐comparator contrasts (calcipotriol versus betamethasone valerate, calcipotriol versus desoxymetasone, calcitriol versus betamethasone dipropionate, calcitriol versus betamethasone valerate). In the comparison of calcipotriol and betamethasone valerate, the non‐significant result was borderline (SMD ‐0.12; 95% CI ‐0.26 to 0.02; I² statistic = 41.6%; 4 studies). When assessed using the TSS (one study), PASI (four studies), and PAGI (two studies), calcipotriol was significantly more effective than betamethasone valerate (see Analysis 7.2, Analysis 7.3, and Analysis 7.4). There were similar inconsistencies between the outcome assessments for the comparison of calcitriol with betamethasone dipropionate, all of which we based on a single study (Camarasa 2003). According to the TSS and PASI, calcitriol was significantly less effective than betamethasone dipropionate, but the IAGI indicated that the difference was not significant (see Analysis 7.1).
In one intervention‐comparator contrast (calcipotriol versus fluocinonide), the vitamin D analogue was significantly more effective than potent corticosteroid: SMD ‐0.58 (95% CI: ‐0.99 to ‐0.18; I² statistic = NA). This effect is equivalent to a gain of approximately two‐thirds of a point (0.64) on a 6‐point IAGI scale. In three intervention‐comparator contrasts, the potent corticosteroid was significantly more effective than the vitamin D analogue (calcipotriol versus betamethasone dipropionate, calcipotriol versus diflorasone diacetate, tacalcitol versus betamethasone valerate). The SMD effect sizes for these were 0.43, 0.27, and 0.41, respectively, equivalent to improvements of 0.47, 0.30, and 0.45 on a 6‐point IAGI scale.
We reported elsewhere trials comparing vitamin D and potent corticosteroids for scalp psoriasis (Analysis 19.5) and inverse psoriasis (Analysis 17.5).
Sensitivity analyses
We explored differences in within‐patient and between‐patient designs using one‐way sensitivity analysis (Table 10). In both types of design, the difference between vitamin D and potent corticosteroid was not statistically significant, but we associated the pooled results with substantial levels of heterogeneity (Higgins 2011). The SMD for the 5 within‐patient studies (554 participants) was 0.17 (95% CI ‐0.20 to 0.54; I² statistic = 81.9%). The SMD for the 9 between‐patient studies (2988 participants) was 0.10 (95% CI ‐0.11 to 0.31; I² statistic = 84.9%).
We also used sensitivity analysis to explore the impact of varying the correlation coefficient (rho) for the 5 within‐patient studies. As no trial in the review reported this statistic, we tested values of 0, 0.25, 0.50, and 0.75. Varying the value of rho for the within‐patient studies had no significant effect on the findings: The pooled SMD ranged from 0.10 (95% CI ‐0.08 to 0.28; I² statistic = 90.5%; 14 studies), when we assumed the correlation to be zero, to 0.12 (95% CI ‐0.06 to 0.30; I² statistic = 94.3%), when we assumed the correlation to be 0.75.
Analysis 8: Vitamin D analogues versus corticosteroid (very potent)
This comparison considered vitamin D analogues against very potent corticosteroids for body psoriasis (see Analysis 8.5 and Table 11). We found data on one intervention‐comparator contrast: calcipotriol versus clobetasol propionate. Two between‐patient trials reported data for 82 participants. Treatment duration ranged between two and six weeks. The adequacy of treatment allocation was unclear in both studies. The SMD for the combined end point indicated that there was no statistically significant difference between the vitamin D analogue and the very potent corticosteroid: ‐0.06 (95% CI ‐0.57 to 0.44; I² statistic = 25.7%; 2 studies).
We reported elsewhere trials comparing vitamin D and very potent corticosteroids for scalp psoriasis (Analysis 19.5).
Analysis 9: Vitamin D combined with corticosteroid versus corticosteroid
This comparison considered combined treatment with vitamin D analogues and corticosteroids against potent or very potent corticosteroid for body psoriasis (see Analysis 9.5 and Table 12). Five parallel‐group studies, ranging in treatment duration from 2 to 8 weeks, provided data on 2113 participants. The adequacy of the concealment of treatment allocation was unclear in all five trials.
Effectiveness data were available for three contrasts:
-
calcipotriol plus betamethasone dipropionate versus betamethasone dipropionate;
-
calcipotriol plus betamethasone dipropionate versus clobetasol propionate; and
-
calcipotriol plus clobetasol propionate versus clobetasol propionate.
Overall, combination treatment was more effective than monotherapy with corticosteroids: SMD ‐0.26 (95% CI ‐0.52 to ‐0.00; I² statistic = 84.4%; 5 studies). This effect is equivalent to a change of 0.29 on a 6‐point IAGI scale. However, the pooled finding masks important diversity between the three intervention‐comparator contrasts. When we compared combination treatment with calcipotriol and betamethasone dipropionate with a potent steroid (betamethasone dipropionate alone), combination treatment was more effective (SMD ‐0.40; 95% CI ‐0.52 to ‐0.27; I² statistic = 41.8%; 3 studies). However, the same combination treatment was significantly less effective than monotherapy with a very potent steroid (clobetasol propionate) (SMD 0.45; 95% CI 0.09 to 0.81; I² statistic = NA). Calcipotriol in combination with clobetasol propionate however was more effective than the very potent steroid used alone (SMD ‐0.69; 95% CI ‐1.22 to ‐0.15; I² statistic = NA). Therefore, we removed pooling for this analysis, but the findings demonstrate that combination treatment with vitamin D analogue and a corticosteroid is more effective than the same steroid used as a monotherapy.
We reported elsewhere trials comparing combination therapy (with vitamin D and potent corticosteroids) against potent steroids for scalp psoriasis (Analysis 19.5).
Analysis 10: Vitamin D alone or in combination versus dithranol
This comparison considered vitamin D analogues against dithranol for body psoriasis (see Analysis 10.5 and Table 13). We identified three intervention‐comparator contrasts: calcipotriol versus dithranol, calcitriol versus dithranol, and tacalcitol versus dithranol. Seven between‐patient trials and one within‐patient trial (Grattan 1997 (H)) reported data for 1284 participants. We considered concealment of treatment allocation to be adequate in one trial (Van de Kerkhof 2006). Treatment duration ranged from 4 weeks to 12 weeks. In addition, there was some variation in the dithranol regimens employed by trials and in the baseline severity of trial participants. These factors may explain the high level of heterogeneity found in the pooled results.
The SMD for the combined end point was 0.09 (95% CI ‐0.44 to 0.63; I² statistic = 94.9%; 8 studies), indicating that there was no evidence of a statistically significant difference in effect between vitamin D analogues and dithranol. The pooled findings for calcipotriol against dithranol (SMD 0.07; 95% CI ‐0.57 to 0.71; I² statistic = 95.7%; 6 studies) and tacalcitol versus dithranol (SMD ‐0.18; 95% CI ‐0.60 to 0.25; I² statistic = NA) were aligned with, and drove, this result. However, the high levels of heterogeneity mean that findings merit closer scrutiny. Six studies contributed data from 1086 participants to the comparison of calcipotriol and dithranol. In three of these studies, calcipotriol performed significantly better than dithranol; two trials found significant differences in favour of dithranol; and one study found no significant difference between the treatments (see Analysis 10.5). A single study of 114 participants compared calcitriol against dithranol (Hutchinson 2000) and found a statistically significant difference in favour of dithranol (SMD 0.51; 95% CI 0.14 to 0.88; I² statistic = NA). This equates to just over half a point (0.56 of a point) improvement on a 6‐point IAGI scale. However, the same study found no significant difference between the treatments in the assessment using the TSS (Analysis 10.2) or the PASI (Analysis 10.3).
In light of the considerable level of observed variation within and between studies (Higgins 2011), we removed pooling from this comparison.
Analysis 11: Vitamin D alone or in combination versus other vitamin D analogue
Our review identified three intervention‐comparator contrasts for body psoriasis in this comparison: calcipotriol versus calcitriol, calcipotriol versus tacalcitol, and calcipotriol versus maxacalcitol (see Analysis 11.5 and Table 14). Four trials involving 513 participants contributed data. One trial was within‐patient (Barker 1999 (H)); three were between‐patient in design; and no trials demonstrated the concealment of treatment allocation to be adequate. Treatment duration ranged from 8 to 12 weeks.
The SMD for the combined end point indicated that there was no statistically significant difference between the treatments: ‐0.17 (95% CI ‐0.62 to 0.27; I² statistic = 78.5%; 4 studies). When we considered individual intervention‐comparator contrasts using the combined end point, calcipotriol was more effective than tacalcitol (SMD ‐0.47; 95% CI ‐0.73 to ‐0.21; I² statistic = NA), which equates to an improvement of 0.52 on a 6‐point IAGI scale. However, there was no statistically significant difference between calcipotriol and calcitriol (SMD ‐0.41; 95% CI ‐1.46 to 0.64; I² statistic = 72.3%; 2 studies) or between calcipotriol and maxacalcitol (SMD 0.43; 95% CI ‐0.12 to 0.98; I² statistic = NA). Participants in all trials applied treatments twice daily, with the exception of tacalcitol, which was applied once daily (Veien 1997).
Sensitivity analysis
The trial by Ji 2008 used three outcome measures to assess the effects of calcipotriol and calcitriol. Both the investigators' assessment (Analysis 11.1) and the participants' assessment found no difference between the two vitamin D products (Analysis 11.4), but the TSS found a statistically significant difference in favour of calcipotriol (Analysis 11.2). As findings for Ji 2008 varied depending on the outcome measure used, we tested the impact of using TSS data for the combined end point instead of IAGI data. The sensitivity analysis demonstrated that findings were robust, both for the SMD for the combined end point for all treatments (SMD ‐0.28; 95% CI ‐0.66 to 0.10; I² statistic = 70.6%; 4 studies) and for the comparison of calcipotriol and calcitriol (SMD ‐0.52; 95% CI ‐1.19 to 0.15; I² statistic = 44.9%; 2 studies).
Analysis 12: Vitamin D alone or in combination versus vitamin D + corticosteroid
Our review identified 12 intervention‐comparator contrasts for body psoriasis, involving 3 vitamin D analogues, 2 combination products, and 7 different corticosteroids (see Analysis 12.5 and Table 15). Seventeen trials involving 5856 participants contributed data. Sixteen trials were between‐patient, and 1 was within‐patient in design (Salmhofer 2000). Treatment duration ranged from 2 to 12 weeks. Four trials adequately concealed treatment allocation, but concealment was inadequate in one trial (in the other trials, insufficient data were reported to allow an assessment of adequacy).
Overall, vitamin D plus corticosteroid was more effective than vitamin D alone: The SMD for the combined end point was 0.46 (95% CI 0.33 to 0.59; I² statistic = 83.3%; 17 studies), which translates into half of 1 point (0.50) on a 6‐point IAGI scale. The substantial level of heterogeneity reflects not only different dosing schedules of the intervention and comparator products, but also the different potency of the corticosteroids and the different vitamin D analogues evaluated; we therefore removed pooling (Higgins 2011).
Twice‐daily calcipotriol was significantly less effective than combination treatment with betamethasone dipropionate. This finding held whether participants applied the corticosteroid separately at night time (SMD 0.56; equivalent to 0.61 on a 6‐point IAGI scale) or as a combined product used once daily or twice daily (SMD 0.43 and 0.66, respectively, translating into improvements of 0.48 and 0.73 points on a 6‐point IAGI scale). Twice‐daily calcipotriol was also significantly less effective than combination treatment with clobetasone butyrate (SMD 0.27; 95% CI 0.05 to 0.48; I² statistic = NA; 0.29 of a point on a 6‐point IAGI) or clobetasol propionate (SMD 0.88; 95% CI 0.34 to 1.42; I² statistic = NA; 0.97 of a point on a 6‐point IAGI scale). Once‐daily combination treatment with calcipotriol and betamethasone dipropionate was significantly more effective than once‐daily treatment with either calcipotriol (SMD 0.66; 95% CI 0.31 to 1.02; I² statistic = 80.9%; 2 studies) or tacalcitol (SMD 0.48; 95% CI 0.26 to 0.70; I² statistic = NA).
In none of the 12 intervention‐comparator contrasts was the vitamin D analogue significantly more effective than combined vitamin D plus corticosteroid. However, in five instances, there was no significant difference between vitamin D and the comparator (combination treatment). These included twice‐daily calcipotriol against combination treatment with betamethasone valerate or diflucortolone valerate, once‐daily calcipotriol against combination treatment with fluocinonide acetonide or hydrocortisone, and twice‐daily calcitriol against combination treatment with diflucortolone valerate.
We reported elsewhere trials comparing vitamin D and combination therapy with vitamin D/potent corticosteroids for scalp psoriasis (Analysis 19.5).
Analysis 13: Vitamin D alone or in combination versus other treatments: complex regimens
This comparison summarises complex regimens for body psoriasis, defined here as treatment sequences that do not consist of a simple head‐to‐head comparison between two active treatments (see Analysis 13.5 and Table 16). Using the combined end point, data were available for all 12 intervention‐comparator contrasts (Figure 4). Data were available from 2936 participants from 8 between‐patient trials and 1 within‐patient trial (Austad 1998). Trial duration varied between 2 and 12 weeks. One trial adequately concealed treatment allocation. As the interventions and comparators were highly variable and because two trials each contributed three pair‐wise contrasts, we did not pool the data.

Forest plot of comparison: 13 Vitamin D alone or in combination vs. other treatments: complex regimens, outcome: 13.5 Combined end point (IAGI/TSS/PASI/PAGI).
Seven intervention‐comparator contrasts found a significant difference between regimens. Six weeks' monotherapy with twice‐daily calcipotriol was less effective than clobetasol propionate (2 weeks) followed by 4 weeks' monotherapy with calcipotriol (SMD 0.60; 95% CI 0.18 to 1.02) (Austad 1998). A similar effect was evident when calcipotriol monotherapy (once daily for two weeks, then twice daily for four weeks) was compared with two weeks of treatment with calcipotriol (mornings) and fluocinonide acetonide (evenings), followed by 4 weeks' monotherapy with calcipotriol (SMD 0.66; 95% CI 0.01 to 1.32) (Wozel 2001). These benefits translated into improvements of 0.66 and 0.72 (i.e. around two‐thirds of a point) on a 6‐point IAGI scale.
The 12‐week trial by White 2006 (H)/White 2006 (P) compared 3 regimens; all included an initial phase in which participants applied once‐daily combination treatment with calcipotriol and betamethasone dipropionate for 4 weeks, but differed in their subsequent 8‐week maintenance phase. Maintenance therapy with twice‐daily placebo ointment was significantly less effective than maintenance with either calcipotriol ointment (SMD 0.27; 95% CI 0.12 to 0.41) or maintenance with calcipotriol on weekdays and combination treatment at weekends (SMD 0.51; 95% CI 0.37 to 0.66). When we directly compared the two regimens with active maintenance options, the alternating (weekday/weekend) approach was significantly more effective (SMD 0.26; 95% CI 0.11 to 0.40). The benefits of these 3 regimens equate to an improvement of 0.29, 0.56, and 0.28 of a point, respectively, on a 6‐point IAGI scale. These findings, based on the investigators' assessment of severity, were aligned with those of both the PASI assessment (Analysis 13.3) and the participants' assessment (PAGI) (Analysis 13.4).
Ortonne 2004 demonstrated that four weeks of treatment with a combination product of calcipotriol and betamethasone dipropionate followed by monotherapy with calcipotriol for four weeks was significantly more effective than monotherapy with tacalcitol (SMD 0.54; 95% CI 0.36 to 0.72) (0.59 on a 6‐point IAGI scale). Findings from the investigators' assessment (Analysis 13.1) were aligned with the PASI assessment (Analysis 13.3) and the participants' assessment (Analysis 13.4).
Kragballe 2004 compared 12 weeks of calcipotriol monotherapy with 2 complex regimens, both of which involved different sequences of combination therapy (calcipotriol/betamethasone dipropionate) and calcipotriol. When we directly compared these two complex regimens, 8 weeks of combination therapy followed by 4 weeks of once‐daily calcipotriol was significantly less effective than a routine involving 4 weeks of combination therapy followed by 8 weeks of once‐daily calcipotriol on weekdays and combination therapy at the weekend (SMD 0.24; 95% CI 0.08 to 0.40, equivalent to 0.27 (¼ of 1 point) on a 6‐point IAGI scale). This finding was based on the investigators' assessment (IAGI), which was very similar to the participants' (PAGI) assessment (Analysis 13.4). However, the PASI found a non‐significant trend in favour of the weekday/weekend regimen (Analysis 13.3).
In five intervention‐comparator contrasts, we found no significant difference. A single study reported two of the non‐significant intervention‐comparator contrasts: Kragballe 2004 compared 12 weeks of calcipotriol monotherapy with each of the 2 complex regimens described in the paragraph above. Compared with monotherapy, participants who applied once‐daily combination treatment (calcipotriol/betamethasone dipropionate) for 8 weeks followed by once‐daily calcipotriol for 4 weeks did not experience a significantly greater improvement (SMD ‐0.12; 95% CI ‐0.29 to 0.04). Similarly, the psoriasis of participants on monotherapy with twice‐daily calcipotriol did not improve significantly more or less than the disease in participants who applied once‐daily combination treatment (calcipotriol/betamethasone dipropionate) for 4 weeks followed by 8 weeks using once‐daily calcipotriol (weekdays) and once‐daily combination therapy (weekends) (SMD 0.13; 95% CI ‐0.04 to 0.29). These findings were based on the investigators' assessment (IAGI), which were consistent with those of the participants (Analysis 13.4) and with the PASI assessment (Analysis 13.3).
Similarly to Kragballe 2004, Saraceno 2007 compared 12 weeks of calcipotriol monotherapy with 4 weeks of combined therapy followed by 8 weeks of twice‐daily calcipotriol. The SMD for the combined end point (0.29; 95% CI ‐0.04 to 0.62) showed a non‐significant trend in favour of the complex regimen. Yang 2009 also explored how monotherapy with calcipotriol compared with combined vitamin D/corticosteroid treatment. A 6‐week course of monotherapy with calcipotriol was not significantly different to a sequential regimen involving halometasone (SMD 0.41; 95% CI ‐0.05 to 0.86). Lahfa 2003 found that the effect of clobetasol propionate combined with calcipotriol was similar to the effect of a regimen where the same corticosteroid was used in conjunction with calcitriol: SMD ‐0.19 (95% CI ‐0.54 to 0.16).
Analysis 14: Vitamin D alone or in combination versus other treatment: long‐term studies (> 24 weeks)
This comparison included active‐controlled studies of psoriasis of the body that were at least 24 weeks in duration (see Analysis 14.5 and Table 17). One longer‐term placebo‐controlled trial of the body (Katz 1991a) and two long‐term scalp trials (Luger 2008; Poulin 2010) did not meet the inclusion criteria for this comparison, so we evaluated them elsewhere (Analyses 2, 19, and 18, respectively).
This comparison included one trial, Kragballe 2006, which was a between‐patient trial that compared 3 52‐week regimens with all treatments used once daily:
-
first, combination treatment with calcipotriol and betamethasone dipropionate;
-
second, alternating treatment with combination therapy for 4 weeks, then calcipotriol for 4 weeks; and
-
third, combination therapy for 4 weeks, then calcipotriol for 48 weeks.
In total, 297 participants contributed data to the analysis. The only outcome measure from the trial that could be included in our review was the Investigator's Global Assessment of Disease Severity (scored from 0, absent, to 5, severe); therefore, results from this section are identical to those in Analysis 14.1. Data were unsuitable for pooling because the same participants contributed to more than one analysis. The adequacy of the concealment of treatment allocation was unclear in this trial.
Data from the combined end point showed there was no significant difference between the three long‐term regimens (Figure 5). One year's combination therapy was not significantly better than either the alternating regimen (SMD ‐0.09; 95% CI ‐0.36 to 0.18) or the regimen of treatment with 4 weeks of combination therapy followed by 48 weeks of calcipotriol (SMD ‐0.18; 95% CI ‐0.47 to 0.10). In both these comparisons, combination therapy achieved a larger absolute benefit, but the difference was not statistically significant. When we compared the alternating therapy with the regimen of 4 weeks' combination therapy followed by 48 weeks of calcipotriol, the SMD for the IAGI also indicated the 2 regimens were not statistically significantly different: ‐0.09 (95% CI ‐0.37 to 0.19).

Forest plot of comparison: 14 Vitamin D alone or in combination vs. other treatment: long term studies (>24wks), outcome: 14.5 Combined end point (IAGI/TSS/PASI/PAGI).
Findings were based on unpublished data supplied by the trial sponsor. Although these data were described as 'intention‐to treat', just 47% of the enrolled participants contributed data to the 52‐week assessment. The reasons why participants withdrew are summarised in Analysis 14.6, Analysis 14.7, and Analysis 14.8.
Analysis 15: Vitamin D analogues versus other treatment
This comparison incorporated all other vitamin D head‐to‐head comparisons of treatments for psoriasis of the body (excluding inverse psoriasis) that we had not already included (see Analysis 15.5 and Table 18). We included 12 intervention‐comparator contrasts, with data using the combined end point available for 11 of these contrasts. No effectiveness data were available for the comparison of calcipotriol and combined treatment with tazarotene gel plus mometasone furoate cream (Guenther 2000), but the trial did report data on withdrawal and adverse events. Thirteen between‐patient trials and 6 within‐patient trials provided data for the combined end point from 2364 participants. Trial duration ranged between 4 and 12 weeks. Three studies adequately concealed treatment allocation. In light of the pharmacological diversity of the comparators, we only pooled data within subgroups.
In three intervention‐comparator contrasts, vitamin D was significantly more effective than the comparator. Specifically, twice‐daily calcipotriol was more effective than coal tar polytherapy (SMD ‐0.59; 95% CI ‐0.87 to ‐0.31; I² statistic = 0%; 2 studies) and propylthiouracil cream (SMD ‐2.24; 95% CI ‐3.23 to ‐1.25; I² statistic = NA). On a 6‐point IAGI scale, these equate to improvements of 0.65 of a point and 2.46 points, respectively. Twice‐daily vitamin D was significantly more effective than once‐daily treatment (SMD ‐0.20; 95% CI ‐0.32 to ‐0.07; I² statistic = 0%; 3 studies), achieving an additional improvement of around 0.22 of a point on a 6‐point IAGI scale. This finding was based on dosing assessments of 2 vitamin D products: calcipotriol (SMD ‐0.19; 95% CI ‐0.37 to ‐0.02; I² statistic = 12%; 2 studies) and combination treatment with calcipotriol and betamethasone dipropionate (SMD ‐0.20; 95% CI ‐0.41 to 0.00; I² statistic = NA).
In the remaining eight intervention‐comparator contrasts, we found no significant difference between twice‐daily calcipotriol and the comparators. This finding held for the comparison against the following products: coal tar monotherapy (SMD ‐0.53; 95% CI ‐1.74 to 0.68; I² statistic = 91.1%; 3 studies); nicotinamide, either alone (SMD ‐0.09; 95% CI ‐0.49 to 0.31; I² statistic: NA) or in combination with calcipotriol (SMD 0.19; 95% CI ‐0.14 to 0.52; I² statistic = NA); betamethasone dipropionate ointment and salicylic acid (SMD ‐0.05; 95% CI ‐0.26 to 0.15; I² statistic = NA); tacrolimus ointment (SMD ‐0.55; 95% CI ‐1.28 to 0.17; I² statistic = 75.9%; 2 studies); tazarotene (SMD ‐0.10; 95% CI ‐0.35 to 0.16; I² statistic = 0%; 2 studies); and vitamin B12 cream (SMD ‐0.55; 95% CI ‐1.33 to 0.24; I² statistic = NA). The addition of occlusion to calcipotriol did not significantly improve the drug's effectiveness (SMD ‐0.18; 95% CI ‐2.04 to 1.68; I² statistic = 96.2%; 2 studies).
Two of the three trials comparing calcipotriol with coal tar monotherapy found a significant difference in favour of calcipotriol (De Simone 1993; Tham 1994); the other trial found a significant difference in favour of coal tar (Alora‐Palli 2010). This apparent contradiction may reflect different formulations of coal tar, treatment durations, or different baseline disease severity. Alora‐Palli 2010 also assessed effectiveness and quality of life over the six‐week post‐treatment period, finding that the coal tar group maintained their improvement significantly better than those treated with calcipotriol (see section (c) Quality of life measures).
The two occlusion trials used very different regimens and may be better considered separately. Hindsén 2006 (H) compared calcipotriol with occlusion (applied once weekly for 2 weeks) followed by 4 weeks off treatment against 6 weeks of calcipotriol monotherapy. This trial does not provide a simple assessment of occlusion, since, additionally, treatment is withdrawn. This parallel‐group trial contributed data from 209 participants with moderately severe disease and found monotherapy was significantly more effective at the 6‐week end point (SMD ‐1.11; 95% CI ‐1.40 to ‐0.81). In the other trial, 19 participants were treated for 8 weeks with twice‐daily calcipotriol on both sides of the body, and one side was randomised to receive overnight occlusion with polythene. Bourke 1993b found a significant difference in favour of occlusion (SMD 0.79; 95% CI 0.13 to 1.45); the trial did not explicitly state the severity of participants.
We reported elsewhere trials comparing vitamin D and other treatments for scalp psoriasis (Analysis 19.5) and inverse psoriasis (Analysis 17.5).
Analysis 16: Flexural/facial psoriasis: placebo‐controlled trials
This comparison included placebo‐controlled trials of topical treatments for inverse or facial psoriasis (see Analysis 16.5 and Table 19). We found evidence on four treatments in this comparison: the potent steroid betamethasone valerate; the vitamin D analogue calcipotriol; and two topical calcineurin inhibitors, pimecrolimus and tacrolimus. We identified only one placebo‐controlled trial evaluating tacrolimus ointment (Lebwohl 2004), but the study did not report any effectiveness data suitable for this review. However, the study did contribute data on adverse events and withdrawal rates. We pooled only subtotals in this comparison.
Using the combined end point, data were available for three of the four topical treatments for inverse psoriasis. Two between‐patient trials contributed data from 122 participants. Gribetz 2004 was a eight‐week study that evaluated twice‐daily pimecrolimus cream. The four‐week trial by Kreuter 2006 (P) compared betamethasone valerate, calcipotriol, and pimecrolimus against placebo; all treatments were applied once daily. Treatment allocation was adequately concealed in one trial (Gribetz 2004). Therefore, we based the findings for each treatment on a single study.
The SMD for the combined end point found a statistically significant difference in favour of betamethasone valerate (SMD ‐2.83; 95% CI ‐3.79 to ‐1.88) and calcipotriol ointment (SMD ‐1.08; 95% CI ‐1.77 to ‐0.40). These equate to improvements of 3.25 points and 1.24 points on a 6‐point IAGI scale. Pimecrolimus cream was also significantly more effective than vehicle (SMD ‐0.86; 95% CI ‐1.30 to ‐0.41; I² statistic = 0%), equivalent to almost 1 point on a 6‐point IAGI. This result pooled data on twice‐daily applications for 8 weeks (SMD ‐1.07; 95% CI ‐1.69 to ‐0.45) and once‐daily pimecrolimus cream for 4 weeks (SMD ‐0.62; 95% CI ‐1.27 to 0.02). These findings suggest that different dosing schedules may influence efficacy.
Analysis 17: Flexural/facial psoriasis: vitamin D alone or in combination versus other treatment
This comparison included head‐to‐head trials of treatments for inverse psoriasis, where we compared vitamin D with an active control (see Analysis 17.5 and Table 20). We identified five intervention‐comparator contrasts. Four treatments were compared with calcipotriol: once‐daily betamethasone valerate, combined treatment with calcipotriol and hydrocortisone, calcitriol, and pimecrolimus. Calcitriol was compared with tacrolimus.
Using the combined end point, data were available for all five intervention‐comparator contrasts. Four trials, varying in duration from 4 to 8 weeks, contributed data from 588 participants. Three studies were between‐patient trials, and one was a within‐patient study (Ortonne 2003). The adequacy of concealment of treatment allocation was unclear in all four trials.
When applied to sensitive areas of the body, calcipotriol was significantly less effective than three of the comparators. These included betamethasone valerate (SMD 2.02; 95% CI 1.20 to 2.84) (Kreuter 2006 (H)), combination treatment with calcipotriol and hydrocortisone (SMD 0.30; 95% CI 0.11 to 0.50) (Ortonne 2010), and calcitriol (SMD 0.61; 95% CI 0.28 to 0.94) (Ortonne 2003). On a 6‐point IAGI scale, the additional benefit equates to 2.22 points for betamethasone valerate, ⅓ of a point for combination treatment with hydrocortisone, and ⅔ of a point for calcitriol.
There was no significant difference between vitamin D and the topical calcineurin inhibitors (calcipotriol versus pimecrolimus: SMD ‐0.53 (95% CI ‐1.17 to 0.11; I² statistic = NA); calcitriol versus tacrolimus: SMD 0.42 (95% CI ‐0.15 to 0.98; I² statistic = NA)).
Analysis 18: Scalp psoriasis: placebo‐controlled trials
This comparison included placebo‐controlled trials of treatments for scalp psoriasis (see Analysis 18.5, Figure 6, and Table 21). We included evidence on 11 treatments in this comparison, with data from the combined end point available for all 11 treatments. Thirteen between‐patient trials and 1 within‐patient trial (Lepaw 1978) contributed data from 3011 participants. Trial duration ranged between two and eight weeks. Concealment of treatment allocation was adequate in one trial.

Forest plot of comparison: 18 Scalp psoriasis: placebo‐controlled trials, outcome: 18.5 Combined end point (IAGI/TSS/PASI/PAGI).
Two treatments were not significantly more effective than placebo. These were ciclopirox olamine shampoo (SMD ‐0.07; 95% CI ‐0.82 to 0.68; I² statistic = NA) and salicylic acid (SMD ‐0.86; 95% CI ‐1.79 to 0.06; I² statistic = NA). Of the nine treatments demonstrated to be significantly more effective than placebo, corticosteroids achieved the largest effects. Two very potent corticosteroids, amcinonide (SMD ‐1.42; 95% CI ‐1.80 to ‐1.04; I² statistic = NA) and clobetasol propionate (SMD ‐1.57; 95% CI ‐1.81 to ‐1.34; I² statistic = 43.3%; 4 studies), delivered benefits equating to almost 2 points (1.70 and 1.88 points, respectively) on a 6‐point IAGI (Investigator's Assessment of Global Improvement) scale. Betamethasone dipropionate combined with salicylic acid achieved a similar effect (SMD ‐1.48; 95% CI ‐2.50 to ‐0.47; I² statistic = NA), translating into 1.77 point improvement on the 6‐point IAGI over and above placebo.
When used as monotherapy, the 2 potent corticosteroids evaluated were both more effective than placebo: Betamethasone dipropionate (SMD ‐1.09; 95% CI ‐1.29 to ‐0.90; I² statistic = 0%; 2 studies) had a smaller effect than betamethasone valerate (SMD ‐1.40; 95% CI ‐1.75 to ‐1.05; I² statistic = NA), although the difference was not statistically significant. Calcipotriol had the smallest observed benefit (SMD ‐0.72; 95% CI ‐1.28 to ‐0.16; I² statistic = 69.2%; 2 studies). When calcipotriol was combined with betamethasone dipropionate, the pooled effect was larger than for calcipotriol used alone (SMD ‐0.97; 95% CI ‐1.61 to ‐0.32; I² statistic = 90.2%; 2 studies), or 1.16 points on a 6‐point improvement scale. Figure 6 shows that both trials found combination therapy to be significantly more effective, but Jemec 2008 (P) found a significantly larger effect (SMD ‐1.28; 95% CI ‐1.48 to ‐1.08) than Tyring 2010 (SMD ‐0.62; 95% CI ‐0.98 to ‐0.27). Participants in the two trials contributing data to the analysis of combination therapy differed in their ethnicity: Tyring 2010 recruited 177 people of Hispanic, Latino, Black, and African American ethnicity; in the trial by Jemec 2008 (P), over 96% of the 1505 enrollees were white. In addition, the trial by Jemec 2008 (P) included a larger proportion of people with severe or very severe disease (37% versus 20%). These factors may help explain the considerable level of heterogeneity (Higgins 2011) observed in the pooled effect for combination therapy.
Sensitivity analysis
We pooled data for the two potent corticosteroids, betamethasone dipropionate and betamethasone valerate. The SMD for the combined end point was ‐1.18 (95% CI ‐1.40 to ‐0.96; I² statistic = 19.9%; 3 studies), equating to 1.41 points on a 6‐point IAGI scale. For the 3 very potent corticosteroids, the SMD was ‐1.51 (95% CI ‐1.70 to ‐1.31; I² statistic = 37.5%; 6 studies), translating as a 1.80 point improvement over placebo on the IAGI.
Analysis 19: Scalp psoriasis: vitamin D alone or in combination versus other treatment
This comparison included head‐to‐head trials of treatments for scalp psoriasis in which one of the interventions was a vitamin D product (used either as monotherapy or in combination with another product) (see Analysis 19.5 and Table 22).
We identified six intervention‐comparator contrasts, and data on the combined end point were available for all these contrasts. All studies were parallel‐group in design (between‐patient). Twelve studies contributed data from 5413 participants. Trial duration ranged from 4 to 8 weeks in 11 studies, but duration was 52 weeks in one trial (Luger 2008). The adequacy of the concealment of treatment allocation was unclear in all 12 trials.
Based on the combined end point scores, monotherapy with vitamin D was consistently less effective than monotherapy with potent or very potent corticosteroids, and it was also significantly less effective than combination therapy with vitamin D and a potent steroid. Specifically, calcipotriol was significantly less effective than betamethasone dipropionate (SMD 0.48; 95% CI 0.32 to 0.64; I² statistic = 60.4%; 2 studies), betamethasone valerate (SMD 0.37; 95% CI 0.20 to 0.55; I² statistic = 0%; 2 studies), and clobetasol propionate (SMD 0.37; 95% CI 0.05 to 0.69; I² statistic = NA). On a 6‐point investigators' global assessment of improvement (IAGI) scale, these SMDs translate into 0.62, 0.48, and 0.48 points, respectively.
Combination treatment achieved a significantly greater benefit than either calcipotriol alone or betamethasone dipropionate alone. Calcipotriol was significantly less effective than combination treatment (SMD 0.64; 95% CI 0.44 to 0.84; I² statistic = 82.3%; 4 studies), with combined therapy delivering a benefit equivalent to 0.83 of a point on a 6‐point IAGI. Combination treatment was significantly more effective than monotherapy with betamethasone dipropionate (SMD ‐0.18; 95% CI ‐0.26 to ‐0.10; I² statistic = 0%; 3 studies), translating into a net benefit of 0.24 of a point on a 6‐point IAGI scale.
Compared with coal tar polytherapy, calcipotriol achieved a larger benefit, though this was not statistically significant at the 5% level (SMD ‐0.45; 95% CI ‐0.92 to 0.02; I² statistic = 89.8%; 3 studies).
(2) Secondary outcome measures
(a) Withdrawal rates (total rate; withdrawal due to adverse events; withdrawal due to treatment failure)
Analysis 1: Vitamin D analogues versus placebo
We pooled withdrawal data from seven of the eight vitamin D analogues using a random‐effects risk difference (RD) metric (see Analysis 1.6, Analysis 1.7, and Analysis 1.8). There were no withdrawal data for the comparison of calcipotriol plus occlusion versus placebo.
There was no significant difference in the pooled rate of withdrawals from the trials for any reason (total withdrawals) (RD: ‐0.02; (95% CI ‐0.05 to 0.00; I² statistic = 51.4%). Rates of withdrawals due to adverse events were not statistically significantly different (RD ‐0.00; 95% CI ‐0.02 to 0.01; I² statistic = 36.4%), and neither were withdrawals due to treatment failure (RD ‐0.03; 95% CI ‐0.05 to 0.00; I² statistic = 81.7%). Individually, none of the eight vitamin D analogues were significantly different to placebo in any of the three withdrawal rates.
Analysis 2: Corticosteroid (potent) versus placebo
This comparison included 10 potent corticosteroids. No withdrawal data were available for diflorasone diacetate, and some withdrawal data were missing for fluticasone propionate, mometasone furoate, and betamethasone dipropionate. Where available, we pooled data using a random‐effects risk difference metric (see Analysis 2.6, Analysis 2.7, and Analysis 2.8). There was a small but statistically significant difference in favour of potent corticosteroids for withdrawals from the trials for any reason (total withdrawals): RD ‐0.14 (‐0.22 to ‐0.05; I² statistic = 81.5%). This finding was driven by two large trials of once‐daily betamethasone dipropionate (Fleming 2010 (P); Kaufmann 2002 (P)) and two small trials of betamethasone dipropionate used as maintenance (weekend pulse therapy) (Katz 1987a; Katz 1991a). In the other corticosteroids, the RD showed no statistically significant difference.
There was no significant difference in the pooled rate of withdrawals due to adverse events (RD ‐0.01; 95% CI ‐0.05 to 0.02; I² statistic = 60.9%). However, betamethasone dipropionate once daily was associated with statistically significantly lower rates of withdrawal due to adverse events than placebo (RD ‐0.07; 95% CI ‐0.11 to ‐0.02; I² statistic = NA).
For the rate of withdrawals due to treatment failure (Analysis 2.8), findings differed by treatment duration; therefore, we only pooled subgroup data. For short‐term treatments, there was no difference relative to placebo (RD 0.00; 95% CI ‐0.02 to 0.02; I² statistic = 0.0%). This is the pooled effect for the placebo comparisons with betamethasone valerate, budesonide, desonide, and hydrocortisone buteprate (data on withdrawals due to treatment failure for once‐daily and twice‐daily betamethasone dipropionate were not available). For maintenance treatment with betamethasone dipropionate, there was a statistically significant difference in favour of maintenance treatment when compared with placebo: RD ‐0.46; 95% CI ‐0.61 to ‐0.31; I² statistic = 0.0% (Katz 1987a; Katz 1991a).
Analysis 3: Corticosteroid (very potent) versus placebo
We identified withdrawal data for two of the three very potent corticosteroids in this comparison and pooled data using a random‐effects risk difference metric (see Analysis 3.6, Analysis 3.7, and Analysis 3.8). There were no withdrawal data available for halcinonide. There were no statistically significant differences between very potent corticosteroids and placebo for any type of withdrawal or for any individual treatment. For total withdrawals, the risk difference was ‐0.05 (95% CI ‐0.10 to 0.01; I² statistic = 83.7%). Differences in withdrawals due to adverse events (RD ‐0.00; 95% CI ‐0.01 to 0.01; I² statistic = 0.0%) and withdrawals due to treatment failure (RD ‐0.00; 95% CI ‐0.02 to 0.01); I² statistic = 13.5%) were also small and non‐significant.
Analysis 4: Dithranol versus placebo
We pooled withdrawal data on dithranol versus placebo using a random‐effects risk difference metric (see Analysis 4.6, Analysis 4.7, and Analysis 4.8). There were no statistically significant differences between dithranol and placebo for any type of withdrawal. For total withdrawals, the risk difference was 0.00 (95% CI ‐0.09 to 0.09; I² statistic = 0%). Differences in withdrawals due to adverse events (RD 0.00; 95% CI ‐0.05 to 0.05; I² statistic = 0%) and withdrawals due to treatment failure (RD 0.00; 95% CI ‐0.11 to 0.11; I² statistic = 0%) were also small and non‐significant.
Analysis 5: Vitamin D combination products versus placebo
We pooled data from trials of vitamin D combination products using a random‐effects risk difference (RD) metric (see Analysis 5.6, Analysis 5.7, and Analysis 5.8). In all three withdrawal measures, combined treatment ‐ whether used once or twice daily ‐ was significantly less likely to lead to withdrawal from the trial. This finding held for total withdrawals (RD ‐0.12; 95% CI ‐0.17 to ‐0.07; I² statistic = 59.3%), withdrawals due to adverse events (RD ‐0.07; 95% CI ‐0.11 to ‐0.04; I² statistic = 55.0%), and withdrawals due to treatment failure (RD ‐0.09; 95% CI ‐0.12 to ‐0.06; I² statistic = 0%).
Analysis 6: Other treatment versus placebo
We report findings separately for 22 of the 26 treatments considered; no withdrawal data were available for four placebo comparisons: those involving a herbal skin care product, topical sirolimus, topical tacrolimus, or coal tar. Data on total withdrawals were available for 22 treatments; for withdrawals due to adverse events or treatment failure, data were available for 18 treatments (see Analysis 6.6, Analysis 6.7, and Analysis 6.8).
We assessed withdrawal data using a random‐effects risk difference metric. Relative to placebo, tazarotene was associated with a significantly higher rate of withdrawal due to adverse events (RD 0.07; 95% CI 0.05 to 0.10) and Mahonia aquifolium was associated with a significantly lower rate of total withdrawal (i.e. withdrawal from the trial for any reason) (RD ‐0.23; 95% CI ‐0.32 to ‐0.14). No other treatment was significantly different from placebo on any of the three withdrawal measures assessed.
Aloe vera extract 0.5% hydrophilic cream, three times per day
Sixty participants contributed data (Syed 1996). The comparison with placebo found no statistically significant difference for aloe vera extract, for total withdrawals, withdrawals due to adverse events, or withdrawals due to treatment failure.
Anti‐IL‐8 monoclonal antibody cream
Ninety‐six participants contributed data (Jin 2001). For total withdrawals, the comparison with placebo found no statistically significant difference for anti‐IL‐8 monoclonal antibody cream. The study did not report data on withdrawals due to adverse events or treatment failure.
Betamethasone 17‐valerate 21‐acetate plus tretinoin plus salicylic acid
Eighty‐five participants contributed data (Santoianni 2001). The comparison with placebo found no statistically significant difference for betamethasone 17‐valerate 21‐acetate plus tretinoin plus salicylic acid for total withdrawals, withdrawals due to adverse events, or withdrawals due to treatment failure.
Caffeine (topical) 10%, three times per day
Thirty‐nine participants contributed data (Vali 2005). The comparison with placebo found no statistically significant difference for topical caffeine for total withdrawals, withdrawals due to adverse events, or withdrawals due to treatment failure.
Calcipotriene 0.005% ointment + nicotinamide 0.05% or 0.1% or 0.7% or 1.4%, twice daily
One hundred and sixty participants contributed data (Levine 2010 (P)). The comparison with placebo found no statistically significant difference for combination therapy with calcipotriol and nicotinamide for total withdrawals, withdrawals due to adverse events, or withdrawals due to treatment failure.
Dead Sea salts emollient lotion
Twenty‐four participants contributed data (Cheesbrough 1992). The comparison with placebo found no statistically significant difference for Dead Sea salts emollient lotion for total withdrawals, withdrawals due to adverse events, or withdrawals due to treatment failure.
Fish oil plus occlusion
Twenty‐five participants contributed data (Escobar 1992). The comparison with placebo found no statistically significant difference for fish oil plus occlusion for total withdrawals, withdrawals due to adverse events, or withdrawals due to treatment failure.
Herbal skin care (Dr Michaels® cleansing gel, ointment, and skin conditioner), twice daily
No withdrawal data were available for this comparison.
Hexafluoro‐1,25‐dihydroxyvitamin D3
Fifteen participants contributed data (Durakovic 2001). The comparison with placebo found no statistically significant difference for hexafluoro‐1,25‐dihydroxyvitamin D3 for total withdrawals, withdrawals due to adverse events, or withdrawals due to treatment failure.
Indigo naturalise 1.4% ointment
Fifty‐six participants contributed data from two within‐patient trials (Lin 2007; Lin 2008). The comparison with placebo found no statistically significant difference for indigo naturalise ointment for total withdrawals, withdrawals due to adverse events, or withdrawals due to treatment failure.
Kukui nut oil, three times per day
Thirty participants contributed data (Brown 2005). The comparison with placebo found no statistically significant difference for kukui nut oil for total withdrawals, withdrawals due to adverse events, or withdrawals due to treatment failure.
Mahonia aquifolium (Reliéva™), twice daily
Two hundred participants contributed data (Bernstein 2006). For total withdrawals, the comparison with placebo found a statistically significant difference for Mahonia aquifolium (RD ‐0.23; 95% CI ‐0.32 to ‐0.14). The trial did not report data on withdrawals due to adverse events or treatment failure.
Methotrexate gel
Sixty participants contributed data (Syed 2001b). The study by Sutton 2001 on methotrexate gel did not report withdrawal data. The comparison with placebo found no statistically significant difference for methotrexate gel for total withdrawals, withdrawals due to adverse events, or withdrawals due to treatment failure.
Mycophenolic acid ointment
Seven participants contributed data (Geilen 2000). The comparison with placebo found no statistically significant difference for mycophenolic acid ointment for total withdrawals, withdrawals due to adverse events, or withdrawals due to treatment failure.
NG‐monomethyl‐L‐arginine (L‐NMMA) cream
Seventeen participants contributed data (Ormerod 2000). The comparison with placebo found no statistically significant difference for NG‐monomethyl‐L‐arginine (L‐NMMA) cream for total withdrawals, withdrawals due to adverse events, or withdrawals due to treatment failure.
Nicotinamide 1.4%, twice daily
Eighty‐eight participants contributed data (Levine 2010 (P)). The comparison with placebo found no statistically significant difference for nicotinamide for total withdrawals, withdrawals due to adverse events, or withdrawals due to treatment failure.
Oleum horwathiensis
Fifty participants contributed data (Lassus 1991). The comparison with placebo found no statistically significant difference for oleum horwathiensis for total withdrawals, withdrawals due to adverse events, or withdrawals due to treatment failure.
Omega‐3 polyunsaturated fatty acids ointment
Seventy‐three participants contributed data (Henneicke‐v. Z. 1993). The comparison with placebo found no statistically significant difference for omega‐3 polyunsaturated fatty acids ointment for total withdrawals, withdrawals due to adverse events, or withdrawals due to treatment failure.
Platelet aggregation activating factor (PAF) (Ro 24‐0238)
Fifty‐two participants contributed data (Wolska 1995). The comparison with placebo found no statistically significant difference for platelet aggregation activating factor for total withdrawals. The trial did not report data on withdrawals due to adverse events or treatment failure.
Polymyxin B cream, 200,000 U/g
Fifteen participants contributed data (Stutz 1996). The comparison with placebo found no statistically significant difference for polymyxin B cream for total withdrawals. The trial did not report data on withdrawals due to adverse events or treatment failure.
PTH (1‐34) in Novasome A® liposomal cream, twice daily
Fifteen participants contributed data (Holick 2003). The comparison with placebo found no statistically significant difference for PTH (1‐34) in Novasome A® liposomal cream for total withdrawals, withdrawals due to adverse events, or withdrawals due to treatment failure.
Sirolimus (topical)
No withdrawal data were available for this comparison.
Tacrolimus ointment
No withdrawal data were available for this comparison.
Tar
No withdrawal data were available for this comparison.
Tazarotene
Two studies, with 1627 participants, contributed data (Weinstein 1996; Weinstein 2003). The comparison with placebo found no statistically significant difference for tazarotene for total withdrawals or withdrawals due to treatment failure. However, tazarotene was significantly more likely to lead to withdrawal from the trial due to adverse events (RD 0.07; 95% CI 0.05 to 0.10; I² statistic = 0%).
Theophylline 1% ointment, twice daily
Twenty‐two participants contributed data (Papakostantinou 2005). The comparison with placebo found no statistically significant difference for theophylline ointment for total withdrawals, withdrawals due to adverse events, or withdrawals due to treatment failure.
Analysis 7: Vitamin D analogues versus corticosteroid (potent)
Seven of the eight vitamin D analogues that were compared with potent corticosteroids reported withdrawal data (withdrawal data on calcipotriol versus desoxymetasone were not available) (see Analysis 7.6, Analysis 7.7, and Analysis 7.8). We pooled withdrawal data on these seven treatment comparison pairs using a random‐effects risk difference (RD) metric.
Relative to potent corticosteroid, there was a statistically significant difference in total withdrawals in favour of corticosteroids: RD 0.02 (95% CI 0.00 to 0.03; I² statistic = 0%). Pooled rates of withdrawals due to adverse events or treatment failure were not statistically significantly different. Regarding individual vitamin D analogues, the only statistically significant differences in withdrawals relative to corticosteroid were for the comparison of calcipotriol against betamethasone dipropionate (total withdrawals: RD 0.03 (95% CI 0.01 to 0.06; I² statistic = 0%); withdrawals due to adverse events: RD 0.02 (95% CI 0.00 to 0.04; I² statistic = NA)).
Analysis 8: Vitamin D analogues versus corticosteroid (very potent)
We pooled withdrawal data on calcipotriol against clobetasol propionate using a random‐effects risk difference (RD) metric (see Analysis 8.6, Analysis 8.7, and Analysis 8.8). Relative to the very potent corticosteroid, we found no statistically significant difference for calcipotriol on any of the withdrawal assessments: total withdrawals, withdrawals due to adverse events, or withdrawals due to treatment failure.
Analysis 9: Vitamin D combined with corticosteroid versus corticosteroid
We pooled withdrawal data on combination treatment (vitamin D and a corticosteroid) against monotherapy with a corticosteroid using a random‐effects risk difference (RD) metric (see Analysis 9.6, Analysis 9.7, and Analysis 9.8).
Relative to the corticosteroid, we found no statistically significant difference for combination treatment on total withdrawals, withdrawals due to adverse events, or withdrawals due to treatment failure. There were no data on the rate of withdrawals due to treatment failure for the comparison of combined treatment with calcipotriol and betamethasone dipropionate versus betamethasone dipropionate monotherapy.
Analysis 10: vitamin D alone or in combination versus dithranol
Withdrawal data were available for three intervention‐comparator pairs: calcipotriol versus dithranol, calcitriol versus dithranol, and tacalcitol versus dithranol. We pooled these data using a random‐effects risk difference (RD) metric (see Analysis 10.6, Analysis 10.7, and Analysis 10.8). For the comparison of tacalcitol versus dithranol, there were no data available on withdrawals due to adverse events or treatment failure.
There was no statistically significant difference for total withdrawals, either for individual intervention‐comparator pairs or for the pooled effect (RD ‐0.02; 95% CI ‐0.06 to 0.01; I² statistic = 0%). The pooled risk difference showed a significant difference in favour of vitamin D for withdrawals due to adverse events (RD ‐0.03; 95% CI ‐0.06 to ‐0.00; I² statistic = 26.3%), but no significant difference in the rate of withdrawals due to treatment failure (RD ‐0.00; 95% CI ‐0.02 to 0.02; I² statistic = 0%).
Analysis 11: Vitamin D alone or in combination versus other vitamin D analogue
Two of the three vitamin D analogues head‐to‐head comparisons reported withdrawal data (withdrawal data on calcipotriol versus tacalcitol were not available). We pooled withdrawal data on calcipotriol versus calcitriol, and calcipotriol versus maxacalcitol, using a random‐effects risk difference (RD) metric (see Analysis 11.6, Analysis 11.7, and Analysis 11.8). We found no statistically significant difference on any of the withdrawal assessments: total withdrawals, withdrawals due to adverse events, or withdrawals due to treatment failure. There was also no significant difference in the withdrawal rates for the individual contrasts, calcipotriol versus calcitriol, and calcipotriol versus maxacalcitol.
Analysis 12: Vitamin D alone or in combination versus vitamin D + corticosteroid
To simplify the analysis, we summarised withdrawal data by grouping the first 10 intervention‐comparator pairs in a single category: calcipotriol versus calcipotriol and corticosteroid. The remaining comparisons were calcitriol versus calcitriol and corticosteroid, and tacalcitol versus calcipotriol and corticosteroid. We pooled withdrawal data using a random‐effects risk difference (RD) metric (see Analysis 12.6, Analysis 12.7, and Analysis 12.8). There were no data on withdrawals due to treatment failure for the comparisons of combined therapy versus calcitriol or combined therapy versus tacalcitol.
In the comparison of calcipotriol against calcipotriol plus corticosteroid, total withdrawals were statistically significantly different in favour of polytherapy: RD 0.03 (95% CI 0.01 to 0.05; I² statistic = 13.3%). We based this on findings from 4922 participants in 13 trials. Similarly, a significant difference in favour of polytherapy was evident from the data on withdrawals due to adverse events: RD 0.02 (95% CI 0.01 to 0.03; I² statistic = 32.9%). However, we found no statistically significant difference for withdrawals due to treatment failure (RD 0.01; 95% CI ‐0.00 to 0.02; I² statistic = 0%). When either calcitriol or tacalcitol was compared with combination therapy, differences in total withdrawals and in withdrawals due to adverse events were not statistically significant.
Analysis 13: Vitamin D alone or in combination versus other treatments: complex regimens
This comparison covers complex regimens, defined here as treatment sequences that do not consist of a simple head‐to‐head comparison between two active treatments. We summarised withdrawals rates on twelve intervention‐comparator contrasts (see Analysis 13.6, Analysis 13.7, and Analysis 13.8). There were data on total withdrawal rates for all 12 contrasts, but data on withdrawals due to adverse events were missing for 3 contrasts, and there were no data on withdrawals due to treatment failure for 6 contrasts.
In the analysis of total withdrawals (Analysis 13.6), there was a significant difference in favour of the complex regimen for four contrasts:
-
Participants were significantly more likely to withdraw from the trial after 12 weeks of calcipotriol than participants who received combination therapy (8 weeks) followed by calcipotriol (4 weeks) (RD 0.05; 95% CI 0.00 to 0.10).
-
Trial withdrawal rates were also significantly higher in participants receiving 12 weeks of monotherapy with calcipotriol than those treated with combination therapy (4 weeks) followed by alternating calcipotriol on weekdays and combination therapy at the weekend (8 weeks) (RD 0.08; 95% CI 0.03 to 0.13).
-
After an initial 4‐week phase with combination ointment, participants who received 8 weeks' maintenance with calcipotriol (RD 0.08; 95% CI 0.03 to 0.14) or 8 weeks' maintenance with an alternating calcipotriol/combined therapy routine (RD 0.11; 95% CI 0.06 to 0.17) were significantly less likely to withdraw than participants who used vehicle ointment for maintenance.
In the analysis of withdrawals due to adverse events (Analysis 13.7), there were no significant differences between vitamin D and any of the complex regimens.
In the analysis of withdrawals due to treatment failure (Analysis 13.8), there were significant differences in two of the six contrasts for which we had reported data. After 12 weeks of calcipotriol, participants were significantly more likely to withdraw from the trial because of treatment failure than those who received combination therapy followed by calcipotriol (RD 0.21; 95% CI 0.10 to 0.33). Withdrawals due to treatment failure were more likely in participants who received 8 weeks' monotherapy with tacalcitol than those who received combination therapy followed by calcipotriol (RD 0.05; 95% CI 0.02 to 0.08).
Analysis 14: Vitamin D alone or in combination versus other treatment: long‐term studies (> 24 weeks)
This comparison included active‐controlled trials of psoriasis of the body that were at least 24 weeks in duration (see Analysis 14.6, Analysis 14.7, and Analysis 14.8). There were three intervention‐comparator contrasts, all 52 weeks in duration and all reported by a single study (Kragballe 2006).
Participants received one of three long‐term treatments:
-
once‐daily combined calcipotriol and betamethasone dipropionate;
-
combination therapy (4 weeks) followed by calcipotriol (for 4 weeks), rotated over 52 weeks; or
-
combination therapy for 4 weeks followed by calcipotriol for 48 weeks.
There were no significant differences between these three regimens in any of the withdrawal assessments: total withdrawals, withdrawals due to adverse events, or withdrawals due to treatment failure.
Analysis 15: Vitamin D analogues versus other treatment
This comparison compared vitamin D analogue with 12 other treatments. We assessed the results from the analyses of withdrawal data using a random‐effects risk difference (RD) metric, and we report these separately (see Analysis 15.6, Analysis 15.7, and Analysis 15.8). Withdrawal data were missing only in the head‐to‐head comparison of vitamin D (alone or in combination) versus calcipotriol with occlusion.
Of the remaining 11 intervention‐comparator contrasts, we found only 1 statistically significant difference in withdrawal rates: The rate of total withdrawals was significantly lower for calcipotriol than for tacrolimus (RD ‐0.13; 95% CI ‐0.25 to ‐0.01).
Calcipotriol versus coal tar
In the comparison of calcipotriol and coal tar, we found no statistically significant difference on any of the withdrawal assessments: total withdrawals, withdrawals due to adverse events, or withdrawals due to treatment failure.
Calcipotriol versus coal tar polytherapy
In the comparison of calcipotriol and coal tar polytherapy, we found no statistically significant difference on any of the withdrawal assessments: total withdrawals, withdrawals due to adverse events, or withdrawals due to treatment failure.
Calcipotriol versus nicotinamide 1.4%, twice daily
We found no statistically significant difference on any of the withdrawal assessments: total withdrawals, withdrawals due to adverse events, or withdrawals due to treatment failure.
Calcipotriol versus calcipotriol + nicotinamide (0.05%, 0.1%, 0.7%, or 1.4%), twice daily
We found no statistically significant difference on any of the withdrawal assessments: total withdrawals, withdrawals due to adverse events, or withdrawals due to treatment failure.
Calcipotriol versus corticosteroid + salicylic acid
We found no statistically significant difference on any of the withdrawal assessments: total withdrawals, withdrawals due to adverse events, or withdrawals due to treatment failure. However, the risk difference for the withdrawal rate for adverse events was almost statistically significant in favour of combined therapy (RD 0.05; 95% CI ‐0.00 to 0.10).
Calcipotriol versus propylthiouracil cream
We found no statistically significant difference on any of the withdrawal assessments: total withdrawals, withdrawals due to adverse events, or withdrawals due to treatment failure.
Calcipotriol versus tacrolimus ointment
We found no statistically significant difference in withdrawals due to adverse events or withdrawals due to treatment failure. However, the rate of total withdrawals was significantly lower for calcipotriol than for tacrolimus (RD ‐0.13; 95% CI ‐0.25 to ‐0.01) (Ortonne 2006).
Calcipotriol versus tazarotene
We found no statistically significant difference on any of the withdrawal assessments: total withdrawals, withdrawals due to adverse events, or withdrawals due to treatment failure.
Calcipotriol versus tazarotene gel plus mometasone furoate cream
We found no statistically significant difference on any of the withdrawal assessments: total withdrawals, withdrawals due to adverse events, or withdrawals due to treatment failure.
Calcipotriol versus vitamin B12 cream
We found no statistically significant difference on any of the withdrawal assessments: total withdrawals, withdrawals due to adverse events, or withdrawals due to treatment failure.
Head‐to‐head vitamin D alone or in combination: dosing
We found no statistically significant difference on any of the withdrawal assessments: total withdrawals, withdrawals due to adverse events, or withdrawals due to treatment failure.
Head‐to‐head vitamin D alone or in combination: occlusion
We found no usable withdrawal data reported for this comparison.
Analysis 16: Flexural/facial psoriasis: placebo‐controlled trials
This comparison included placebo‐controlled trials of four topical treatments for inverse or facial psoriasis. Data on three withdrawal rates were available for all four treatments: the potent steroid betamethasone valerate; the vitamin D analogue calcipotriol; and two topical calcineurin inhibitors, pimecrolimus and tacrolimus (see Analysis 16.6, Analysis 16.7, and Analysis 16.8).
Relative to placebo, participants receiving topical tacrolimus were significantly less likely to withdraw from treatment for any reason (RD ‐0.17; 95% CI ‐0.30 to ‐0.03) or because of treatment failure (RD ‐0.11; 95% CI ‐0.19 to ‐0.02). No other treatment was significantly different from placebo on any of the three withdrawal measures assessed.
Analysis 17: Flexural/facial psoriasis: vitamin D alone or in combination versus other treatment
This comparison included head‐to‐head trials of treatments for flexural or facial psoriasis, where we compared vitamin D with an active control (see Analysis 17.6, Analysis 17.7, and Analysis 17.8). We identified five intervention‐comparator contrasts, and no withdrawal data were missing. Four treatments were compared with calcipotriol: once‐daily betamethasone valerate, combined treatment with calcipotriol and hydrocortisone, calcitriol, and pimecrolimus. Calcitriol was compared with tacrolimus.
The rate of withdrawals due to adverse events was significantly higher in people treated with calcipotriol compared to those receiving combination therapy with calcipotriol and hydrocortisone for facial psoriasis (RD 0.06; 95% CI 0.02 to 0.11) and compared to those receiving calcitriol (RD 0.09; 95% CI 0.01 to 0.18). We found no other significant differences in withdrawal rates.
Analysis 18: Scalp psoriasis: placebo‐controlled trial
This comparison included placebo‐controlled trials of 11 topical treatments for scalp psoriasis (see Analysis 18.6, Analysis 18.7, and Analysis 18.8). All treatments had data on at least one withdrawal measure, which we assessed using a risk difference (RD) metric.
Relative to placebo, participants treated with betamethasone dipropionate were significantly less likely to withdraw from the trial for any reason (total withdrawals) (RD ‐0.14; 95% CI ‐0.21 to ‐0.06), because of adverse events (RD ‐0.04; 95% CI ‐0.08 to ‐0.00), or because of treatment failure (RD ‐0.10; 95% CI ‐0.16 to ‐0.05). Participants receiving combination therapy with calcipotriol and betamethasone dipropionate were significantly less likely to withdraw from the trial for any reason (total withdrawals) (RD ‐0.09; 95% CI ‐0.16 to ‐0.03) or because of treatment failure (RD ‐0.11; 95% CI ‐0.17 to ‐0.06). We found no other significant differences in withdrawal rates.
Analysis 19: Scalp psoriasis: vitamin D alone or in combination versus other treatment
This comparison included head‐to‐head trials of treatments for scalp psoriasis in which one of the interventions was a vitamin D product (used either as monotherapy or in combination with another product) (see Analysis 19.6, Analysis 19.7, and Analysis 19.8). We identified six intervention‐comparator contrasts. There were no data for withdrawal due to treatment failure for one of these contrasts (calcipotriol versus coal tar polytherapy). No other withdrawal data were missing.
Relative to combination treatment with calcipotriol and betamethasone dipropionate, calcipotriol monotherapy was associated with a significantly higher rate of total withdrawals (RD 0.11; 95% CI 0.05 to 0.18; I² statistic = 78.5%), withdrawals due to adverse events (RD 0.06; 95% CI 0.02 to 0.09; I² statistic = 78.9%) and withdrawals due to treatment failure (RD 0.05; 95% CI 0.01 to 0.10; I² statistic = 88.2%). Compared with betamethasone dipropionate, combination therapy was also significantly less likely to result in participant withdrawal due to treatment failure (RD ‐0.01; 95% CI ‐0.02 to ‐0.00; I² statistic = 0%).
Study participants treated with calcipotriol were significantly more likely to withdraw because of adverse events than participants receiving betamethasone valerate (RD 0.03; 95% CI 0.01 to 0.06; I² statistic = 0%) or coal tar polytherapy (RD 0.08; 95% CI 0.02 to 0.14; I² statistic = NA).
(b) Adverse events (local (cutaneous) and systemic)
(i) Findings from the main review
Analysis 1: Vitamin D analogues versus placebo
We pooled data on adverse events using a random‐effects risk difference metric (see Analysis 1.9 and Analysis 1.10). There were no adverse events data for the comparison of calcipotriol plus occlusion versus placebo. Therefore, data were available for seven of the eight vitamin D analogues evaluated against placebo
Of the seven vitamin D analogues evaluated against placebo, we found only one statistically significantly difference. Twice‐daily becocalcidiol was significantly more likely to cause local adverse events than placebo (RD 0.10; 95% CI 0.00 to 0.19). There were no significant differences for the pooled risk difference for either local adverse events (RD 0.00; 95% CI ‐0.01 to 0.02; I² statistic = 0%) or systemic adverse events (RD 0.00; 95% CI ‐0.01 to 0.01; I² statistic = 0%).
Analysis 2: Corticosteroid (potent) versus placebo
We pooled data on adverse events using a random‐effects risk difference metric (see Analysis 2.9 and Analysis 2.10). Data on local adverse events were available for 7 of the 10 corticosteroids; data on systemic adverse events were available only for betamethasone dipropionate twice daily, betamethasone dipropionate (maintenance), and mometasone furoate.
The pooled analysis of local adverse events found a significant difference in favour of corticosteroids (RD ‐0.04; 95% CI ‐0.08 to ‐0.00; I² statistic = 56.2%). Among the individual potent corticosteroids evaluated against placebo, we found only one statistically significantly difference. Once‐daily betamethasone dipropionate was less likely than placebo to be associated with local adverse events: RD ‐0.10 (95% CI ‐0.15 to ‐0.04; I² statistic = 2.5%). We found no significant difference in the pooled analyses of systemic adverse events data.
Analysis 3: Corticosteroid (very potent) versus placebo
We pooled data on adverse events using a random‐effects risk difference metric (see Analysis 3.9 and Analysis 3.10). The comparison with placebo found no statistically significant difference for any of the three very potent corticosteroids considered for either local adverse events or systemic adverse events.
Analysis 4: Dithranol versus placebo
We pooled data on adverse events using a random‐effects risk difference metric (see Analysis 4.9 and Analysis 4.10). The comparison with placebo found no statistically significant difference for pooled findings on local adverse events or systemic adverse events. In one study, a significant difference in favour of placebo was evident: RD 0.40 (95% CI 0.08 to 0.72; I² statistic = NA) (Volden 1992).
Analysis 5: Vitamin D combination products versus placebo
We pooled data on adverse events using a random‐effects risk difference metric (see Analysis 5.9 and Analysis 5.10). The rate of local adverse events was significantly lower for combination therapy compared with placebo (RD ‐0.05; 95% CI ‐0.08 to ‐0.02; I² statistic = 10.0%). There was no significant difference in the rate of systemic adverse events.
Analysis 6: Other treatment versus placebo
Our review reports findings separately for 22 of the 26 comparisons considered (see Analysis 6.9 and Analysis 6.10). No data on adverse events were available for placebo comparisons involving polymyxin B cream, topical sirolimus, topical tacrolimus, coal tar, or tazarotene. Data on local adverse events were available for 22 comparisons, but data on systemic adverse events were reported for just 9 of the 26 comparisons. We assessed data on adverse events using a random‐effects risk difference metric. The comparison with placebo found no statistically significant difference in the rate of either local or systemic adverse events for any treatment.
Analysis 7: Vitamin D analogues versus corticosteroid (potent)
Of the eight vitamin D analogues that were compared with potent corticosteroids, data on local adverse events were available for five comparisons, and data on systemic events were available for four comparisons (see Analysis 7.9 and Analysis 7.10). There were no data on adverse events for calcipotriol versus desoxymetasone, calcipotriol versus diflorasone diacetate, and calcitriol versus betamethasone valerate. In addition, systemic adverse events data were unavailable for calcipotriol versus fluocinonide. We pooled data on adverse effects using a random‐effects risk difference metric.
In the comparison of individual vitamin D analogues and potent corticosteroids, our review found one statistically significant difference in favour of potent corticosteroids. Pooled data from 3 trials with 1739 participants indicated that the rate of local adverse events was significantly higher in the calcipotriol group than in the group receiving betamethasone dipropionate (RD 0.07; 95% CI 0.04 to 0.09; I² statistic = 0%). This finding drove the pooled (class) result for local adverse events (RD 0.07; 95% CI 0.02 to 0.11; I² statistic = 82.4%). Our review found no other statistically significant differences for local or systemic adverse events in this comparison.
Analysis 8: Vitamin D analogues versus corticosteroid (very potent)
We pooled withdrawal data on adverse effects using a random‐effects risk difference metric (see Analysis 8.9 and Analysis 8.10). There was no statistically significantly difference between calcipotriol and clobetasol propionate, either for local adverse events (RD ‐0.05; 95% CI ‐0.18 to 0.08) or systemic events (RD ‐0.05; 95% CI ‐0.18 to 0.08).
Analysis 9: Vitamin D combined with corticosteroid versus corticosteroid
We pooled withdrawal data on combination treatment (vitamin D and a corticosteroid) against monotherapy with a corticosteroid using a random‐effects risk difference metric (see Analysis 9.9 and Analysis 9.10). No adverse events data were available for the comparison of combination (calcipotriol/clobetasol propionate) therapy and clobetasol propionate.
The pooled analysis found no statistically significant difference in adverse event rates between combination (calcipotriol/betamethasone dipropionate) therapy and betamethasone dipropionate. There was no significant difference in local adverse events for combination (calcipotriol/betamethasone) therapy and clobetasol propionate, and there were no data on systemic adverse events for this comparison.
Analysis 10: Vitamin D alone or in combination versus dithranol
Adverse events data were available for three intervention‐comparator pairs: calcipotriol versus dithranol, calcitriol versus dithranol, and tacalcitol versus dithranol. We pooled these data using a random‐effects risk difference metric (see Analysis 10.9 and Analysis 10.10).
Vitamin D was statistically significantly less likely to cause local adverse events (RD ‐0.32; 95% CI ‐0.43 to ‐0.20; I² statistic = 84.5%), although substantial heterogeneity was evident in the pooled statistic (Higgins 2011). This finding also held for each of the three intervention‐comparator pairs, with the effect size ranging from ‐0.25 (calcipotriol versus dithranol) to ‐0.67 (calcitriol versus dithranol). However, the analysis of systemic adverse events found no statistically significant differences.
Analysis 11: Vitamin D alone or in combination versus other vitamin D analogue
We reported local adverse events data on two of the vitamin D analogues head‐to‐head comparisons (see Analysis 11.9 and Analysis 11.10). Systemic adverse events data were not available for any of the three comparisons. We pooled data on adverse effects using a random‐effects risk difference metric. Overall, our review found no statistically significant difference on either local or systemic adverse events when comparing pooled vitamin D analogues head‐to‐head. However, in the comparison of calcipotriol against calcitriol, the rate of local adverse events was significantly lower for calcitriol: RD 0.07 (95% CI 0.01 to 0.14; I² statistic = NA).
Analysis 12: Vitamin D alone or in combination versus vitamin D + corticosteroid
To simplify the comparison, we summarised adverse events data by grouping the first 10 intervention‐comparator pairs in a single category: calcipotriol versus calcipotriol and corticosteroid. The remaining comparisons were 1) calcitriol versus calcitriol and 2) corticosteroid and tacalcitol versus calcipotriol and corticosteroid. There were no data on systemic adverse events for the comparison of tacalcitol against calcipotriol and corticosteroid.
We pooled data on adverse effects using a random‐effects risk difference (RD) metric (see Analysis 12.9 and Analysis 12.10). In the local adverse events comparison of vitamin D against vitamin D plus corticosteroid, our review found a statistically significantly difference in favour of combination therapy: RD 0.06 (95% CI 0.05 to 0.08; I² statistic = 4.1%). This finding also held for each individual intervention‐comparator pair. Our analysis found no statistically significantly difference in the rates of systemic adverse events.
Analysis 13: Vitamin D alone or in combination versus other treatments: complex regimens
This comparison included 12 intervention‐comparator contrasts (see Analysis 13.9 and Analysis 13.10). Data on local adverse events were available for 11 contrasts, but there were no data on the comparison of calcipotriol (12 weeks) versus combination therapy (4 weeks) followed by calcipotriol (8 weeks). No trial in this comparison reported data on systemic adverse events.
In 4 of the 11 contrasts for which data were available, the complex regimen was associated with a significantly lower rate of local adverse events than when the vitamin D analogue was used alone. Twelve weeks of calcipotriol monotherapy was associated with significantly higher rates of local adverse events than two complex regimen comparators. Specifically, the rate of local adverse events was higher for calcipotriol monotherapy than for a regimen consisting of 8 weeks of combination therapy followed by 4 weeks of once‐daily calcipotriol (RD 0.11; 95% CI 0.06 to 0.17). Calcipotriol monotherapy was also more likely to be associated with local adverse events than 4 weeks of combination therapy followed by 8 weeks of once‐daily calcipotriol on weekdays and combination therapy at the weekend (RD 0.11; 95% CI 0.05 to 0.17) (Kragballe 2004). When we compared the two complex regimens directly, the rates of cutaneous adverse events were not significantly different.
Relative to calcipotriol, combination therapy with halometasone and calcipotriol had a significantly lower rate of adverse events of the skin (RD 0.26; 95% CI 0.07 to 0.45). An 8‐week course of tacalcitol had significantly higher rates of adverse events than a routine of 4 weeks' combined (calcipotriol/betamethasone dipropionate) therapy followed by 4 weeks' monotherapy with calcipotriol (RD 0.06; 95% CI 0.01 to 0.11).
There was no significant difference in the rate of local adverse events in any of the remaining seven intervention‐comparator contrasts.
Analysis 14: Vitamin D alone or in combination versus other treatment: long‐term studies (> 24 weeks)
This comparison included active‐controlled studies of psoriasis of the body that were at least 24 weeks in duration (see Analysis 14.9 and Analysis 14.10). No data on systemic adverse events were reported. We included one trial in this comparison: Kragballe 2006 compared 3 52‐week regimens with all treatments used once daily.
Combination therapy with calcipotriol and betamethasone dipropionate was associated with significantly lower rates of adverse events than either of the two 'complex' long‐term regimens:
-
alternating treatment with combination therapy for 4 weeks, then calcipotriol for 4 weeks (RD ‐0.08; 95% CI ‐0.17 to ‐0.00); and
-
combination therapy for 4 weeks, then calcipotriol for 48 weeks (RD ‐0.16; 95% CI ‐0.25 to ‐0.08).
The difference between the two 'complex' regimens was not statistically significant at the 5% level (RD ‐0.08; 95% CI ‐0.17 to 0.01), although there was a trend in favour of alternating therapy.
Analysis 15: vitamin D analogues versus other treatment
A vitamin D analogue was compared with 12 other treatments (see Analysis 15.9 and Analysis 15.10). Data on local adverse events were available for 10 intervention‐comparator contrasts, and systemic adverse events data were available for 8 intervention‐comparator contrasts.
We assessed results from the analyses of adverse events data using a random‐effects risk difference metric and report these separately. For local adverse events, three intervention‐comparator contrasts were significantly different. These were the comparison of calcipotriol against calcipotriol + nicotinamide (RD ‐0.17; 95% CI ‐0.30 to ‐0.03), calcipotriol versus corticosteroid + salicylic acid (RD 0.09; 95% CI 0.02 to 0.15), and calcipotriol versus tacrolimus ointment (RD ‐0.19; 95% CI ‐0.37 to ‐0.01). No trial that reported the rate of systemic adverse events found a significant difference in this outcome.
Calcipotriol versus coal tar
Our review found no statistically significant difference for local or systemic adverse events.
Calcipotriol versus coal tar polytherapy
Our review found no statistically significant difference for local or systemic adverse events.
Calcipotriol versus nicotinamide 1.4%, twice daily
Systemic adverse events data were not reported for this analysis. There was no significant difference between the local adverse event rates, although there was a trend in favour of calcipotriol (RD ‐0.15; 95% CI ‐0.32 to 0.03; I² statistic = NA).
Calcipotriol versus calcipotriol + nicotinamide (0.05%, 0.1%, 0.7%, or 1.4%), twice daily
Systemic adverse events data were not reported for this analysis. Monotherapy with calcipotriol was significantly less likely to cause local adverse events than combined therapy with nicotinamide (RD ‐0.17; 95% CI ‐0.30 to ‐0.03; I² statistic = NA).
Calcipotriol versus corticosteroid + salicylic acid
Relative to calcipotriol alone, combination therapy with betamethasone dipropionate and salicylic acid was significantly less likely to be associated with local adverse events (RD 0.09; 95% CI 0.02 to 0.15). There was no significant difference in the rate of systemic adverse events.
Calcipotriol versus propylthiouracil cream
Our review found no statistically significant difference for local or systemic adverse events.
Calcipotriol versus tacrolimus ointment
Relative to calcipotriol, tacrolimus was associated with a significantly higher rate of local adverse events (RD ‐0.19; 95% CI ‐0.37 to ‐0.01). There was no significant difference in the rate of systemic adverse events.
Calcipotriol versus tazarotene
Our review found no statistically significant difference for local or systemic adverse events.
Calcipotriol versus tazarotene gel plus mometasone furoate cream
Adverse events data were not reported for this analysis.
Calcipotriol versus vitamin B12 cream
Our review found no statistically significant difference in the rates of local adverse events. Data on systemic adverse events were not reported.
Head‐to‐head vitamin D alone or in combination: dosing
Our review found no statistically significant difference for local or systemic adverse events.
Head‐to‐head vitamin D alone or in combination: occlusion
Local adverse events data were not reported for this analysis. Our review found no statistically significant difference in the rate of systemic adverse events.
Analysis 16: Flexural/facial psoriasis: placebo‐controlled trials
This comparison included placebo‐controlled trials of four topical treatments for inverse or facial psoriasis. Data on local adverse events were available for all four treatments, but data on systemic events were reported only for one treatment, i.e. the comparison of tacrolimus against placebo (see Analysis 16.9 and Analysis 16.10).
Relative to placebo, participants receiving topical tacrolimus were significantly less likely to report local adverse events (RD ‐0.17; 95% CI ‐0.30 to ‐0.03), but there was no significant difference in the rate of systemic events. No other treatment was significantly different from placebo.
Analysis 17: Flexural/facial psoriasis: vitamin D alone or in combination versus other treatment
This comparison included head‐to‐head trials of treatments for flexural or facial psoriasis, where vitamin D was compared with an active control. We identified five intervention‐comparator contrasts (see Analysis 17.9 and Analysis 17.10). Local adverse events data were missing for the comparison of calcitriol and tacrolimus. There were no data on systemic events for any of the five contrasts.
In people treated with calcipotriol, the rate of local adverse events was significantly higher compared to those receiving combination therapy with calcipotriol and hydrocortisone for facial psoriasis (RD 0.15; 95% CI 0.08 to 0.23) and also compared to those receiving calcitriol (RD 0.09; 95% CI 0.02 to 0.17). These findings aligned with the withdrawal rates for adverse events (Analysis 17.7). We found no other significant differences in adverse events rates.
Analysis 18: Scalp psoriasis: placebo‐controlled trials
This comparison included placebo‐controlled trials of 11 topical treatments for scalp psoriasis (see Analysis 18.9 and Analysis 18.10). There were no adverse events data for two treatments, betamethasone valerate and amcinonide. Data on systemic events were available for four treatments.
Relative to placebo, participants treated with betamethasone dipropionate were significantly less likely to suffer local adverse events (RD ‐0.07; 95% CI ‐0.13 to ‐0.01; I² statistic = 0%). These findings aligned with the withdrawal rates for adverse events (Analysis 18.7). We found no other significant differences in adverse events rates.
Analysis 19: Scalp psoriasis: vitamin D alone or in combination versus other treatment
This comparison included head‐to‐head trials of treatments for scalp psoriasis in which one of the interventions was a vitamin D product (used either as monotherapy or in combination with another product) (see Analysis 19.9 and Analysis 19.10). We identified six intervention‐comparator contrasts, and there were no adverse events data.
Calcipotriol monotherapy was associated with a significantly higher rate of local adverse events than five of the comparator treatments; these included betamethasone dipropionate (RD 0.07; 95% CI 0.04 to 0.11; I² statistic = 0%), betamethasone valerate (RD 0.17; 95% CI 0.01 to 0.33; I² statistic = 76.5%), and clobetasol propionate (RD 0.19; 95% CI 0.10 to 0.28; I² statistic = 0%). Relative to calcipotriol, combined therapy with calcipotriol and betamethasone dipropionate (RD 0.09; 95% CI 0.06 to 0.12; I² statistic = 28.1%), and coal tar polytherapy (RD 0.24; 95% CI 0.15 to 0.33; I² statistic = NA), were also associated with significantly lower rates of adverse events. Compared with betamethasone dipropionate monotherapy, the rate of adverse events for combined therapy with calcipotriol and betamethasone dipropionate was not significantly different (RD ‐0.00; 95% CI ‐0.02 to 0.01; I² statistic = NA). There were no significant differences in the rates of systemic adverse events.
(ii) Findings from the separate search for additional studies of adverse events
In addition to findings on adverse events from the main review, we undertook a separate search for additional safety and tolerability studies. The update searches in 2011 identified 3 new literature reviews and 12 potentially relevant records. Eight studies (reported in seven references) met the inclusion criteria, and we excluded five studies from the review (Breneman 2007; Carboni 2005; Feldman 2007a; Hong 2010; and Hong 2011; Jacobi 2008) in addition to the 13 trials excluded in the previous edition of this review (Aste 2004; Bos 2002; Floden 1975; Franssen 1999; Kang 1998; Lebwohl 1996; Park 2002; Senter 1983; Singh 2000; Stevanovic 1977; Traulsen 2003; Uhoda 2003; Vissers 2004). Table 24 details the characteristics and key findings of the included studies, and Table 25 lists the excluded studies. Langner 1996 and van de Kerkhof 1996c also reported the study by Gerritsen 2001. Two papers reported two studies (Berth‐Jones 1993; Kimball 2008), which we analysed separately. Kimball 2008 was a review reporting findings from phase II and phase III trials of clobetasol foam (we did not locate any other reports of these studies). The study by van de Kerkhof 2002c reported a two‐phase open study of tacalcitol, where 'responders' to part 1 were eligible for part 2. Full results for part 2 were not reported separately (e.g. incidence of local adverse events was reported only for all trial participants). The study by Lambert 2002 appeared very similar to the second phase of the study reported by van de Kerkhof 2002c, but as there was no explicit evidence of an association, we analysed it as a separate trial.
| Study | Methods | Participants | Intervention(s) | Outcomes (AEs) | Summary findings | Notes | Allocation concealment |
| DESIGN: between‐patient patient delivery Concealment: unclear | N: 26 | Clobetasol propionate 0.05% shampoo, OD. Applied to dry scalp, rinsed off after 15 minutes Clobetasol propionate 0.05% gel, OD. Applied to dry scalp and left in. | Serum cortisol atrophogenicity (ultrasound measurement of skin thickness (epidermis + dermis) (mm), averaged over 3 sites of the scalp) ocular safety (intraocular pressure) DSS (10‐pt; sum of erythema, adherent desquamation, and plaque thickening; 0 (none) to 3 (severe) with half‐point ratings permitted) Patient‐reported ocular stinging (0 to 3) Compliance | Neither formulation had an impact on ocular safety, no report of ocular stinging. LAE: HPA suppression: Atrophy: Decrease in skin thickness from baseline: mean difference: Efficacy results of the 2 formulations were similar. Compliance with protocol was good in both groups. | Exploratory safety study Sponsored by Galderma Laboratories | Unclear | |
| DESIGN: within‐patient ALLOCATION: non‐random | N: 202 | Calcipotriol scalp solution 50 mcg/ml BD | Local AEs: serum calcium | Local AEs: | Sponsored by Leo Pharmaceuticals | Not applicable | |
| DESIGN: uncontrolled study Concealment: NA | STUDY A: | Study A: calcipotriol ointment 50 mcg/g BD up to 100 g/wk | Local AEs: | Study A: no significant trend in urine calcium excretion | Sponsorship not reported | Not applicable | |
| DESIGN: uncontrolled study ALLOCATION: non‐random Concealment: NA BLINDING: open WITHDRAWAL/DROPOUT: not described | N: 28 | STUDY A: 200 g calcipotriol ointment 50 mcg/g (wk 1) plus 300 g 50 mcg/g calcipotriol (wk 2) | Local AEs: | 5 participants developed hypercalcaemia during treatment, all had received a dose > 5 g/kg | Sponsorship not reported | Not applicable | |
| DESIGN: uncontrolled study | N: 305 % white: 91.8% | Clobetasol propionate 0.05% spray BD (2 to 4 wks); treatment responders (ODS < = 3) then treated with calcitriol 3 mg/g ointment (8 wks) | Pruritis, telangiectasias, burning/stinging (0 to 3), skin atrophy, folliculitis Overall disease severity (ODS) (5‐pt: 0 = clear to 4 = severe/very severe) based on erythema, scaling, and plaque elevation. Treatment success (change from baseline ODS > = 1 at wk 12)
| At 4 wks: skin atrophy 7/285 telangiectasias 2/285 stinging/Burning 39/285 folliculitis 11/285
At 12 wks: skin atrophy 2/235 telangiectasias 5/235 stinging/Burning 35/235 folliculitis 3/235
Any adverse event: 100/305
| Sponsored by Galderma laboratories | Not applicable | |
| DESIGN: within‐patient | N: 14 EXCLUSION CRITERIA: NR | Clobetasol propionate 0.05% ointment, BD Betamethasone valerate 0.1% ointment, BD | Local AEs: NR | Quantities used by study participants were small (mean: 7 g/wk) | Sponsorship not reported | Unclear | |
| DESIGN: uncontrolled study patient delivery ALLOCATION: NA Method of randomisation: NA Concealment: NA BLINDING: open WITHDRAWAL/DROPOUT: described | N: 257 | Calcitriol 3 mcg/g BD | Local AEs: | Local AEs: | Sponsored by Solvay‐Duphar BV | Not applicable | |
| DESIGN: between‐patient ALLOCATION: random | N: 78 EXCLUSION CRITERIA: hypercalcaemia, bone, thyroid or parathyroid disease; topical therapy within previous 2 wks; systemic/phototherapy within previous 8 wks | Calcipotriol 50 mcg/g ointment BD, up to 120 g/wk | Local AEs: not assessed | No adverse effects on bone metabolism or calcium | Sponsored by Bristol‐Myers Squibb | Unclear | |
| DESIGN: between‐patient (retrospective study) ALLOCATION: non‐random | N: 28 EXCLUSION CRITERIA: NR | Previous prolonged treatment with topical fluorinated steroids | Local AEs: light/electron microscopy for examination of basal keratinocyte herniation (BKH); layers of basement membrane | Local AEs: light microscopy revealed no between‐group differences. Electron microscopy revealed multi‐layered, fragmented and disorganised basal laminae in the steroid group, which appeared to be correlated with duration of treatment. Fragmentation was not observed in the control group | Sponsorship not reported | Not applicable | |
| DESIGN: between‐patient ALLOCATION: random Method of randomisation: NS | N: 40 | Betamethasone dipropionate (0.05%) in optimised vehicle BD; Clobetasol 17 propionate (0.05%) ointment BD | Local AEs: not assessed Systemic AEs: morning plasma cortisol levels; 24‐hr urine steroid levels; FBC, blood chemistry, urinalysis | Temporary reversible suppression of the hypothalamic‐pituitary‐adrenal axis in 8/40 participants | Sponsorship not reported; 1 author from Schering Corporation | Unclear | |
| DESIGN: within‐patient ALLOCATION: random BLINDING: double‐blind (participant/investigator) | N: 30 | Betamethasone dipropionate (0.05%) in optimised vehicle BD (BMD) | Local AEs: skin surface microscopic examination with photographic documentation; oil and magnifying (8 x) lens to detect 'preatrophy' (visibility of subpapillary vascular plexus caused by thinning of epidermis and papillary dermis) | Local AEs: no serious adverse events observed with either treatment. Preatrophy identified in 20% of involved plaques (BMD: 11/59; CP: 12/59) and was more likely in females. In the test area (non‐psoriatic skin), 5% of plaques showed preatrophy (BMD: 2/30; CP: 1/30). Preatrophy appeared to be usually reversible following treatment cessation. | Sponsored by Schering Corporation | Unclear | |
| Phase II | DESIGN: uncontrolled BLINDING: open WITHDRAWAL/DROPOUT: | N: 32 | Clobetasol 0.05% foam BD Clobetasol 0.05% ointment BD (= 7 g/day, up to 50 g/wk)
| Maximal plasma concentration of clobetasol propionate
| Higher but non‐significant levels of clobetasol in ointment group | Supported by Stiefel Laboratories, Inc. Review of phase II studies on AD and psoriasis (clobetasol foam) | Not applicable |
| Phase III | DESIGN: between‐patient | N: 497 | Clobetasol 0.05% foam BD Clobetasol 0.05% ointment BD Placebo foam BD Face, scalp, and intertriginous areas excluded from treatment
| Treatment‐related adverse events:
ISGA (investigator's static global assessment score)(scale NR) | Atrophy: C foam: 2% (N = 253) Burning: C foam: 2% (N = 253) All treatment‐related adverse events: C foam: 8% (N = 253)
| Supported by Stiefel Laboratories Inc. Review of phase III studies on AD and psoriasis (clobetasol foam). | Unclear |
| DESIGN: uncontrolled study patient delivery ALLOCATION: non‐random BLINDING: open WITHDRAWAL/DROPOUT: described | N: 15 EXCLUSION CRITERIA: hypercalcaemia, impaired renal/hepatic function, daily receiving > 400 i.u. vitamin D | Calcipotriol ointment 50 mcg/g BD (max: 100 g/wk) | Local AEs: patient report of adverse events | Local AEs: | Sponsorship not reported. Leo Pharmaceuticals supplied study medication | Not applicable | |
| DESIGN: uncontrolled study patient delivery ALLOCATION: non‐random | N: 157 INCLUSION CRITERIA: chronic plaque psoriasis; aged 18 to 70; BSA 7% to 20%; laboratory parameters normal at baseline EXCLUSION CRITERIA: pregnancy or risk thereof; topical antipsoriatic therapy within previous 2 wks; systemic antipsoriatic therapy within previous 6 wks; retinoids within previous 52 wks.; history of hyperparathyroidism; concomitant use of drugs affecting calcium metabolism | Tacalcitol ointment, 4 mcg/g OD. No control | Local AEs: participants asked about adverse events. Tolerability assessed by investigator (4‐pt: 1 = excellent to 4 = poor). | Local AEs: | Sponsored by Hermal/BHI, Germany | Not applicable | |
| DESIGN: between‐patient ALLOCATION: random. | N: 40 EXCLUSION CRITERIA: history of sensitivity to study ingredients; topical antipsoriatics within previous 2 wks; UVB/PUVA within previous 8 wks; history of hypercalcaemia, recurrent illness | Initial regimen: all participants received 2 wks of calcipotriol (OM), halobetasol ointment (ON) | Local AEs: treatment‐related adverse events | Local AEs: | Sponsored by Westwood Squibb Pharmaceuticals | Unclear | |
| DESIGN: between‐patient patient delivery ALLOCATION: random | N: 50 | Open‐label phase: tazarotene 0.1% gel plus clobetasol propionate 0.05% ointment for 6 wks. Once daily initially, then 'tapered'. | Local AEs: no. steroid‐specific side‐effects | Local AEs: no steroid‐specific side‐effects | Sponsorship: not reported | Unclear | |
| DESIGN: uncontrolled BLINDING: open | N: 1423 | Clobetasol 0.05% foam BD, up to 50 g/wk either as monotherapy or adjunctive to existing therapy
| Erythema, peeling/scaling, dryness, stinging/burning (0 none to 3 severe). Telangiectasia, skin atrophy, pruritus, folliculitis (absent/present)
Also assessed efficacy and QoL | Erythema: 23.7% Telangiectasia, skin atrophy, folliculitis: present in less than 1% of participants (findings not reported separately) Pruritus: 5.7% | Clobex Spray Community‐Based Research Assessment (COBRA) Sponsorship not reported | Not applicable | |
| DESIGN: uncontrolled study patient delivery ALLOCATION: non‐random | N: 160 | Tacalcitol ointment 20 mcg/g OD (max: 10 g/day) | Local AEs: treatment‐related adverse events | Local AEs: | Sponsorship: not reported | Not applicable | |
| DESIGN: uncontrolled study patient delivery ALLOCATION: non‐random BLINDING: open | N: 203 | Calcipotriol 50 mcg/g ointment | Loca AEs: self report of adverse events. | Local AEs: | Sponsored by Leo Pharmaceuticals | Not applicable | |
| DESIGN: uncontrolled open study ALLOCATION: non‐random | N: 167 TD: 52 wks; FU: 52 wks LF: 39 (23.4%) BC: NA Age: 49 (range: 20 to 85) Gender (per cent men): 60% Severity: PASI (modified): 8.1 (6.7SD) INCLUSION CRITERIA: chronic plaque psoriasis; previous response to calcipotriol; managed by specialists EXCLUSION CRITERIA: pregnancy or risk thereof; abnormal serum calcium or phosphate; impaired hepatic/renal function; concomitant oral calcium/vitamin D; systemic therapy within previous 8 wks; topical therapy within previous 4 wks | Calcipotriol 50 mcg/g ointment. Max dose: 100 g/wk; 2500 g/pa Face/scalp/neck excluded | Local AEs: self report of adverse events: mild, moderate, severe; unlikely, possibly, or probably treatment‐related | AE(L): 52/161 60 (46 considered to be treatment‐related) events reported by 52 of 161 participants. 1 participant developed a significant rise in serum calcium. No other abnormalities in haematology or biochemistry tests. 118/161 participants reported continuous medication use and 80% to 90% used it twice daily. Mean use: 35.1 g/wk ('initially') to 23.4 g/wk during last 6 mths | Sponsored by Leo Pharmaceuticals | Not applicable | |
| DESIGN: observational study using retrospective data (medical records, cancer registry) and prospective (survey) data (treatments/lifestyle). Multivariate proportional hazards regression. | N: 4315 | All topical, phototherapy, and systemic therapies. Focus of study is on coal tar:
| Any cancer Skin cancer Internal malignancies Specific tumour groups:
No statistically significant increased risk of any cancer. Hazard ratios: Any cancer: LCD: 0.85 (95% CI 0.60 to 1.19) Skin cancer: LCD: 1.35 (95% CI 0.53 to 3.44) | Analysis adjusted for smoking status, other treatments, skin type, alcohol consumption. However, data on duration of tar therapy, smoking status and alcohol consumption were missing for most participants | Not applicable‐ | ||
| DESIGN: uncontrolled study patient delivery ALLOCATION: non‐random BLINDING: open | N: 58 | Part 1: double‐blind study (8 wks): tacalcitol 4 mcg/g ointment OD Placebo | Local AEs: occurrence of adverse events (duration, severity, and whether treatment‐related) | Local AEs: No case of hypercalcaemia | Sponsorship not reported | Not applicable | |
| van de Kerkhof 2002c (see also Lambert 2002) | DESIGN: uncontrolled study patient delivery ALLOCATION: non‐random Method of randomisation: NA Concealment: NA BLINDING: open WITHDRAWAL/DROPOUT: described | Part 1: | Tacalcitol 4 mcg/g OD. Treatment discontinued during remission and restarted if relapse | Local AEs: number treatment‐related adverse events; withdrawals due to adverse events (WA); investigator assessment of tolerability; participant assessment of tolerability | Local AEs: | Sponsored by Hermal/BHI, Germany | Not applicable |
| DESIGN: uncontrolled study patient delivery ALLOCATION: non‐random BLINDING: open WITHDRAWAL/DROPOUT: described | N: 20 INCLUSION CRITERIA: EXCLUSION CRITERIA: use of topical steroids in previous 2 mths | Clobetasol propionate 0.05% cream, OD (weekends) plus calcipotriol 50 mcg/g ointment BD (weekdays) | Local AEs: clinical (naked eye) examination of psoriatic plaque and surrounding area | Overuse of topical steroids resulted in appearance of clinically unapparent but dermoscopically apparent linear telangiectasias. 7/20 participants failed to adhere to recommended steroid dosing schedules. Dermoscopic red lines not apparent in 15/20 participants. Dermoscopic red lines apparent in 5/20 participants, of whom 4 had overused topical steroid cream. Steroid discontinued in participants with red lines and there was complete resolution within 2 mths | Links compliance with adverse events | Not applicable | |
| DESIGN: uncontrolled study | N: 48 | 0.1% tazarotene gel, short contact therapy (applied OD for 20 minutes then rinsed off with water) | Pruritis (4‐pt: 0 = absent to 3 = severe) Burning (4‐pt: 0 = absent to 3 = severe) | At day 45: pruritis (0 to 3): 0.17 (0.38SD) 14/43 had mild pruritis
Burning (0 to 3) 0.17 (0.38SD) 14/43 14/43 had mild burning No participant withdrew because of irritation on treated lesion | Sponsorship not reported | Not applicable | |
| DESIGN: uncontrolled study patient delivery | N: 30 | Calcitriol 15 mcg/g ointment OD Quantity of study drug varied by group: Group 1 (N =12): 4% to 8% BSA treated (300 to 600 cm^2) Group 2 (N = 10): 8% to 15% BSA treated (600 to 1200 cm^2) Group 3 (N = 8): 15% to 30% BSA treated (1200 to 2400 cm^2) | IAGI (6‐pt) ECG Haematology, biochemistry, urine protein and glucose. Serum calcium, phosphorus, plasma PTH, serum 25‐hydroxyvitaim D, 1‐alpha,25dihydroxy‐vitaim D, 24 hr urine tests for calcium, creatinine and phosphorus. Compliance also assessed (medication weight) | Mean daily usage: 74.0 to 306.1 mcg. No systemic adverse events, no skin irritation. No clinically relevant changes in vital signs, haematology, biochemistry, urine or ECGs. IAGI (0 to 5): ‐3.57 (1.01SD, N = 30) | Usual dose is 3 mcg/g BD, max. 30 g daily Sponsored by Solvay Duphar | Not applicable |
per cent men: per cent male; AE(L): number local adverse events/number participants; AE(S): number systemic adverse events/number participants; AE: adverse events; BC: baseline comparability; BD: twice daily; BSA: body surface area; FU: follow up (includes TD); N: number enrolled; NA: not applicable; NR: not reported; OD: once daily; PASI: Psoriasis Area and Severity Index; PRN: as required; TD: treatment duration; TSS: Total Severity Score; WA: withdrawal due to adverse events
| Study | Reason for exclusion |
| Follow‐up under 12 wks and not focused on adverse events | |
| Not psoriasis, short review (letter) | |
| Not a product included in our review (bexarotene gel 1%) | |
| Not focused on adverse events | |
| Evaluated add‐on clobetasol for participants treated concurrently with topical or systemic therapy | |
| Inadequate reporting of adverse events | |
| Small (N = 54) retrospective study using participant questionnaires ‐ aimed to identify teratogenetic effects of tar, but many women unable to recall whether tar used in pregnancy | |
| Not chronic plaque psoriasis: paediatric dermatology participants had eczema or "eczema–psoriasis overlap (atopic dermatitis with associated features of psoriasis)" | |
| Small uncontrolled short‐term and already reflected in results from main review | |
| Short‐term and already reflected in results from main review | |
| Follow‐up under 12 wks and not focused on adverse events | |
| Case study | |
| Adverse events not reported | |
| Short‐term (4 weeks) and brief mention of adverse events | |
| Short‐term, unclear if psoriasis, small numbers (N = 6) | |
| Participants were healthy volunteers | |
| Not about adverse events | |
| Not about adverse events |
Of the 29 included adverse events studies, 20 were uncontrolled (Barnes 2000; Berth‐Jones 1992c; Berth‐Jones 1993; Bleiker 1998; Brodell 2011b; Cullen 1996; Gerritsen 2001 and Langner 1996; Kimball 2008 (phase II trial); Kragballe 1991b; Lambert 2002; Menter 2007; Miyachi 2002; Poyner 1993; Ramsay 1994; Roelofzen 2010; van de Kerkhof 1997b; van de Kerkhof 2002c; Vazquez‐Lopez 2004; Veraldi 2006; Wishart 1994), 8 were randomised trials (Andres 2006; Corbett 1976; Guzzo 1996; Katz 1987b; Katz 1989; Kimball 2008 (phase III trial); Lebwohl 1998b; Lebwohl 2001), 1 was a retrospective controlled study (Heng 1990), and 1 reported a control group of people using treatment other than calcipotriol (Berth‐Jones 1993).
We did not include any of the eight RCTs in the main review. Six RCTs did not meet the inclusion criteria for the main review, because they did not address comparisons of interest (Andres 2006; Corbett 1976; Katz 1987b; Katz 1989; Lebwohl 1998b) or effectiveness (Guzzo 1996). We excluded one RCT from the main review because it did not report the numbers of participants in each arm of the trial (Lebwohl 2001). In all eight RCTs, the adequacy of concealment of treatment allocation was unclear, the method of randomisation was unclear, and all were double‐blind (participant/investigator) trials. Five of the eight trials reported baseline comparability, with two studies demonstrating between‐group comparability in both clinical and demographic characteristics (Katz 1987b; Katz 1989), two reporting differences in baseline severity (Guzzo 1996; Lebwohl 1998b), and one with some significant differences in demographics and clinical severity (Andres 2006). Four of the eight RCTs were placebo‐controlled and six included active controls.
Of the nine controlled studies, two were within‐patient designs (Corbett 1976; Katz 1989), and the remainder were between‐patient (parallel‐group) designs.
Trials ranged in size from 10 to over 4000 participants. Treatment duration ranged from 2 weeks to 18 months. Loss to follow up averaged 9.5% (range = 0% to 63%). The mean age of participants was 48 (range = 15 to 85), and participants were more likely to be men (mean: 55%; range = 40 to 82%). In 12 studies, the baseline severity of participants was unclear. Remaining studies recruited participants with mild to moderate disease (N = 4), mild to severe disease (N = 4), moderate to severe disease (N = 6), and severe disease (N = 3).
Study treatments included vitamin D products (18/29), topical corticosteroids (12/29), coal tar (1/29), and tazarotene (2/29). Some comprised of combination regimens, such as vitamin D and corticosteroid (Lebwohl 1996; Lebwohl 1998b; Vazquez‐Lopez 2004) or tazarotene and corticosteroid (Lebwohl 2001). No study of dithranol met the inclusion criteria for the review. Twenty‐one of the studies assessed local adverse events, 18 assessed systemic effects, and 11 studies assessed both types. Although six RCTs reported some data on cutaneous adverse events (Andres 2006; Corbett 1976; Katz 1987b; Katz 1989; Lebwohl 1998b), these were neither suitable nor adequate for pooling.
Vitamin D products (N = 18)
Eleven studies evaluated local (N = 7) or systemic (N = 8) adverse effects associated with calcipotriol, or both. The rate of withdrawals due to local adverse events ranged from 4% to 14% and the rate of adverse events ranged between 20% and 41%; larger trials reported higher rates (weighted mean: 36%). In the 52‐week trial by Barnes 2000, facial irritation affected 30% of participants in the early stages of the trial, but the incidence declined over time. The incidence of systemic effects was less common: 5/8 studies found no significant effects. Bleiker 1998's study of inpatients with severe disease found 5/28 developed hypercalcaemia after receiving a dose greater than 5 g/kg. The study by Berth‐Jones 1993, in which 10 trial participants received a weekly dose of 100 g of calcipotriol for 4 weeks, found that urinary calcium increased significantly from baseline levels.
Four studies evaluated both local and systemic adverse effects associated with tacalcitol. The rate of withdrawals due to local adverse events ranged from 0% to 6%, and the rate of adverse events ranged between 10% and 21%. Three studies found no systemic effects. The study by van de Kerkhof 2002c found that over half of study participants with psoriasis affecting 10% to 20% of their body surface area exceeded the recommended daily dose of 5 g/day (up to 13 g daily), but there was no effect on calcium homeostasis. Systemic effects were identified in over half enrolled participants in the trial by Miyachi 2002, but only 6/155 events were considered to be treatment‐related in this uncontrolled study.
Three studies looked at adverse events associated with calcitriol (Brodell 2011b; Gerritsen 2001; Wishart 1994). One study examined the tolerability and systemic effects of calcitriol used as monotherapy (3 mcg/g ointment applied twice daily, as per licence) (Gerritsen 2001). Three per cent of participants withdrew due to adverse events, and 15% reported local adverse events. The withdrawal rate due to systemic effects was low (0.4%), but 4 cases of hypercalcaemia were reported (N = 253). Mean daily use of calcitriol in this trial was 6 g (range = 1 to 24 g). In Brodell 2011b, participants who had responded to treatment with clobetasol spray then received 8 weeks of maintenance treatment with calcitriol 3 mcg/g ointment twice‐daily. Around 15% (35/235) of participants reported burning or stinging at the end of treatment. Wishart 1994 tested the effects of high‐dose calcitriol (15 mcg/g once‐daily) on 3 groups of participants, with the quantity used proportional to the area affected The trial recruited participants with psoriasis affecting up to 30% of the body surface area. Mean daily drug use ranged from 74 to 306 mcg. The study did not observe any systemic adverse events, skin irritation, or 'clinically relevant' changes in vital signs, haematology, biochemistry, urine, or electrocardiograms.
Corticosteroids (N = 12)
The 12 studies of adverse events associated with steroids adopted a range of different study designs. Four studies had no comparator group (Brodell 2011b; Kimball 2008 (Phase II); Menter 2007; Vazquez‐Lopez 2004). Seven studies were randomised trials (Andres 2006; Corbett 1976; Katz 1987b; Katz 1989; Kimball 2008 (Phase III); Lebwohl 1998b; Lebwohl 2001), of which six used active treatment controls and three were placebo‐controlled. The remaining study retrospectively compared 13 participants who had used topical corticosteroids for between 6 months and 12 years with a 'no steroid' group (N = 15).
Eight of the 12 corticosteroid studies assessed atrophy or preatrophy in people with psoriasis who were treated with topical steroids. Three studies explicitly described the methods used to assess atrophy, and some studies did not clearly state the numbers of participants affected by atrophy or its extent.
The retrospective study by Heng 1990 compared 13 participants who had used topical corticosteroids for between 6 months and 12 years with a 'no steroid' group: These 15 individuals had previously used tar, UVB, or were untreated. Light microscopy revealed no between‐group differences. However, electron microscopy revealed multi‐layered, fragmented, and disorganised basal laminae (the lining of the outer surface of the cell membrane) in the steroid group; this appeared to be correlated with duration of treatment. Fragmentation was not observed in the control group.
The 4‐week study by Katz 1989 identified preatrophy in 20% of involved plaques, using a hand‐held magnifying lens. Two long‐term (26‐week) studies of combination maintenance therapy with steroids (Lebwohl 1998b; Lebwohl 2001) did not observe cutaneous atrophy, but neither study reported the assessment method. A 4‐week trial of clobetasol propionate for scalp psoriasis assessed atrophy using an ultrasound probe (20 MHz) (Andres 2006). No case of cutaneous atrophy was detected in either the gel (which was left in) or shampoo formulations (which was rinsed out after 15 minutes). However, there was a significantly greater reduction in skin thickness in participants treated with the gel, compared to the shampoo group (Andres 2006).
An uncontrolled study of clobetasol spray (Brodell 2011b) detected atrophy in 7/285 participants after 4 weeks of treatment, though the study did not describe the assessment method. A randomised trial compared 2 weeks of treatment with clobetasol propionate foam (N = 253), clobetasol propionate ointment (N = 121), or placebo foam (N = 123) (Kimball 2008, Phase III). The paper did not describe the assessment method. The trial found five cases of skin atrophy in the clobetasol foam group and one case in the placebo group, but the paper did not report the number of atrophy cases in the clobetasol ointment group. COBRA (Clobex Spray Community‐Based Research Assessment) was an open‐label 4‐week study where 1421 people with psoriasis used clobetasol spray 0.05% twice daily as monotherapy (Menter 2007). Cases of telangiectasia, skin atrophy, or folliculitis each occurred in less than 1% of participants (the study did not report the numbers affected or the assessment method).
Four studies examined systemic effects associated with corticosteroids. The study by Corbett 1976 compared betamethasone valerate with clobetasol propionate. Quantities used by study participants were small (mean: 7 g/wk), and the study observed no pituitary‐adrenal suppression. Katz 1987b compared two 'superpotent' corticosteroids and identified temporary and reversible adrenal suppression in 20% (8/40) of study participants. In the study by Andres 2006, none of the 14 participants assigned to clobetasol propionate shampoo experienced hypothalamic‐pituitary‐adrenal (HPA) axis suppression. Conversely, 2 of the 12 participants in the gel group experienced HPA axis suppression. Neither formulation had an impact on ocular safety. In a phase II study (Kimball 2008), higher levels of clobetasol were found in the plasma tests in ointment group than in the shampoo group, though the difference was not statistically significant.
Tazarotene (N = 2)
The study by Lebwohl 2001 compared three types of maintenance therapy: tazarotene plus steroid, tazarotene plus placebo, and placebo alone. In this 6‐month trial, there were no withdrawals due to adverse events, but 24% of participants in the tazarotene/steroid group and 29% of participants in the tazarotene/placebo group experienced adverse events. There were no adverse events in the placebo group, and the study did not assess systemic effects. Veraldi 2006 evaluated short‐contact treatment with tazarotene gel in 43 participants. The study drug was applied once daily, left for 20 minutes, and then rinsed off with water. The number of participants reporting pruritis and burning decreased over the 45‐day study period, with 14/43 participants reporting mild pruritis at the end of treatment, and the same number reporting mild burning. The study did not assess systemic effects.
(c) Quality of life measures
Eight of the 177 studies included in the main review formally assessed quality of life (QoL) (Alora‐Palli 2010; Bernstein 2006; Cook‐Bolden 2010; Guenther 2002 (H) and Guenther 2002 (P); Hutchinson 2000; Saraceno 2007; Van de Kerkhof 2006; Wall 1998).
The trials used different QoL measures. Alora‐Palli 2010 used the Dermatology Quality of Life Index (DLQI), and Bernstein 2006 used the Quality of Life Index. In both measures, higher scores indicate poorer QoL. The trial by Guenther (2002) measured quality of life using the Psoriasis Disability Index (PDI) and the EuroQOL (EQ‐5D and EQ‐VAS), reporting it in a separate publication (van de Kerkhof 2004). Hutchinson 2000 and Wall 1998 also assessed quality of life using the Psoriasis Disability Index; Wall 1998 also used the Sickness Impact Profile (SIP). Although four studies used the PDI to measure quality of life, they did not report data in sufficient detail to allow pooling, so we reported findings narratively. Four trials included participants with mild to moderate disease; the other three trials included participants with at least moderately severe disease. The number of participants ranged from 60 (Alora‐Palli 2010) to 828 (Guenther 2002 (P)), although PDI scores were obtained for only 51% of participants in this trial (van de Kerkhof 2004). Saraceno 2007 and Van de Kerkhof 2006 used the Skindex‐29, with Van de Kerkhof 2006 also employing the SF‐36. One trial used a QoL instrument designed specifically for the scalp, the Scalpdex (Cook‐Bolden 2010).
Dermatology Quality of Life Index (DLQI) (N = 1)
The Dermatology Quality of Life Index (DLQI) is scored from 0 to 30, where higher scores indicate poorer QoL. Alora‐Palli 2010 used the DLQI to compare calcipotriol and liquid carbonis distillate (LCD) 15% solution. Both treatments improved QoL relative to baseline, but there was no significant difference between the groups at the end of the 12‐week treatment period. Participants were followed up for 6 weeks post‐treatment; in the LCD group, quality of life continued to improve, but it deteriorated in the calcipotriol group. There was a significant between‐group difference in the DLQI scores at the 18‐week follow‐up assessment. This QoL effect reflected the PASI and physician global assessments, which demonstrated significantly lower recurrence rates in the LCD group at 18 weeks.
EuroQOL (EQ‐5D and EQ‐VAS) (N = 1)
The EQ5D is a generic quality of life measure. van de Kerkhof 2004 reported quality of life data from the trial by Guenther 2002. The study presented the EQ5D scores in a non‐standard method, making their interpretation problematic. EQ‐VAS (scored from 1 to 100) supported findings from the PDI assessments, with all groups improving quality of life scores relative to baseline. However, the EQ‐VAS score for the once‐daily combined calcipotriol/betamethasone dipropionate (plus placebo) group was higher (with a better quality of life) than the corresponding score in the twice‐daily group. Relative to baseline, improvements in mean quality of life scores were statistically significant in all treatment groups, but the significance of between‐group differences was not reported.
Psoriasis Disability Index (PDI) (N = 4)
In all four trials reporting this measure, there was an improvement in mean quality of life scores for participants in every group. The trial by Guenther 2002 found the greatest improvement (reduction in PDI from baseline, i.e. improvement in QoL) for twice‐daily combination treatment with calcipotriol and betamethasone (50%). Corresponding figures were as follows: once‐daily combination treatment with calcipotriol and betamethasone (plus placebo): 41%, calcipotriol twice daily: 31%, and placebo twice daily: 9%. In terms of absolute scores, the group using twice‐daily combination treatment with calcipotriol and betamethasone had the best (lowest) quality of life score, followed by the once‐daily combined treatment group, calcipotriol group, and placebo group. Relative to baseline, improvements in mean quality of life scores were statistically significant in all treatment groups, but the statistical significance of between‐group differences was not reported. In the study by Hutchinson 2000, quality of life improved from baseline significantly more in the group treated with calcitriol relative to the dithranol group. The comparison of dithranol and calcipotriol by Wall 1998 found that the magnitude of the difference was greater in the calcipotriol group, but the difference was not statistically significant at the 5% level.
Quality of Life Index (N = 1)
Bernstein 2006 used the Quality of Life Index to compare Mahonia aquifolium with placebo in participants with mild to moderate psoriasis. The index ranges from 0 to 120, with higher scores indicating poorer quality of life. Mahonia aquifolium was significantly more effective than placebo, and this was also reflected in the QoL index.
Scalpdex (N = 1)
Cook‐Bolden 2010 used the Scalpdex, a scalp dermatitis‐specific quality of life instrument comprising 23 questions, each scored 0 (never) to 100 (all the time). Relative to baseline scores, the study found a significant improvement in QoL for participants in the clobetasol spray arm of the trial and no significant improvement in the placebo spray arm.
SF‐36 (N = 1)
The SF‐36 is a generic short‐form health survey with 36 questions covering physical and mental health. The study by Van de Kerkhof 2006 compared calcipotriol and dithranol administered in a day‐care setting. The study found no significant difference in quality of life, either for the Skindex‐29 or for the SF‐36.
Sickness Impact Profile (SIP) (N = 1)
The SIP is a generic quality of life measure. Wall 1998 assessed participants using the SIP, which has a maximum score of 136. As with the PDI, the SIP found a statistically significant improvement from baseline in both groups, but the between‐group difference was not statistically significant.
Skindex‐29 (N = 2)
The Skindex‐29 is a dermatology‐specific QoL index that includes three domains: emotions, symptoms, and functioning. Two trials used the Skindex‐29, both enrolling participants with mild to moderate disease. Saraceno 2007 compared a 12‐week course of calcipotriol against 4 weeks of combination therapy (calcipotriol/betamethasone dipropionate) followed by maintenance with calcipotriol for 8 weeks. Quality of life improved in both groups relative to baseline. Van de Kerkhof 2006's study in a day‐care treatment setting found no significant difference between calcipotriol and dithranol, either for the Skindex‐29 or for the SF‐36.
(d) Economic outcomes
(THIS SECTION HAS NOT BEEN UPDATED)
A number of studies have looked at economic aspects of topical treatment for psoriasis. These include cost‐of‐illness studies (Feldman 1997; Jenner 2002; Poyner 1999), quality‐of‐life studies (Leu 1985; Lundberg 1999; Ortonne 2000; Schiffner 2003; Zachariae 2002; Zug 1995), methodological issues (Lambert 1996; Lambert 1999), willingness to pay analyses (Lundberg 1999; Poyner 2000; Schiffner 2003), cost analysis (Feldman 2000), and cost‐effectiveness analyses (Ashcroft 2000; de Tiedra 1997; Harrington 1995; Köse 1997; Marchetti 1998; Oh 1997; Owen 1993; Parodi 1991; Schwicker 1992; Sorensen 2002; Stern 1988). These analyses involve a range of modelling approaches and assumptions and have not been formally reviewed here, although they were part of our original review (Mason 2002a). Our updated review revealed no substantial variations in tolerability or effectiveness for most treatment comparisons, and no trials provided robust resource data on the consequences of managing treatment failure. Consequently, any economic models extrapolating beyond the duration of the trials may be largely speculative and uninformative. In the light of available data, a 'cost and consequences' approach, in which costs and outcomes are reported separately, may be most informative to clinical decision‐makers. The relative short‐term clinical performance of topical antipsoriatic treatments can be set against their reimbursed costs. While it is accepted that long‐term sequelae in participants not responding to treatment may be very important when considering overall costs and benefits, there are no good comparative data on these costs with which to distinguish between treatments (Mason 2002a).
(e) Concordance or adherence with treatment
(THIS SECTION HAS NOT BEEN UPDATED)
The separate search for studies of concordance/adherence identified 246 potentially relevant studies for screening. Of these, we retrieved 18 papers, and we included in the review 12 papers reporting on 11 studies (see Table 26) (Balkrishnan 2003; Carroll 2004a; Carroll 2004b; Feldman 2007; Ferrandiz 1998; Fouere 2005; Gokdemir 2008; Richards 1999; van de Kerkhof 1998c; van de Kerkhof 2000; van de Kerkhof 2001; Zaghloul 2004). Some studies were pilots (e.g. Balkrishnan 2003; van de Kerkhof 1998c) for other studies (i.e. Carroll 2004a; van de Kerkhof 2000). We listed studies that did not meet the inclusion criteria in Table 27 (Atkinson 2004; Chu 2000; Gupta 2007; Lee 2006; Osborne 2002; Richards 2006; Szeimies 2004). We identified three reviews and bibliographies were checked for further potentially relevant studies (Gupta 2007; Lee 2006; Richards 2006). Of the 11 studies included in the review, 2 were randomised controlled trials (Carroll 2004a; Ferrandiz 1998) and 4 were questionnaire surveys Fouere 2005; Richards 1999; van de Kerkhof 1998; van de Kerkhof 2000). The remaining five studies were prospective experiments, of which one included a control group (van de Kerkhof 2001). The number of participants included in the adherence studies ranged from 10 to 1281, and the study duration ranged from 1 to 16 weeks. In total, 11 studies enrolled 5541 participants, of which 39% were men and the mean age was 47.0 (range = 4 to 91). Study size ranged from 10 to 1281 participants, with the questionnaire surveys reporting the largest sample sizes. Studies covered four main issues. First, some reported methodological issues on the measurement of adherence (Balkrishnan 2003; Carroll 2004a; Fouere 2005; Zaghloul 2004). Second, some studies reported adherence rates (Balkrishnan 2003; Carroll 2004a; Fouere 2005; Richards 1999; van de Kerkhof 2000; van de Kerkhof 2001; Zaghloul 2004). Third, seven studies considered reasons for non‐adherence (Carroll 2004a; Gokdemir 2008; Fouere 2005; Richards 1999; van de Kerkhof 1998c; van de Kerkhof 2000; Zaghloul 2004). Fourth, three studies assessed interventions to improve adherence (Feldman 2007; Ferrandiz 1998; van de Kerkhof 2001).
| Study | Methods | Participants | Interventions | Outcomes (compliance | Summary findings | Notes | Allocation concealment |
| DESIGN: uncontrolled study | N: 10 | Topical salicylic acid 6% | Medication adherence: | Medication adherence measured by method 1 (electronic) much lower than by method 2 (patient log) | Sponsorship not reported | D | |
| DESIGN: within‐patient | N: 30 | Topical salicylic acid 6% plus 0.1% tacrolimus ointment BD | Medication adherence: | Adherence decreased over time. On the intervention side, a decrease in adherence rate of 10% was associated with a 1‐point increase in severity (P < 0.05). For the placebo‐treated side, adherence was not significantly correlated with changes in severity. | Sponsored by Fujisawa Healthcare, Inc. and by Wake Forest University School of Medicine. | B | |
| DESIGN: uncontrolled study | N: 29 | 6% salicylic acid gel BD | Impact of office visits on participants' adherence to topical treatment. | Adherence statistically significantly higher at time of office visit. | Sponsored in part by Astellas Pharma US, Inc. | D | |
| DESIGN: between‐patient | N: 881 | Calcipotriol plus reinforcement programme | Reinforcement therapeutic programme to enhance adherence: dermatologist provided participant education with explanation of disease characteristics and treatment efficacy and application, plus written information card | The reinforcement programme had no effect on treatment efficacy | Sponsorship not reported | B | |
| DESIGN: questionnaire survey (observational cross‐sectional study) | N: 1281 | Any antipsoriatic therapy | Compliance measured against PMAQ‐3w scale (patient medication adherence questionnaire): strict adherence to prescribed regimen over previous 3 days and last weekend | 73% reported non‐compliance with current treatment | Sponsorship not reported. | D | |
| DESIGN: open uncontrolled study | N: 109 | Any prescribed antipsoriatic therapy | Medication adherence: number prescribed doses taken/number prescribed doses prescribed (see Zaghloul 2004). | Mean adherence for topical therapy: 72% (31%SD) | Findings relate to any treatment for psoriasis (not just topical therapy) | D | |
| DESIGN: questionnaire survey (cross‐sectional uncontrolled study) | N: 120 | Any antipsoriatic therapy | Per cent complying with treatment (self report): scale not reported | 39 per cent reported non‐compliance (sometimes/never complying) with prescribed treatment. The non‐compliant group had a higher self‐rated disease severity, were younger, and had a younger age at onset. | Sponsorship not reported | D | |
| DESIGN: questionnaire survey (uncontrolled study) BLINDING: NA | N: 972 | Any topical antipsoriatic therapy | Per cent complying with frequency of application of prescribed topical therapies | 29% of responders reported that the prescriber did not specify dosage frequency. | Sponsorship not reported. | D | |
| DESIGN: questionnaire survey (uncontrolled study) | N: 839 | Any antipsoriatic therapy including topical treatments, photo(chemo)therapy and systemic therapy | Per cent complying with duration of prescribed treatment (topical therapies) | Per cent complying with duration of prescribed treatment (topical therapies): 71% | Sponsorship not reported | D | |
| DESIGN: within‐patient (see Notes) | N: 976 | Calcipotriol cream OM plus calcipotriol ointment ON | Compliance: | At wk 3, 72% of participants applied the regimen on most days. By wk 8, this statistic had fallen to 61% | Sponsorship not reported | D | |
| DESIGN: uncontrolled study | N: 294 | Topical, oral, or combined antipsoriatic medication | Medication adherence: | Medication adherence measured by method 1 (objective) much lower than by method 2 (patient self report). Mean rate: 60.6% (33.0%SD); (range: 0% to169%) | Authors report no relevant financial interests | D |
per cent men: per cent male; AE(L): number local adverse events/number participants; AE(S): number systemic adverse events/number participants; AE: adverse events; BC: baseline comparability; BD: twice daily; BSA: body surface area; FU: follow up (includes TD); N: number enrolled; NA: not applicable; NR: not reported; OD: once daily; PASI: Psoriasis Area and Severity Index; PRN: as required; TD: treatment duration; TSS: Total Severity Score; WA: withdrawal due to adverse events
| Study | Reason for exclusion |
| Adherence not assessed | |
| Treatment guideline (not primary study) | |
| Review/think piece | |
| Review | |
| Study focused on non‐responsive participants rather than those that are specifically non‐compliant | |
| Review | |
| Think piece (not primary study) |
Methodological issues relating to adherence measurement and adherence rates
Some studies used self‐reported adherence rates (Gokdemir 2008; Richards 1999; van de Kerkhof 2000; van de Kerkhof 2001; Zaghloul 2004). In these studies, which included short‐term prospective trials and cross‐sectional questionnaire surveys, rates varied between 61% and 72%. However, other studies adopted more objective assessment methods. The study by Fouere used a semistructured participant questionnaire: The PMAQ‐3w scale (Patient Medication Adherence Questionnaire) asked about strict adherence to prescribed regimen over the previous three days and previous weekend. Using this method, the study (Fouere 2005) deemed just 27% of participants as 'compliant'. Some studies adopted a single‐blind approach to assess electronic bottle caps (i.e. participants were unaware that bottles were fitted with electronic measuring devices) (Balkrishnan 2003; Carroll 2004a; Feldman 2007). Known as a 'MEMS cap' (Medication Event Monitoring System), the medication bottle cap was fitted with a microprocessor to record the time/date of every opening of the bottle. When compared with participant logs, electronic methods suggested that adherence was considerably lower than rates reported by participants. For example, Balkrishnan's 1‐week pilot study of 10 participants found that the adherence rate was 67% by electronic assessment compared with a self‐reported rate of 92%. Carroll and colleagues took this pilot study forward using an 8‐week trial of 30 participants (Carroll 2004a). Adherence rates fell over time and averaged 55% over the study period when assessed using the MEMS cap. Twice‐daily dosing was achieved on 39% of the treatment days.
Reasons for non‐adherence
Reasons for non‐adherence comprised therapy characteristics (real or perceived), participants' clinical characteristics, and participants' demographic characteristics. Regarding therapy characteristics, the included studies identified the following as influences on adherence: efficacy (Fouere 2005; van de Kerkhof 1998c; van de Kerkhof 2000), side‐effects (Fouere 2005; Richards 1999; Zaghloul 2004), time for application (Fouere 2005; Gokdemir 2008; van de Kerkhof 2000), and 'messiness' (Fouere 2005; Richards 1999; van de Kerkhof 1998c). Adherence was higher for topical therapy compared with systemic treatment (Zaghloul 2004), but adherence rates also varied by type of topical treatment (Fouere 2005). Disease severity was inversely related to adherence (Carroll 2004a; Richards 1999), although the direction of causality is unclear. Higher adherence rates were variously associated with female gender (Carroll 2004a; Zaghloul 2004), older age (Carroll 2004a; Richards 1999), higher educational achievement (Gokdemir 2008), and older age of disease onset (Richards 1999), but findings on marital status were mixed (Gokdemir 2008; Zaghloul 2004).
Methods to improve adherence
Office visits to clinicians were found to temporarily increase adherence rates (Carroll 2004a; Feldman 2007). An educational programme designed to improve adherence had no impact on the effectiveness of treatment (Ferrandiz 1998). Van de Kerkhof's study comparing ointment/cream regimen with ointment‐only treatment found no clear impact, with 51% of participants reporting better adherence with the cream/ointment option (van de Kerkhof 2001).
Discussion
Summary of main results
Effectiveness
This review analysed evidence from 177 studies that included 34,808 participants. We reported results separately for treatments of the body, inverse psoriasis, and psoriasis of the scalp.
Treatments for psoriasis of the body
We analysed six placebo‐controlled comparisons of treatments for psoriasis of the body. Most treatments were significantly more effective than placebo, with the equivalent pooled effect on a 6‐point improvement (IAGI) scale ranging from 1.02 (potent corticosteroid) to 1.80 (very potent corticosteroid). Pooled effects indicated similar improvements for vitamin D analogues (1.03 points), dithranol (1.22 points), and combination therapy with vitamin D and potent corticosteroid (1.65) on a 6‐point scale.
Amongst less frequently researched treatments, 13 were significantly more effective than placebo. For these treatments, the equivalent effect on a 6‐point IAGI scale ranged from 0.55 (calcipotriol plus nicotinamide) to 3.40 (herbal skin care products). Tazarotene achieved an equivalent improvement of 0.99 on the 6‐point IAGI scale. One small within‐patient study found that tar was no more effective than placebo (Kanzler 1993). Findings from single studies should be treated with caution and regarded as requiring further evidence before guiding treatment.
We evaluated nine head‐to‐head comparisons. Findings from the comparisons of vitamin D against potent or very potent corticosteroids were mixed, and they varied depending on which vitamin D and which corticosteroid were analysed. Combination treatment with vitamin D/corticosteroid was usually more effective than monotherapy with the same vitamin D, and it was always more effective than the same corticosteroid used alone.
Twelve complex regimens (i.e. treatment sequences that do not consist of a simple head‐to‐head comparison between two active treatments) were compared with vitamin D. Seven of the complex regimens were more effective than vitamin D, achieving an additional benefit of between 0.27 points and 0.72 points on an equivalent 6‐point IAGI. A comparison of three long‐term regimens found no significant difference in effect, but some were better tolerated (see below). These studies were interpreted independently, reflecting the differing management regimens. None of the studies presented have been replicated precisely. Therefore, while supportive evidence for findings can be drawn from similar studies, trial findings for complex regimens should be interpreted with caution when informing clinical decisions.
Treatments for inverse psoriasis
The review included four placebo‐controlled comparisons of treatments for psoriasis of the sensitive areas of the body. As there were no effectiveness data for tacrolimus, the review evaluated benefits for three treatments. All three were significantly more effective than placebo, with the pooled effect on a 6‐point IAGI scale ranging from 0.98 (pimecrolimus) to 3.25 (betamethasone valerate). Five treatments were compared head‐to‐head against vitamin D. Betamethasone valerate, combined treatment with calcipotriol and hydrocortisone, and calcitriol were all significantly more effective than calcipotriol alone. On an equivalent 6‐point IAGI, these treatments achieved an additional benefit of 2.22, 0.33, and 0.67 points, respectively.
Treatments for psoriasis of the scalp
We compared 11 treatments for scalp psoriasis with placebo. All but two were significantly more effective than vehicle alone; the most effective was the very potent corticosteroid, clobetasol propionate, which delivered a benefit of almost 2 points (1.88) on an equivalent 6‐point IAGI scale. When compared head‐to‐head, vitamin D was significantly less effective than both potent and very potent corticosteroids. On an equivalent 6‐point IAGI scale, the additional benefit was between 0.48 and 0.67 points. Combination therapy with calcipotriol and betamethasone dipropionate was significantly more effective than either product used alone.
Adverse effects
Randomised evidence found that vitamin D was significantly more likely than potent corticosteroids to cause local adverse effects (15% versus 8%, P = 0.006), and participants were (borderline) more likely to withdraw for this reason (2% versus 1%, P = 0.059). These findings were supported by indirect comparisons of placebo‐controlled trials. Participants tolerated combined treatment with vitamin D/corticosteroid on either the body or the scalp as well as potent corticosteroids and significantly better than vitamin D alone. No comparison of topical agents found a significant difference in systemic adverse effects.
Studies of longer‐term adverse events found that up to 40% of those using vitamin D analogues experienced cutaneous effects and that up to 14% of participants stopped using vitamin D analogues for this reason. There was some evidence to suggest that using vitamin D analogues at high doses could cause systemic adverse effects.
Two of the major cutaneous adverse effects of topical corticosteroids are dermal and epidermal atrophy (Hengge 2006; Kragballe 2006). Only 25 of the 78 RCTs of corticosteroids included in the review explicitly assessed cutaneous atrophy, and in these the duration of the trials, skin sites assessed, and methods employed reduced the chance of detection. The studies either did not support the methods used to assess atrophy (14/25 trials), physicians undertook them (10/25), study participants self‐reported them (5/25), or a combination of the aforementioned. Where physician assessments were conducted, the methods used were not explicit (for example, whether microscopy or ultrasound was used). Two of the 25 trials featured an independent 'adjudication committee', which assessed whether atrophy was likely to be treatment‐related (Kragballe 2006; Poulin 2010). Trial duration of the 25 trials was typically between 4 and 8 weeks, but there were 2 6‐month studies (Katz 1991a; Poulin 2010) and 2 52‐week studies (Kragballe 2006; Luger 2008).
Two trials that assessed atrophy did not report whether or not any cases of atrophy occurred (Huang 2009; Koo 2006). Ten RCTs reported cases of atrophy, and these were trials of either very potent corticosteroids (Cook‐Bolden 2010; Decroix 2004; Lowe 2005; Poulin 2010; Reygagne 2005) or combination treatment with potent corticosteroids (Guenther 2002 (H); Kragballe 2004; Kragballe 2006; Papp 2003 (H) and Papp 2003 (P); Yang 2009). Three of the 10 were trials of scalp psoriasis (Cook‐Bolden 2010; Poulin 2010; Reygagne 2005), all of which investigated clobetasol propionate.
Some studies reviewed as part of our search for additional studies of adverse events of longer‐term use of topical corticosteroids revealed atrophy and damage to basal laminae, the extent of which appeared to be correlated with dosage and duration of use. Research of very potent steroids on the skin of normal volunteers (Kao 2003). Longer‐term use with topical retinoids caused cutaneous effects in around 30% of participants, but systemic effects were not assessed.
Concordance/adherence
Thirty‐four of the 177 RCTs assessed adherence ('compliance'), and 26 trials reported findings. Trials used various methods such as self‐report by participants, medication weight, and treatment completion. Most of the 26 studies that reported findings on adherence found it to be suboptimal. However, Gupta has argued that the relevant notion is concordance rather than compliance or adherence (Gupta 2007). Whereas adherence implies that people comply with clinicians' prescribed treatment, concordance involves a negotiated doctor‐patient agreement about the treatment regimen. Van de Kerkhof's survey of over 800 European people with psoriasis found that some chose not to comply, preferring to apply the 'minimum' dose needed to achieve the effect they wanted (van de Kerkhof 2000). If prescribed regimens reflected the wishes of the person with psoriasis, 'adherence' rates might be expected to rise. Nonetheless, poor adherence to treatment regimens is likely to impair the effectiveness of treatment.
The review identified one study that used an educational programme to improve adherence rates in people with psoriasis (Ferrandiz 1998). This study found no statistically significant difference in outcomes, a finding which contrasts with evidence concerning an educational programme for atopic dermatitis (Cork 2003). However, whereas the programme in the Ferrandiz 1998 study provided education about the disease, the study by Cork involved specialist nurses teaching methods for applying topical treatments. Therefore, the findings from Ferrandiz 1998 may not generalise to reflect the value of other educational programmes.
Sensitivity analysis
In four comparisons, we used sensitivity analysis to explore whether within‐patient versus between‐patient study designs were associated with different effect sizes. When comparing within‐patient and between‐patient study designs, our review found no statistically significant difference in treatment effect size. If within‐patient studies featured some correlation, due to systemic effects or cross contamination, then one would expect systematically smaller effect sizes from within‐patient studies. If there is no correlation, then one would expect the variance to be smaller (as other sources of between‐patient variation have been removed) but the effect size to be similar. We found no evidence to support a correlation for within‐patient studies, and variances were similar for within and between‐patient studies (Table 3), supporting the pooling of these, although it is accepted that within‐patient designs are 'underweighted' in meta‐analyses.
In the placebo‐controlled studies of vitamin D products, there was little difference when comparing within‐patient and between‐patient study findings. On average, within‐patient studies identified a slightly greater effect than between‐patient studies (mean difference: 0.36 points on a 6‐point IAGI scale). For placebo‐controlled potent corticosteroids, there was a more pronounced difference in favour of within‐patient studies (mean difference: 0.55 points on a 6‐point IAGI scale). In the case of very potent corticosteroids, the mean effect relative to placebo was slightly larger in the between‐patient studies (mean difference: 0.07 points on a 6‐point IAGI scale), and the analysis of vitamin D against potent corticosteroid was similar in this respect (a small positive difference in favour of between‐patient studies). These non‐statistically significant differences may be chance findings.
Quality of the evidence
All included trials were randomised, but only 47 studies (27%) clearly reported the method used to randomise participants (Figure 3). Just 15 trials (9%) adequately concealed treatment allocation, but most (74%) masked participants to treatment. Of the 177 studies assessed, 151 reported loss to follow up, and 143 demonstrated that groups were comparable at baseline. Based on the 100 studies that reported assessable data on baseline severity, it was apparent that a wide range of severity was included within and between trials. If the PASI is unreliable for mild‐to‐moderate disease (PASI scores less than 10) (Brownell 2007), it is possible that some trials may have contributed unreliable PASI data to this review.
Trials varied in their treatment duration and in their outcome measures (see Included studies section for details). One reason for the variation in trial treatment duration is that the time taken for an intervention to be effective differs between treatments. The analyses and forest plots do not provide information on treatment duration, but this is an important consideration for clinical decisions. Trials also used different outcome measures; for example, only 113 studies reported data on the IAGI or IGA, and 65 studies reported PASI data. In order to maximise the number of studies contributing data for a particular treatment comparison, we used a combined end point that incorporated different outcome measures. This approach is not ideal; although all outcome measures essentially assess redness, thickness, and scaling (and sometimes area of psoriatic involvement), they differ in their construct. Therefore, the composite end points should be seen as indicative rather than definitive.
Medical text books commonly document the risk of skin atrophy and tachyphylaxis (diminution of the effects of a drug with continual use) as problems associated with topical corticosteroids (Bos 2008). Randomised evidence reported in this review suggests that maintenance regimens using intermittent dosing are safe and effective, and no RCT included in the review detected a statistically significant difference in systemic effects. However, the RCTs did not clearly report the methods employed (e.g. whether the investigator used ultrasound) and may have reduced the chance of detection. We undertook a separate search for longer‐term studies of adverse events, which identified 12 relevant studies of corticosteroids. Studies were heterogeneous in terms of design, assessment methods, comparators considered, and doses used, so we did not pool data (Higgins 2011). Eight studies assessed atrophy, and six found some evidence of basal damage and atrophy. We identified no studies reporting adequate data on tachyphylaxis, despite including this term in our searches.
Potential biases in the review process
There are a number of limitations to this review. First, one author extracted data and a second checked it. Ideally, two authors should extract data independently (NHSCRD 2001). However, this approach was not feasible for this review because of funding constraints. Second, requests for unpublished data from trialists and sponsors were of variable success; requests were more likely to be successful when made for more recently published studies, products still on patent, or both.
This review included 19 comparisons with 10 potential outcomes, so multiple analyses may be expected to generate occasional chance findings. Thus, greater importance is attached where supportive findings are found from placebo‐controlled and head‐to‐head studies as well as linked therapeutic modalities.
Agreements and disagreements with other studies or reviews
A systematic review by Ashcroft and colleagues focused on head‐to‐head trials of one vitamin D analogue, calcipotriol (Ashcroft 2000a). Based on data from 37 studies with over 6000 participants, the review found that calcipotriol was at least as effective as potent topical corticosteroids and more effective than calcitriol, tacalcitol, coal tar, and short contact dithranol. Our review generally supported these findings. However, we found no significant difference for the comparison of calcipotriol and calcitriol (SMD ‐0.41; 95% CI ‐1.46 to 0.64), a finding based on 2 head‐to‐head trials with 261 participants. Our review also found that calcitriol is more efficacious than calcipotriol when used for inverse psoriasis, and it is also better tolerated. Our findings on the effectiveness of short‐contact dithranol compared with calcipotriol were mixed, but physicians and people with psoriasis may be interested to know that inpatient treatment with dithranol appears more effective than calcipotriol (Monastirli 2000). Our review also supported findings from the review by Ashcroft 2000a that although calcipotriol caused significantly more skin irritation than potent topical corticosteroids, skin irritation rarely led to withdrawal of calcipotriol treatment.
The review by Afifi 2005 concluded that combined treatment with steroids and vitamin D analogues or topical retinoids appeared the most promising current treatment on account of its superior efficacy and favourable side‐effects profile. However, longer‐term adverse effects were not addressed by this review. In contrast, the review by Bruner 2003a focused on adverse effects. This review supported our findings that there is little robust evidence on longer‐term adverse effects; therefore, concluding that since clearance is not a realistic expectation, "reasonable goals" are needed to avoid increasing the risk of cutaneous and systemic side‐effects through over use.
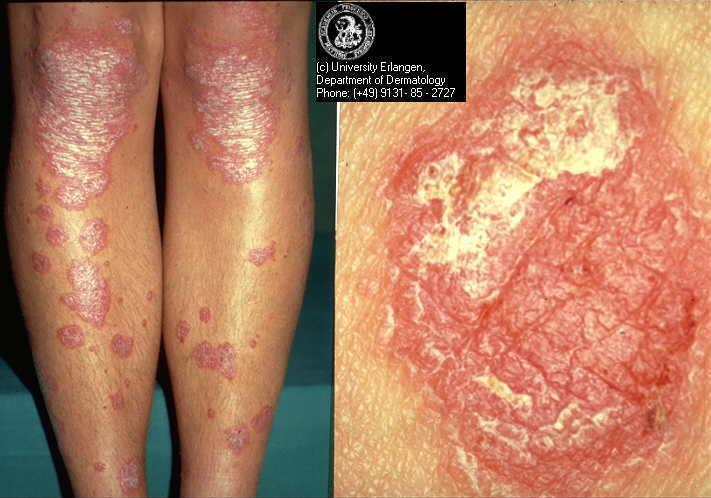
Chronic plaque psoriasis
Source: Dermis Dermatology Atlas Online (used with permission)
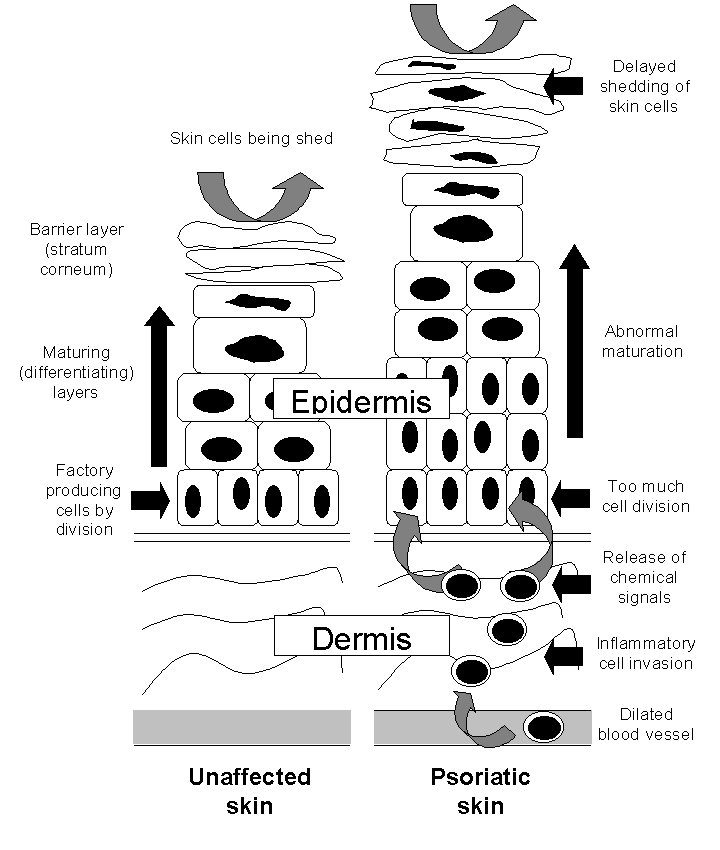
The epidermis in the skin of people with and without psoriasis

Risk of bias graph: review authors' judgements about each risk of bias item presented as percentages across all included studies.
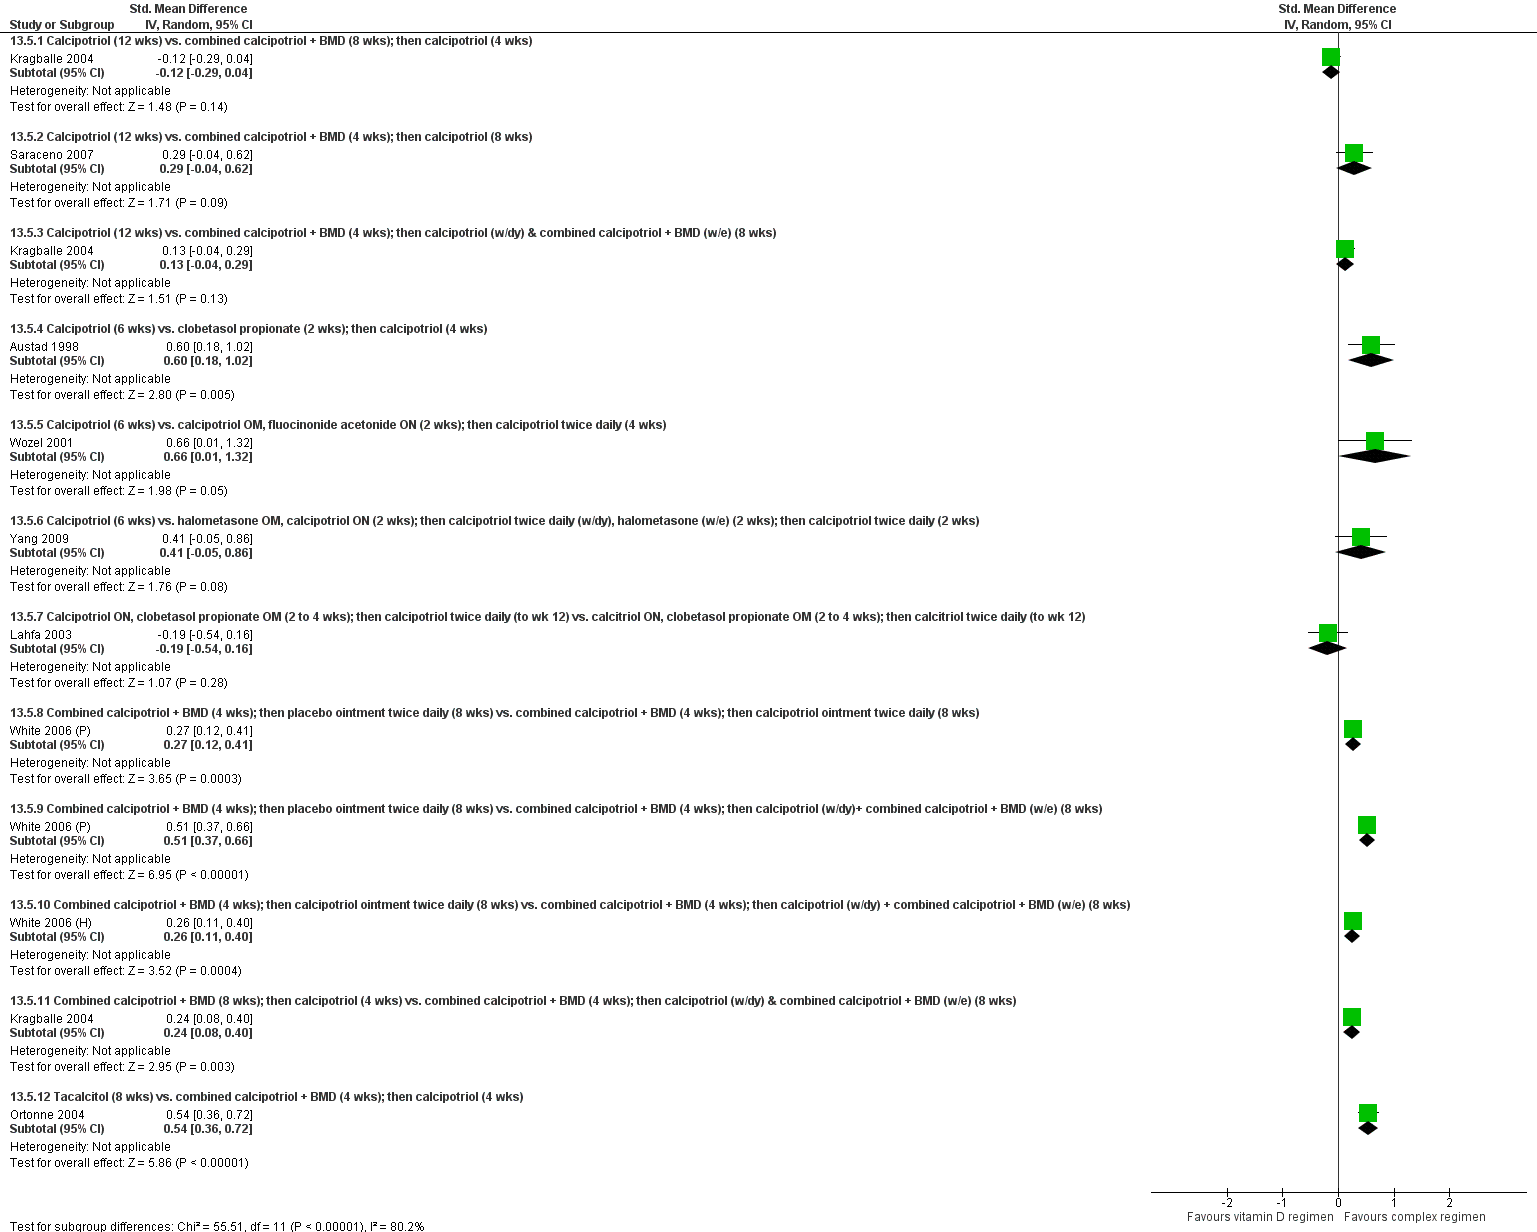
Forest plot of comparison: 13 Vitamin D alone or in combination vs. other treatments: complex regimens, outcome: 13.5 Combined end point (IAGI/TSS/PASI/PAGI).

Forest plot of comparison: 14 Vitamin D alone or in combination vs. other treatment: long term studies (>24wks), outcome: 14.5 Combined end point (IAGI/TSS/PASI/PAGI).

Forest plot of comparison: 18 Scalp psoriasis: placebo‐controlled trials, outcome: 18.5 Combined end point (IAGI/TSS/PASI/PAGI).

Comparison 1 Vitamin D analogues versus placebo, Outcome 1 IAGI.

Comparison 1 Vitamin D analogues versus placebo, Outcome 2 TSS.
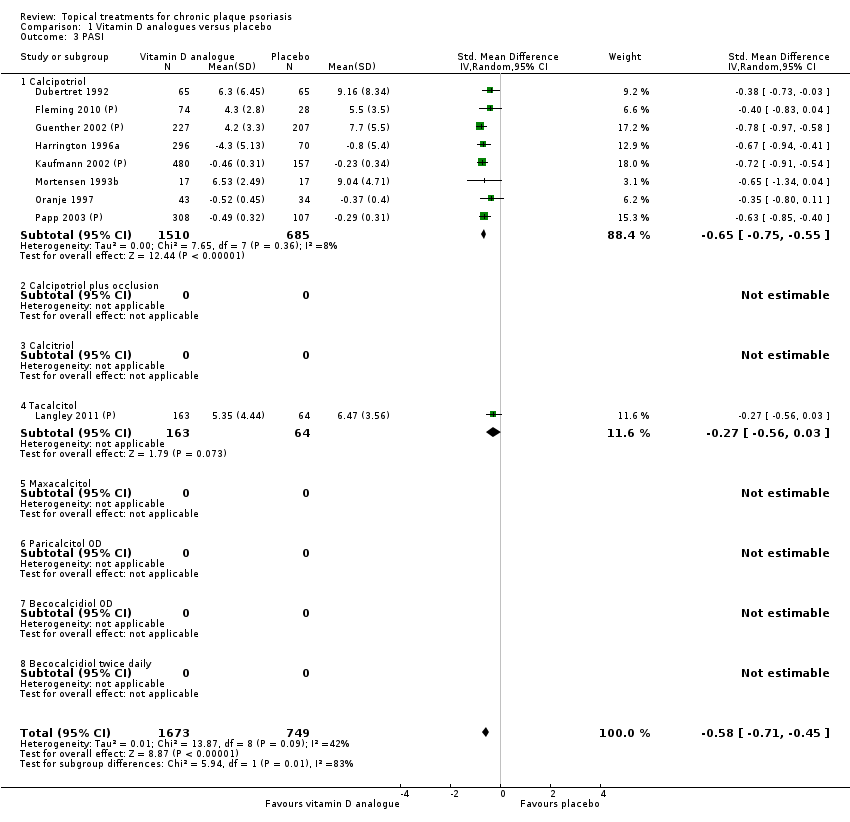
Comparison 1 Vitamin D analogues versus placebo, Outcome 3 PASI.

Comparison 1 Vitamin D analogues versus placebo, Outcome 4 PAGI.

Comparison 1 Vitamin D analogues versus placebo, Outcome 5 Combined end point (IAGI/TSS/PASI/PAGI).
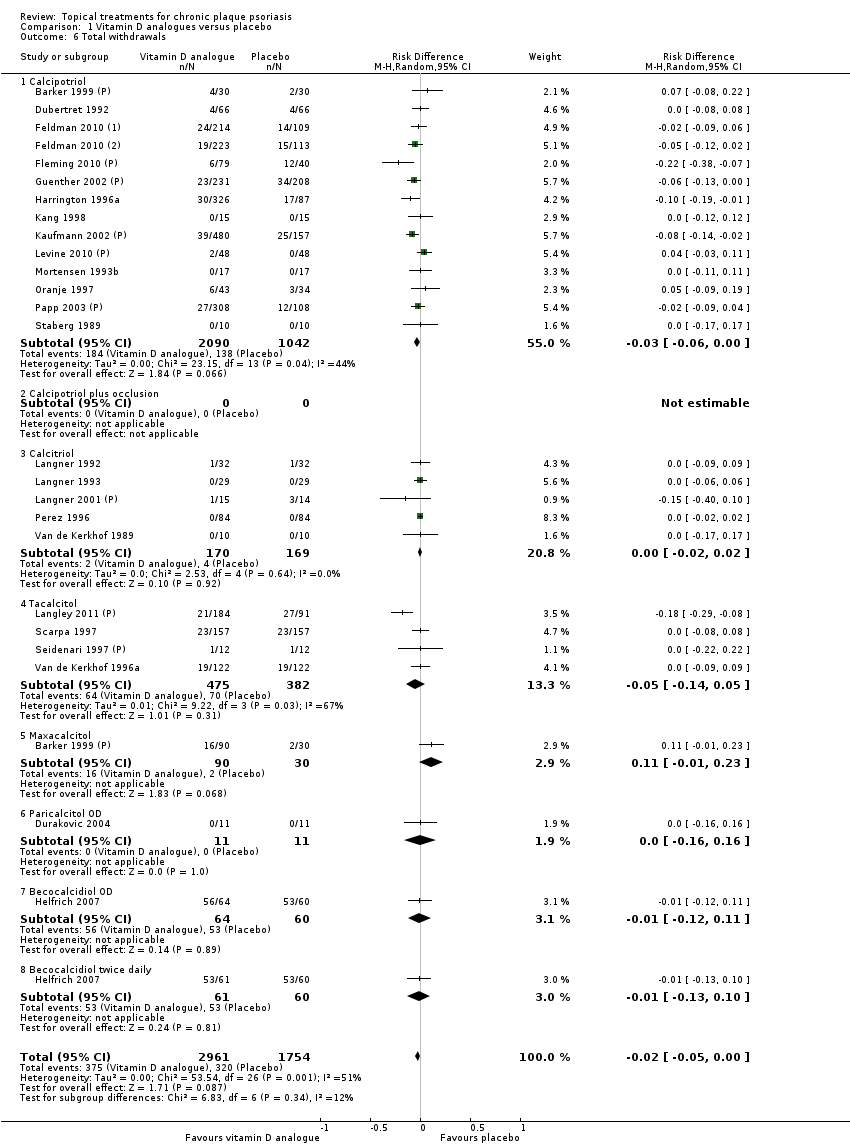
Comparison 1 Vitamin D analogues versus placebo, Outcome 6 Total withdrawals.
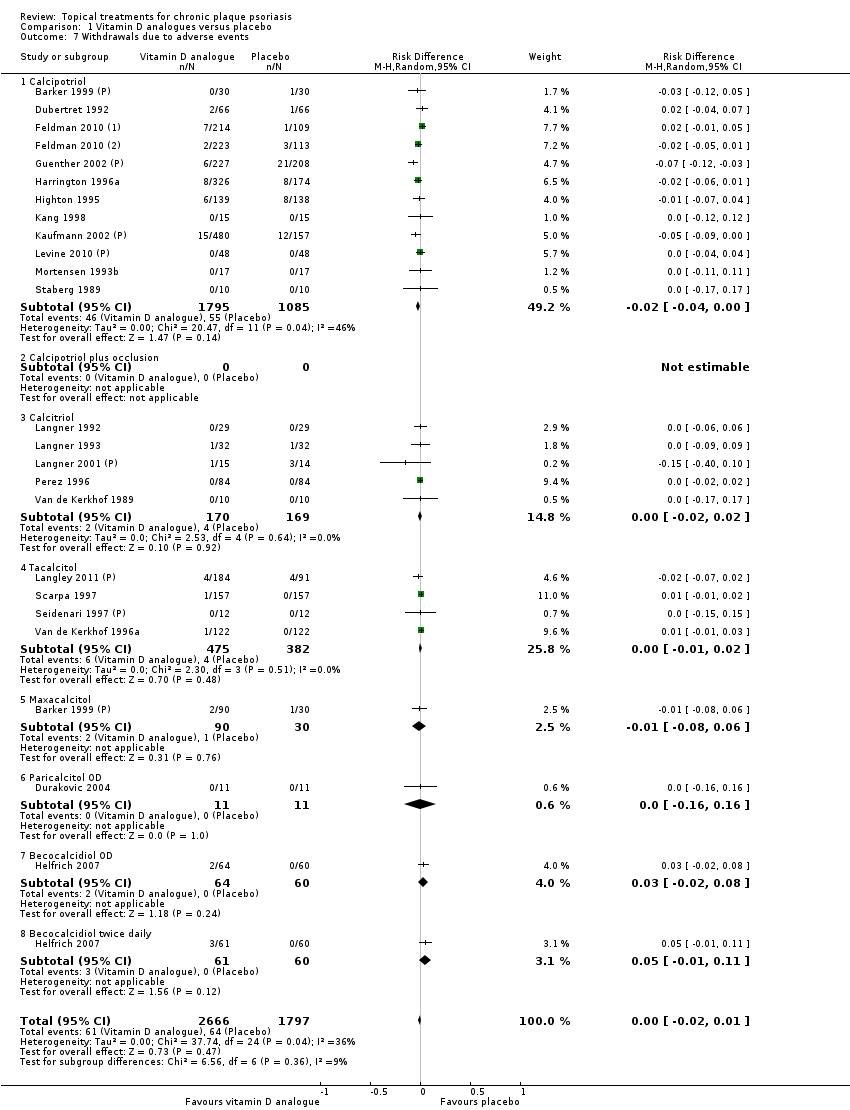
Comparison 1 Vitamin D analogues versus placebo, Outcome 7 Withdrawals due to adverse events.
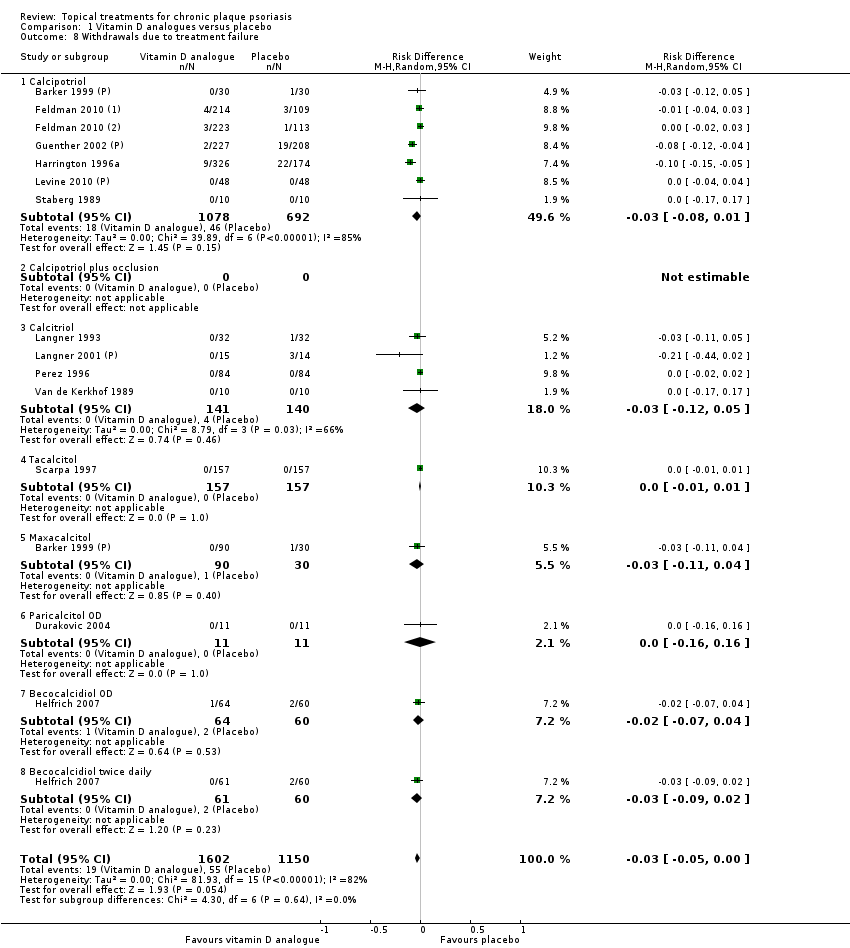
Comparison 1 Vitamin D analogues versus placebo, Outcome 8 Withdrawals due to treatment failure.

Comparison 1 Vitamin D analogues versus placebo, Outcome 9 Adverse events (local).
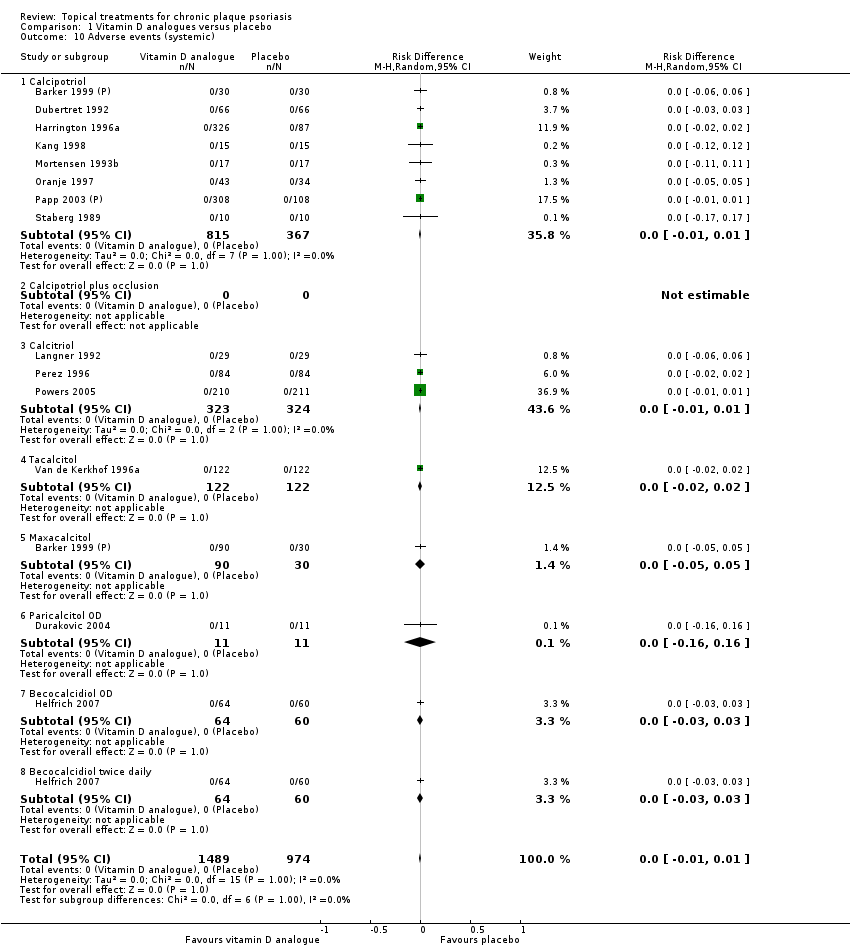
Comparison 1 Vitamin D analogues versus placebo, Outcome 10 Adverse events (systemic).

Comparison 2 Corticosteroid (potent) versus placebo, Outcome 1 IAGI.
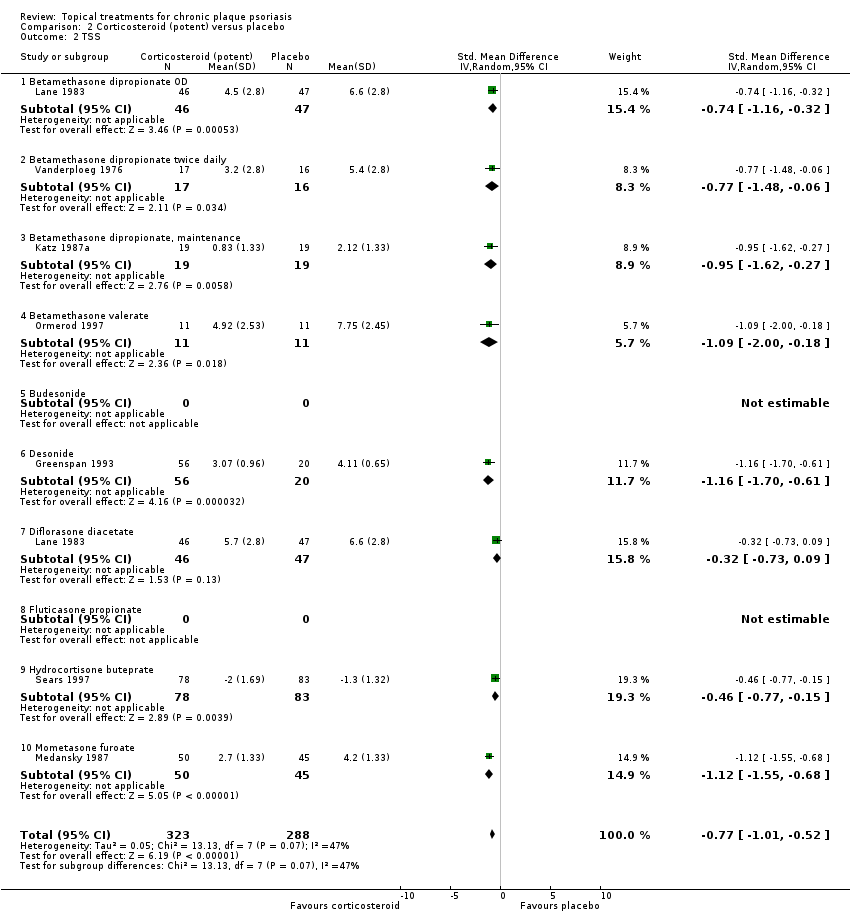
Comparison 2 Corticosteroid (potent) versus placebo, Outcome 2 TSS.
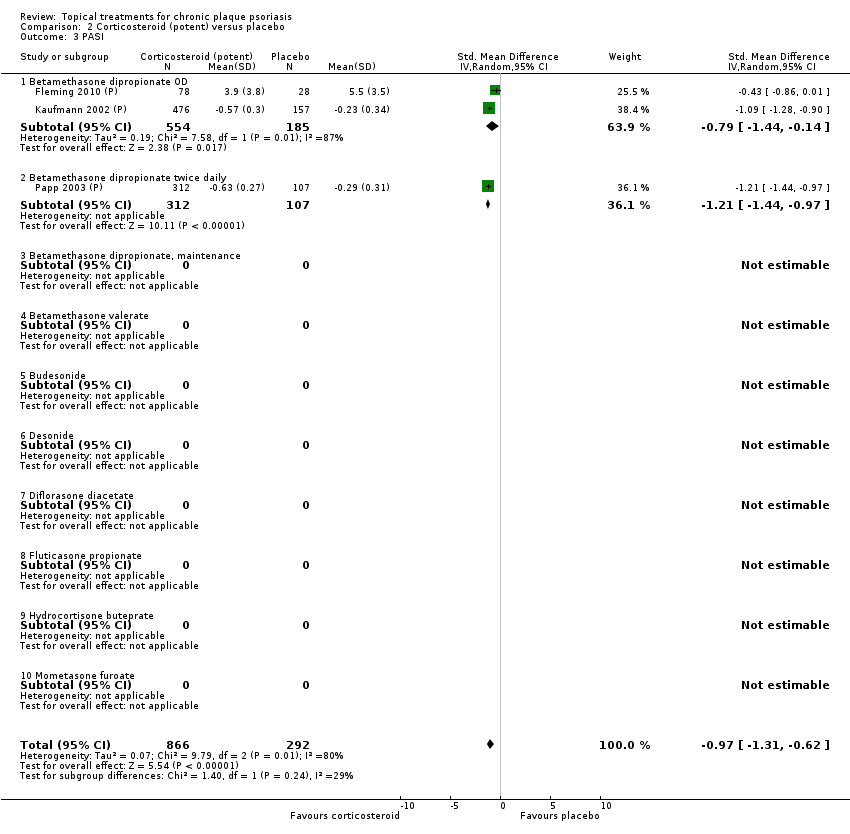
Comparison 2 Corticosteroid (potent) versus placebo, Outcome 3 PASI.

Comparison 2 Corticosteroid (potent) versus placebo, Outcome 5 Combined end point (IAGI/TSS/PASI/PAGI).
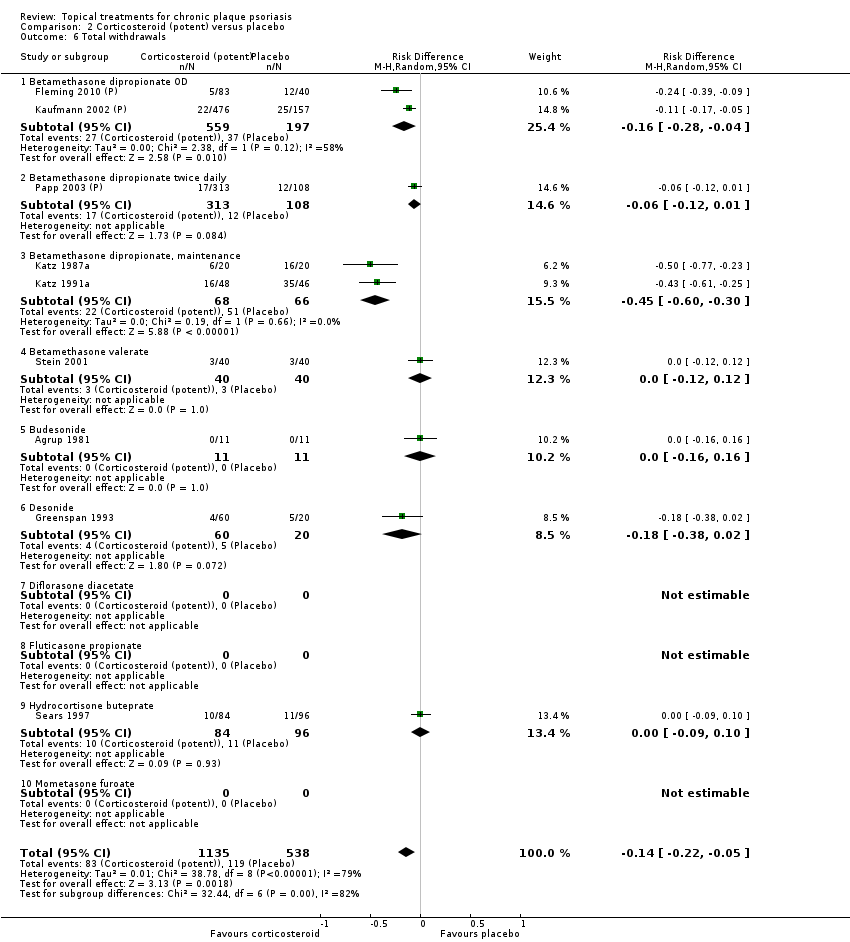
Comparison 2 Corticosteroid (potent) versus placebo, Outcome 6 Total withdrawals.

Comparison 2 Corticosteroid (potent) versus placebo, Outcome 7 Withdrawals due to adverse events.

Comparison 2 Corticosteroid (potent) versus placebo, Outcome 8 Withdrawals due to treatment failure.

Comparison 2 Corticosteroid (potent) versus placebo, Outcome 9 Adverse events (local).
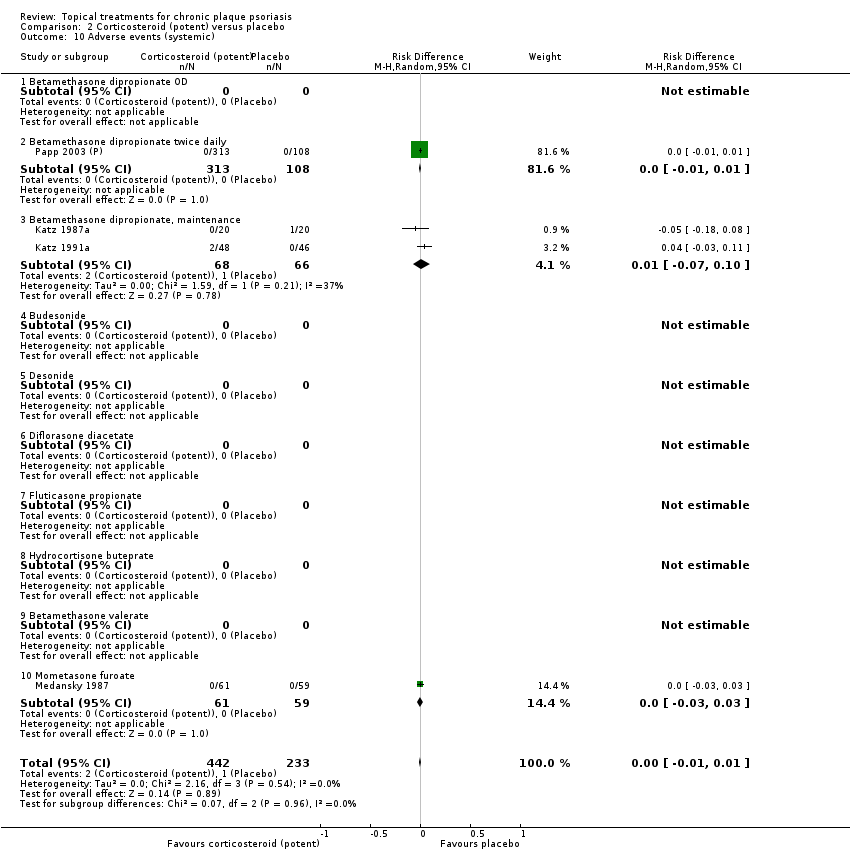
Comparison 2 Corticosteroid (potent) versus placebo, Outcome 10 Adverse events (systemic).
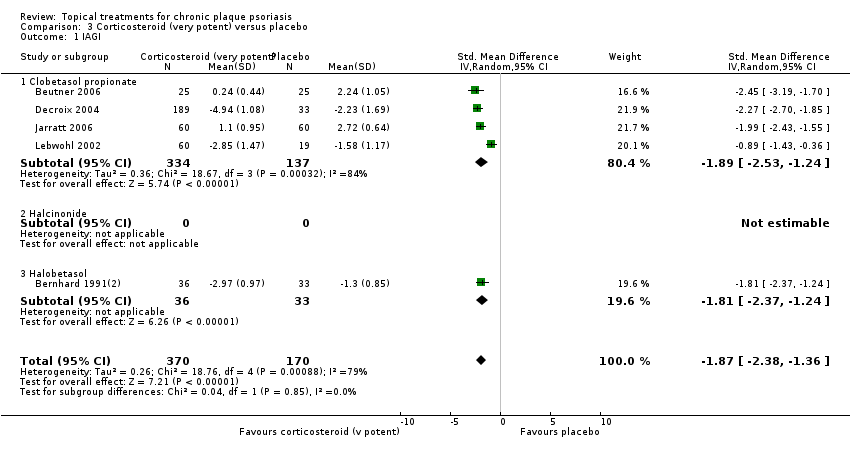
Comparison 3 Corticosteroid (very potent) versus placebo, Outcome 1 IAGI.

Comparison 3 Corticosteroid (very potent) versus placebo, Outcome 2 TSS.

Comparison 3 Corticosteroid (very potent) versus placebo, Outcome 4 PAGI.
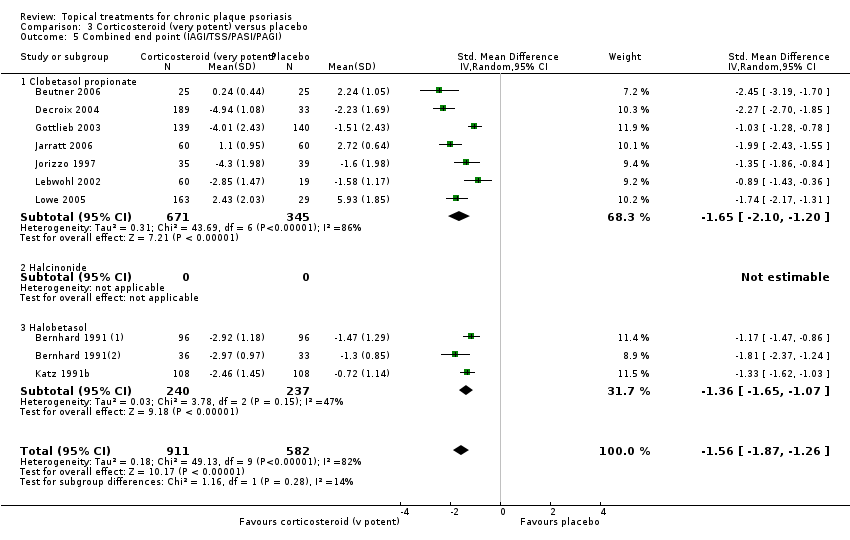
Comparison 3 Corticosteroid (very potent) versus placebo, Outcome 5 Combined end point (IAGI/TSS/PASI/PAGI).

Comparison 3 Corticosteroid (very potent) versus placebo, Outcome 6 Total withdrawals.
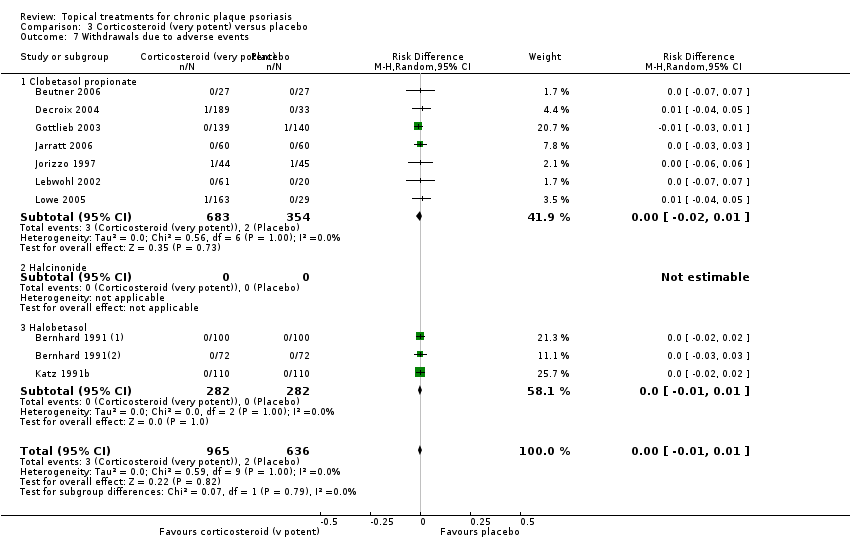
Comparison 3 Corticosteroid (very potent) versus placebo, Outcome 7 Withdrawals due to adverse events.
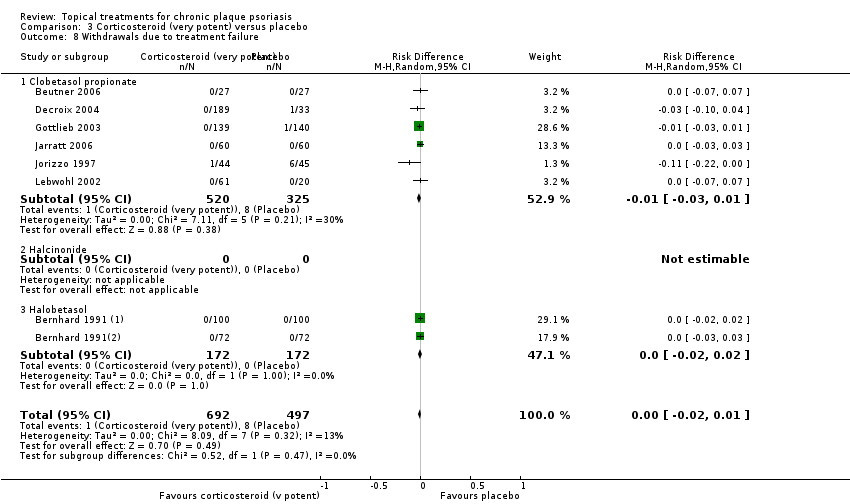
Comparison 3 Corticosteroid (very potent) versus placebo, Outcome 8 Withdrawals due to treatment failure.

Comparison 3 Corticosteroid (very potent) versus placebo, Outcome 9 Adverse events (local).
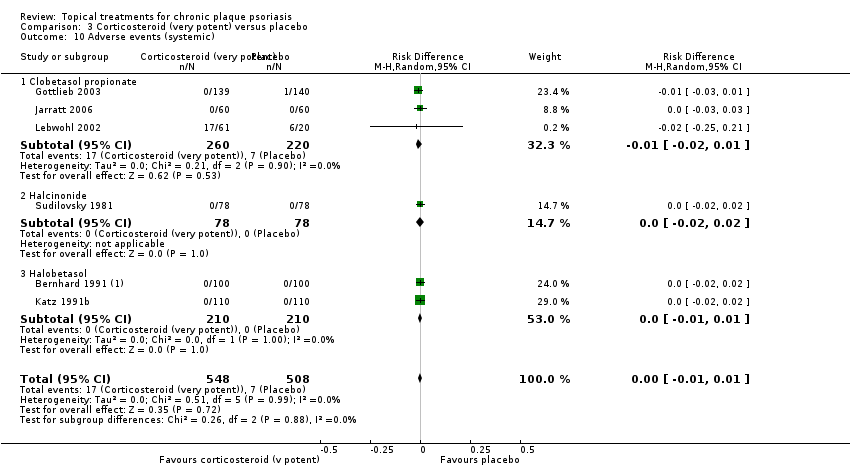
Comparison 3 Corticosteroid (very potent) versus placebo, Outcome 10 Adverse events (systemic).

Comparison 4 Dithranol versus placebo, Outcome 2 TSS.

Comparison 4 Dithranol versus placebo, Outcome 5 Combined end point (IAGI/TSS/PASI/PAGI).

Comparison 4 Dithranol versus placebo, Outcome 6 Total withdrawals.
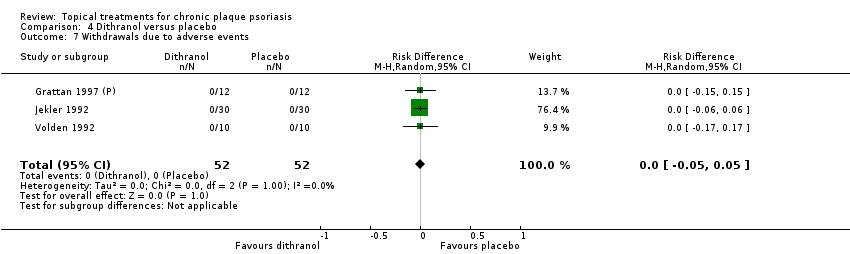
Comparison 4 Dithranol versus placebo, Outcome 7 Withdrawals due to adverse events.

Comparison 4 Dithranol versus placebo, Outcome 8 Withdrawals due to treatment failure.

Comparison 4 Dithranol versus placebo, Outcome 9 Adverse events (local).

Comparison 4 Dithranol versus placebo, Outcome 10 Adverse events (systemic).
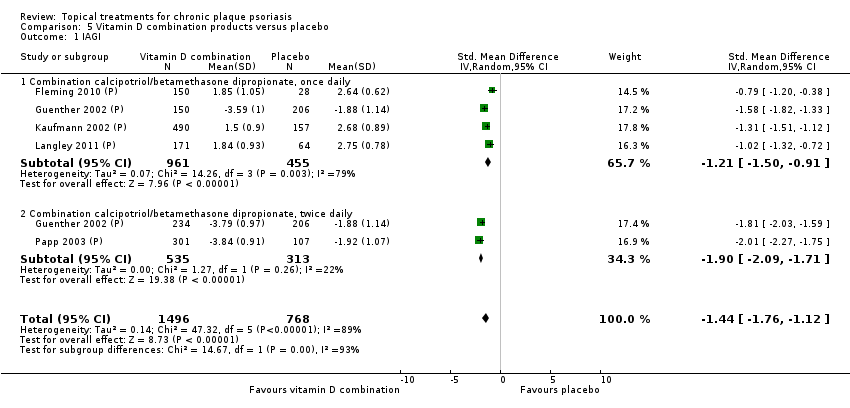
Comparison 5 Vitamin D combination products versus placebo, Outcome 1 IAGI.

Comparison 5 Vitamin D combination products versus placebo, Outcome 3 PASI.
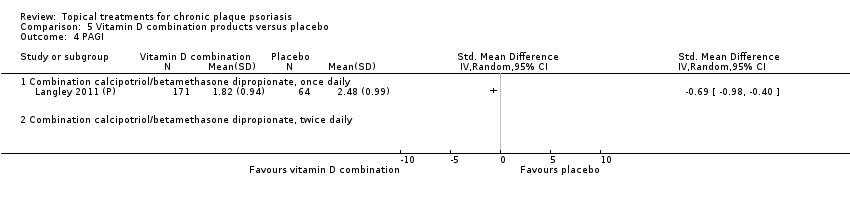
Comparison 5 Vitamin D combination products versus placebo, Outcome 4 PAGI.

Comparison 5 Vitamin D combination products versus placebo, Outcome 5 Combined end point (IAGI/TSS/PASI/PAGI).

Comparison 5 Vitamin D combination products versus placebo, Outcome 6 Total withdrawals.

Comparison 5 Vitamin D combination products versus placebo, Outcome 7 Withdrawals due to adverse events.

Comparison 5 Vitamin D combination products versus placebo, Outcome 8 Withdrawals due to treatment failure.
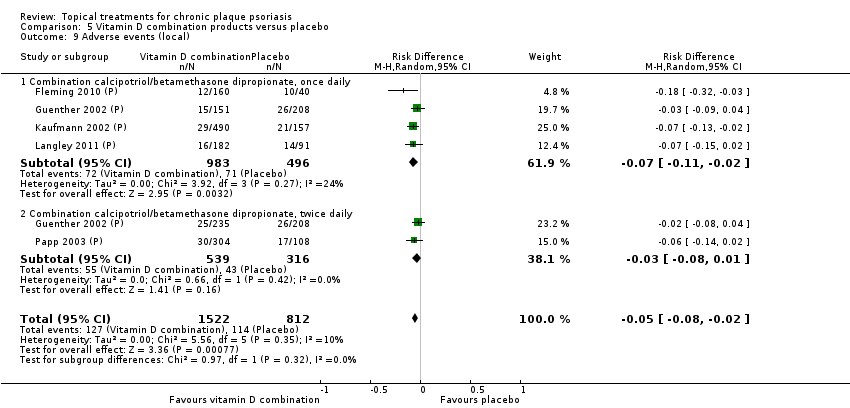
Comparison 5 Vitamin D combination products versus placebo, Outcome 9 Adverse events (local).

Comparison 5 Vitamin D combination products versus placebo, Outcome 10 Adverse events (systemic).

Comparison 6 Other treatment versus placebo, Outcome 1 IAGI.
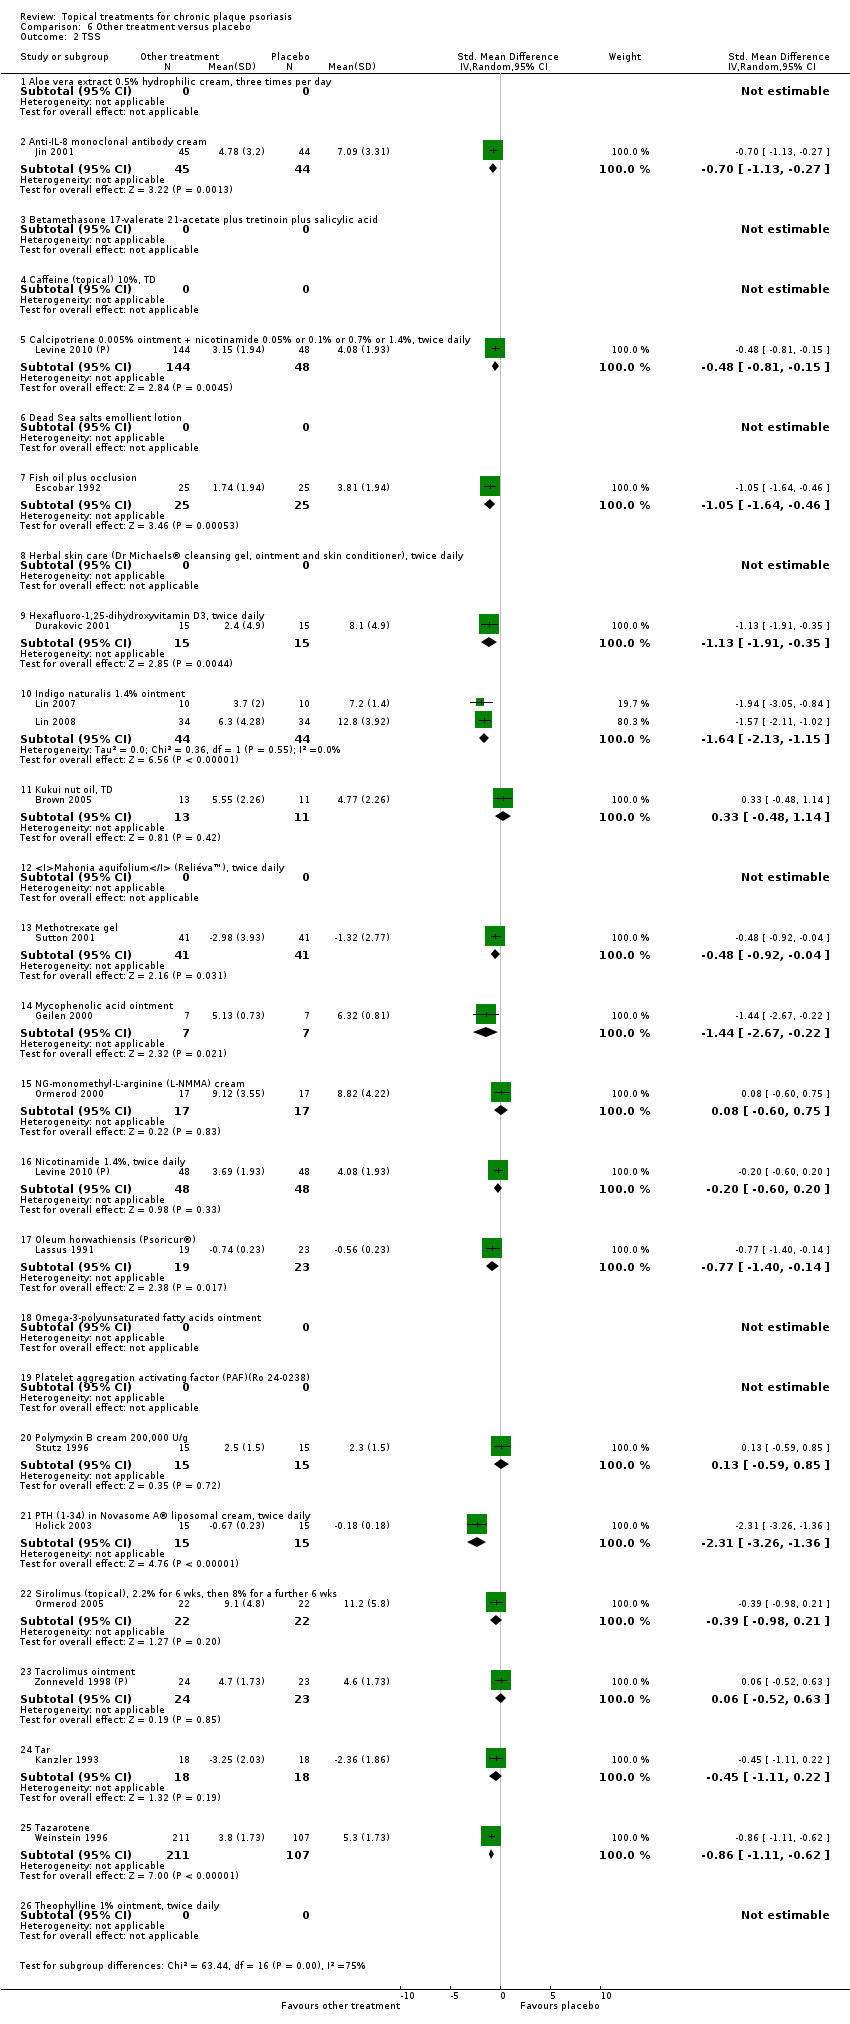
Comparison 6 Other treatment versus placebo, Outcome 2 TSS.

Comparison 6 Other treatment versus placebo, Outcome 3 PASI.

Comparison 6 Other treatment versus placebo, Outcome 4 PAGI.

Comparison 6 Other treatment versus placebo, Outcome 5 Combined end point (IAGI/TSS/PASI/PAGI).

Comparison 6 Other treatment versus placebo, Outcome 6 Total withdrawals.
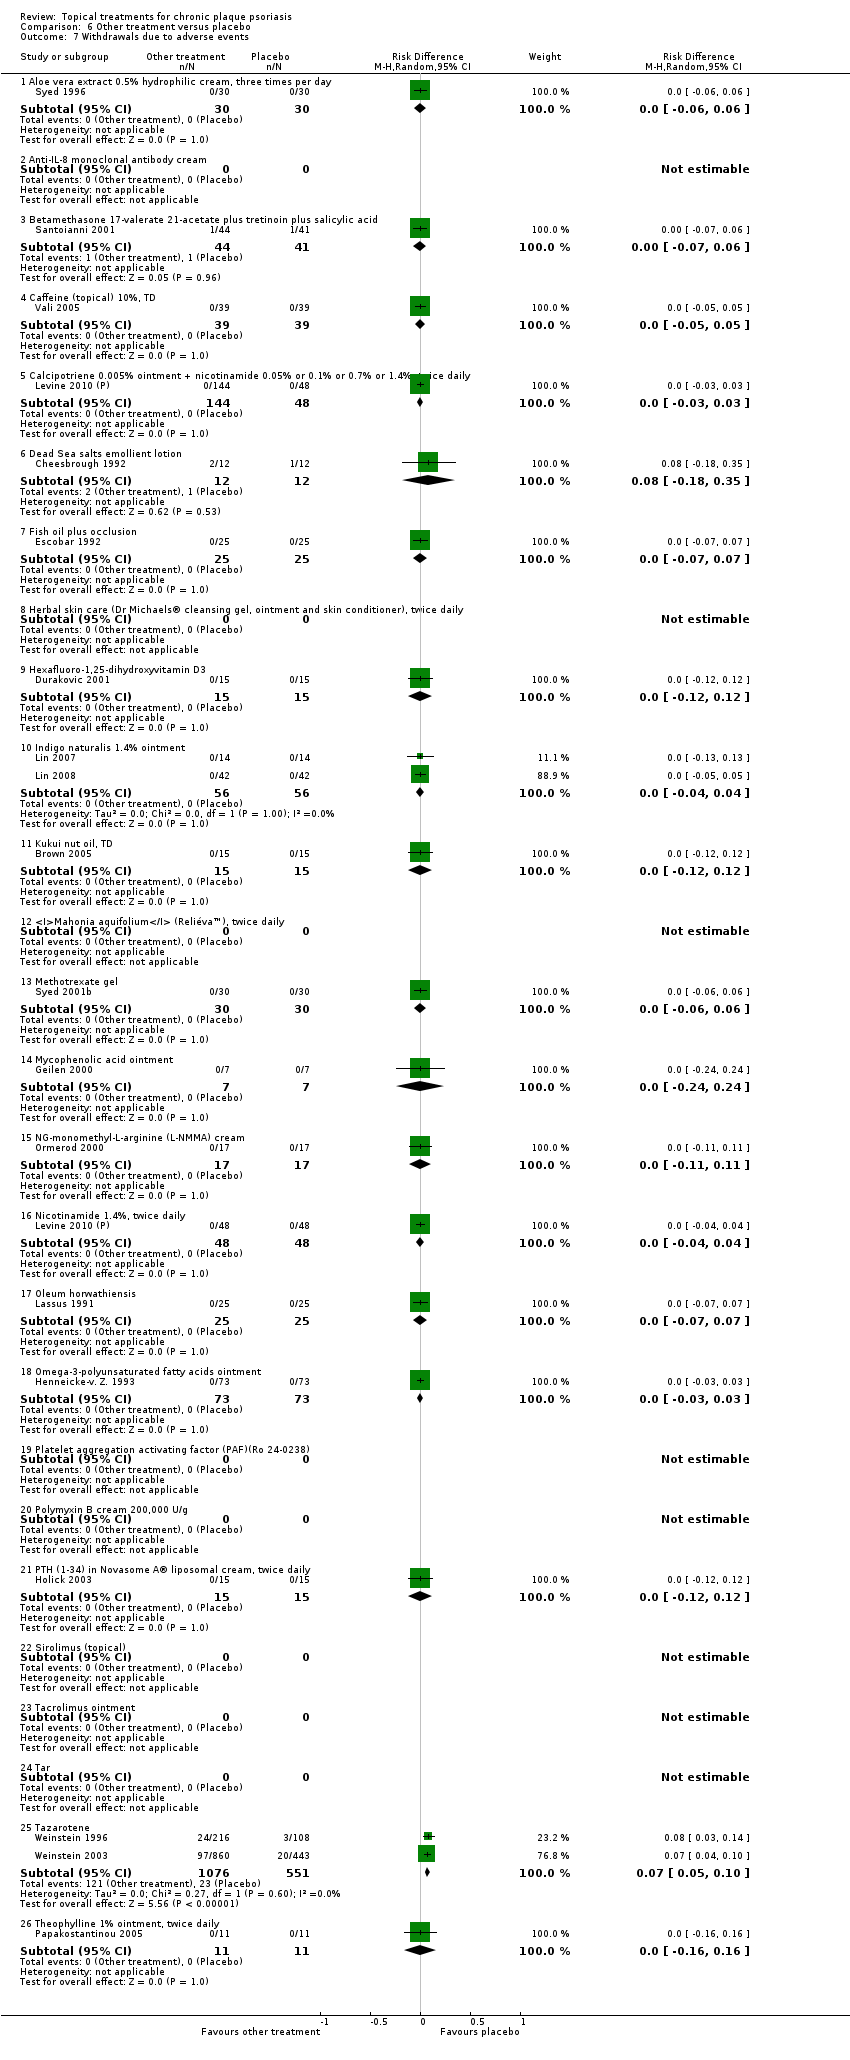
Comparison 6 Other treatment versus placebo, Outcome 7 Withdrawals due to adverse events.

Comparison 6 Other treatment versus placebo, Outcome 8 Withdrawals due to treatment failure.

Comparison 6 Other treatment versus placebo, Outcome 9 Adverse events (local).
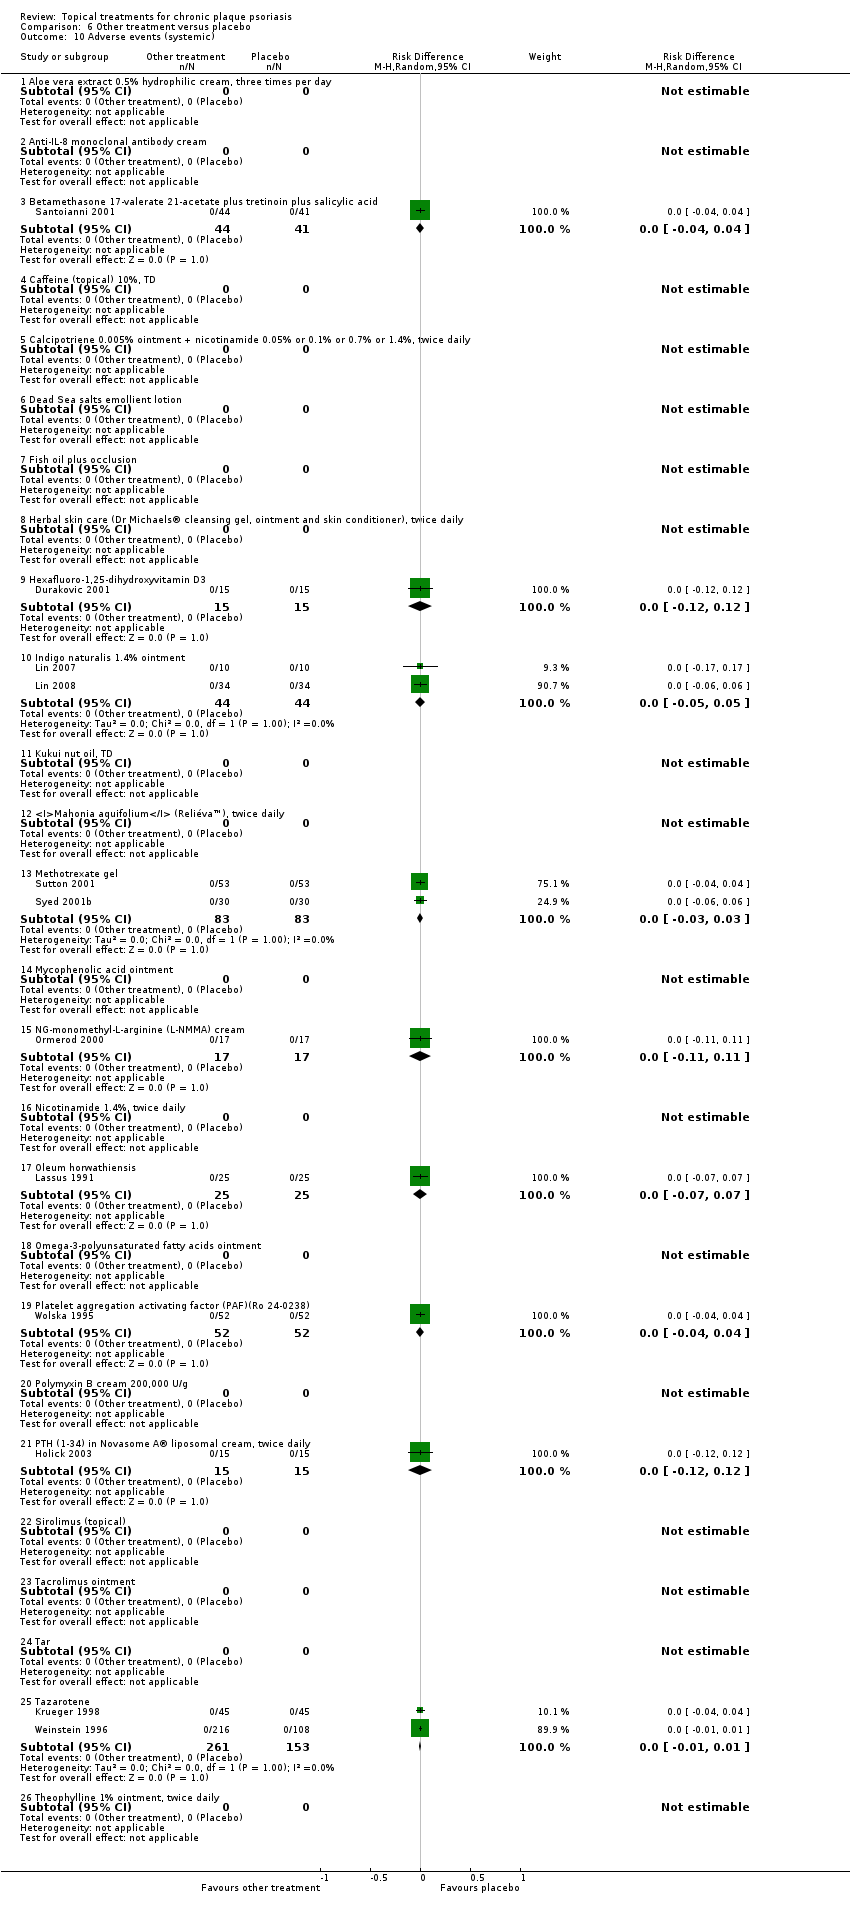
Comparison 6 Other treatment versus placebo, Outcome 10 Adverse events (systemic).

Comparison 7 Vitamin D analogues versus corticosteroid (potent), Outcome 1 IAGI.
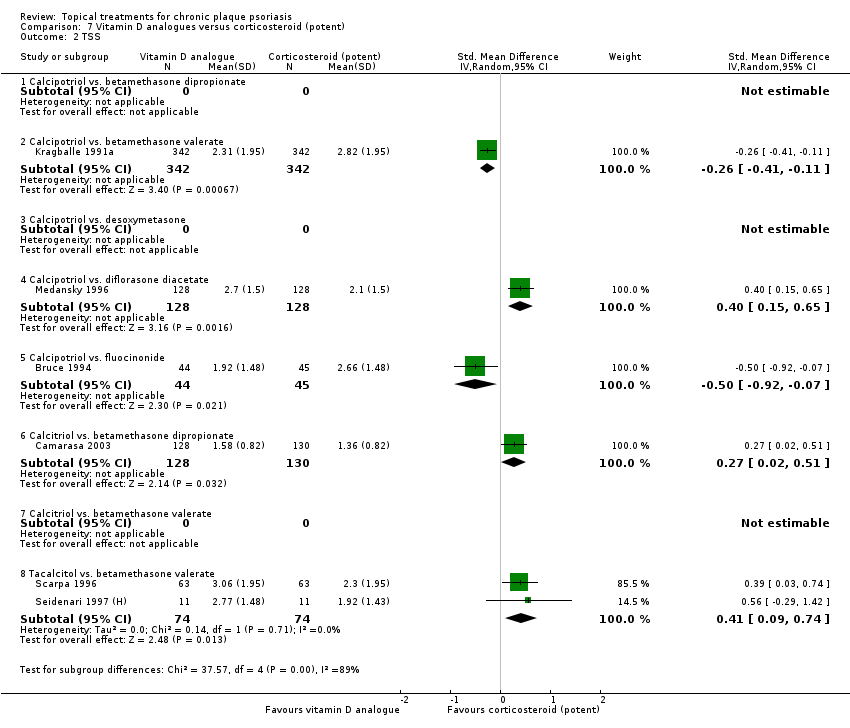
Comparison 7 Vitamin D analogues versus corticosteroid (potent), Outcome 2 TSS.
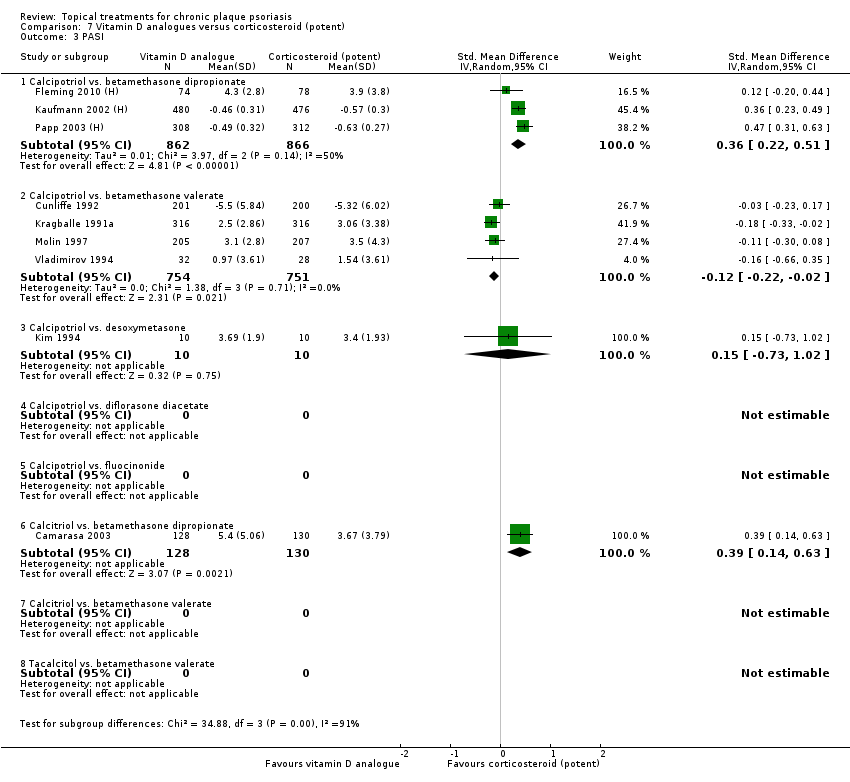
Comparison 7 Vitamin D analogues versus corticosteroid (potent), Outcome 3 PASI.
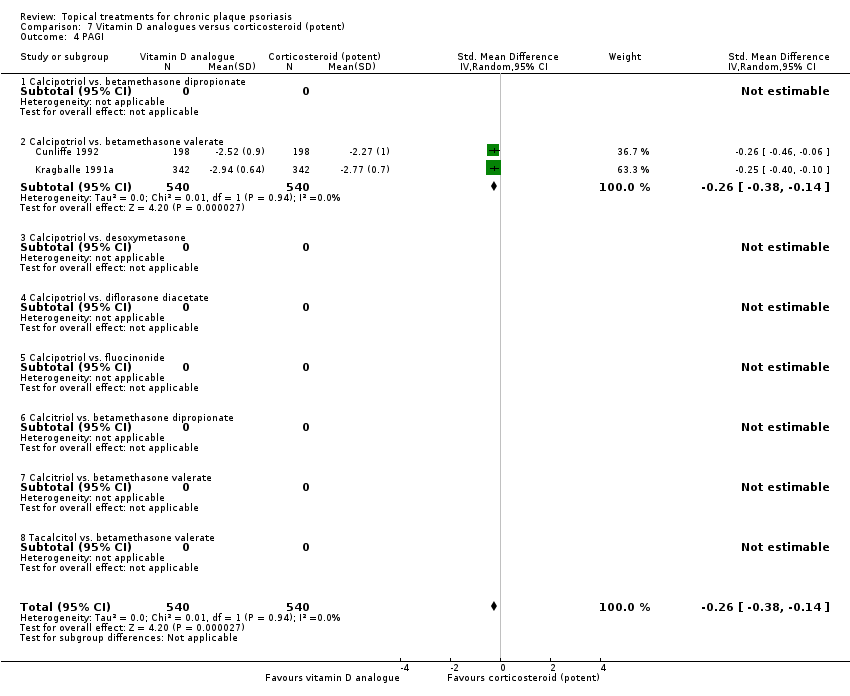
Comparison 7 Vitamin D analogues versus corticosteroid (potent), Outcome 4 PAGI.

Comparison 7 Vitamin D analogues versus corticosteroid (potent), Outcome 5 Combined end point (IAGI/TSS/PASI/PAGI).

Comparison 7 Vitamin D analogues versus corticosteroid (potent), Outcome 6 Total withdrawals.

Comparison 7 Vitamin D analogues versus corticosteroid (potent), Outcome 7 Withdrawals due to adverse events.

Comparison 7 Vitamin D analogues versus corticosteroid (potent), Outcome 8 Withdrawals due to treatment failure.
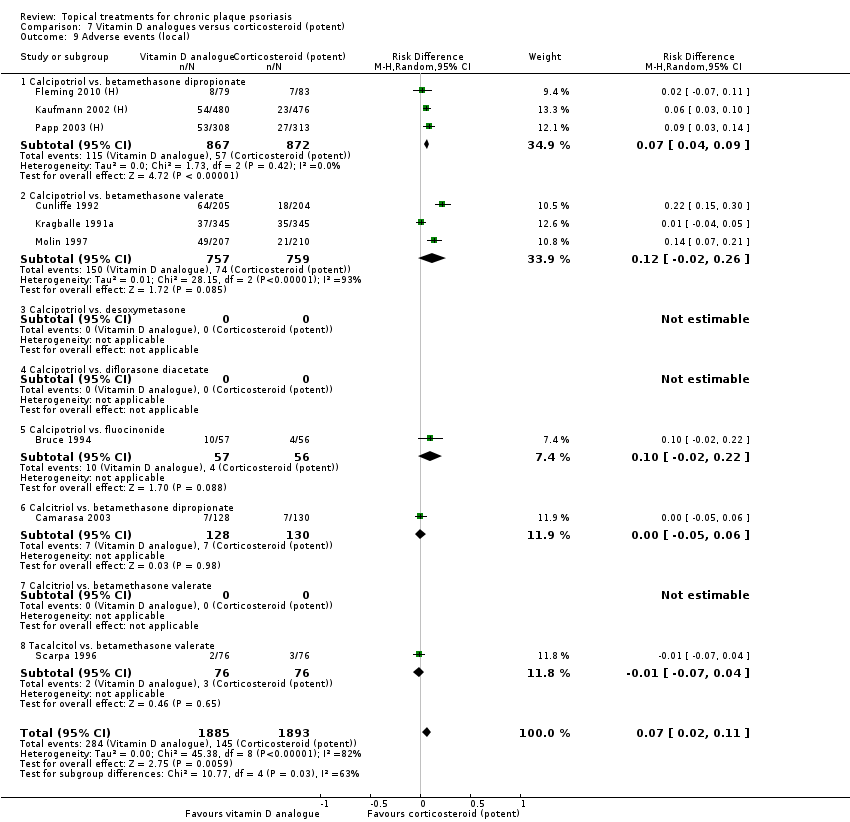
Comparison 7 Vitamin D analogues versus corticosteroid (potent), Outcome 9 Adverse events (local).

Comparison 7 Vitamin D analogues versus corticosteroid (potent), Outcome 10 Adverse events (systemic).

Comparison 8 Vitamin D analogues versus corticosteroid (very potent), Outcome 1 IAGI.
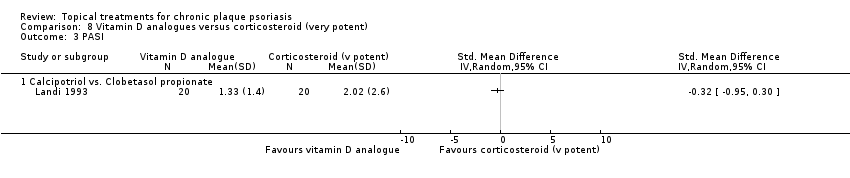
Comparison 8 Vitamin D analogues versus corticosteroid (very potent), Outcome 3 PASI.
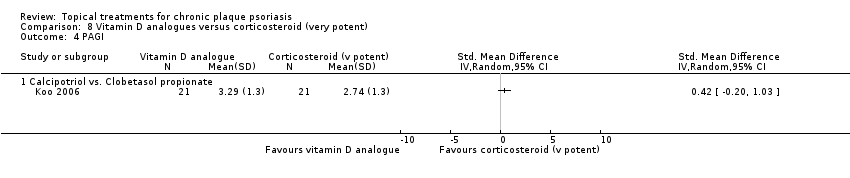
Comparison 8 Vitamin D analogues versus corticosteroid (very potent), Outcome 4 PAGI.
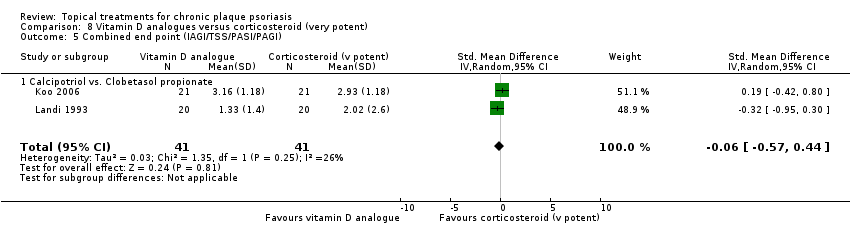
Comparison 8 Vitamin D analogues versus corticosteroid (very potent), Outcome 5 Combined end point (IAGI/TSS/PASI/PAGI).

Comparison 8 Vitamin D analogues versus corticosteroid (very potent), Outcome 6 Total withdrawals.

Comparison 8 Vitamin D analogues versus corticosteroid (very potent), Outcome 7 Withdrawals due to adverse events.
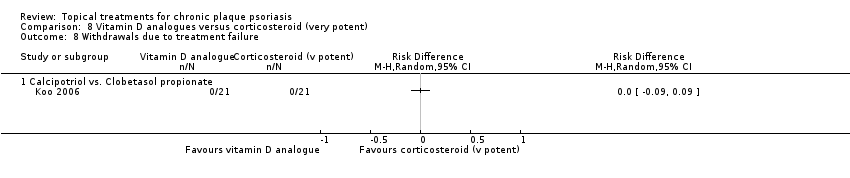
Comparison 8 Vitamin D analogues versus corticosteroid (very potent), Outcome 8 Withdrawals due to treatment failure.

Comparison 8 Vitamin D analogues versus corticosteroid (very potent), Outcome 9 Adverse events (local).

Comparison 8 Vitamin D analogues versus corticosteroid (very potent), Outcome 10 Adverse events (systemic).
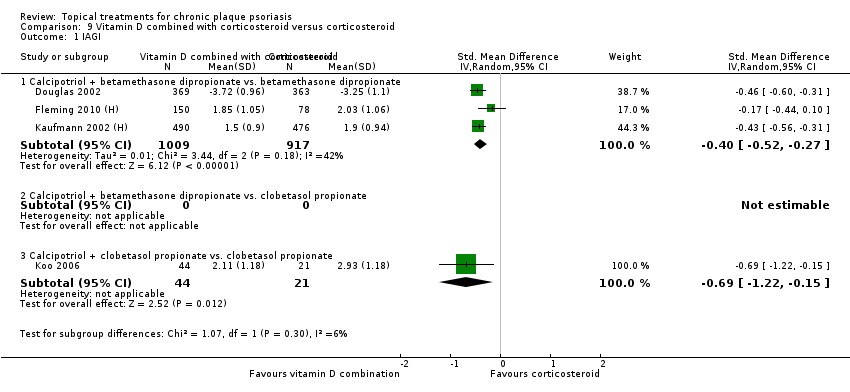
Comparison 9 Vitamin D combined with corticosteroid versus corticosteroid, Outcome 1 IAGI.

Comparison 9 Vitamin D combined with corticosteroid versus corticosteroid, Outcome 2 TSS.

Comparison 9 Vitamin D combined with corticosteroid versus corticosteroid, Outcome 3 PASI.

Comparison 9 Vitamin D combined with corticosteroid versus corticosteroid, Outcome 4 PAGI.

Comparison 9 Vitamin D combined with corticosteroid versus corticosteroid, Outcome 5 Combined end point (IAGI/TSS/PASI/PAGI).
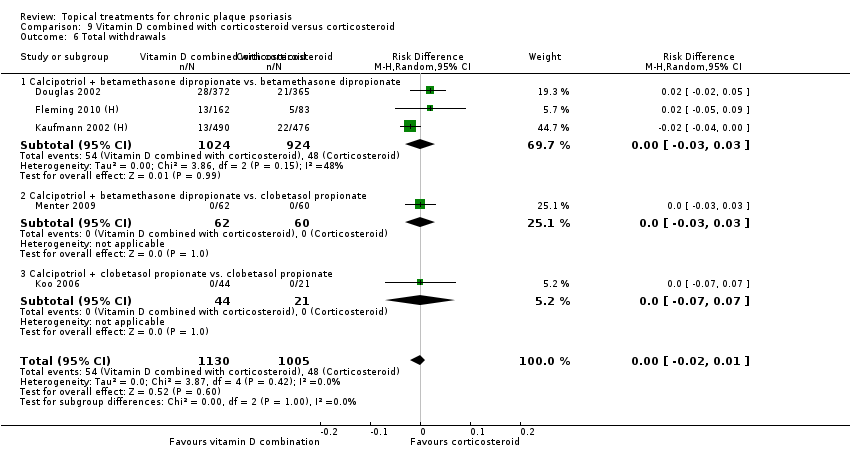
Comparison 9 Vitamin D combined with corticosteroid versus corticosteroid, Outcome 6 Total withdrawals.

Comparison 9 Vitamin D combined with corticosteroid versus corticosteroid, Outcome 7 Withdrawals due to adverse events.

Comparison 9 Vitamin D combined with corticosteroid versus corticosteroid, Outcome 8 Withdrawals due to treatment failure.
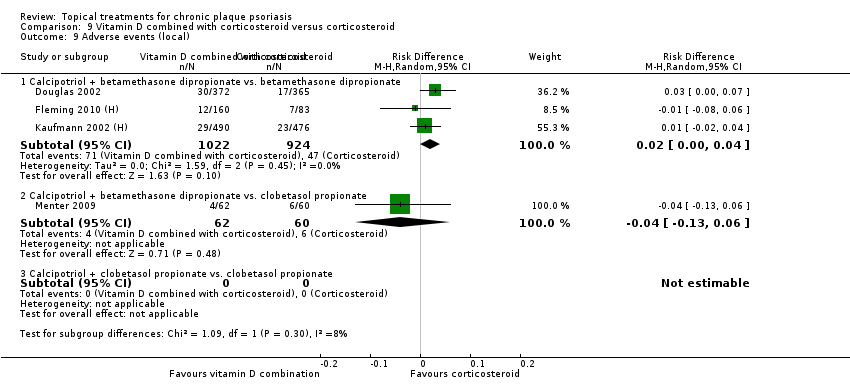
Comparison 9 Vitamin D combined with corticosteroid versus corticosteroid, Outcome 9 Adverse events (local).
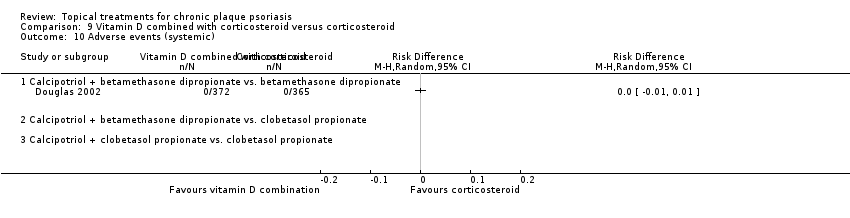
Comparison 9 Vitamin D combined with corticosteroid versus corticosteroid, Outcome 10 Adverse events (systemic).

Comparison 10 Vitamin D alone or in combination versus dithranol, Outcome 1 IAGI.
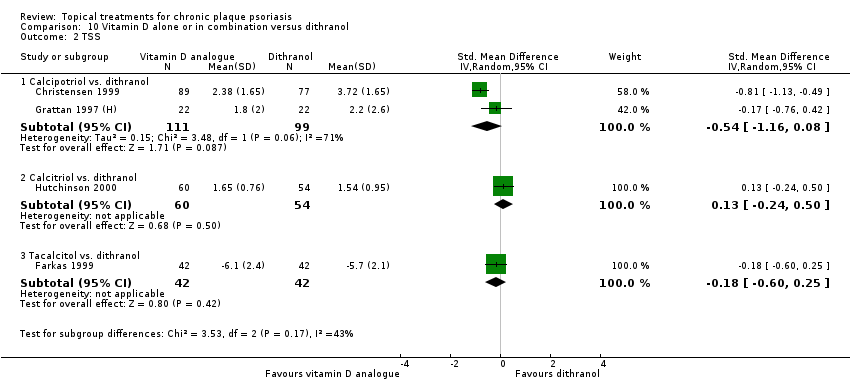
Comparison 10 Vitamin D alone or in combination versus dithranol, Outcome 2 TSS.

Comparison 10 Vitamin D alone or in combination versus dithranol, Outcome 3 PASI.

Comparison 10 Vitamin D alone or in combination versus dithranol, Outcome 4 PAGI.

Comparison 10 Vitamin D alone or in combination versus dithranol, Outcome 5 Combined end point (IAGI/TSS/PASI/PAGI).

Comparison 10 Vitamin D alone or in combination versus dithranol, Outcome 6 Total withdrawals.

Comparison 10 Vitamin D alone or in combination versus dithranol, Outcome 7 Withdrawals due to adverse events.
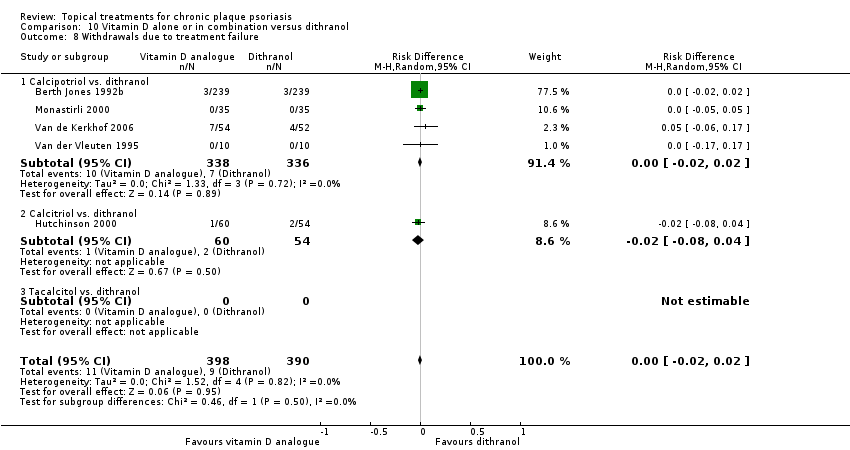
Comparison 10 Vitamin D alone or in combination versus dithranol, Outcome 8 Withdrawals due to treatment failure.
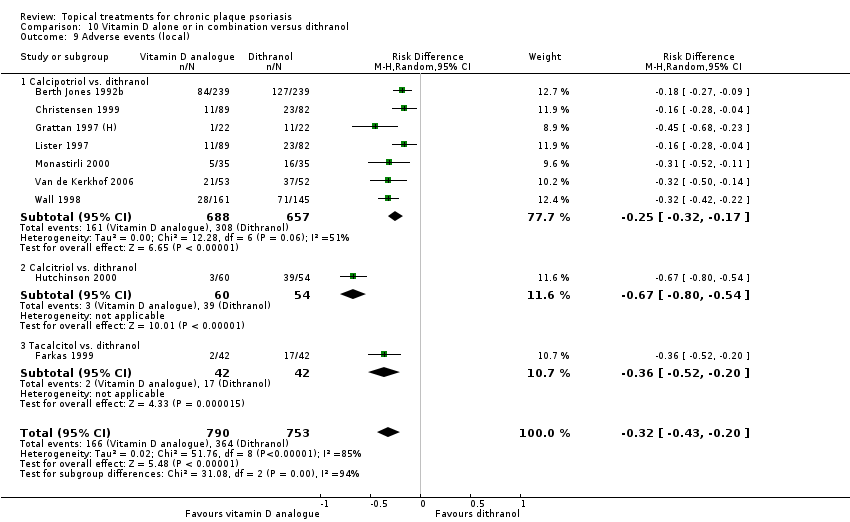
Comparison 10 Vitamin D alone or in combination versus dithranol, Outcome 9 Adverse events (local).

Comparison 10 Vitamin D alone or in combination versus dithranol, Outcome 10 Adverse events (systemic).

Comparison 11 Vitamin D alone or in combination versus other vitamin D analogue, Outcome 1 IAGI.

Comparison 11 Vitamin D alone or in combination versus other vitamin D analogue, Outcome 2 TSS.

Comparison 11 Vitamin D alone or in combination versus other vitamin D analogue, Outcome 3 PASI.
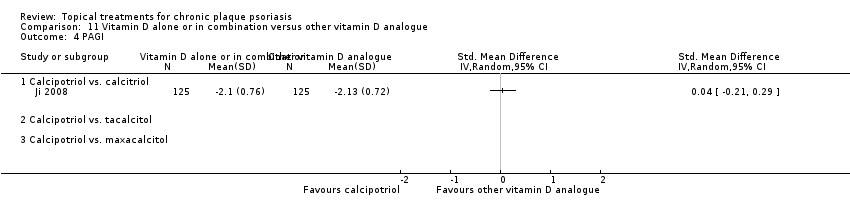
Comparison 11 Vitamin D alone or in combination versus other vitamin D analogue, Outcome 4 PAGI.

Comparison 11 Vitamin D alone or in combination versus other vitamin D analogue, Outcome 5 Combined end point (IAGI/TSS/PASI/PAGI).

Comparison 11 Vitamin D alone or in combination versus other vitamin D analogue, Outcome 6 Total withdrawals.

Comparison 11 Vitamin D alone or in combination versus other vitamin D analogue, Outcome 7 Withdrawals due to adverse events.
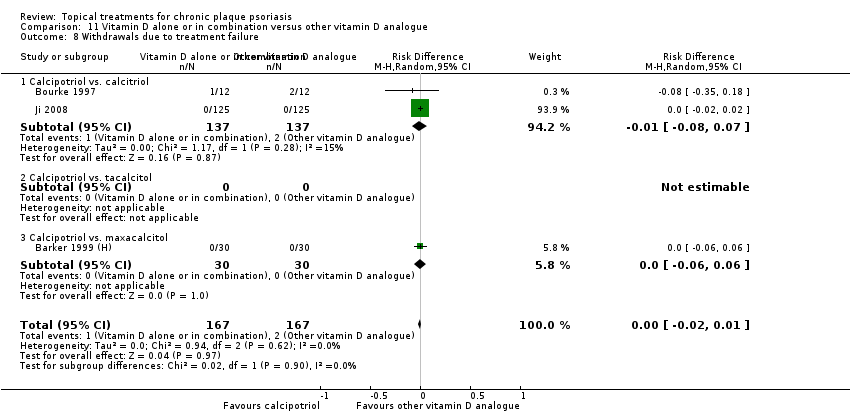
Comparison 11 Vitamin D alone or in combination versus other vitamin D analogue, Outcome 8 Withdrawals due to treatment failure.
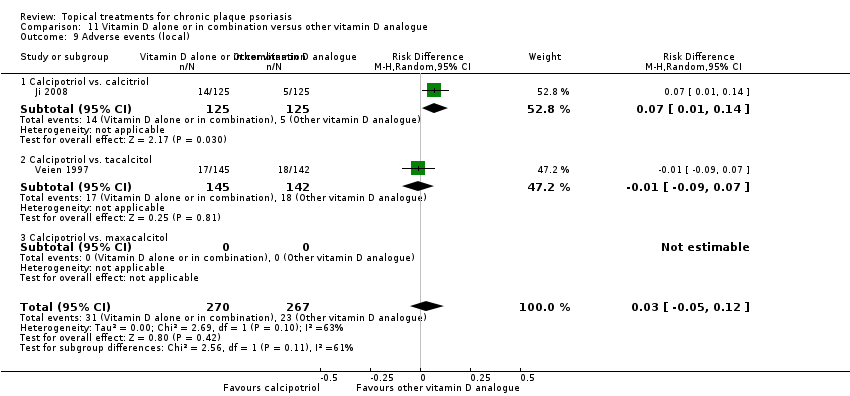
Comparison 11 Vitamin D alone or in combination versus other vitamin D analogue, Outcome 9 Adverse events (local).
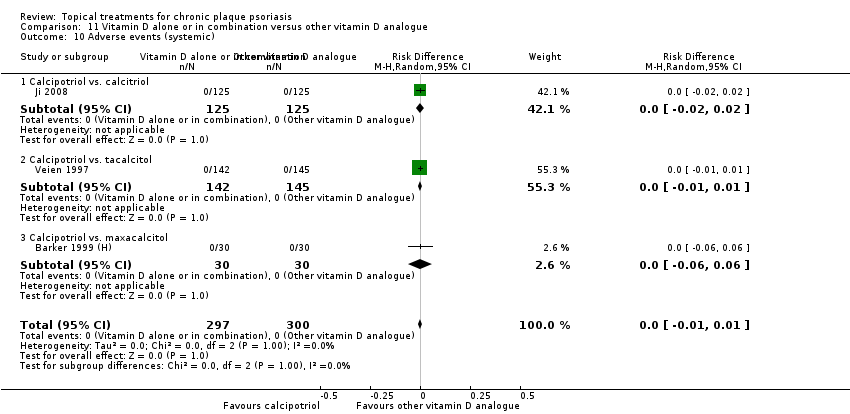
Comparison 11 Vitamin D alone or in combination versus other vitamin D analogue, Outcome 10 Adverse events (systemic).

Comparison 12 Vitamin D alone or in combination versus vitamin D + corticosteroid, Outcome 1 IAGI.

Comparison 12 Vitamin D alone or in combination versus vitamin D + corticosteroid, Outcome 2 TSS.
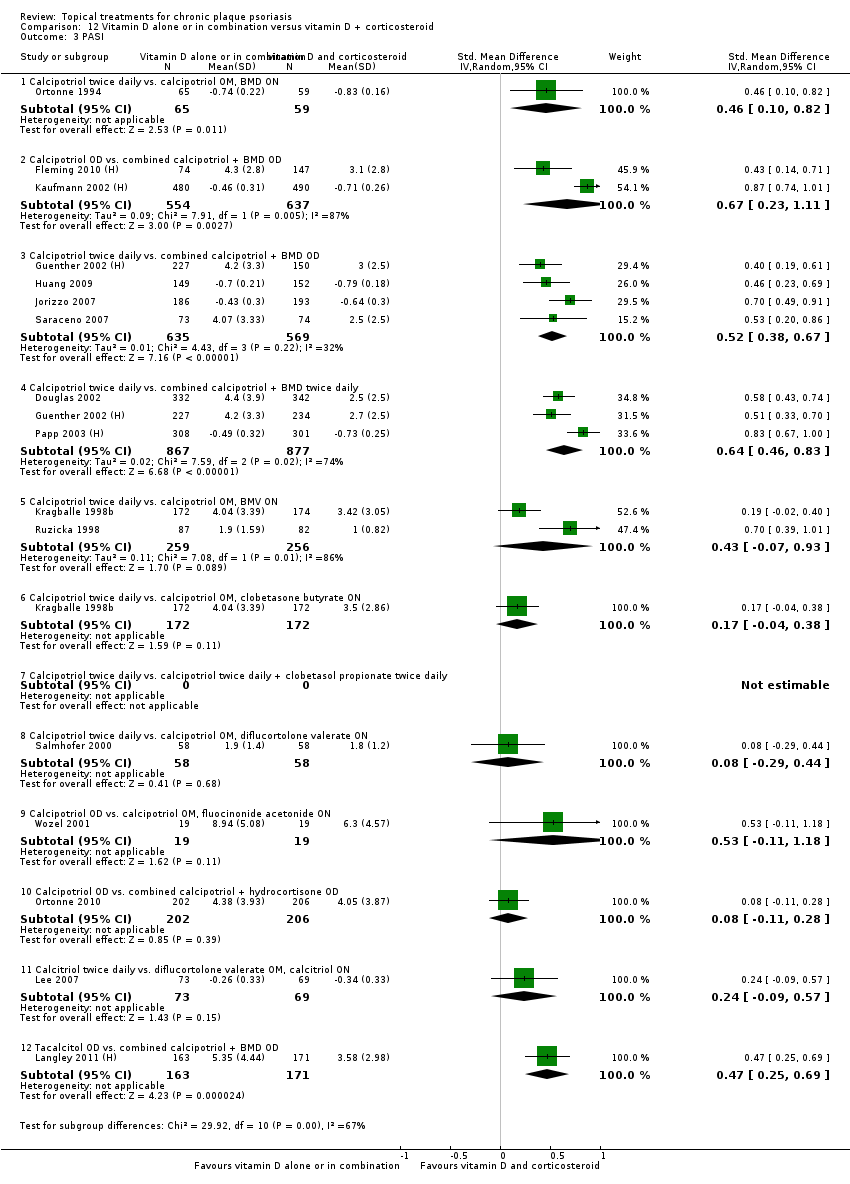
Comparison 12 Vitamin D alone or in combination versus vitamin D + corticosteroid, Outcome 3 PASI.
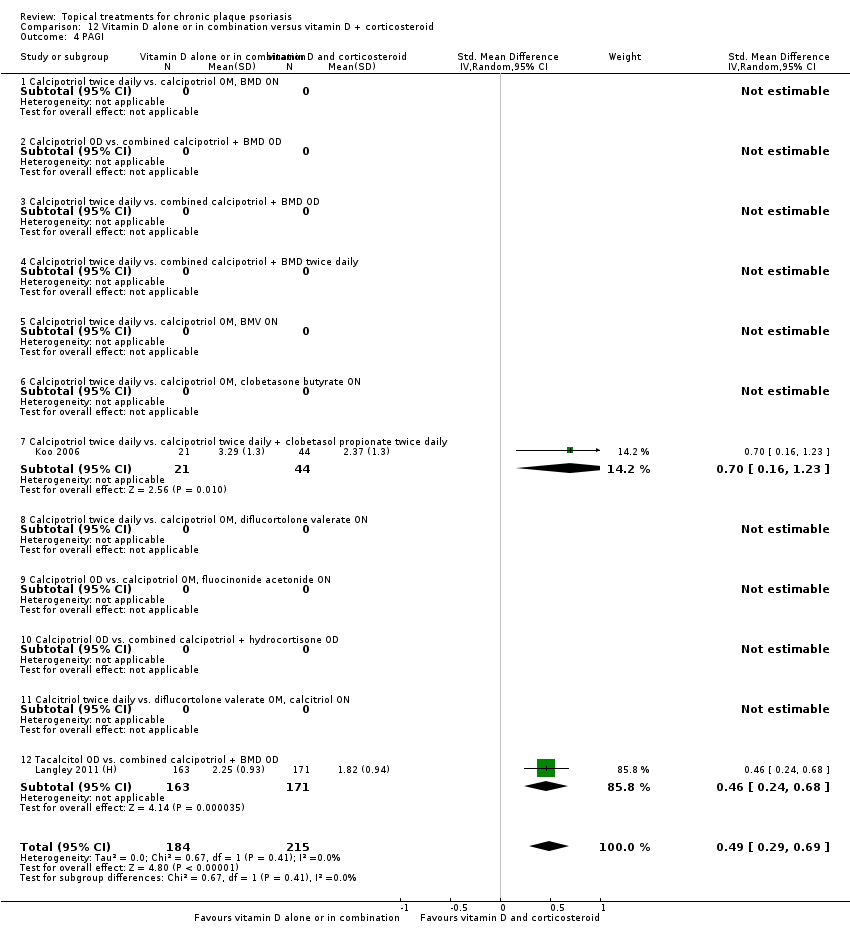
Comparison 12 Vitamin D alone or in combination versus vitamin D + corticosteroid, Outcome 4 PAGI.

Comparison 12 Vitamin D alone or in combination versus vitamin D + corticosteroid, Outcome 5 Combined end point (IAGI/TSS/PASI/PAGI).

Comparison 12 Vitamin D alone or in combination versus vitamin D + corticosteroid, Outcome 6 Total withdrawals.

Comparison 12 Vitamin D alone or in combination versus vitamin D + corticosteroid, Outcome 7 Withdrawals due to adverse events.
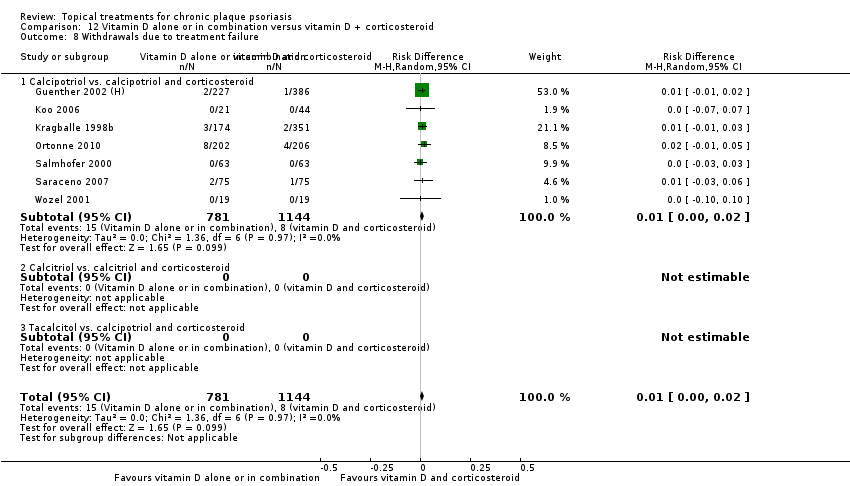
Comparison 12 Vitamin D alone or in combination versus vitamin D + corticosteroid, Outcome 8 Withdrawals due to treatment failure.

Comparison 12 Vitamin D alone or in combination versus vitamin D + corticosteroid, Outcome 9 Adverse events (local).
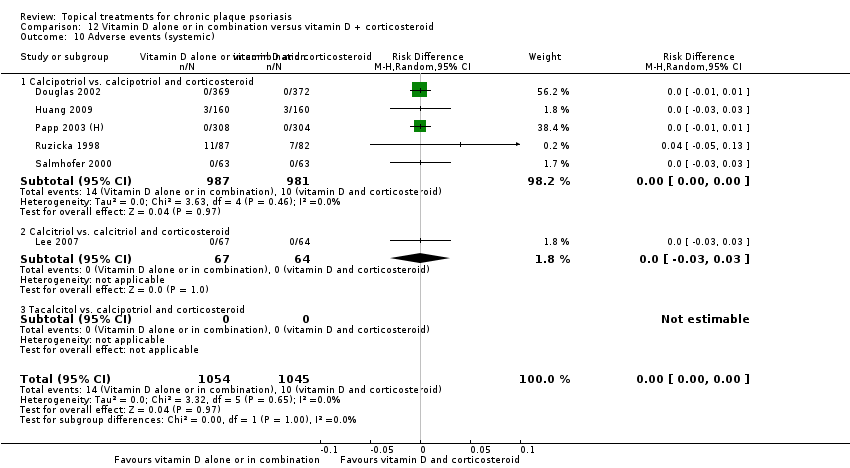
Comparison 12 Vitamin D alone or in combination versus vitamin D + corticosteroid, Outcome 10 Adverse events (systemic).
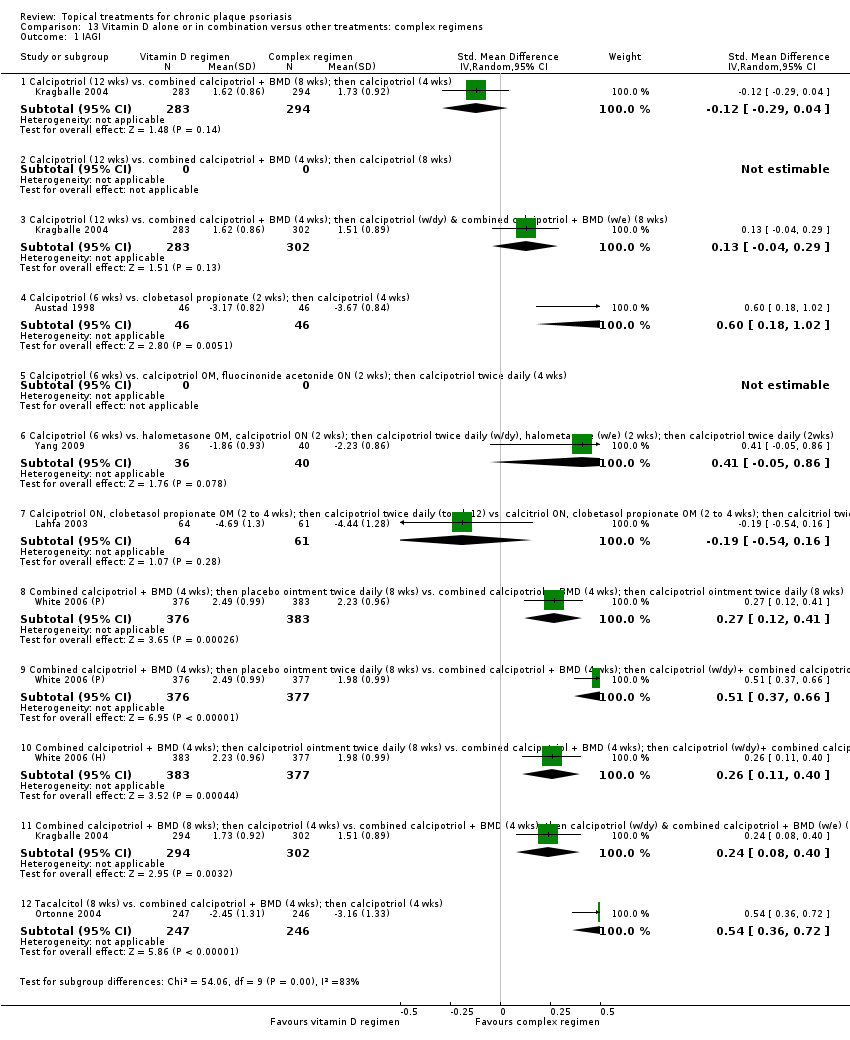
Comparison 13 Vitamin D alone or in combination versus other treatments: complex regimens, Outcome 1 IAGI.

Comparison 13 Vitamin D alone or in combination versus other treatments: complex regimens, Outcome 2 TSS.

Comparison 13 Vitamin D alone or in combination versus other treatments: complex regimens, Outcome 3 PASI.

Comparison 13 Vitamin D alone or in combination versus other treatments: complex regimens, Outcome 4 PAGI.

Comparison 13 Vitamin D alone or in combination versus other treatments: complex regimens, Outcome 5 Combined end point (IAGI/TSS/PASI/PAGI).

Comparison 13 Vitamin D alone or in combination versus other treatments: complex regimens, Outcome 6 Total withdrawals.

Comparison 13 Vitamin D alone or in combination versus other treatments: complex regimens, Outcome 7 Withdrawals due to adverse events.

Comparison 13 Vitamin D alone or in combination versus other treatments: complex regimens, Outcome 8 Withdrawals due to treatment failure.

Comparison 13 Vitamin D alone or in combination versus other treatments: complex regimens, Outcome 9 Adverse events (local).

Comparison 14 Vitamin D alone or in combination versus other treatment: long‐term studies (> 24 wks), Outcome 1 IAGI.

Comparison 14 Vitamin D alone or in combination versus other treatment: long‐term studies (> 24 wks), Outcome 5 Combined end point (IAGI/TSS/PASI/PAGI).

Comparison 14 Vitamin D alone or in combination versus other treatment: long‐term studies (> 24 wks), Outcome 6 Total withdrawals.

Comparison 14 Vitamin D alone or in combination versus other treatment: long‐term studies (> 24 wks), Outcome 7 Withdrawals due to adverse events.

Comparison 14 Vitamin D alone or in combination versus other treatment: long‐term studies (> 24 wks), Outcome 8 Withdrawals due to treatment failure.
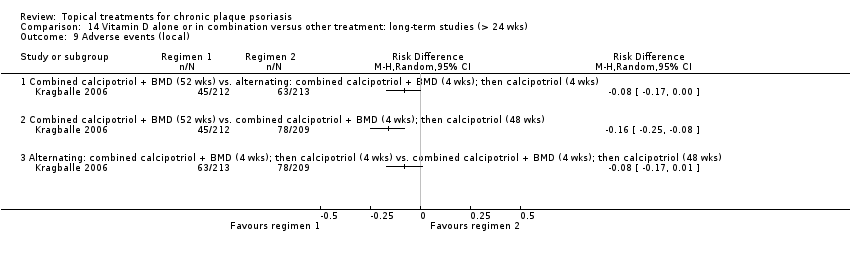
Comparison 14 Vitamin D alone or in combination versus other treatment: long‐term studies (> 24 wks), Outcome 9 Adverse events (local).
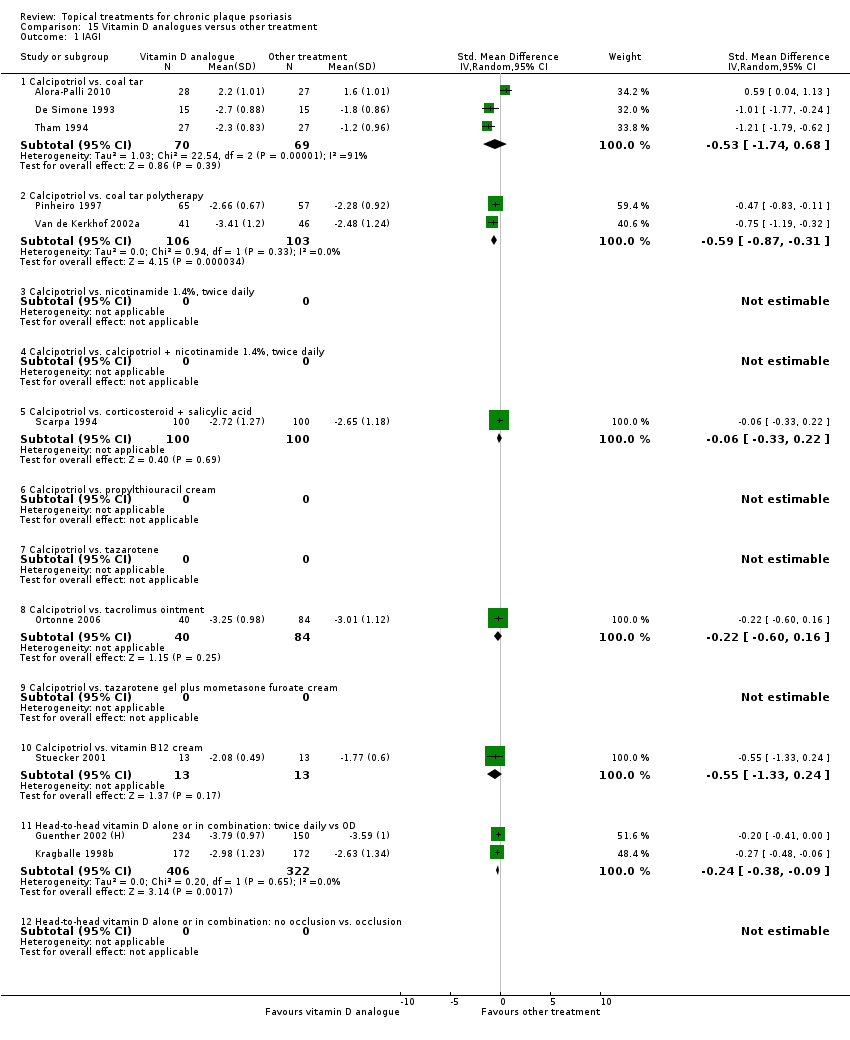
Comparison 15 Vitamin D analogues versus other treatment, Outcome 1 IAGI.
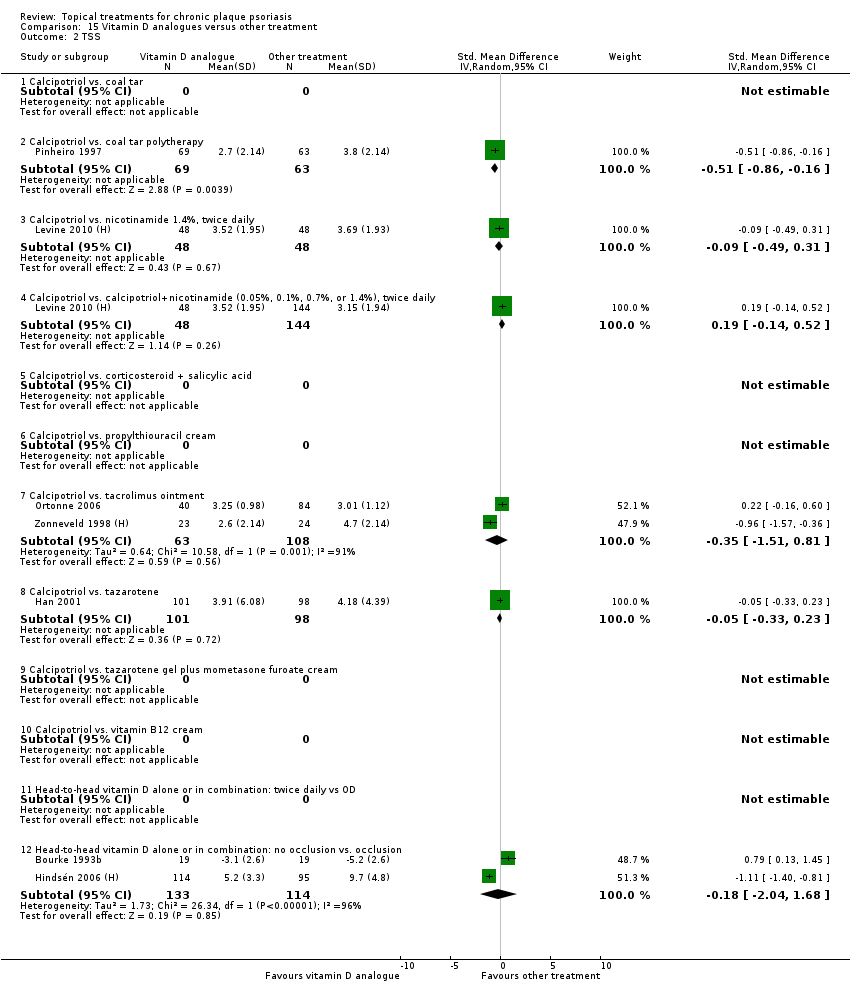
Comparison 15 Vitamin D analogues versus other treatment, Outcome 2 TSS.

Comparison 15 Vitamin D analogues versus other treatment, Outcome 3 PASI.

Comparison 15 Vitamin D analogues versus other treatment, Outcome 4 PAGI.
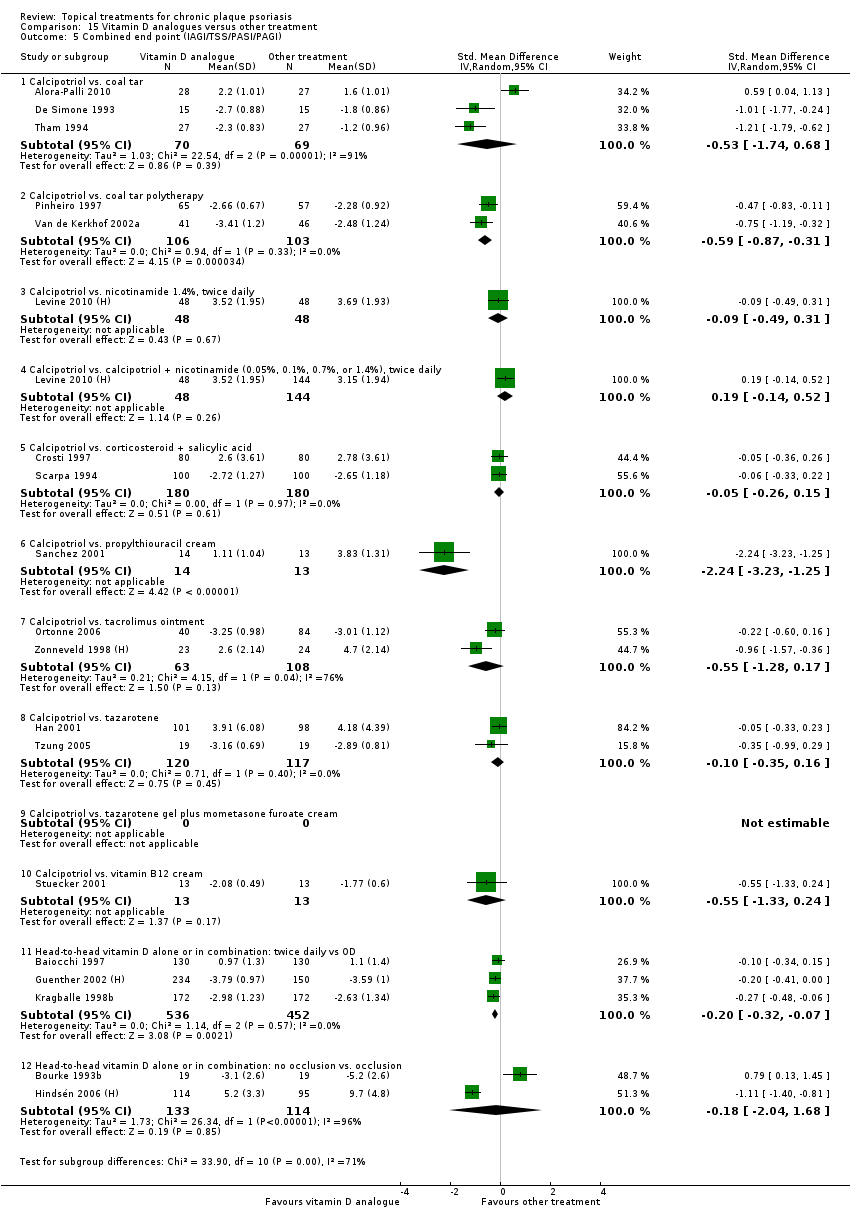
Comparison 15 Vitamin D analogues versus other treatment, Outcome 5 Combined end point (IAGI/TSS/PASI/PAGI).

Comparison 15 Vitamin D analogues versus other treatment, Outcome 6 Total withdrawals.
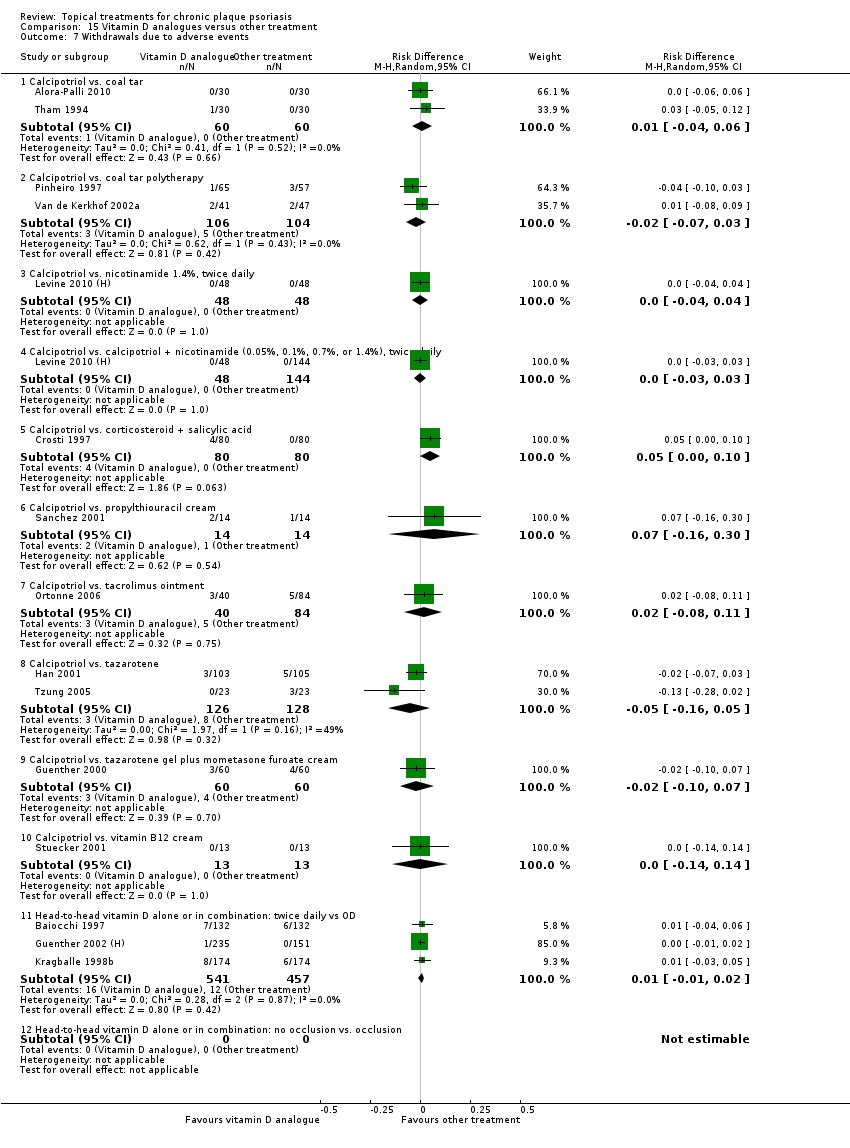
Comparison 15 Vitamin D analogues versus other treatment, Outcome 7 Withdrawals due to adverse events.

Comparison 15 Vitamin D analogues versus other treatment, Outcome 8 Withdrawals due to treatment failure.

Comparison 15 Vitamin D analogues versus other treatment, Outcome 9 Adverse events (local).
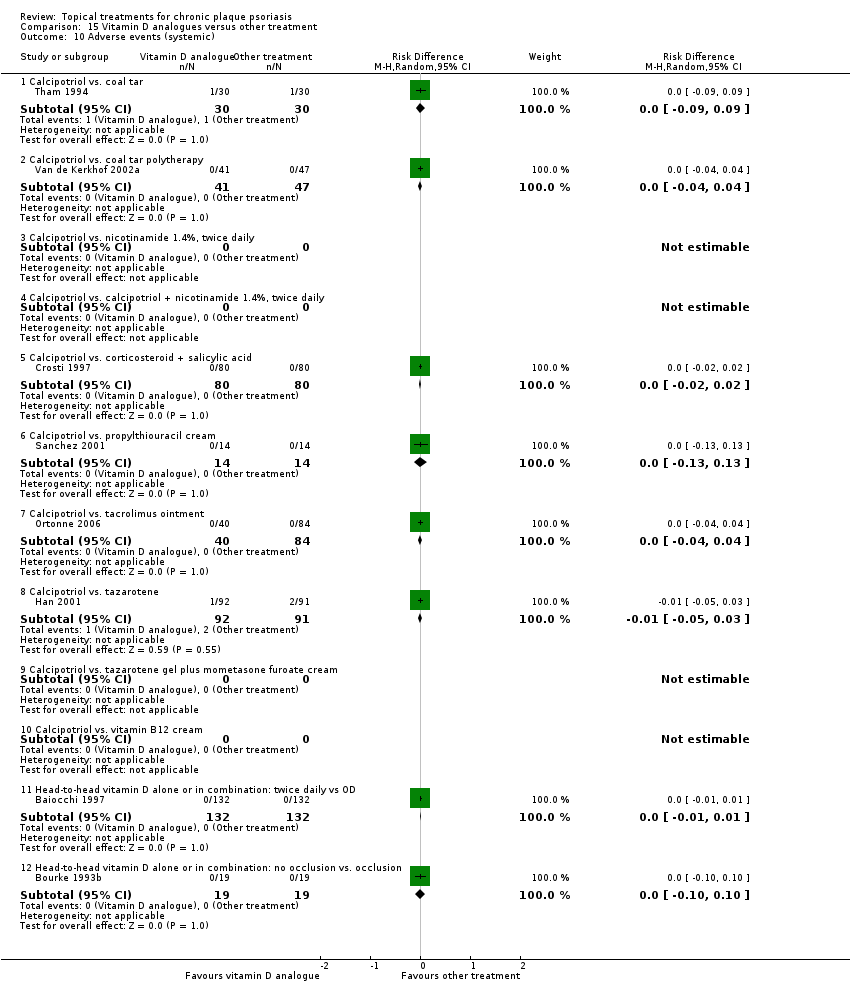
Comparison 15 Vitamin D analogues versus other treatment, Outcome 10 Adverse events (systemic).

Comparison 16 Flexural/facial psoriasis: placebo‐controlled trials, Outcome 1 IAGI.

Comparison 16 Flexural/facial psoriasis: placebo‐controlled trials, Outcome 2 TSS.

Comparison 16 Flexural/facial psoriasis: placebo‐controlled trials, Outcome 3 PASI.

Comparison 16 Flexural/facial psoriasis: placebo‐controlled trials, Outcome 4 PAGI.

Comparison 16 Flexural/facial psoriasis: placebo‐controlled trials, Outcome 5 Combined end point (IAGI/TSS/PASI/PAGI).

Comparison 16 Flexural/facial psoriasis: placebo‐controlled trials, Outcome 6 Total withdrawals.
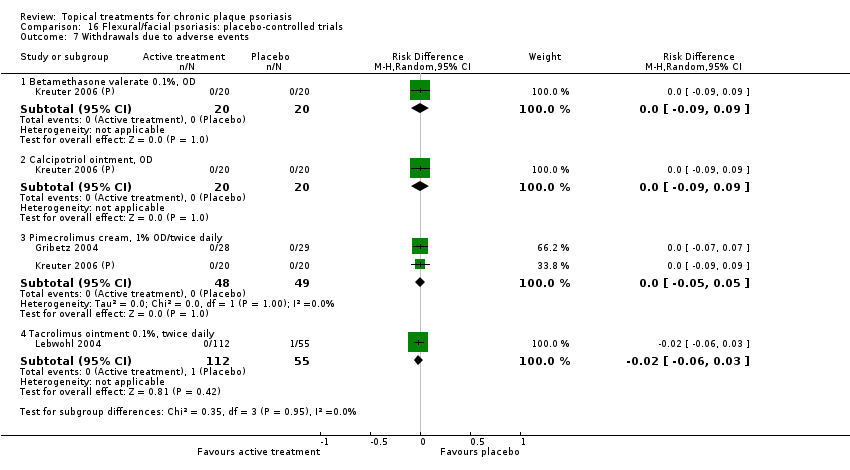
Comparison 16 Flexural/facial psoriasis: placebo‐controlled trials, Outcome 7 Withdrawals due to adverse events.

Comparison 16 Flexural/facial psoriasis: placebo‐controlled trials, Outcome 8 Withdrawals due to treatment failure.
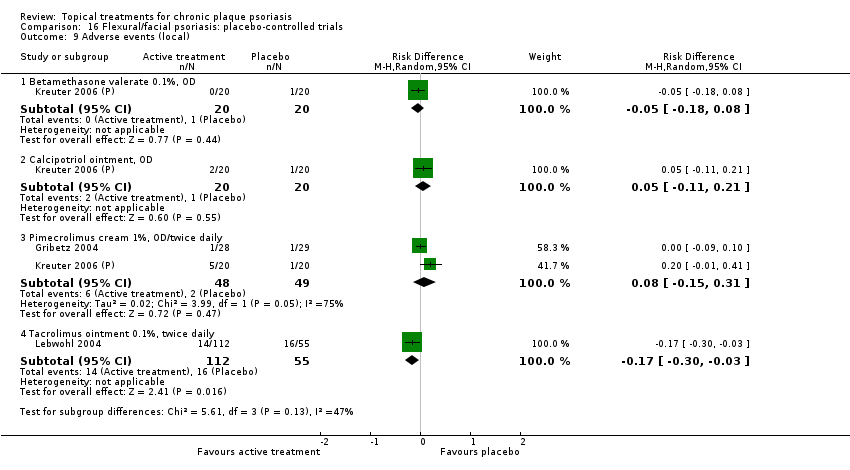
Comparison 16 Flexural/facial psoriasis: placebo‐controlled trials, Outcome 9 Adverse events (local).
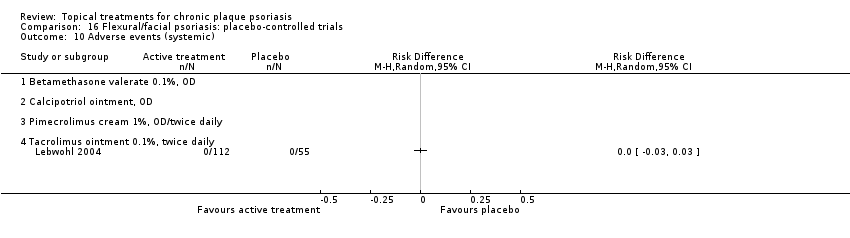
Comparison 16 Flexural/facial psoriasis: placebo‐controlled trials, Outcome 10 Adverse events (systemic).

Comparison 17 Flexural/facial psoriasis: vitamin D alone or in combination versus other treatment, Outcome 1 IAGI.

Comparison 17 Flexural/facial psoriasis: vitamin D alone or in combination versus other treatment, Outcome 2 TSS.

Comparison 17 Flexural/facial psoriasis: vitamin D alone or in combination versus other treatment, Outcome 3 PASI.

Comparison 17 Flexural/facial psoriasis: vitamin D alone or in combination versus other treatment, Outcome 5 Combined end point (IAGI/TSS/PASI/PAGI).
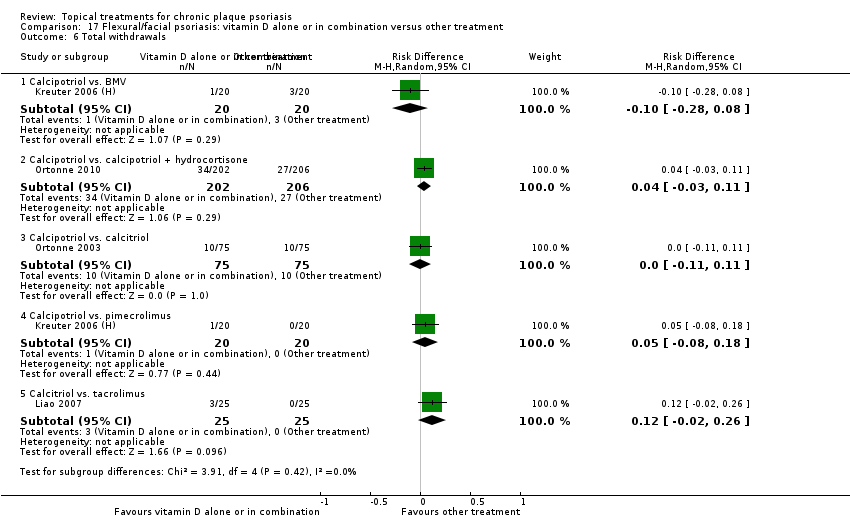
Comparison 17 Flexural/facial psoriasis: vitamin D alone or in combination versus other treatment, Outcome 6 Total withdrawals.
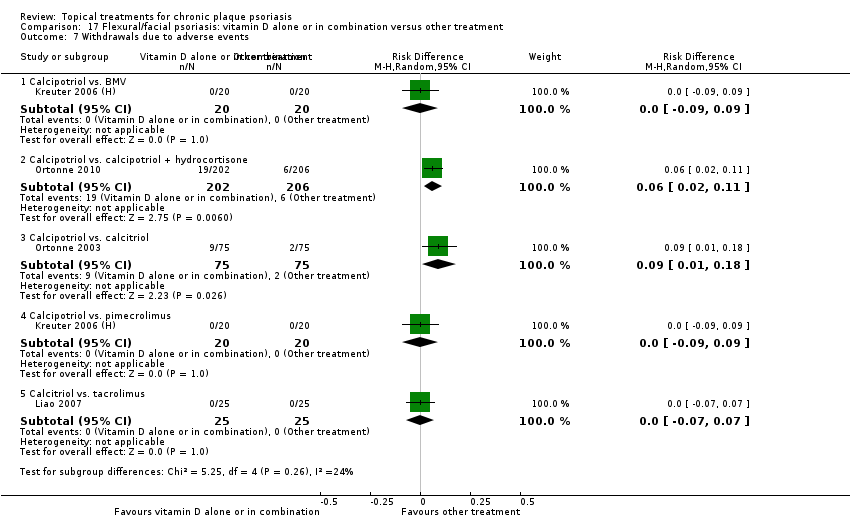
Comparison 17 Flexural/facial psoriasis: vitamin D alone or in combination versus other treatment, Outcome 7 Withdrawals due to adverse events.

Comparison 17 Flexural/facial psoriasis: vitamin D alone or in combination versus other treatment, Outcome 8 Withdrawals due to treatment failure.
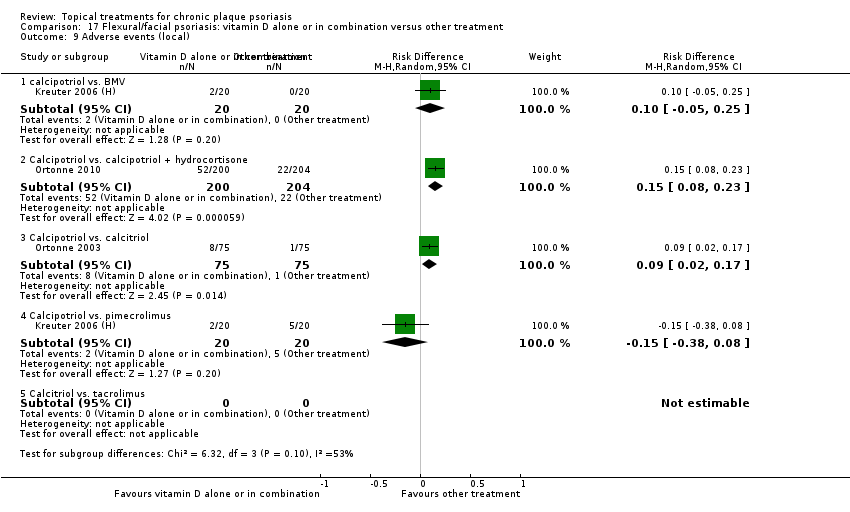
Comparison 17 Flexural/facial psoriasis: vitamin D alone or in combination versus other treatment, Outcome 9 Adverse events (local).

Comparison 18 Scalp psoriasis: placebo‐controlled trials, Outcome 1 IAGI.
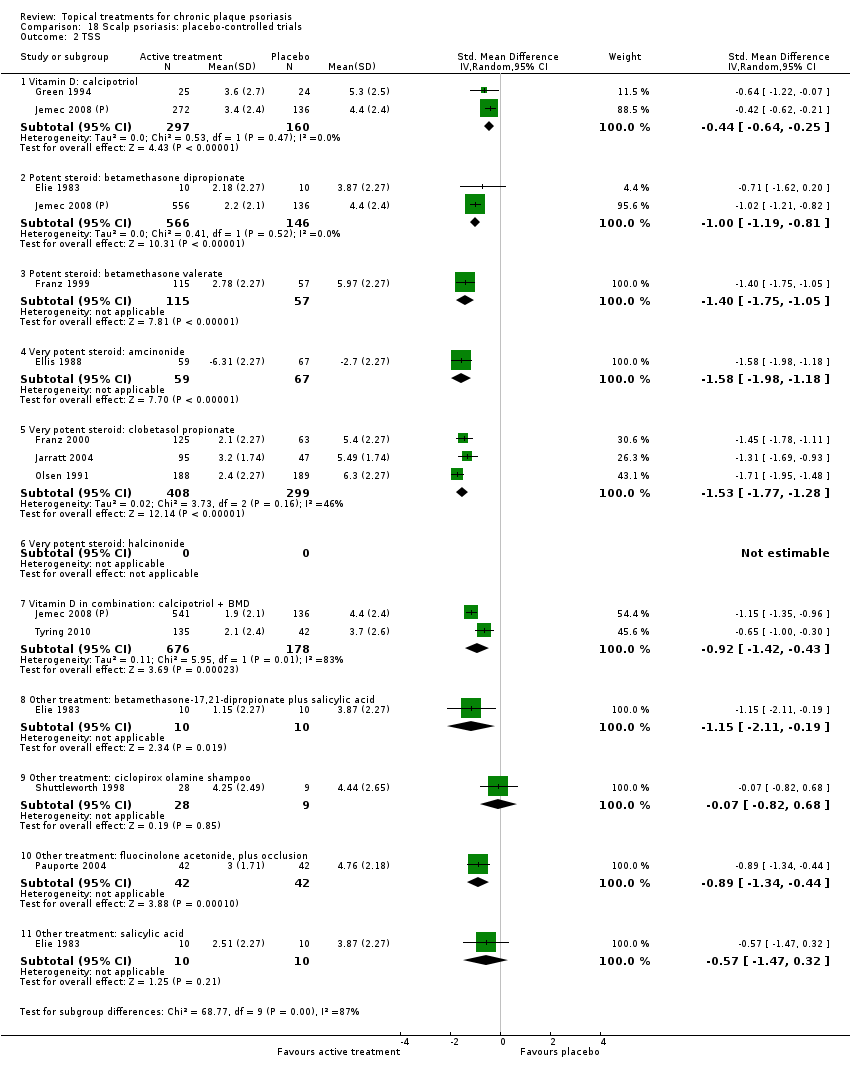
Comparison 18 Scalp psoriasis: placebo‐controlled trials, Outcome 2 TSS.

Comparison 18 Scalp psoriasis: placebo‐controlled trials, Outcome 4 PAGI.

Comparison 18 Scalp psoriasis: placebo‐controlled trials, Outcome 5 Combined end point (IAGI/TSS/PASI/PAGI).

Comparison 18 Scalp psoriasis: placebo‐controlled trials, Outcome 6 Total withdrawals.
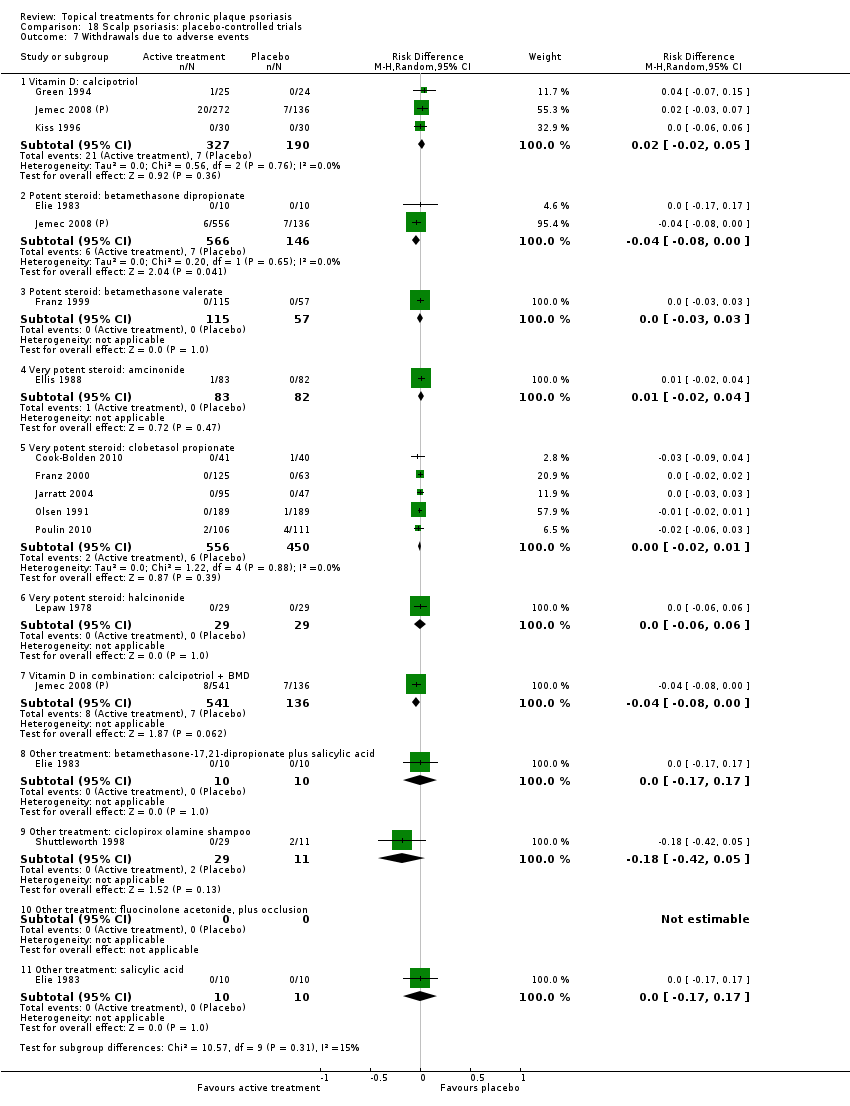
Comparison 18 Scalp psoriasis: placebo‐controlled trials, Outcome 7 Withdrawals due to adverse events.
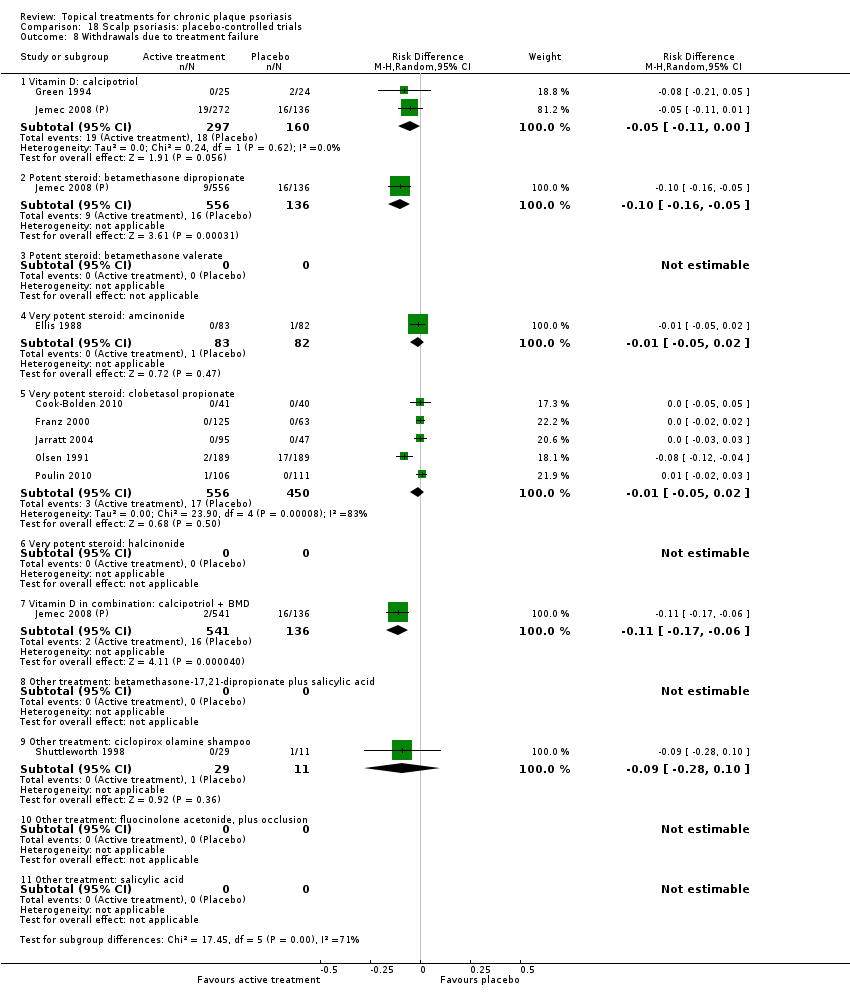
Comparison 18 Scalp psoriasis: placebo‐controlled trials, Outcome 8 Withdrawals due to treatment failure.

Comparison 18 Scalp psoriasis: placebo‐controlled trials, Outcome 9 Adverse events (local).

Comparison 18 Scalp psoriasis: placebo‐controlled trials, Outcome 10 Adverse events (systemic).

Comparison 19 Scalp psoriasis: vitamin D alone or in combination versus other treatments, Outcome 1 IAGI.

Comparison 19 Scalp psoriasis: vitamin D alone or in combination versus other treatments, Outcome 2 TSS.

Comparison 19 Scalp psoriasis: vitamin D alone or in combination versus other treatments, Outcome 4 PAGI.

Comparison 19 Scalp psoriasis: vitamin D alone or in combination versus other treatments, Outcome 5 Combined end point (IAGI/TSS/PASI/PAGI).
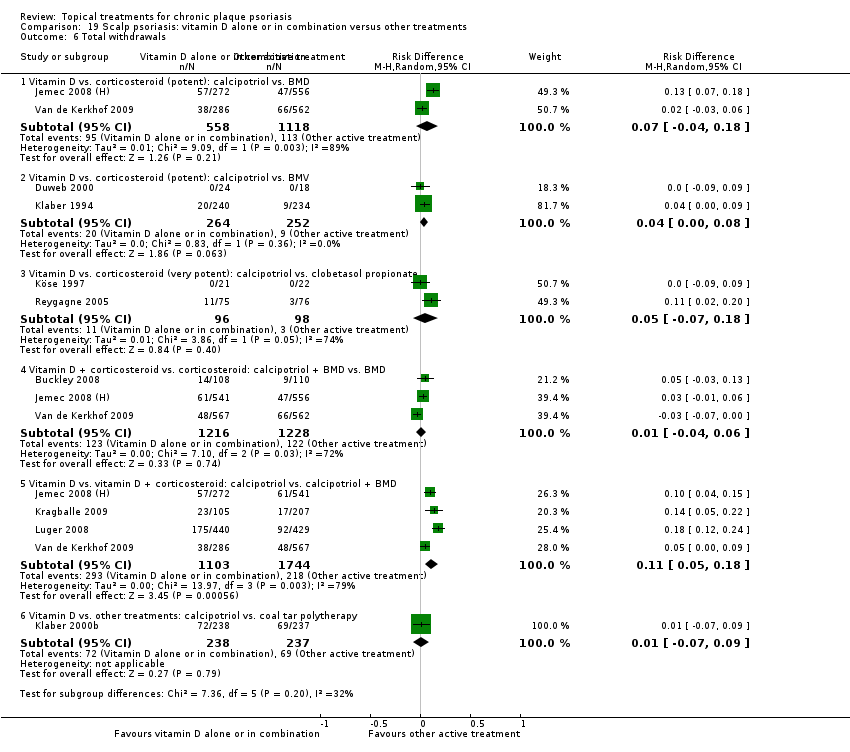
Comparison 19 Scalp psoriasis: vitamin D alone or in combination versus other treatments, Outcome 6 Total withdrawals.

Comparison 19 Scalp psoriasis: vitamin D alone or in combination versus other treatments, Outcome 7 Withdrawals due to adverse events.

Comparison 19 Scalp psoriasis: vitamin D alone or in combination versus other treatments, Outcome 8 Withdrawals due to treatment failure.

Comparison 19 Scalp psoriasis: vitamin D alone or in combination versus other treatments, Outcome 9 Adverse events (local).

Comparison 19 Scalp psoriasis: vitamin D alone or in combination versus other treatments, Outcome 10 Adverse events (systemic).
| Acronym | Full name |
| BC | baseline comparability demonstrated (clinical/demographic) |
| BD | twice daily |
| BMD | betamethasone dipropionate |
| BMV | betamethasone valerate |
| BSA | Body Surface Area |
| Btw‐patient | Between‐patient |
| CI | confidence interval |
| dys | days |
| EQ‐5D | EuroQOL |
| FU | follow up (includes treatment period) |
| I² | heterogeneity statistic |
| IAGI | Investigator Assessment of Global Improvement (change score) |
| IGA | Investigator Global Assessment (static score) |
| IQR | interquartile range |
| ISGA | Investigator's Static Global Assessment Score |
| LAE | local adverse effects |
| LCD | liquor carbonis distillate |
| LF | loss to follow up (per cent of participants randomised, not contributing to primary outcome measure) |
| MEMS | Medication Event Monitoring System |
| mPASI | modified Psoriasis Area Severity Index |
| NA | not available/not applicable |
| NR | not reported |
| OD | once daily |
| OM | once in the morning |
| ON | once at night |
| ODS | overall disease severity |
| PAGI | Patient Assessment of Global Improvement (change score) |
| PASI | Psoriasis Area Severity Index |
| PDI | Psoriasis Disability Index |
| PGA | Patient Global Assessment (static score) |
| PMAQ‐3w | Medication Adherence Questionnaire, version 3W |
| pt | point |
| QOL | quality of life |
| RD | risk difference |
| SD | standard deviation |
| SMD | standardised mean difference |
| TCP | two‐compound product |
| TD | three times daily |
| TLPSS | Total Local Psoriasis Severity Score |
| TSS | Total Severity Score/total sum score |
| UV | ultra violet |
| VDRE | Vitamin D‐Responsive Element |
| wks | weeks |
| yrs | years |
| Outcome | Acronym | Construct | Scale, minimum | Scale, maximum | Notes |
| * Investigator's Assessment of Overall Global Improvement | IAGI | Improvement from baseline variably defined. Common taxonomy ranges from worse to cleared | 4‐pt | 7‐pt | Calculated means and standard deviations by assigning zero to 'worse' (or equivalent). Higher scores indicate greater improvement |
| Investigator's Global Assessment of Disease Severity | IGA | Static equivalent of the IAGI | 4‐pt | 7‐pt | Calculated means and standard deviations by assigning zero to 'clear' (or equivalent). Higher scores indicate more severe disease |
| Total Severity Score | TSS | Redness (erythema), thickness (infiltration) and scaling (sometimes also itching (pruritis)) of target plaque(s). Scored separately then summed | 0 to 3 | 0 to 24 | Also known as the Local Psoriasis Severity Index or the Total Sum Score. Higher scores indicate more severe disease |
| Psoriasis Area and Severity Index | PASI | Redness, thickness, and scaliness of the lesions (each graded on a 0 to 4 scale), weighted by the area of involvement (0 to 6) and summed | 0 to 68 (without head) | 0 to 72 (including head) | Higher scores indicate more severe disease |
| * Patient's Assessment of Overall Global Improvement | PAGI | Assessed as IAGI | 4‐pt | 7‐pt | Less often reported than IAGI. Majority of included trials use 5‐pt scale |
| Patient's Global Assessment of Disease Severity | PGA | Assessed as IGA | 4‐pt | 5‐pt | Rarely reported (5/177 studies) |
| * IAGI/PAGI data are entered as a negative values; thus, a reduction denotes a positive improvement for the active treatment consistent with TSS and PASI measures. | |||||
| Type of study/score | Placebo IAGI (change)/IGA (end point) | Placebo TSS | Placebo PASI | Placebo PAGI (change)/PGA (end point) | H2H IAGI (change)/IGA (end point) | H2H TSS | H2H PASI | H2H PAGI (change)/PGA (end point) |
| Between‐patient (end point) | 0.93 | 1.33 | 3.76 | 1.13 | 1.01 | 1.65 | 3.61 | 1.12 |
| Within‐patient (end point) | 1.08 | 1.49 | 7.17 | NA | NA | 1.50 | 2.58 | NA |
| Between‐patient (change) | 1.17 | 1.52 | 5.75 | 1.31 | 1.10 | 1.73 | 7.85 | 1.20 |
| Within‐patient (change) | 1.02 | 1.58 | NA | 1.53 | 0.96 | 1.94 | NA | 0.83 |
| Within‐patient (% change) | NA | 0.18 | NA | NA | NA | NA | NA | NA |
| Between‐patient (% change) | NA | NA | 0.37 | NA | NA | 0.13 | 0.33 | NA |
| Scalp between‐patient (end point) | 1.08 | 1.74 | NA | 1.06 | 1.06 | 1.94 | NA | 1.18 |
| Scalp within‐patient (end point) | 1.33 | NA | NA | NA | NA | NA | NA | NA |
| Scalp between‐patient (change) | 1.20 | NA | NA | 1.28 | 1.30 | 1.75 | NA | 1.20 |
| Scalp between‐patient (% change) | NA | NA | NA | NA | NA | 0.25 | NA | NA |
| NA: not available; H2H: head‐to‐head; IGA [PGA]: Investigator [Patient] Global Assessment of Disease Severity; IAGI [PAGI]: Investigator (patient) Assessment of Global Improvement; TSS: Total Severity Score; PASI: Psoriasis Area and Severity Index | ||||||||
| Comparison No. | Comparison Label | No. studies | Per cent studies with | No. |
| 01 | Vitamin D analogues vs. placebo | 30 | 60% | 4986 |
| 02 | Corticosteroid (potent) vs. placebo | 13 | 85% | 2216 |
| 03 | Corticosteroid (very potent) vs. placebo | 10 | 70% | 1264 |
| 04 | Dithranol vs. placebo | 3 | 0% | 47 |
| 05 | Vitamin D combination products vs. placebo | 5 | 100% | 2058 |
| 06 | Other treatment vs. placebo | 26 | 46% | 1450 |
| 07 | Vitamin D analogues vs. corticosteroid (potent) | 14 | 64% | 3542 |
| 08 | Vitamin D analogues vs. corticosteroid (very potent) | 2 | 100% | 82 |
| 09 | Vitamin D combined with corticosteroid vs. corticosteroid | 5 | 100% | 2113 |
| 10 | Vitamin D alone or in combination vs. dithranol | 8 | 88% | 1284 |
| 11 | Vitamin D alone or in combination vs. other vitamin D analogue | 4 | 75% | 513 |
| 12 | Vitamin D alone or in combination vs. vitamin D + corticosteroid | 17 | 94% | 5856 |
| 13 | Vitamin D alone or in combination vs. other treatments: complex regimens | 9 | 89% | 2936 |
| 14 | Vitamin D alone or in combination vs. other treatment: long‐term studies (> 24 wks) | 1 | 100% | 297 |
| 15 | Vitamin D analogues vs. other treatment | 19 | 68% | 2364 |
| 16 | Flexural/facial psoriasis: placebo‐controlled trials | 2 | 100% | 122 |
| 17 | Flexural/facial psoriasis: vitamin D alone or in combination vs. other treatment | 4 | 75% | 588 |
| 18 | Scalp psoriasis: placebo‐controlled trials | 14 | 93% | 3011 |
| 19 | Scalp psoriasis: vitamin D alone or in combination vs. other treatments | 12 | 100% | 5413 |
| Subcategory | Measure | 01 IAGI/IGA | 02 TSS | 03 PASI | 04 PAGI/PGA | 05 Combined end point |
| 01 Calcipotriol OD/BD | Effect size [CI] | (SMD ‐0.93; 95% CI ‐1.17 to ‐0.68) | (SMD ‐1.15; 95% CI ‐1.41 to ‐0.89) | (SMD ‐0.65; 95% CI ‐0.75 to ‐0.55) | (SMD ‐0.64; 95% CI ‐0.97 to ‐0.30) | (SMD ‐0.96; 95% CI ‐1.15 to ‐0.77) |
| 02 Calcipotriol plus occlusion | Effect size [CI] | NA | (SMD ‐0.15; 95% CI ‐0.44 to 0.14) | ‐ | ‐ | (SMD ‐0.15; 95% CI ‐0.44 to 0.14) |
| 03 Calcitriol OD/BD | Effect size [CI] | (SMD ‐1.03; 95% CI ‐1.71 to ‐0.36) | (SMD ‐1.22; 95% CI ‐2.38 to ‐0.07) | ‐ | (SMD ‐0.59; 95% CI ‐0.76 to ‐0.41) | (SMD ‐0.92; 95% CI ‐1.54 to ‐0.29) |
| 04 Tacalcitol OD | Effect size [CI] | (SMD ‐0.84; 95% CI ‐1.41 to ‐0.26) | (SMD ‐0.66; 95% CI ‐0.95 to ‐0.36) | (SMD ‐0.27; 95% CI ‐0.56 to 0.03) | (SMD ‐0.24; 95% CI ‐0.53 to 0.05) | (SMD ‐0.73; 95% CI ‐1.09 to ‐0.37) |
| 05 Maxacalcitol OD | Effect size [CI] | (SMD ‐1.43; 95% CI ‐1.91 to ‐0.96) | (SMD ‐1.61; 95% CI ‐2.10 to ‐1.12) | ‐ | ‐ | (SMD ‐1.43; 95% CI ‐1.91 to ‐0.96) |
| 06 Paricalcitol OD | Effect size [CI] | (SMD ‐1.66; 95% CI ‐2.66 to ‐0.67) | (SMD ‐2.15; 95% CI ‐3.24 to ‐1.06) | ‐ | ‐ | (SMD ‐1.66; 95% CI ‐2.66 to ‐0.67) |
| 07 Becocalcidiol OD | Effect size [CI] | (SMD ‐0.22; 95% CI ‐0.58 to 0.14) | (SMD ‐0.02; 95% CI ‐0.37 to 0.34) | ‐ | ‐ | (SMD ‐0.22; 95% CI ‐0.58 to 0.14) |
| 08 Becocalcidiol BD | Effect size [CI] | (SMD ‐0.67; 95% CI ‐1.04 to ‐0.30) | (SMD ‐0.46; 95% CI ‐0.83 to ‐0.10) | ‐ | ‐ | (SMD ‐0.67; 95% CI ‐1.04 to ‐0.30) |
| All treatments | Effect size [CI]; I² statistic | (SMD ‐0.95; 95% CI ‐1.17 to ‐0.74): I² statistic: 89.0% | (SMD ‐1.04; 95% CI ‐1.33 to ‐0.74) I² statistic: 93.0% | (SMD ‐0.58; 95% CI ‐0.71 to ‐0.45): I² statistic: 42.3% | (SMD ‐0.54; 95% CI ‐0.72 to ‐0.36): I² statistic: 55.5% | (SMD ‐0.90; 95% CI ‐1.07 to ‐0.72); I² statistic: 87.5% |
| ‐ | No. participants | 3771 | 2647 | 2357 | 1467 | 4986 |
| ‐ | Between‐patient design | 13 | 9 | 8 | 5 | 18 |
| ‐ | Within‐patient design | 7 | 10 | 1 | 0 | 12 |
| ‐ | Treatment duration | 4 wks to 12 wks | 4 wks to 12 wks | 3 wks to 8 wks | 8 wks to 8 wks | 3 wks to 12 wks |
| Sensitivity analyses | Within‐patient trials | ‐ | ‐ | ‐ | ‐ | (SMD ‐1.11; 95% CI ‐1.58 to ‐0.64) |
| ‐ | Between‐patient trials | ‐ | ‐ | ‐ | ‐ | (SMD ‐0.80; 95% CI ‐0.96 to ‐0.63) |
| ‐ | Calcitriol, Perez 1996 removed | ‐ | ‐ | ‐ | (SMD ‐0.60; 95% CI ‐0.78 to ‐0.41) | |
| ‐ | Calcipotriol BD | ‐ | ‐ | ‐ | ‐ | (SMD ‐1.02; 95% CI ‐1.23 to ‐0.82) |
| ‐ | Calcipotriol OD | ‐ | ‐ | ‐ | ‐ | (SMD ‐0.76; 95% CI ‐1.13 to ‐0.40) |
| ‐ | correlation coefficient (rho) = 0 All trials | ‐ | ‐ | ‐ | ‐ | (SMD ‐0.85; 95% CI ‐1.00 to ‐0.71); |
| ‐ | rho = 0 Btw‐patient trials rho = 0.25 Within‐patient trials | ‐ | ‐ | ‐ | ‐ | (SMD ‐0.87; 95% CI ‐1.01 to ‐0.72); |
| ‐ | rho = 0 Btw‐patient trials rho = 0.50 Within‐patient trials | ‐ | ‐ | ‐ | ‐ | (SMD ‐0.88; 95% CI ‐1.03 to ‐0.73); |
| ‐ | rho = 0 Btw‐patient trials rho = 0.75 Within‐patient trials | ‐ | ‐ | ‐ | ‐ | (SMD ‐0.91; 95% CI ‐1.07 to ‐0.75); |
| For acronyms, see Table 1. | ||||||
| Subcategory | Measure | 01 IAGI/IGA | 02 TSS | 03 PASI | 04 PAGI/PGA | 05 Combined end point |
| 01 Betamethasone dipropionate OD | Effect size [CI] | (SMD ‐0.81; 95% CI ‐0.98 to ‐0.64) | (SMD ‐0.74; 95% CI ‐1.16 to ‐0.32) | (SMD ‐0.79; 95% CI ‐1.44 to ‐0.14) | ‐ | (SMD ‐0.80; 95% CI ‐0.96 to ‐0.64) |
| 02 Betamethasone dipropionate BD | Effect size [CI] | (SMD ‐1.35; 95% CI ‐1.56 to ‐1.15) | (SMD ‐0.77; 95% CI ‐1.48 to ‐0.06) | (SMD ‐1.21; 95% CI ‐1.44 to ‐0.97) | ‐ | (SMD ‐1.35; 95% CI ‐1.56 to ‐1.15) |
| 03 Betamethasone dipropionate, maintenance | Effect size [CI] | (SMD ‐0.95; 95% CI ‐1.62 to ‐0.27) | ‐ | ‐ | (SMD ‐0.95; 95% CI ‐1.62 to ‐0.27) | |
| 04 Betamethasone valerate | Effect size [CI] | (SMD ‐1.41; 95% CI ‐1.92 to ‐0.90) | (SMD ‐1.09; 95% CI ‐2.00 to ‐0.18) | ‐ | ‐ | (SMD ‐1.33; 95% CI ‐1.78 to ‐0.89) |
| 05 Budesonide | Effect size [CI] | ‐ | ‐ | ‐ | ‐ | ‐ |
| 06 Desonide | Effect size [CI] | (SMD ‐0.81; 95% CI ‐1.34 to ‐0.28) | (SMD ‐1.16; 95% CI ‐1.70 to ‐0.61) | ‐ | ‐ | (SMD ‐0.81; 95% CI ‐1.34 to ‐0.28) |
| 07 Diflorasone diacetate | Effect size [CI] | ‐ | (SMD ‐0.32; 95% CI ‐0.73 to 0.09) | ‐ | ‐ | (SMD ‐0.32; 95% CI ‐0.73 to 0.09) |
| 08 Fluticasone propionate | Effect size [CI] | (SMD ‐0.93; 95% CI ‐1.14 to ‐0.72) | ‐ | ‐ | ‐ | (SMD ‐0.93; 95% CI ‐1.14 to ‐0.72) |
| 09 Hydrocortisone buteprate | Effect size [CI] | ‐ | (SMD ‐0.46; 95% CI ‐0.77 to ‐0.15) | ‐ | ‐ | (SMD ‐0.46; 95% CI ‐0.77 to ‐0.15) |
| 10 Mometasone furoate | Effect size [CI] | (SMD ‐0.75; 95% CI ‐1.17 to ‐0.34) | (SMD ‐1.12; 95% CI ‐1.55 to ‐0.68) | ‐ | ‐ | (SMD ‐0.75; 95% CI ‐1.17 to ‐0.34) |
| All treatments | Effect size [CI]; I² statistic | (SMD ‐1.00; 95% CI ‐1.18 to ‐0.82); I² statistic: 57.6% | (SMD ‐0.77; 95% CI ‐1.01 to ‐0.52); I² statistic: 46.7% | (SMD ‐0.97; 95% CI ‐1.31 to ‐0.62); I² statistic: 79.6% | ‐ | (SMD ‐0.89; 95% CI ‐1.06 to ‐0.72); I² statistic: 65.1% |
| ‐ | No. participants | 1867 | 553 | 1158 | 0 | 2216 |
| ‐ | Between‐patient design | 8 | 6 | 3 | 0 | 11 |
| ‐ | Within‐patient design | 1 | 1 | 0 | 0 | 2 |
| ‐ | Treatment duration | 3 wks to 12 wks | 2 wks to 12 wks | 4 wks to 8 wks | ‐ | 2 wks to 12 wks |
| Sensitivity analyses | Within‐patient trials | ‐ | ‐ | ‐ | ‐ | (SMD ‐1.33; 95% CI ‐1.78 to ‐0.89) |
| ‐ | Between‐patient trials | ‐ | ‐ | ‐ | ‐ | (SMD ‐0.85; 95% CI ‐1.03 to ‐0.67) |
| ‐ | correlation coefficient (rho) = 0 All trials | ‐ | ‐ | ‐ | ‐ | (SMD ‐0.89; 95% CI ‐1.06 to ‐0.72) I² statistic: 77.7% |
| ‐ | rho = 0 Btw‐patient trials rho = 0.25 Within‐patient trials | ‐ | ‐ | ‐ | ‐ | (SMD ‐0.89; 95% CI ‐1.06 to ‐0.72) I² statistic: 78.0% |
| ‐ | rho = 0 Btw‐patient trials rho = 0.50 Within‐patient trials | ‐ | ‐ | ‐ | ‐ | (SMD ‐0.90; 95% CI ‐1.07 to ‐0.73) I² statistic: 78.6% |
| ‐ | rho = 0 Btw‐patient trials rho = 0.75 Within‐patient trials | ‐ | ‐ | ‐ | ‐ | (SMD ‐0.91; 95% CI ‐1.08 to ‐0.74) I² statistic: 80.2% |
| For acronyms, see Table 1. Both within‐patient trials compared betamethasone valerate with placebo. | ||||||
| Subcategory | Measure | 01 IAGI/IGA | 02 TSS | 03 PASI | 04 PAGI/PGA | 05 Combined end point |
| 01 Clobetasol propionate | Effect size [CI] | (SMD ‐1.89; 95% CI ‐2.53 to ‐1.24) | (SMD ‐1.35; 95% CI ‐1.80 to ‐0.89) | ‐ | (SMD ‐1.01; 95% CI ‐1.55 to ‐0.47) | (SMD ‐1.65; 95% CI ‐2.10 to ‐1.20) |
| 02 Halcinonide | Effect size [CI] | ‐ | ‐ | ‐ | ‐ | ‐ |
| 03 Halobetasol | Effect size [CI] | (SMD ‐1.81; 95% CI ‐2.37 to ‐1.24) | ‐ | ‐ | (SMD ‐1.25; 95% CI ‐1.46 to ‐1.04) | (SMD ‐1.36; 95% CI ‐1.65 to ‐1.07) |
| All treatments | Effect size [CI], N, I² | (SMD ‐1.87; 95% CI ‐2.38 to ‐1.36); I² statistic: 78.7% | (SMD ‐1.35; 95% CI ‐1.80 to ‐0.89); I² statistic: 75.3% | ‐ | (SMD ‐1.22; 95% CI ‐1.42 to ‐1.02); I² statistic: 0% | (SMD ‐1.56; 95% CI ‐1.87 to ‐1.26); I² statistic: 81.7% |
| ‐ | No. participants | 515 | 545 | 0 | 283 | 1264 |
| ‐ | Between‐patient design | 4 | 3 | 0 | 1 | 7 |
| ‐ | Within‐patient design | 1 | 0 | 0 | 2 | 3 |
| ‐ | Treatment duration | 2 wks to 4 wks | 2 wks to 4 wks | 2 wks to 2 wks | 2 wks to 4 wks | |
| Sensitivity analyses | Within‐patient trials | ‐ | ‐ | ‐ | ‐ | (SMD ‐1.52; 95% CI ‐2.02 to ‐1.02) |
| ‐ | Between‐patient trials | ‐ | ‐ | ‐ | ‐ | (SMD ‐1.58; 95% CI ‐1.99 to ‐1.17) |
| ‐ | correlation coefficient (rho) = 0 All trials | ‐ | ‐ | ‐ | ‐ | (SMD ‐1.52; 95% CI ‐1.80 to ‐1.24) I² statistic: 81.6% |
| ‐ | rho = 0 Btw‐patient trials rho = 0.25 Within‐patient trials | ‐ | ‐ | ‐ | ‐ | (SMD ‐1.52; 95% CI ‐1.80 to ‐1.25) I² statistic: 82.2% |
| ‐ | rho = 0 Btw‐patient trials rho = 0.50 Within‐patient trials | ‐ | ‐ | ‐ | ‐ | (SMD ‐1.53; 95% CI ‐1.80 to ‐1.26) I² statistic: 83.3% |
| ‐ | rho = 0 Btw‐patient trials rho = 0.75 Within‐patient trials | ‐ | ‐ | ‐ | ‐ | (SMD ‐1.55; 95% CI ‐1.80 to ‐1.29) I² statistic: 85.9% |
| For acronyms, see Table 1. | ||||||
| Subcategory | Measure | 01 IAGI/IGA | 02 TSS | 03 PASI | 04 PAGI/PGA | 05 Combined end point |
| 01 Combination calcipotriol/betamethasone dipropionate, OD | Effect size [CI] | (SMD ‐1.21; 95% CI ‐1.50 to ‐0.91) | ‐ | (SMD ‐1.14; 95% CI ‐1.57 to ‐0.70) | (SMD ‐0.69; 95% CI ‐0.98 to ‐0.40) | (SMD ‐1.21; 95% CI ‐1.50 to ‐0.91) |
| 02 Combination calcipotriol/betamethasone dipropionate, BD | Effect size [CI] | (SMD ‐1.90; 95% CI ‐2.09 to ‐1.71) | ‐ | (SMD ‐1.41; 95% CI ‐1.86 to ‐0.97) | ‐ | (SMD ‐1.90; 95% CI ‐2.09 to ‐1.71) |
| All treatments | Effect size [CI], N, I² statistic | (SMD ‐1.44; 95% CI ‐1.76 to ‐1.12); I² statistic: 89.4% | ‐ | (SMD ‐1.24; 95% CI ‐1.53 to ‐0.95); I² statistic: 87.6% | (SMD ‐0.69; 95% CI ‐0.98 to ‐0.40); I² statistic: NA | (SMD ‐1.44; 95% CI ‐1.76 to ‐1.12); I² statistic: 89.4% |
| ‐ | No. participants | 2058 | 0 | 2056 | 235 | 2058 |
| ‐ | Between‐patient design | 5 | 0 | 5 | 1 | 5 |
| ‐ | Within‐patient design | 0 | 0 | 0 | 0 | 0 |
| ‐ | Treatment duration | 4 wks to 8 wks | ‐ | 4 wks to 8 wks | 8 wks | 4 wks to 8 wks |
| For acronyms, see Table 1. | ||||||
| Subcategory | Measure | 01 IAGI/IGA | 02 TSS | 03 PASI | 04 PAGI/PGA | 05 Combined end point |
| 01 Aloe vera extract | Effect size [CI] | ‐ | ‐ | (SMD ‐1.58; 95% CI ‐2.16 to ‐0.99) | ‐ | (SMD ‐1.58; 95% CI ‐2.16 to ‐0.99) |
| 02 Anti‐IL‐8 monoclonal antibody cream | Effect size [CI] | (SMD ‐0.59; 95% CI ‐1.01 to ‐0.16) | (SMD ‐0.70; 95% CI ‐1.13 to ‐0.27) | ‐ | ‐ | (SMD ‐0.59; 95% CI ‐1.01 to ‐0.16) |
| 03 Betamethasone 17‐valerate 21‐acetate plus tretinoine plus salicylic acid | Effect size [CI] | (SMD ‐0.76; 95% CI ‐1.21 to ‐0.31) | ‐ | (SMD ‐0.54; 95% CI ‐0.99 to ‐0.10) | (SMD ‐0.80; 95% CI ‐1.26 to ‐0.35) | (SMD ‐0.76; 95% CI ‐1.21 to ‐0.31) |
| 04 Caffeine (topical) 10%, TD | Effect size [CI] | ‐ | ‐ | (SMD ‐0.39; 95% CI ‐0.84 to 0.06) | ‐ | (SMD ‐0.39; 95% CI ‐0.84 to 0.06) |
| 05 Calcipotriene 0.005% ointment + nicotinamide 0.05% or 0.1% or 0.7% or 1.4%, BD | Effect size [CI] | ‐ | (SMD ‐0.48; 95% CI ‐0.81 to ‐0.15) | ‐ | ‐ | (SMD ‐0.48; 95% CI ‐0.81 to ‐0.15) |
| 06 Dead sea salts emollient lotion | Effect size [CI] | ‐ | ‐ | (SMD 0.57; 95% CI ‐0.36 to 1.51) | ‐ | (SMD 0.57; 95% CI ‐0.36 to 1.51) |
| 07 Fish oil plus occlusion | Effect size [CI] | ‐ | (SMD ‐1.05; 95% CI ‐1.64 to ‐0.46) | ‐ | ‐ | (SMD ‐1.05; 95% CI ‐1.64 to ‐0.46) |
| 08 Herbal skin care (Dr Michaels® cleansing gel, ointment and skin conditioner), BD | Effect size [CI] | (SMD ‐2.96; 95% CI ‐4.19 to ‐1.74) | ‐ | (SMD ‐2.96; 95% CI ‐4.19 to ‐1.74) | ||
| 09 Hexafluoro‐1,25‐dihydroxyvitamin D3 | Effect size [CI] | (SMD ‐0.62; 95% CI ‐1.35 to 0.12) | (SMD ‐1.13; 95% CI ‐1.91 to ‐0.35) | ‐ | ‐ | (SMD ‐0.62; 95% CI ‐1.35 to 0.12) |
| 10 Indigo naturalis 1.4% ointment | Effect size [CI] | (SMD ‐2.14; 95% CI ‐2.74 to ‐1.53) | (SMD ‐1.64; 95% CI ‐2.13 to ‐1.15) | ‐ | ‐ | (SMD ‐2.09; 95% CI ‐2.62 to ‐1.56) |
| 11 Kukui nut oil, TD | Effect size [CI] | (SMD 0.00; 95% CI ‐0.80 to 0.80) | (SMD 0.33; 95% CI ‐0.48 to 1.14) | (SMD ‐0.03; 95% CI ‐0.84 to 0.77) | (SMD 0.00; 95% CI ‐0.80 to 0.80) | (SMD 0.00; 95% CI ‐0.80 to 0.80) |
| 12 Mahonia aquifolium (Reliéva™), BD | Effect size [CI] | ‐ | ‐ | ‐ | ‐ | (SMD ‐0.77; 95% CI ‐1.06 to ‐0.48) |
| 13 Methotrexate gel | Effect size [CI] | (SMD ‐0.56; 95% CI ‐1.01 to ‐0.12) | (SMD ‐0.48; 95% CI ‐0.92 to ‐0.04) | (SMD ‐1.58; 95% CI ‐2.16 to ‐0.99) | ‐ | (SMD ‐1.05; 95% CI ‐2.04 to ‐0.06) |
| 14 Mycophenolic acid ointment | Effect size [CI] | ‐ | (SMD ‐1.44; 95% CI ‐2.67 to ‐0.22) | ‐ | ‐ | (SMD ‐1.44; 95% CI ‐2.67 to ‐0.22) |
| 15 NG‐monomethyl‐L‐arginine (L‐NMMA) cream | Effect size [CI] | ‐ | (SMD 0.08; 95% CI ‐0.60 to 0.75) | ‐ | ‐ | (SMD 0.08; 95% CI ‐0.60 to 0.75) |
| 16 Nicotinamide 1.4%, BD | Effect size [CI] | ‐ | (SMD ‐0.20; 95% CI ‐0.60 to 0.20) | ‐ | ‐ | (SMD ‐0.20; 95% CI ‐0.60 to 0.20) |
| 17 Oleum horwathiensis | Effect size [CI] | (SMD ‐0.02; 95% CI ‐0.63 to 0.58) | (SMD ‐0.77; 95% CI ‐1.40 to ‐0.14) | ‐ | ‐ | (SMD ‐0.02; 95% CI ‐0.63 to 0.58) |
| 18 Omega‐3‐polyunsaturated fatty acids ointment | Effect size [CI] | ‐ | ‐ | ‐ | ‐ | ‐ |
| 19 Platelet aggregation activating factor (PAF) (Ro 24‐0238) | Effect size [CI] | (SMD ‐0.07; 95% CI ‐0.50 to 0.37) | ‐ | ‐ | (SMD ‐0.07; 95% CI ‐0.50 to 0.37) | |
| 20 Polymyxin B cream, 200,000 U/g | Effect size [CI] | ‐ | (SMD 0.13; 95% CI ‐0.59 to 0.85) | ‐ | ‐ | (SMD 0.13; 95% CI ‐0.59 to 0.85) |
| 21 PTH (1‐34) in Novasome A® liposomal cream, BD | Effect size [CI] | ‐ | (SMD ‐2.31; 95% CI ‐3.26 to ‐1.36) | ‐ | ‐ | (SMD ‐2.31; 95% CI ‐3.26 to ‐1.36) |
| 22 Sirolimus (topical), 2.2% for 6 wks, then 8% for a further 6 wks | Effect size [CI] | ‐ | (SMD ‐0.39; 95% CI ‐0.98 to 0.21) | ‐ | ‐ | (SMD ‐0.39; 95% CI ‐0.98 to 0.21) |
| 23 Tacrolimus ointment | Effect size [CI] | ‐ | (SMD 0.06; 95% CI ‐0.52 to 0.63) | ‐ | ‐ | (SMD 0.06; 95% CI ‐0.52 to 0.63) |
| 24 Tar | Effect size [CI] | ‐ | (SMD ‐0.45; 95% CI ‐1.11 to 0.22) | ‐ | ‐ | (SMD ‐0.45; 95% CI ‐1.11 to 0.22) |
| 25 Tazarotene | Effect size [CI] | ‐ | (SMD ‐0.86; 95% CI ‐1.11 to ‐0.62) | ‐ | ‐ | (SMD ‐0.86; 95% CI ‐1.11 to ‐0.62) |
| 26 Theophylline 1% ointment, BD | Effect size [CI] | ‐ | ‐ | (SMD ‐2.87; 95% CI ‐4.13 to ‐1.62) | ‐ | (SMD ‐2.87; 95% CI ‐4.13 to ‐1.62) |
| All treatments | (not pooled) | ‐ | ‐ | ‐ | ‐ | ‐ |
| ‐ | No. participants | 364 | 907 | 529 | 105 | 1450 |
| ‐ | Between‐patient design | 4 | 5 | 8 | 2 | 12 |
| ‐ | Within‐patient design | 4 | 12 | 1 | 0 | 14 |
| ‐ | Treatment duration | 3 wks to 12 wks | 3 wks to 12 wks | 2 wks to 12 wks | 3 wks to 12 wks | 2 wks to 12 wks |
| For acronyms, see Table 1. | ||||||
| Subcategory | Measure | 01 IAGI/IGA | 02 TSS | 03 PASI | 04 PAGI/PGA | 05 Combined end point |
| 01 Calcipotriol vs. betamethasone dipropionate | Effect size [CI] | (SMD 0.43; 95% CI 0.28 to 0.58) | ‐ | (SMD 0.36; 95% CI 0.22 to 0.51) | ‐ | (SMD 0.43; 95% CI 0.28 to 0.58) |
| 02 Calcipotriol vs. betamethasone valerate | Effect size [CI] | (SMD ‐0.02; 95% CI ‐0.21 to 0.17) | (SMD ‐0.26; 95% CI ‐0.41 to ‐0.11) | (SMD ‐0.12; 95% CI ‐0.22 to ‐0.02) | (SMD ‐0.26; 95% CI ‐0.38 to ‐0.14) | (SMD ‐0.12; 95% CI ‐0.26 to 0.02) |
| 03 Calcipotriol vs. desoxymetasone | Effect size [CI] | ‐ | ‐ | (SMD 0.15; 95% CI ‐0.73 to 1.02) | ‐ | (SMD 0.15; 95% CI ‐0.73 to 1.02) |
| 04 Calcipotriol vs. diflorasone diacetate | Effect size [CI] | (SMD 0.27; 95% CI 0.02 to 0.52) | (SMD 0.40; 95% CI 0.15 to 0.65) | ‐ | ‐ | (SMD 0.27; 95% CI 0.02 to 0.52) |
| 05 Calcipotriol vs. fluocinonide | Effect size [CI] | (SMD ‐0.58; 95% CI ‐0.99 to ‐0.18) | (SMD ‐0.50; 95% CI ‐0.92 to ‐0.07) | ‐ | ‐ | (SMD ‐0.58; 95% CI ‐0.99 to ‐0.18) |
| 06 Calcitriol vs. betamethasone dipropionate | Effect size [CI] | (SMD 0.21; 95% CI ‐0.04 to 0.45) | (SMD 0.27; 95% CI 0.02 to 0.51) | (SMD 0.39; 95% CI 0.14 to 0.63) | ‐ | (SMD 0.21; 95% CI ‐0.04 to 0.45) |
| 07 Calcitriol vs. betamethasone valerate | Effect size [CI] | (SMD ‐0.19; 95% CI ‐0.91 to 0.53) | ‐ | ‐ | ‐ | (SMD ‐0.19; 95% CI ‐0.91 to 0.53) |
| 08 Tacalcitol vs. betamethasone valerate | Effect size [CI] | ‐ | (SMD 0.41; 95% CI 0.09 to 0.74) | ‐ | ‐ | (SMD 0.41; 95% CI 0.09 to 0.74) |
| All treatments | Effect size [CI]; I² statistic | (SMD 0.17; 95% CI ‐0.04 to 0.37); I² statistic: 83.4% | (SMD 0.11; 95% CI ‐0.22 to 0.44); I² statistic: 86.7% | (SMD 0.12; 95% CI ‐0.07 to 0.32); I² statistic: 86.2% | (SMD ‐0.26; 95% CI ‐0.38 to ‐0.14); I² statistic: 0% | (SMD 0.11; 95% CI ‐0.07 to 0.30); I² statistic: 85.6% |
| ‐ | No. participants | 2655 | 891 | 3185 | 738 | 3542 |
| ‐ | Between‐patient design | 7 | 2 | 7 | 1 | 9 |
| ‐ | Within‐patient design | 1 | 4 | 2 | 1 | 5 |
| ‐ | Treatment duration | 3 wks to 8 wks | 3 wks to 6 wks | 4 wks to 8 wks | 6 wks | 3 wks to 8 wks |
| Sensitivity analyses | Within‐patient trials | ‐ | ‐ | ‐ | ‐ | (SMD 0.17; 95% CI ‐0.20 to 0.54) |
| ‐ | Between‐patient trials | ‐ | ‐ | ‐ | ‐ | (SMD 0.10; 95% CI ‐0.11 to 0.31) |
| ‐ | correlation coefficient (rho) = 0 All trials | ‐ | ‐ | ‐ | ‐ | (SMD 0.10; 95% CI ‐0.08 to 0.28); |
| ‐ | rho = 0 Btw‐patient trials rho = 0.25 Within‐patient trials | ‐ | ‐ | ‐ | ‐ | (SMD 0.10; 95% CI ‐0.07 to 0.28) |
| ‐ | rho = 0 Btw‐patient trials rho = 0.50 Within‐patient trials | ‐ | ‐ | ‐ | ‐ | (SMD 0.11; 95% CI ‐0.07 to 0.29) |
| ‐ | rho = 0 Btw‐patient trials rho = 0.75 Within‐patient trials | ‐ | ‐ | ‐ | ‐ | (SMD 0.12; 95% CI ‐0.06 to 0.30) |
| For acronyms, see Table 1. | ||||||
| Subcategory | Measure | 01 IAGI/IGA | 02 TSS | 03 PASI | 04 PAGI/PGA | 05 Combined end point |
| 01 Calcipotriol vs. clobetasol propionate | Effect size [CI] | (SMD 0.19; 95% CI ‐0.42 to 0.80) | ‐ | (SMD ‐0.32; 95% CI ‐0.95 to 0.30) | (SMD 0.42; 95% CI ‐0.20 to 1.03) | (SMD ‐0.06; 95% CI ‐0.57 to 0.44); I² statistic: 25.7% |
| All treatments | No. participants | 42 | 0 | 40 | 42 | 82 |
| ‐ | Between‐patient design | 1 | 0 | 1 | 1 | 2 |
| ‐ | Within‐patient design | 0 | 0 | 0 | 0 | 0 |
| ‐ | Treatment duration | 2 wks | ‐ | 6 wks | 2 wks | 2 wks to 6 wks |
| Subcategory | Measure | 01 IAGI/IGA | 02 TSS | 03 PASI | 04 PAGI/PGA | 05 Combined end point |
| 01 Calcipotriol + betamethasone dipropionate vs. betamethasone dipropionate | Effect size [CI] | (SMD ‐0.40; 95% CI ‐0.52 to ‐0.27) | ‐ | (SMD ‐0.44; 95% CI ‐0.55 to ‐0.33) | ‐ | (SMD ‐0.40; 95% CI ‐0.52 to ‐0.27) |
| 02 Calcipotriol + betamethasone dipropionate vs. clobetasol propionate | Effect size [CI] | ‐ | (SMD 0.45; 95% CI 0.09 to 0.81) | ‐ | ‐ | (SMD 0.45; 95% CI 0.09 to 0.81) |
| 03 Calcipotriol + clobetasol propionate vs. clobetasol propionate | Effect size [CI] | (SMD ‐0.69; 95% CI ‐1.22 to ‐0.15) | ‐ | ‐ | (SMD ‐0.28; 95% CI ‐0.80 to 0.24) | (SMD ‐0.69; 95% CI ‐1.22 to ‐0.15) |
| ‐ | Effect size [CI], I² | (SMD ‐0.41; 95% CI ‐0.53 to ‐0.29); I² statistic: 32.0% | (SMD 0.45; 95% CI 0.09 to 0.81): I² statistic: NA | (SMD ‐0.44; 95% CI ‐0.55 to ‐0.33) I² statistic: 22.4% | (SMD ‐0.28; 95% CI ‐0.80 to 0.24) I² statistic: NA | (SMD ‐0.26; 95% CI ‐0.52 to ‐0.00); I² statistic: 84.4% |
| ‐ | No. participants | 1991 | 122 | 1876 | 65 | 2113 |
| ‐ | Between‐patient design | 4 | 1 | 3 | 1 | 5 |
| ‐ | Within‐patient design | 0 | 0 | 0 | 0 | 0 |
| ‐ | Treatment duration | 2 wks to 8 wks | 4 wks | 4 wks to 8 wks | 2 wks | 2 wks to 8 wks |
| Subcategory | Measure | 01 IAGI/IGA | 02 TSS | 03 PASI | 04 PAGI/PGA | 05 Combined end point |
| 01 Calcipotriol vs. dithranol | Effect size [CI] | (SMD ‐0.43; 95% CI ‐0.85 to ‐0.01) | (SMD ‐0.54; 95% CI ‐1.16 to 0.08) | (SMD 0.73; 95% CI ‐0.55 to 2.00) | (SMD ‐0.05; 95% CI ‐0.90 to 0.80) | (SMD 0.07; 95% CI ‐0.57 to 0.71) |
| 02 Calcitriol vs. dithranol | Effect size [CI] | (SMD 0.51; 95% CI 0.13 to 0.88) | (SMD 0.13; 95% CI ‐0.24 to 0.50) | (SMD ‐0.21; 95% CI ‐0.58 to 0.16) | ‐ | (SMD 0.51; 95% CI 0.13 to 0.88) |
| 03 Tacalcitol vs. dithranol | Effect size [CI] | ‐ | (SMD ‐0.18; 95% CI ‐0.60 to 0.25) | (SMD ‐0.07; 95% CI ‐0.50 to 0.36) | ‐ | (SMD ‐0.18; 95% CI ‐0.60 to 0.25) |
| All treatments | Effect size [CI], I² statistic | (SMD ‐0.24; 95% CI ‐0.72 to 0.25); I² statistic:93.0% | (SMD ‐0.27; 95% CI ‐0.73 to 0.20); I² statistic: 80.6% | (SMD 0.36; 95% CI ‐0.33 to 1.04); I² statistic: 94.5% | (SMD ‐0.05; 95% CI ‐0.90 to 0.80); I² statistic: 92.5% | (SMD 0.09; 95% CI ‐0.44 to 0.63); I² statistic: 94.9% |
| ‐ | No. participants | 1108 | 386 | 796 | 544 | 1284 |
| ‐ | Between‐patient design | 5 | 3 | 5 | 2 | 7 |
| ‐ | Within‐patient design | 0 | 1 | 0 | 0 | 1 |
| ‐ | Treatment duration | 8 wks to 12 wks | 4 wks to 8 wks | 8 wks to 12 wks | 8 wks to 12 wks | 4 wks to 12 wks |
| Subcategory | Measure | 01 IAGI/IGA | 02 TSS | 03 PASI | 04 PAGI/PGA | 05 Combined end point |
| 01 Calcipotriol vs. calcitriol | Effect size [CI] | (SMD 0.00; 95% CI ‐0.25 to 0.25) | (SMD ‐0.32; 95% CI ‐0.57 to ‐0.07) | (SMD ‐1.11; 95% CI ‐2.22 to 0.01) | (SMD 0.04; 95% CI ‐0.21 to 0.29) | (SMD ‐0.41; 95% CI ‐1.46 to 0.64) |
| 02 Calcipotriol vs. tacalcitol | Effect size [CI] | (SMD ‐0.47; 95% CI ‐0.73 to ‐0.21) | (SMD ‐0.45; 95% CI ‐0.68 to ‐0.22) | ‐ | ‐ | (SMD ‐0.47; 95% CI ‐0.73 to ‐0.21) |
| 03 Calcipotriol vs. maxacalcitol | Effect size [CI] | (SMD 0.43; 95% CI ‐0.12 to 0.98) | (SMD 0.13; 95% CI ‐0.41 to 0.68) | ‐ | ‐ | (SMD 0.43; 95% CI ‐0.12 to 0.98) |
| All treatments | Effect size [CI], I² | (SMD ‐0.06; 95% CI ‐0.51 to 0.38); I² statistic: 82.2% | (SMD ‐0.31; 95% CI ‐0.55 to ‐0.06); I² statistic: 46.9% | (SMD ‐1.11; 95% CI ‐2.22 to 0.01); I² statistic: NA | (SMD 0.04; 95% CI ‐0.21 to 0.29); I² statistic: NA | (SMD ‐0.17; 95% CI ‐0.62 to 0.27); I² statistic: 78.5% |
| ‐ | No. participants | 498 | 563 | 15 | 250 | 513 |
| ‐ | Between‐patient design | 2 | 2 | 1 | 1 | 3 |
| ‐ | Within‐patient design | 1 | 1 | 0 | 0 | 1 |
| ‐ | Treatment duration | 8 wks to 12 wks | 8 wks to 12 wks | 8 wks | 12 wks | 8 wks to 12 wks |
| Sensitivity analyses | TSS data from Ji 2008 used in combined end point: 01 Calcipotriol vs. calcitriol | ‐ | ‐ | ‐ | (SMD ‐0.52; 95% CI ‐1.19 to 0.15; I² statistic: 44.9%) | |
| ‐ | TSS data from Ji 2008 used in combined end point: all treatments | ‐ | ‐ | ‐ | (SMD ‐0.28; 95% CI ‐0.66 to 0.10; I² statistic: 70.6%) |
| Subcategory | Measure | 01 IAGI/IGA | 02 TSS | 03 PASI | 04 PAGI/PGA | 05 Combined end point |
| 01 Calcipotriol BD vs. calcipotriol OM, BMD ON | Effect size [CI] | (SMD 0.56; 95% CI 0.23 to 0.88) | ‐ | (SMD 0.46; 95% CI 0.10 to 0.82) | ‐ | (SMD 0.56; 95% CI 0.23 to 0.88) |
| 02 Calcipotriol OD vs. combined calcipotriol + BMD OD | Effect size [CI] | (SMD 0.66; 95% CI 0.31 to 1.02) | ‐ | (SMD 0.67; 95% CI 0.23 to 1.11) | ‐ | (SMD 0.66; 95% CI 0.31 to 1.02) |
| 03 Calcipotriol BD vs. combined calcipotriol + BMD OD | Effect size [CI] | (SMD 0.27; 95% CI 0.06 to 0.48) | (SMD 0.25; 95% CI 0.03 to 0.48) | (SMD 0.52; 95% CI 0.38 to 0.67) | ‐ | (SMD 0.43; 95% CI 0.20 to 0.66) |
| 04 Calcipotriol BD vs. combined calcipotriol + BMD BD | Effect size [CI] | (SMD 0.66; 95% CI 0.40 to 0.93) | ‐ | (SMD 0.64; 95% CI 0.46 to 0.83) | ‐ | (SMD 0.66; 95% CI 0.40 to 0.93) |
| 05 Calcipotriol BD vs. calcipotriol OM, BMV ON | Effect size [CI] | (SMD 0.27; 95% CI ‐0.19 to 0.74) | ‐ | (SMD 0.43; 95% CI ‐0.07 to 0.93) | ‐ | (SMD 0.27; 95% CI ‐0.19 to 0.74) |
| 06 Calcipotriol BD vs. calcipotriol OM, clobetasone butyrate ON | Effect size [CI] | (SMD 0.27; 95% CI 0.05 to 0.48) | ‐ | (SMD 0.17; 95% CI ‐0.04 to 0.38) | ‐ | (SMD 0.27; 95% CI 0.05 to 0.48) |
| 07 Calcipotriol BD vs. calcipotriol BD + clobetasol propionate BD | Effect size [CI] | (SMD 0.88; 95% CI 0.34 to 1.42) | ‐ | ‐ | (SMD 0.70; 95% CI 0.16 to 1.23) | (SMD 0.88; 95% CI 0.34 to 1.42) |
| 08 Calcipotriol BD vs. calcipotriol OM, diflucortolone valerate ON | Effect size [CI] | ‐ | ‐ | (SMD 0.08; 95% CI ‐0.29 to 0.44) | ‐ | (SMD 0.08; 95% CI ‐0.29 to 0.44) |
| 09 Calcipotriol OD vs. calcipotriol OM, fluocinonide acetonide ON | Effect size [CI] | ‐ | ‐ | (SMD 0.53; 95% CI ‐0.11 to 1.18) | ‐ | (SMD 0.53; 95% CI ‐0.11 to 1.18) |
| 10 Calcipotriol OD vs. combined calcipotriol + hydrocortisone OD | Effect size [CI] | (SMD 0.14; 95% CI ‐0.06 to 0.33) | ‐ | (SMD 0.08; 95% CI ‐0.11 to 0.28) | ‐ | (SMD 0.14; 95% CI ‐0.06 to 0.33) |
| 11 calcitriol BD vs. diflucortolone valerate OM, calcitriol ON | Effect size [CI] | ‐ | ‐ | (SMD 0.24; 95% CI ‐0.09 to 0.57) | ‐ | (SMD 0.24; 95% CI ‐0.09 to 0.57) |
| 12 Tacalcitol OD vs. combined calcipotriol + BMD OD | Effect size [CI] | (SMD 0.48; 95% CI 0.26 to 0.70) | ‐ | (SMD 0.47; 95% CI 0.25 to 0.69) | (SMD 0.46; 95% CI 0.24 to 0.68) | (SMD 0.48; 95% CI 0.26 to 0.70) |
| All treatments | Effect size [CI], I² statistic | (SMD 0.48; 95% CI 0.32 to 0.65), I² statistic: 86.9% | (SMD 0.25; 95% CI 0.03 to 0.48) | (SMD 0.47; 95% CI 0.34 to 0.59), I² statistic: 82.3% | (SMD 0.49; 95% CI 0.29 to 0.69), I² statistic: 0% | (SMD 0.46; 95% CI 0.33 to 0.59), I² statistic: 83.3% |
| ‐ | No. participants | 4791 | 301 | 5703 | 399 | 5856 |
| ‐ | Between‐patient design | 11 | 1 | 15 | 2 | 16 |
| ‐ | Within‐patient design | 0 | 0 | 1 | 0 | 1 |
| ‐ | Treatment duration | 2 wks to 8 wks | 4 wks | 2 wks to 12 wks | 2 wks to 8 wks | 2 wks to 12 wks |
| For acronyms, see Table 1. | ||||||
| Subcategory | Measure | 01 IAGI/IGA | 02 TSS | 03 PASI | 04 PAGI/PGA | 05 Combined end point |
| 01 Calcipotriol (12 wks) vs. combined calcipotriol + BMD (8 wks); then calcipotriol (4 wks) | Effect size [CI] | (SMD ‐0.12; 95% CI ‐0.29 to 0.04) | ‐ | (SMD ‐0.04; 95% CI ‐0.19 to 0.11) | (SMD ‐0.14; 95% CI ‐0.30 to 0.02) | (SMD ‐0.12; 95% CI ‐0.29 to 0.04) |
| 02 Calcipotriol (12 wks) vs. combined calcipotriol + BMD (4 wks); then calcipotriol (8 wks) | Effect size [CI] | ‐ | ‐ | (SMD 0.29; 95% CI ‐0.04 to 0.62) | ‐ | (SMD 0.29; 95% CI ‐0.04 to 0.62) |
| 03 Calcipotriol (12 wks) vs. combined calcipotriol + BMD (4 wks); then calcipotriol (w/dy) & combined calcipotriol + BMD (w/e) (8 wks) | Effect size [CI] | (SMD 0.13; 95% CI ‐0.04 to 0.29) | ‐ | (SMD 0.10; 95% CI ‐0.05 to 0.25) | (SMD 0.10; 95% CI ‐0.06 to 0.26) | (SMD 0.13; 95% CI ‐0.04 to 0.29) |
| 04 Calcipotriol (6 wks) vs. clobetasol propionate (2 wks); then calcipotriol (4 wks) | Effect size [CI] | (SMD 0.60; 95% CI 0.18 to 1.02) | (SMD 0.63; 95% CI 0.21 to 1.05) | ‐ | ‐ | (SMD 0.60; 95% CI 0.18 to 1.02) |
| 05 Calcipotriol (6 wks) vs. calcipotriol OM, fluocinonide acetonide ON (2 wks); then calcipotriol BD (4 wks) | Effect size [CI] | ‐ | ‐ | (SMD 0.66; 95% CI 0.01 to 1.32) | ‐ | (SMD 0.66; 95% CI 0.01 to 1.32) |
| 06 Calcipotriol (6 wks) vs. halometasone OM, calcipotriol ON (2 wks); then calcipotriol BD (w/dy), halometasone (w/e) (2 wks); then calcipotriol BD (2wks) | Effect size [CI] | (SMD 0.41; 95% CI ‐0.05 to 0.86) | ‐ | (SMD 1.13; 95% CI 0.64 to 1.62) | ‐ | (SMD 0.41; 95% CI ‐0.05 to 0.86) |
| 07 Calcipotriol ON, clobetasol propionate OM (2 to 4 wks); then calcipotriol BD (to wk12) vs. calcitriol ON, clobetasol propionate OM (2 to 4 wks); then calcitriol BD (to wk12) | Effect size [CI] | (SMD ‐0.19; 95% CI ‐0.54 to 0.16) | ‐ | (SMD ‐0.27; 95% CI ‐0.62 to 0.09) | ‐ | (SMD ‐0.19; 95% CI ‐0.54 to 0.16) |
| 08 Combined calcipotriol + BMD (4 wks); then placebo ointment BD (8 wks) vs. combined calcipotriol + BMD (4 wks); then calcipotriol ointment BD (8 wks) | Effect size [CI] | (SMD 0.27; 95% CI 0.12 to 0.41) | ‐ | (SMD 0.25; 95% CI 0.10 to 0.39) | (SMD 0.28; 95% CI 0.13 to 0.42) | (SMD 0.27; 95% CI 0.12 to 0.41) |
| 09 Combined calcipotriol + BMD (4 wks); then placebo ointment BD (8 wks) vs. combined calcipotriol + BMD (4 wks); then calcipotriol (w/dy)+ combined calcipotriol + BMD (w/e) (8 wks) | Effect size [CI] | (SMD 0.51; 95% CI 0.37 to 0.66) | ‐ | (SMD 0.59; 95% CI 0.45 to 0.74) | (SMD 0.71; 95% CI 0.56 to 0.85) | (SMD 0.51; 95% CI 0.37 to 0.66) |
| 10 combined calcipotriol + BMD (4 wks); then calcipotriol ointment BD (8 wks) vs. combined calcipotriol + BMD (4 wks); then calcipotriol (w/dy) + combined calcipotriol + BMD (w/e) (8 wks) | Effect size [CI] | (SMD 0.26; 95% CI 0.11 to 0.40) | ‐ | (SMD 0.30; 95% CI 0.16 to 0.45) | (SMD 0.44; 95% CI 0.29 to 0.58) | (SMD 0.26; 95% CI 0.11 to 0.40) |
| 11 Combined calcipotriol + BMD (8 wks); then calcipotriol (4 wks) vs. combined calcipotriol + BMD (4 wks); then calcipotriol (w/dy) & combined calcipotriol + BMD (w/e) (8 wks) | Effect size [CI] | (SMD 0.24; 95% CI 0.08 to 0.40) | ‐ | (SMD 0.15; 95% CI ‐0.01 to 0.30) | (SMD 0.23; 95% CI 0.07 to 0.39) | (SMD 0.24; 95% CI 0.08 to 0.40) |
| 12 Tacalcitol (8 wks) vs. combined calcipotriol + BMD (4 wks); then calcipotriol (4 wks) | Effect size [CI] | (SMD 0.54; 95% CI 0.36 to 0.72) | ‐ | (SMD 0.49; 95% CI 0.31 to 0.67) | (SMD 0.54; 95% CI 0.36 to 0.72) | (SMD 0.54; 95% CI 0.36 to 0.72) |
| All treatments | (not pooled) | ‐ | ‐ | ‐ | ‐ | ‐ |
| ‐ | No. participants | 2755 | 46 | 2991 | 2508 | 2936 |
| ‐ | Between‐patient design | 6 | 0 | 8 | 4 | 8 |
| ‐ | Within‐patient design | 1 | 1 | 0 | 0 | 1 |
| ‐ | Treatment duration | 6 wks to 12 wks | 6 wks | 2 wks to 12 wks | 8 wks to 12 wks | 2 wks to 12 wks |
| For acronyms, see Table 1. | ||||||
| Subcategory | Measure | 01 IAGI/IGA | 02 TSS | 03 PASI | 04 PAGI/PGA | 05 Combined end point |
| 01 Combined calcipotriol + BMD (52 wks) vs. alternating: combined calcipotriol + BMD (4 wks); then calcipotriol (4 wks) | Effect size [CI] | (SMD ‐0.09; 95% CI ‐0.36 to 0.18) | ‐ | ‐ | ‐ | (SMD ‐0.09; 95% CI ‐0.36 to 0.18) |
| 02 Combined calcipotriol+BMD (52 wks) vs. combined calcipotriol+ BMD (4 wks); then calcipotriol (48 wks) | Effect size [CI] | (SMD ‐0.18; 95% CI ‐0.47 to 0.10) | ‐ | ‐ | ‐ | (SMD ‐0.18; 95% CI ‐0.47 to 0.10) |
| 03 Alternating: combined calcipotriol + BMD (4 wks); then calcipotriol (4 wks) vs. combined calcipotriol + BMD (4 wks); then calcipotriol (48 wks) | Effect size [CI] | (SMD ‐0.09; 95% CI ‐0.37 to 0.19) | ‐ | ‐ | ‐ | (SMD ‐0.09; 95% CI ‐0.37 to 0.19) |
| All treatments | (no pooling) | ‐ | ‐ | ‐ | ‐ | ‐ |
| ‐ | No. participants | 297 | 0 | 0 | 0 | 297 |
| ‐ | Between‐patient design | 1 | 0 | 0 | 0 | 1 |
| ‐ | Within‐patient design | 0 | 0 | 0 | 0 | 0 |
| ‐ | Treatment duration | 52 wks | ‐ | ‐ | ‐ | 52 wks |
| For acronyms, see Table 1. | ||||||
| Subcategory | Measure | 01 IAGI/IGA | 02 TSS | 03 PASI | 04 PAGI/PGA | 05 Combined end point |
| 01 Calcipotriol vs. coal tar | Effect size [CI] | (SMD ‐0.53; 95% CI ‐1.74 to 0.68) | ‐ | (SMD ‐0.10; 95% CI ‐1.54 to 1.35) | (SMD ‐0.10; 95% CI ‐1.54 to 1.35) | (SMD ‐0.53; 95% CI ‐1.74 to 0.68) |
| 02 Calcipotriol vs. coal tar polytherapy | Effect size [CI] | (SMD ‐0.59; 95% CI ‐0.87 to ‐0.31) | (SMD ‐0.51; 95% CI ‐0.86 to ‐0.16) | (SMD ‐0.63; 95% CI ‐1.06 to ‐0.20) | (SMD ‐0.63; 95% CI ‐1.06 to ‐0.20) | (SMD ‐0.59; 95% CI ‐0.87 to ‐0.31) |
| 03 Calcipotriol vs. nicotinamide 1.4%, BD | Effect size [CI] | ‐ | (SMD ‐0.09; 95% CI ‐0.49 to 0.31) | ‐ | ‐ | (SMD ‐0.09; 95% CI ‐0.49 to 0.31) |
| 04 Calcipotriol vs. calcipotriol + nicotinamide 1.4%, BD | Effect size [CI] | ‐ | (SMD 0.19; 95% CI ‐0.14 to 0.52) | ‐ | ‐ | (SMD 0.19; 95% CI ‐0.14 to 0.52) |
| 05 Calcipotriol vs. corticosteroid + salicylic acid | Effect size [CI] | (SMD ‐0.06; 95% CI ‐0.33 to 0.22) | ‐ | (SMD ‐0.05; 95% CI ‐0.36 to 0.26) | (SMD ‐0.49; 95% CI ‐0.79 to ‐0.20) | (SMD ‐0.05; 95% CI ‐0.26 to 0.15) |
| 06 Calcipotriol vs. propylthiouracil cream | Effect size [CI] | ‐ | ‐ | (SMD ‐2.24; 95% CI ‐3.23 to ‐1.25) | ‐ | (SMD ‐2.24; 95% CI ‐3.23 to ‐1.25) |
| 07 Calcipotriol vs. tacrolimus ointment | Effect size [CI] | ‐ | (SMD ‐0.35; 95% CI ‐1.51 to 0.81) | (SMD ‐0.13; 95% CI ‐0.51 to 0.24) | (SMD ‐0.55; 95% CI ‐1.28 to 0.17) | |
| 08 Calcipotriol vs. tazarotene | Effect size [CI] | (SMD ‐0.22; 95% CI ‐0.60 to 0.16) | (SMD ‐0.05; 95% CI ‐0.33 to 0.23) | ‐ | (SMD ‐0.35; 95% CI ‐0.99 to 0.29) | (SMD ‐0.10; 95% CI ‐0.35 to 0.16) |
| 09 Calcipotriol vs. tazarotene gel plus mometasone furoate cream | Effect size [CI] | ‐ | ‐ | ‐ | ‐ | ‐ |
| 10 Calcipotriol vs. vitamin B12 cream | Effect size [CI] | (SMD ‐0.55; 95% CI ‐1.33 to 0.24) | ‐ | (SMD ‐0.01; 95% CI ‐0.78 to 0.75) | (SMD ‐0.55; 95% CI ‐1.33 to 0.24) | (SMD ‐0.55; 95% CI ‐1.33 to 0.24) |
| 11 Head‐to‐head vitamin D alone or in combination: dosing | Effect size [CI] | (SMD ‐0.24; 95% CI ‐0.38 to ‐0.09) | ‐ | (SMD ‐0.12; 95% CI ‐0.25 to 0.00) | ‐ | (SMD ‐0.20; 95% CI ‐0.32 to ‐0.07) |
| 12 Head‐to‐head vitamin D alone or in combination: occlusion | Effect size [CI] | ‐ | (SMD ‐0.18; 95% CI ‐2.04 to 1.68) | ‐ | ‐ | (SMD ‐0.18; 95% CI ‐2.04 to 1.68) |
| All treatments | (not pooled) | ‐ | ‐ | ‐ | ‐ | ‐ |
| ‐ | No. participants | 1386 | 898 | 1228 | 456 | 2364 |
| ‐ | Between‐patient design | 8 | 5 | 6 | 3 | 13 |
| ‐ | Within‐patient design | 2 | 2 | 3 | 3 | 6 |
| ‐ | Treatment duration | 4 wks to 12 wks | 6 wks to 12 wks | 4 wks to 12 wks | 4 wks to 12 wks | 4 wks to 12 wks |
| For acronyms, see Table 1. | ||||||
| Subcategory | Measure | 01 IAGI/IGA | 02 TSS | 03 PASI | 04 PAGI/PGA | 05 Combined end point |
| 01 Betamethasone valerate 0.1%, OD | Effect size [CI] | ‐ | ‐ | (SMD ‐2.83; 95% CI ‐3.79 to ‐1.88) | ‐ | (SMD ‐2.83; 95% CI ‐3.79 to ‐1.88) |
| 02 Calcipotriol ointment, OD | Effect size [CI] | ‐ | ‐ | (SMD ‐1.08; 95% CI ‐1.77 to ‐0.40) | ‐ | (SMD ‐1.08; 95% CI ‐1.77 to ‐0.40) |
| 03 Pimecrolimus cream, 1% OD/BD | Effect size [CI] | (SMD ‐1.07; 95% CI ‐1.69 to ‐0.45) | (SMD ‐1.37; 95% CI ‐1.95 to ‐0.79) | (SMD ‐0.62; 95% CI ‐1.27 to 0.02) | (SMD ‐0.65; 95% CI ‐1.24 to ‐0.06) | (SMD ‐0.86; 95% CI ‐1.30 to ‐0.41) |
| 04 Tacrolimus ointment 0.1%, BD | Effect size [CI] | ‐ | ‐ | ‐ | ‐ | ‐ |
| All treatments | (no pooling) | ‐ | ‐ | ‐ | ‐ | ‐ |
| ‐ | No. participants | 47 | 57 | 75 | 47 | 122 |
| ‐ | Between‐patient design | 1 | 1 | 1 | 1 | 2 |
| ‐ | Within‐patient design | 0 | 0 | 0 | 0 | 0 |
| ‐ | Treatment duration | 8 wks | 8 wks | 4 wks | 8 wks | 4 wks to 8 wks |
| For acronyms, see Table 1. | ||||||
| Subcategory | Measure | 01 IAGI/IGA | 02 TSS | 03 PASI | 04 PAGI/PGA | 05 Combined end point |
| 01 Calcipotriol vs. BMV | Effect size [CI] | ‐ | ‐ | (SMD 2.02; 95% CI 1.20 to 2.84) | ‐ | (SMD 2.02; 95% CI 1.20 to 2.84) |
| 02 Calcipotriol vs. calcipotriol + hydrocortisone | Effect size [CI] | (SMD 0.30; 95% CI 0.11 to 0.50) | ‐ | (SMD 0.32; 95% CI 0.12 to 0.51) | ‐ | (SMD 0.30; 95% CI 0.11 to 0.50) |
| 03 Calcipotriol vs. calcitriol | Effect size [CI] | ‐ | (SMD 0.61; 95% CI 0.28 to 0.94) | ‐ | ‐ | (SMD 0.61; 95% CI 0.28 to 0.94) |
| 04 Calcipotriol vs. pimecrolimus | Effect size [CI] | ‐ | ‐ | (SMD ‐0.53; 95% CI ‐1.17 to 0.11) | (SMD ‐0.53; 95% CI ‐1.17 to 0.11) | |
| 05 Calcitriol vs. tacrolimus | Effect size [CI] | (SMD 0.42; 95% CI ‐0.15 to 0.98) | (SMD 0.29; 95% CI ‐0.27 to 0.85) | ‐ | ‐ | (SMD 0.42; 95% CI ‐0.15 to 0.98) |
| All treatments | (no pooling) | ‐ | ‐ | ‐ | ‐ | ‐ |
| ‐ | No. participants | 457 | 124 | 464 | 0 | 588 |
| ‐ | Between‐patient design | 2 | 1 | 2 | 0 | 3 |
| ‐ | Within‐patient design | 0 | 1 | 0 | 0 | 1 |
| ‐ | Treatment duration | 6 wks to 8 wks | 6 wks | 4 wks to 8 wks | 0 | 4 wks to 8 wks |
| For acronyms, see Table 1. | ||||||
| Subcategory | Measure | 01 IAGI/IGA | 02 TSS | 03 PASI | 04 PAGI/PGA | 05 Combined end point |
| 01 Vitamin D: calcipotriol | Effect size [CI] | (SMD ‐0.72; 95% CI ‐1.28 to ‐0.16) | (SMD ‐0.44; 95% CI ‐0.64 to ‐0.25) | ‐ | (SMD ‐0.66; 95% CI ‐1.28 to ‐0.05) | (SMD ‐0.72; 95% CI ‐1.28 to ‐0.16) |
| 02 Potent steroid: betamethasone dipropionate | Effect size [CI] | (SMD ‐1.09; 95% CI ‐1.29 to ‐0.90) | (SMD ‐1.00; 95% CI ‐1.19 to ‐0.81) | ‐ | (SMD ‐1.23; 95% CI ‐1.43 to ‐1.03) | (SMD ‐1.09; 95% CI ‐1.29 to ‐0.90) |
| 03 Potent steroid: betamethasone valerate | Effect size [CI] | ‐ | (SMD ‐1.40; 95% CI ‐1.75 to ‐1.05) | ‐ | ‐ | (SMD ‐1.40; 95% CI ‐1.75 to ‐1.05) |
| 04 Very potent steroid: amcinonide | Effect size [CI] | (SMD ‐1.42; 95% CI ‐1.80 to ‐1.04) | (SMD ‐1.58; 95% CI ‐1.98 to ‐1.18) | ‐ | (SMD ‐0.97; 95% CI ‐1.33 to ‐0.61) | (SMD ‐1.42; 95% CI ‐1.80 to ‐1.04) |
| 05 Very potent steroid: clobetasol propionate | Effect size [CI] | (SMD ‐1.73; 95% CI ‐1.99 to ‐1.48) | (SMD ‐1.53; 95% CI ‐1.77 to ‐1.28) | ‐ | ‐ | (SMD ‐1.57; 95% CI ‐1.81 to ‐1.34) |
| 06 Very potent steroid: halcinonide | Effect size [CI] | (SMD ‐1.11; 95% CI ‐1.69 to ‐0.53) | ‐ | ‐ | ‐ | (SMD ‐1.11; 95% CI ‐1.69 to ‐0.53) |
| 07 Vitamin D in combination: calcipotriol + BMD | Effect size [CI] | (SMD ‐0.97; 95% CI ‐1.61 to ‐0.32) | (SMD ‐0.92; 95% CI ‐1.42 to ‐0.43) | ‐ | (SMD ‐1.00; 95% CI ‐1.79 to ‐0.22) | (SMD ‐0.97; 95% CI ‐1.61 to ‐0.32) |
| 08 Other treatment: betamethasone‐17,21‐dipropionate plus salicylic acid | Effect size [CI] | (SMD ‐1.48; 95% CI ‐2.50 to ‐0.47) | (SMD ‐1.15; 95% CI ‐2.11 to ‐0.19) | ‐ | ‐ | (SMD ‐1.48; 95% CI ‐2.50 to ‐0.47) |
| 09 Other treatment: ciclopirox olamine shampoo | Effect size [CI] | ‐ | (SMD ‐0.07; 95% CI ‐0.82 to 0.68) | ‐ | (SMD ‐0.11; 95% CI ‐0.86 to 0.64) | (SMD ‐0.07; 95% CI ‐0.82 to 0.68) |
| 10 Other treatment: fluocinolone acetonide, plus occlusion | Effect size [CI] | (SMD ‐1.22; 95% CI ‐1.69 to ‐0.76) | (SMD ‐0.89; 95% CI ‐1.34 to ‐0.44) | ‐ | ‐ | (SMD ‐1.22; 95% CI ‐1.69 to ‐0.76) |
| 11 Other treatment: salicylic acid | Effect size [CI] | (SMD ‐0.86; 95% CI ‐1.79 to 0.06) | (SMD ‐0.57; 95% CI ‐1.47 to 0.32) | ‐ | ‐ | (SMD ‐0.86; 95% CI ‐1.79 to 0.06) |
| All treatments | No. participants | 2472 | 2897 | 0 | 1875 | 3011 |
| ‐ | Between‐patient design | 9 | 12 | 0 | 5 | 13 |
| ‐ | Within‐patient design | 1 | 0 | 0 | 0 | 1 |
| ‐ | Treatment duration | 2 wks to 8 wks | 2 wks to 8 wks | ‐ | 3 wks to 8 wks | 2 wks to 8 wks |
| Sensitivity analysis: potent corticosteroids | Effect size [CI]; I² statistic | ‐ | ‐ | ‐ | ‐ | (SMD ‐1.18; 95% CI ‐1.40 to ‐0.96); I² statistic: 19.9% |
| Sensitivity analysis: very potent corticosteroids | Effect size [CI]; I² statistic | ‐ | ‐ | ‐ | ‐ | (SMD ‐1.51; 95% CI ‐1.70 to ‐1.31); I² statistic: 37.5% |
| For acronyms, see Table 1. | ||||||
| Subcategory | Measure | 01 IAGI/IGA | 02 TSS | 03 PASI | 04 PAGI/PGA | 05 Combined end point |
| 01 Vitamin D vs. corticosteroid (potent): calcipotriol vs. BMD | Effect size [CI] | (SMD 0.48; 95% CI 0.32 to 0.64) | (SMD 0.45; 95% CI 0.28 to 0.63) | ‐ | (SMD 0.56; 95% CI 0.31 to 0.81) | (SMD 0.48; 95% CI 0.32 to 0.64) |
| 02 Vitamin D vs. corticosteroid (potent): calcipotriol vs. BMV | Effect size [CI] | (SMD 0.37; 95% CI 0.20 to 0.55) | (SMD 0.09; 95% CI ‐0.09 to 0.27) | ‐ | (SMD 0.41; 95% CI 0.22 to 0.59) | (SMD 0.37; 95% CI 0.20 to 0.55) |
| 03 Vitamin D vs. corticosteroid (very potent): calcipotriol vs. clobetasol propionate | Effect size [CI] | ‐ | (SMD 0.37; 95% CI 0.05 to 0.69) | ‐ | ‐ | (SMD 0.37; 95% CI 0.05 to 0.69) |
| 04 Vitamin D + corticosteroid vs. corticosteroid: calcipotriol + BMD vs. BMD | Effect size [CI] | (SMD ‐0.18; 95% CI ‐0.26 to ‐0.10) | (SMD ‐0.19; 95% CI ‐0.27 to ‐0.11) | ‐ | (SMD ‐0.17; 95% CI ‐0.25 to ‐0.09) | (SMD ‐0.18; 95% CI ‐0.26 to ‐0.10) |
| 05 Vitamin D vs. vitamin D + corticosteroid: calcipotriol vs. calcipotriol + BMD | Effect size [CI] | (SMD 0.64; 95% CI 0.44 to 0.84) | (SMD 0.70; 95% CI 0.56 to 0.84) | ‐ | (SMD 0.84; 95% CI 0.61 to 1.08) | (SMD 0.64; 95% CI 0.44 to 0.84) |
| 06 Vitamin D vs. other treatments: calcipotriol vs. coal tar polytherapy | Effect size [CI] | (SMD ‐0.24; 95% CI ‐0.73 to 0.25) | (SMD ‐0.30; 95% CI ‐0.84 to 0.24) | ‐ | ‐ | (SMD ‐0.45; 95% CI ‐0.92 to 0.02) |
| All treatments | No. participants | 5175 | 4877 | 0 | 3742 | 5413 |
| ‐ | Between‐patient design | 10 | 11 | 0 | 6 | 12 |
| ‐ | Within‐patient design | 0 | 0 | 0 | 0 | 0 |
| ‐ | Treatment duration | 4 wks to 52 wks | 4 wks to 8 wks | 0 | 4 wks to 8 wks | 4 wks to 52 wks |
| For acronyms, see Table 1. | ||||||
| Subcategory | Measure | 01 IAGI/IGA | 02 TSS | 03 PASI | 04 PAGI/PGA | 05 Combined end point |
| 01 Dithranol | Effect size [CI], N, I² statistic | ‐ | (SMD ‐1.06; 95% CI ‐1.66 to ‐0.46); I² statistic: 37.4% | ‐ | ‐ | (SMD ‐1.06; 95% CI ‐1.66 to ‐0.46); I² statistic: 37.4% |
| ‐ | No. participants | 0 | 47 | 0 | 0 | 47 |
| ‐ | Between‐patient design | 0 | 0 | 0 | 0 | 0 |
| ‐ | Within‐patient design | 0 | 3 | 0 | 0 | 3 |
| ‐ | Treatment duration | 3 wks to 8 wks | ‐ | ‐ | 3 wks to 8 wks | |
| ‐ | correlation coefficient (rho) = 0 All trials | ‐ | ‐ | ‐ | (SMD ‐0.98; 95% CI ‐1.56 to ‐0.41) I² statistic: 13.9% | |
| ‐ | rho = 0 Btw‐patient trials rho = 0.25 Within‐patient trials | ‐ | ‐ | ‐ | ‐ | (SMD ‐1.05; 95% CI ‐1.67 to ‐0.44) I² statistic: 35.4% |
| ‐ | rho = 0 Btw‐patient trials rho = 0.50 Within‐patient trials | ‐ | ‐ | ‐ | ‐ | (SMD ‐1.12; 95% CI ‐1.75 to ‐0.48) I² statistic: 56.9% |
| ‐ | rho = 0 Btw‐patient trials rho = 0.75 Within‐patient trials | ‐ | ‐ | ‐ | ‐ | (SMD ‐1.17; 95% CI ‐1.81 to ‐0.52) I² statistic: 78.5% |
| For acronyms, see Table 1. | ||||||
| Study | Methods | Participants | Intervention(s) | Outcomes (AEs) | Summary findings | Notes | Allocation concealment |
| DESIGN: between‐patient patient delivery Concealment: unclear | N: 26 | Clobetasol propionate 0.05% shampoo, OD. Applied to dry scalp, rinsed off after 15 minutes Clobetasol propionate 0.05% gel, OD. Applied to dry scalp and left in. | Serum cortisol atrophogenicity (ultrasound measurement of skin thickness (epidermis + dermis) (mm), averaged over 3 sites of the scalp) ocular safety (intraocular pressure) DSS (10‐pt; sum of erythema, adherent desquamation, and plaque thickening; 0 (none) to 3 (severe) with half‐point ratings permitted) Patient‐reported ocular stinging (0 to 3) Compliance | Neither formulation had an impact on ocular safety, no report of ocular stinging. LAE: HPA suppression: Atrophy: Decrease in skin thickness from baseline: mean difference: Efficacy results of the 2 formulations were similar. Compliance with protocol was good in both groups. | Exploratory safety study Sponsored by Galderma Laboratories | Unclear | |
| DESIGN: within‐patient ALLOCATION: non‐random | N: 202 | Calcipotriol scalp solution 50 mcg/ml BD | Local AEs: serum calcium | Local AEs: | Sponsored by Leo Pharmaceuticals | Not applicable | |
| DESIGN: uncontrolled study Concealment: NA | STUDY A: | Study A: calcipotriol ointment 50 mcg/g BD up to 100 g/wk | Local AEs: | Study A: no significant trend in urine calcium excretion | Sponsorship not reported | Not applicable | |
| DESIGN: uncontrolled study ALLOCATION: non‐random Concealment: NA BLINDING: open WITHDRAWAL/DROPOUT: not described | N: 28 | STUDY A: 200 g calcipotriol ointment 50 mcg/g (wk 1) plus 300 g 50 mcg/g calcipotriol (wk 2) | Local AEs: | 5 participants developed hypercalcaemia during treatment, all had received a dose > 5 g/kg | Sponsorship not reported | Not applicable | |
| DESIGN: uncontrolled study | N: 305 % white: 91.8% | Clobetasol propionate 0.05% spray BD (2 to 4 wks); treatment responders (ODS < = 3) then treated with calcitriol 3 mg/g ointment (8 wks) | Pruritis, telangiectasias, burning/stinging (0 to 3), skin atrophy, folliculitis Overall disease severity (ODS) (5‐pt: 0 = clear to 4 = severe/very severe) based on erythema, scaling, and plaque elevation. Treatment success (change from baseline ODS > = 1 at wk 12)
| At 4 wks: skin atrophy 7/285 telangiectasias 2/285 stinging/Burning 39/285 folliculitis 11/285
At 12 wks: skin atrophy 2/235 telangiectasias 5/235 stinging/Burning 35/235 folliculitis 3/235
Any adverse event: 100/305
| Sponsored by Galderma laboratories | Not applicable | |
| DESIGN: within‐patient | N: 14 EXCLUSION CRITERIA: NR | Clobetasol propionate 0.05% ointment, BD Betamethasone valerate 0.1% ointment, BD | Local AEs: NR | Quantities used by study participants were small (mean: 7 g/wk) | Sponsorship not reported | Unclear | |
| DESIGN: uncontrolled study patient delivery ALLOCATION: NA Method of randomisation: NA Concealment: NA BLINDING: open WITHDRAWAL/DROPOUT: described | N: 257 | Calcitriol 3 mcg/g BD | Local AEs: | Local AEs: | Sponsored by Solvay‐Duphar BV | Not applicable | |
| DESIGN: between‐patient ALLOCATION: random | N: 78 EXCLUSION CRITERIA: hypercalcaemia, bone, thyroid or parathyroid disease; topical therapy within previous 2 wks; systemic/phototherapy within previous 8 wks | Calcipotriol 50 mcg/g ointment BD, up to 120 g/wk | Local AEs: not assessed | No adverse effects on bone metabolism or calcium | Sponsored by Bristol‐Myers Squibb | Unclear | |
| DESIGN: between‐patient (retrospective study) ALLOCATION: non‐random | N: 28 EXCLUSION CRITERIA: NR | Previous prolonged treatment with topical fluorinated steroids | Local AEs: light/electron microscopy for examination of basal keratinocyte herniation (BKH); layers of basement membrane | Local AEs: light microscopy revealed no between‐group differences. Electron microscopy revealed multi‐layered, fragmented and disorganised basal laminae in the steroid group, which appeared to be correlated with duration of treatment. Fragmentation was not observed in the control group | Sponsorship not reported | Not applicable | |
| DESIGN: between‐patient ALLOCATION: random Method of randomisation: NS | N: 40 | Betamethasone dipropionate (0.05%) in optimised vehicle BD; Clobetasol 17 propionate (0.05%) ointment BD | Local AEs: not assessed Systemic AEs: morning plasma cortisol levels; 24‐hr urine steroid levels; FBC, blood chemistry, urinalysis | Temporary reversible suppression of the hypothalamic‐pituitary‐adrenal axis in 8/40 participants | Sponsorship not reported; 1 author from Schering Corporation | Unclear | |
| DESIGN: within‐patient ALLOCATION: random BLINDING: double‐blind (participant/investigator) | N: 30 | Betamethasone dipropionate (0.05%) in optimised vehicle BD (BMD) | Local AEs: skin surface microscopic examination with photographic documentation; oil and magnifying (8 x) lens to detect 'preatrophy' (visibility of subpapillary vascular plexus caused by thinning of epidermis and papillary dermis) | Local AEs: no serious adverse events observed with either treatment. Preatrophy identified in 20% of involved plaques (BMD: 11/59; CP: 12/59) and was more likely in females. In the test area (non‐psoriatic skin), 5% of plaques showed preatrophy (BMD: 2/30; CP: 1/30). Preatrophy appeared to be usually reversible following treatment cessation. | Sponsored by Schering Corporation | Unclear | |
| Phase II | DESIGN: uncontrolled BLINDING: open WITHDRAWAL/DROPOUT: | N: 32 | Clobetasol 0.05% foam BD Clobetasol 0.05% ointment BD (= 7 g/day, up to 50 g/wk)
| Maximal plasma concentration of clobetasol propionate
| Higher but non‐significant levels of clobetasol in ointment group | Supported by Stiefel Laboratories, Inc. Review of phase II studies on AD and psoriasis (clobetasol foam) | Not applicable |
| Phase III | DESIGN: between‐patient | N: 497 | Clobetasol 0.05% foam BD Clobetasol 0.05% ointment BD Placebo foam BD Face, scalp, and intertriginous areas excluded from treatment
| Treatment‐related adverse events:
ISGA (investigator's static global assessment score)(scale NR) | Atrophy: C foam: 2% (N = 253) Burning: C foam: 2% (N = 253) All treatment‐related adverse events: C foam: 8% (N = 253)
| Supported by Stiefel Laboratories Inc. Review of phase III studies on AD and psoriasis (clobetasol foam). | Unclear |
| DESIGN: uncontrolled study patient delivery ALLOCATION: non‐random BLINDING: open WITHDRAWAL/DROPOUT: described | N: 15 EXCLUSION CRITERIA: hypercalcaemia, impaired renal/hepatic function, daily receiving > 400 i.u. vitamin D | Calcipotriol ointment 50 mcg/g BD (max: 100 g/wk) | Local AEs: patient report of adverse events | Local AEs: | Sponsorship not reported. Leo Pharmaceuticals supplied study medication | Not applicable | |
| DESIGN: uncontrolled study patient delivery ALLOCATION: non‐random | N: 157 INCLUSION CRITERIA: chronic plaque psoriasis; aged 18 to 70; BSA 7% to 20%; laboratory parameters normal at baseline EXCLUSION CRITERIA: pregnancy or risk thereof; topical antipsoriatic therapy within previous 2 wks; systemic antipsoriatic therapy within previous 6 wks; retinoids within previous 52 wks.; history of hyperparathyroidism; concomitant use of drugs affecting calcium metabolism | Tacalcitol ointment, 4 mcg/g OD. No control | Local AEs: participants asked about adverse events. Tolerability assessed by investigator (4‐pt: 1 = excellent to 4 = poor). | Local AEs: | Sponsored by Hermal/BHI, Germany | Not applicable | |
| DESIGN: between‐patient ALLOCATION: random. | N: 40 EXCLUSION CRITERIA: history of sensitivity to study ingredients; topical antipsoriatics within previous 2 wks; UVB/PUVA within previous 8 wks; history of hypercalcaemia, recurrent illness | Initial regimen: all participants received 2 wks of calcipotriol (OM), halobetasol ointment (ON) | Local AEs: treatment‐related adverse events | Local AEs: | Sponsored by Westwood Squibb Pharmaceuticals | Unclear | |
| DESIGN: between‐patient patient delivery ALLOCATION: random | N: 50 | Open‐label phase: tazarotene 0.1% gel plus clobetasol propionate 0.05% ointment for 6 wks. Once daily initially, then 'tapered'. | Local AEs: no. steroid‐specific side‐effects | Local AEs: no steroid‐specific side‐effects | Sponsorship: not reported | Unclear | |
| DESIGN: uncontrolled BLINDING: open | N: 1423 | Clobetasol 0.05% foam BD, up to 50 g/wk either as monotherapy or adjunctive to existing therapy
| Erythema, peeling/scaling, dryness, stinging/burning (0 none to 3 severe). Telangiectasia, skin atrophy, pruritus, folliculitis (absent/present)
Also assessed efficacy and QoL | Erythema: 23.7% Telangiectasia, skin atrophy, folliculitis: present in less than 1% of participants (findings not reported separately) Pruritus: 5.7% | Clobex Spray Community‐Based Research Assessment (COBRA) Sponsorship not reported | Not applicable | |
| DESIGN: uncontrolled study patient delivery ALLOCATION: non‐random | N: 160 | Tacalcitol ointment 20 mcg/g OD (max: 10 g/day) | Local AEs: treatment‐related adverse events | Local AEs: | Sponsorship: not reported | Not applicable | |
| DESIGN: uncontrolled study patient delivery ALLOCATION: non‐random BLINDING: open | N: 203 | Calcipotriol 50 mcg/g ointment | Loca AEs: self report of adverse events. | Local AEs: | Sponsored by Leo Pharmaceuticals | Not applicable | |
| DESIGN: uncontrolled open study ALLOCATION: non‐random | N: 167 TD: 52 wks; FU: 52 wks LF: 39 (23.4%) BC: NA Age: 49 (range: 20 to 85) Gender (per cent men): 60% Severity: PASI (modified): 8.1 (6.7SD) INCLUSION CRITERIA: chronic plaque psoriasis; previous response to calcipotriol; managed by specialists EXCLUSION CRITERIA: pregnancy or risk thereof; abnormal serum calcium or phosphate; impaired hepatic/renal function; concomitant oral calcium/vitamin D; systemic therapy within previous 8 wks; topical therapy within previous 4 wks | Calcipotriol 50 mcg/g ointment. Max dose: 100 g/wk; 2500 g/pa Face/scalp/neck excluded | Local AEs: self report of adverse events: mild, moderate, severe; unlikely, possibly, or probably treatment‐related | AE(L): 52/161 60 (46 considered to be treatment‐related) events reported by 52 of 161 participants. 1 participant developed a significant rise in serum calcium. No other abnormalities in haematology or biochemistry tests. 118/161 participants reported continuous medication use and 80% to 90% used it twice daily. Mean use: 35.1 g/wk ('initially') to 23.4 g/wk during last 6 mths | Sponsored by Leo Pharmaceuticals | Not applicable | |
| DESIGN: observational study using retrospective data (medical records, cancer registry) and prospective (survey) data (treatments/lifestyle). Multivariate proportional hazards regression. | N: 4315 | All topical, phototherapy, and systemic therapies. Focus of study is on coal tar:
| Any cancer Skin cancer Internal malignancies Specific tumour groups:
No statistically significant increased risk of any cancer. Hazard ratios: Any cancer: LCD: 0.85 (95% CI 0.60 to 1.19) Skin cancer: LCD: 1.35 (95% CI 0.53 to 3.44) | Analysis adjusted for smoking status, other treatments, skin type, alcohol consumption. However, data on duration of tar therapy, smoking status and alcohol consumption were missing for most participants | Not applicable‐ | ||
| DESIGN: uncontrolled study patient delivery ALLOCATION: non‐random BLINDING: open | N: 58 | Part 1: double‐blind study (8 wks): tacalcitol 4 mcg/g ointment OD Placebo | Local AEs: occurrence of adverse events (duration, severity, and whether treatment‐related) | Local AEs: No case of hypercalcaemia | Sponsorship not reported | Not applicable | |
| van de Kerkhof 2002c (see also Lambert 2002) | DESIGN: uncontrolled study patient delivery ALLOCATION: non‐random Method of randomisation: NA Concealment: NA BLINDING: open WITHDRAWAL/DROPOUT: described | Part 1: | Tacalcitol 4 mcg/g OD. Treatment discontinued during remission and restarted if relapse | Local AEs: number treatment‐related adverse events; withdrawals due to adverse events (WA); investigator assessment of tolerability; participant assessment of tolerability | Local AEs: | Sponsored by Hermal/BHI, Germany | Not applicable |
| DESIGN: uncontrolled study patient delivery ALLOCATION: non‐random BLINDING: open WITHDRAWAL/DROPOUT: described | N: 20 INCLUSION CRITERIA: EXCLUSION CRITERIA: use of topical steroids in previous 2 mths | Clobetasol propionate 0.05% cream, OD (weekends) plus calcipotriol 50 mcg/g ointment BD (weekdays) | Local AEs: clinical (naked eye) examination of psoriatic plaque and surrounding area | Overuse of topical steroids resulted in appearance of clinically unapparent but dermoscopically apparent linear telangiectasias. 7/20 participants failed to adhere to recommended steroid dosing schedules. Dermoscopic red lines not apparent in 15/20 participants. Dermoscopic red lines apparent in 5/20 participants, of whom 4 had overused topical steroid cream. Steroid discontinued in participants with red lines and there was complete resolution within 2 mths | Links compliance with adverse events | Not applicable | |
| DESIGN: uncontrolled study | N: 48 | 0.1% tazarotene gel, short contact therapy (applied OD for 20 minutes then rinsed off with water) | Pruritis (4‐pt: 0 = absent to 3 = severe) Burning (4‐pt: 0 = absent to 3 = severe) | At day 45: pruritis (0 to 3): 0.17 (0.38SD) 14/43 had mild pruritis
Burning (0 to 3) 0.17 (0.38SD) 14/43 14/43 had mild burning No participant withdrew because of irritation on treated lesion | Sponsorship not reported | Not applicable | |
| DESIGN: uncontrolled study patient delivery | N: 30 | Calcitriol 15 mcg/g ointment OD Quantity of study drug varied by group: Group 1 (N =12): 4% to 8% BSA treated (300 to 600 cm^2) Group 2 (N = 10): 8% to 15% BSA treated (600 to 1200 cm^2) Group 3 (N = 8): 15% to 30% BSA treated (1200 to 2400 cm^2) | IAGI (6‐pt) ECG Haematology, biochemistry, urine protein and glucose. Serum calcium, phosphorus, plasma PTH, serum 25‐hydroxyvitaim D, 1‐alpha,25dihydroxy‐vitaim D, 24 hr urine tests for calcium, creatinine and phosphorus. Compliance also assessed (medication weight) | Mean daily usage: 74.0 to 306.1 mcg. No systemic adverse events, no skin irritation. No clinically relevant changes in vital signs, haematology, biochemistry, urine or ECGs. IAGI (0 to 5): ‐3.57 (1.01SD, N = 30) | Usual dose is 3 mcg/g BD, max. 30 g daily Sponsored by Solvay Duphar | Not applicable | |
| per cent men: per cent male; AE(L): number local adverse events/number participants; AE(S): number systemic adverse events/number participants; AE: adverse events; BC: baseline comparability; BD: twice daily; BSA: body surface area; FU: follow up (includes TD); N: number enrolled; NA: not applicable; NR: not reported; OD: once daily; PASI: Psoriasis Area and Severity Index; PRN: as required; TD: treatment duration; TSS: Total Severity Score; WA: withdrawal due to adverse events | |||||||
| Study | Reason for exclusion |
| Follow‐up under 12 wks and not focused on adverse events | |
| Not psoriasis, short review (letter) | |
| Not a product included in our review (bexarotene gel 1%) | |
| Not focused on adverse events | |
| Evaluated add‐on clobetasol for participants treated concurrently with topical or systemic therapy | |
| Inadequate reporting of adverse events | |
| Small (N = 54) retrospective study using participant questionnaires ‐ aimed to identify teratogenetic effects of tar, but many women unable to recall whether tar used in pregnancy | |
| Not chronic plaque psoriasis: paediatric dermatology participants had eczema or "eczema–psoriasis overlap (atopic dermatitis with associated features of psoriasis)" | |
| Small uncontrolled short‐term and already reflected in results from main review | |
| Short‐term and already reflected in results from main review | |
| Follow‐up under 12 wks and not focused on adverse events | |
| Case study | |
| Adverse events not reported | |
| Short‐term (4 weeks) and brief mention of adverse events | |
| Short‐term, unclear if psoriasis, small numbers (N = 6) | |
| Participants were healthy volunteers | |
| Not about adverse events | |
| Not about adverse events |
| Study | Methods | Participants | Interventions | Outcomes (compliance | Summary findings | Notes | Allocation concealment |
| DESIGN: uncontrolled study | N: 10 | Topical salicylic acid 6% | Medication adherence: | Medication adherence measured by method 1 (electronic) much lower than by method 2 (patient log) | Sponsorship not reported | D | |
| DESIGN: within‐patient | N: 30 | Topical salicylic acid 6% plus 0.1% tacrolimus ointment BD | Medication adherence: | Adherence decreased over time. On the intervention side, a decrease in adherence rate of 10% was associated with a 1‐point increase in severity (P < 0.05). For the placebo‐treated side, adherence was not significantly correlated with changes in severity. | Sponsored by Fujisawa Healthcare, Inc. and by Wake Forest University School of Medicine. | B | |
| DESIGN: uncontrolled study | N: 29 | 6% salicylic acid gel BD | Impact of office visits on participants' adherence to topical treatment. | Adherence statistically significantly higher at time of office visit. | Sponsored in part by Astellas Pharma US, Inc. | D | |
| DESIGN: between‐patient | N: 881 | Calcipotriol plus reinforcement programme | Reinforcement therapeutic programme to enhance adherence: dermatologist provided participant education with explanation of disease characteristics and treatment efficacy and application, plus written information card | The reinforcement programme had no effect on treatment efficacy | Sponsorship not reported | B | |
| DESIGN: questionnaire survey (observational cross‐sectional study) | N: 1281 | Any antipsoriatic therapy | Compliance measured against PMAQ‐3w scale (patient medication adherence questionnaire): strict adherence to prescribed regimen over previous 3 days and last weekend | 73% reported non‐compliance with current treatment | Sponsorship not reported. | D | |
| DESIGN: open uncontrolled study | N: 109 | Any prescribed antipsoriatic therapy | Medication adherence: number prescribed doses taken/number prescribed doses prescribed (see Zaghloul 2004). | Mean adherence for topical therapy: 72% (31%SD) | Findings relate to any treatment for psoriasis (not just topical therapy) | D | |
| DESIGN: questionnaire survey (cross‐sectional uncontrolled study) | N: 120 | Any antipsoriatic therapy | Per cent complying with treatment (self report): scale not reported | 39 per cent reported non‐compliance (sometimes/never complying) with prescribed treatment. The non‐compliant group had a higher self‐rated disease severity, were younger, and had a younger age at onset. | Sponsorship not reported | D | |
| DESIGN: questionnaire survey (uncontrolled study) BLINDING: NA | N: 972 | Any topical antipsoriatic therapy | Per cent complying with frequency of application of prescribed topical therapies | 29% of responders reported that the prescriber did not specify dosage frequency. | Sponsorship not reported. | D | |
| DESIGN: questionnaire survey (uncontrolled study) | N: 839 | Any antipsoriatic therapy including topical treatments, photo(chemo)therapy and systemic therapy | Per cent complying with duration of prescribed treatment (topical therapies) | Per cent complying with duration of prescribed treatment (topical therapies): 71% | Sponsorship not reported | D | |
| DESIGN: within‐patient (see Notes) | N: 976 | Calcipotriol cream OM plus calcipotriol ointment ON | Compliance: | At wk 3, 72% of participants applied the regimen on most days. By wk 8, this statistic had fallen to 61% | Sponsorship not reported | D | |
| DESIGN: uncontrolled study | N: 294 | Topical, oral, or combined antipsoriatic medication | Medication adherence: | Medication adherence measured by method 1 (objective) much lower than by method 2 (patient self report). Mean rate: 60.6% (33.0%SD); (range: 0% to169%) | Authors report no relevant financial interests | D | |
| per cent men: per cent male; AE(L): number local adverse events/number participants; AE(S): number systemic adverse events/number participants; AE: adverse events; BC: baseline comparability; BD: twice daily; BSA: body surface area; FU: follow up (includes TD); N: number enrolled; NA: not applicable; NR: not reported; OD: once daily; PASI: Psoriasis Area and Severity Index; PRN: as required; TD: treatment duration; TSS: Total Severity Score; WA: withdrawal due to adverse events | |||||||
| Study | Reason for exclusion |
| Adherence not assessed | |
| Treatment guideline (not primary study) | |
| Review/think piece | |
| Review | |
| Study focused on non‐responsive participants rather than those that are specifically non‐compliant | |
| Review | |
| Think piece (not primary study) |
| Outcome or subgroup title | No. of studies | No. of participants | Statistical method | Effect size |
| 1 IAGI Show forest plot | 20 | Std. Mean Difference (IV, Random, 95% CI) | Subtotals only | |
| 1.1 Calcipotriol | 10 | 2287 | Std. Mean Difference (IV, Random, 95% CI) | ‐0.93 [‐1.17, ‐0.68] |
| 1.2 Calcipotriol plus occlusion | 0 | 0 | Std. Mean Difference (IV, Random, 95% CI) | 0.0 [0.0, 0.0] |
| 1.3 Calcitriol | 6 | 1120 | Std. Mean Difference (IV, Random, 95% CI) | ‐1.03 [‐1.71, ‐0.36] |
| 1.4 Tacalcitol | 2 | 433 | Std. Mean Difference (IV, Random, 95% CI) | ‐0.84 [‐1.41, ‐0.26] |
| 1.5 Maxacalcitol | 1 | 103 | Std. Mean Difference (IV, Random, 95% CI) | ‐1.43 [‐1.91, ‐0.96] |
| 1.6 Paricalcitol OD | 1 | 22 | Std. Mean Difference (IV, Random, 95% CI) | ‐1.66 [‐2.66, ‐0.67] |
| 1.7 Becocalcidiol OD | 1 | 121 | Std. Mean Difference (IV, Random, 95% CI) | ‐0.22 [‐0.58, 0.14] |
| 1.8 Becocalcidiol twice daily | 1 | 119 | Std. Mean Difference (IV, Random, 95% CI) | ‐0.67 [‐1.04, ‐0.30] |
| 2 TSS Show forest plot | 19 | Std. Mean Difference (IV, Random, 95% CI) | Subtotals only | |
| 2.1 Calcipotriol | 10 | 1208 | Std. Mean Difference (IV, Random, 95% CI) | ‐1.15 [‐1.41, ‐0.89] |
| 2.2 Calcipotriol plus occlusion | 1 | 187 | Std. Mean Difference (IV, Random, 95% CI) | ‐0.15 [‐0.44, 0.14] |
| 2.3 Calcitriol | 4 | 1027 | Std. Mean Difference (IV, Random, 95% CI) | ‐1.22 [‐2.38, ‐0.07] |
| 2.4 Tacalcitol | 3 | 496 | Std. Mean Difference (IV, Random, 95% CI) | ‐0.66 [‐0.95, ‐0.36] |
| 2.5 Maxacalcitol | 1 | 103 | Std. Mean Difference (IV, Random, 95% CI) | ‐1.61 [‐2.10, ‐1.12] |
| 2.6 Paricalcitol OD | 1 | 22 | Std. Mean Difference (IV, Random, 95% CI) | ‐2.15 [‐3.24, ‐1.06] |
| 2.7 Becocalcidiol OD | 1 | 121 | Std. Mean Difference (IV, Random, 95% CI) | ‐0.02 [‐0.37, 0.34] |
| 2.8 Becocalcidiol twice daily | 1 | 119 | Std. Mean Difference (IV, Random, 95% CI) | ‐0.46 [‐0.83, ‐0.10] |
| 3 PASI Show forest plot | 9 | 2422 | Std. Mean Difference (IV, Random, 95% CI) | ‐0.58 [‐0.71, ‐0.45] |
| 3.1 Calcipotriol | 8 | 2195 | Std. Mean Difference (IV, Random, 95% CI) | ‐0.65 [‐0.75, ‐0.55] |
| 3.2 Calcipotriol plus occlusion | 0 | 0 | Std. Mean Difference (IV, Random, 95% CI) | 0.0 [0.0, 0.0] |
| 3.3 Calcitriol | 0 | 0 | Std. Mean Difference (IV, Random, 95% CI) | 0.0 [0.0, 0.0] |
| 3.4 Tacalcitol | 1 | 227 | Std. Mean Difference (IV, Random, 95% CI) | ‐0.27 [‐0.56, 0.03] |
| 3.5 Maxacalcitol | 0 | 0 | Std. Mean Difference (IV, Random, 95% CI) | 0.0 [0.0, 0.0] |
| 3.6 Paricalcitol OD | 0 | 0 | Std. Mean Difference (IV, Random, 95% CI) | 0.0 [0.0, 0.0] |
| 3.7 Becocalcidiol OD | 0 | 0 | Std. Mean Difference (IV, Random, 95% CI) | 0.0 [0.0, 0.0] |
| 3.8 Becocalcidiol twice daily | 0 | 0 | Std. Mean Difference (IV, Random, 95% CI) | 0.0 [0.0, 0.0] |
| 4 PAGI Show forest plot | 5 | 1467 | Std. Mean Difference (IV, Random, 95% CI) | ‐0.54 [‐0.72, ‐0.36] |
| 4.1 Calcipotriol | 2 | 439 | Std. Mean Difference (IV, Random, 95% CI) | ‐0.64 [‐0.97, ‐0.30] |
| 4.2 Calcipotriol plus occlusion | 0 | 0 | Std. Mean Difference (IV, Random, 95% CI) | 0.0 [0.0, 0.0] |
| 4.3 Calcitriol | 2 | 801 | Std. Mean Difference (IV, Random, 95% CI) | ‐0.59 [‐0.76, ‐0.41] |
| 4.4 Tacalcitol | 1 | 227 | Std. Mean Difference (IV, Random, 95% CI) | ‐0.24 [‐0.53, 0.05] |
| 4.5 Maxacalcitol | 0 | 0 | Std. Mean Difference (IV, Random, 95% CI) | 0.0 [0.0, 0.0] |
| 4.6 Paricalcitol OD | 0 | 0 | Std. Mean Difference (IV, Random, 95% CI) | 0.0 [0.0, 0.0] |
| 4.7 Becocalcidiol OD | 0 | 0 | Std. Mean Difference (IV, Random, 95% CI) | 0.0 [0.0, 0.0] |
| 4.8 Becocalcidiol twice daily | 0 | 0 | Std. Mean Difference (IV, Random, 95% CI) | 0.0 [0.0, 0.0] |
| 5 Combined end point (IAGI/TSS/PASI/PAGI) Show forest plot | 30 | Std. Mean Difference (IV, Random, 95% CI) | Subtotals only | |
| 5.1 Calcipotriol | 17 | 3269 | Std. Mean Difference (IV, Random, 95% CI) | ‐0.96 [‐1.15, ‐0.77] |
| 5.2 Calcipotriol plus occlusion | 1 | 187 | Std. Mean Difference (IV, Random, 95% CI) | ‐0.15 [‐0.44, 0.14] |
| 5.3 Calcitriol | 7 | 1140 | Std. Mean Difference (IV, Random, 95% CI) | ‐0.92 [‐1.54, ‐0.29] |
| 5.4 Tacalcitol | 4 | 723 | Std. Mean Difference (IV, Random, 95% CI) | ‐0.73 [‐1.09, ‐0.37] |
| 5.5 Maxacalcitol | 1 | 103 | Std. Mean Difference (IV, Random, 95% CI) | ‐1.43 [‐1.91, ‐0.96] |
| 5.6 Paricalcitol OD | 1 | 22 | Std. Mean Difference (IV, Random, 95% CI) | ‐1.66 [‐2.66, ‐0.67] |
| 5.7 Becocalcidiol OD | 1 | 121 | Std. Mean Difference (IV, Random, 95% CI) | ‐0.22 [‐0.58, 0.14] |
| 5.8 Becocalcidiol twice daily | 1 | 119 | Std. Mean Difference (IV, Random, 95% CI) | ‐0.67 [‐1.04, ‐0.30] |
| 6 Total withdrawals Show forest plot | 25 | 4715 | Risk Difference (M‐H, Random, 95% CI) | ‐0.02 [‐0.05, 0.00] |
| 6.1 Calcipotriol | 14 | 3132 | Risk Difference (M‐H, Random, 95% CI) | ‐0.03 [‐0.06, 0.00] |
| 6.2 Calcipotriol plus occlusion | 0 | 0 | Risk Difference (M‐H, Random, 95% CI) | 0.0 [0.0, 0.0] |
| 6.3 Calcitriol | 5 | 339 | Risk Difference (M‐H, Random, 95% CI) | ‐0.00 [‐0.02, 0.02] |
| 6.4 Tacalcitol | 4 | 857 | Risk Difference (M‐H, Random, 95% CI) | ‐0.05 [‐0.14, 0.05] |
| 6.5 Maxacalcitol | 1 | 120 | Risk Difference (M‐H, Random, 95% CI) | 0.11 [‐0.01, 0.23] |
| 6.6 Paricalcitol OD | 1 | 22 | Risk Difference (M‐H, Random, 95% CI) | 0.0 [‐0.16, 0.16] |
| 6.7 Becocalcidiol OD | 1 | 124 | Risk Difference (M‐H, Random, 95% CI) | ‐0.01 [‐0.12, 0.11] |
| 6.8 Becocalcidiol twice daily | 1 | 121 | Risk Difference (M‐H, Random, 95% CI) | ‐0.01 [‐0.13, 0.10] |
| 7 Withdrawals due to adverse events Show forest plot | 23 | 4463 | Risk Difference (M‐H, Random, 95% CI) | ‐0.00 [‐0.02, 0.01] |
| 7.1 Calcipotriol | 12 | 2880 | Risk Difference (M‐H, Random, 95% CI) | ‐0.02 [‐0.04, 0.00] |
| 7.2 Calcipotriol plus occlusion | 0 | 0 | Risk Difference (M‐H, Random, 95% CI) | 0.0 [0.0, 0.0] |
| 7.3 Calcitriol | 5 | 339 | Risk Difference (M‐H, Random, 95% CI) | ‐0.00 [‐0.02, 0.02] |
| 7.4 Tacalcitol | 4 | 857 | Risk Difference (M‐H, Random, 95% CI) | 0.00 [‐0.01, 0.02] |
| 7.5 Maxacalcitol | 1 | 120 | Risk Difference (M‐H, Random, 95% CI) | ‐0.01 [‐0.08, 0.06] |
| 7.6 Paricalcitol OD | 1 | 22 | Risk Difference (M‐H, Random, 95% CI) | 0.0 [‐0.16, 0.16] |
| 7.7 Becocalcidiol OD | 1 | 124 | Risk Difference (M‐H, Random, 95% CI) | 0.03 [‐0.02, 0.08] |
| 7.8 Becocalcidiol twice daily | 1 | 121 | Risk Difference (M‐H, Random, 95% CI) | 0.05 [‐0.01, 0.11] |
| 8 Withdrawals due to treatment failure Show forest plot | 14 | 2752 | Risk Difference (M‐H, Random, 95% CI) | ‐0.03 [‐0.05, 0.00] |
| 8.1 Calcipotriol | 7 | 1770 | Risk Difference (M‐H, Random, 95% CI) | ‐0.03 [‐0.08, 0.01] |
| 8.2 Calcipotriol plus occlusion | 0 | 0 | Risk Difference (M‐H, Random, 95% CI) | 0.0 [0.0, 0.0] |
| 8.3 Calcitriol | 4 | 281 | Risk Difference (M‐H, Random, 95% CI) | ‐0.03 [‐0.12, 0.05] |
| 8.4 Tacalcitol | 1 | 314 | Risk Difference (M‐H, Random, 95% CI) | 0.0 [‐0.01, 0.01] |
| 8.5 Maxacalcitol | 1 | 120 | Risk Difference (M‐H, Random, 95% CI) | ‐0.03 [‐0.11, 0.04] |
| 8.6 Paricalcitol OD | 1 | 22 | Risk Difference (M‐H, Random, 95% CI) | 0.0 [‐0.16, 0.16] |
| 8.7 Becocalcidiol OD | 1 | 124 | Risk Difference (M‐H, Random, 95% CI) | ‐0.02 [‐0.07, 0.04] |
| 8.8 Becocalcidiol twice daily | 1 | 121 | Risk Difference (M‐H, Random, 95% CI) | ‐0.03 [‐0.09, 0.02] |
| 9 Adverse events (local) Show forest plot | 19 | 4402 | Risk Difference (M‐H, Random, 95% CI) | 0.00 [‐0.01, 0.02] |
| 9.1 Calcipotriol | 11 | 2652 | Risk Difference (M‐H, Random, 95% CI) | 0.01 [‐0.03, 0.05] |
| 9.2 Calcipotriol plus occlusion | 0 | 0 | Risk Difference (M‐H, Random, 95% CI) | 0.0 [0.0, 0.0] |
| 9.3 Calcitriol | 4 | 917 | Risk Difference (M‐H, Random, 95% CI) | ‐0.01 [‐0.03, 0.02] |
| 9.4 Tacalcitol | 2 | 566 | Risk Difference (M‐H, Random, 95% CI) | ‐0.00 [‐0.03, 0.03] |
| 9.5 Maxacalcitol | 0 | 0 | Risk Difference (M‐H, Random, 95% CI) | 0.0 [0.0, 0.0] |
| 9.6 Paricalcitol OD | 1 | 22 | Risk Difference (M‐H, Random, 95% CI) | 0.0 [‐0.16, 0.16] |
| 9.7 Becocalcidiol OD | 1 | 124 | Risk Difference (M‐H, Random, 95% CI) | 0.01 [‐0.06, 0.08] |
| 9.8 Becocalcidiol twice daily | 1 | 121 | Risk Difference (M‐H, Random, 95% CI) | 0.10 [0.00, 0.19] |
| 10 Adverse events (systemic) Show forest plot | 14 | 2463 | Risk Difference (M‐H, Random, 95% CI) | 0.0 [‐0.01, 0.01] |
| 10.1 Calcipotriol | 8 | 1182 | Risk Difference (M‐H, Random, 95% CI) | 0.0 [‐0.01, 0.01] |
| 10.2 Calcipotriol plus occlusion | 0 | 0 | Risk Difference (M‐H, Random, 95% CI) | 0.0 [0.0, 0.0] |
| 10.3 Calcitriol | 3 | 647 | Risk Difference (M‐H, Random, 95% CI) | 0.0 [‐0.01, 0.01] |
| 10.4 Tacalcitol | 1 | 244 | Risk Difference (M‐H, Random, 95% CI) | 0.0 [‐0.02, 0.02] |
| 10.5 Maxacalcitol | 1 | 120 | Risk Difference (M‐H, Random, 95% CI) | 0.0 [‐0.05, 0.05] |
| 10.6 Paricalcitol OD | 1 | 22 | Risk Difference (M‐H, Random, 95% CI) | 0.0 [‐0.16, 0.16] |
| 10.7 Becocalcidiol OD | 1 | 124 | Risk Difference (M‐H, Random, 95% CI) | 0.0 [‐0.03, 0.03] |
| 10.8 Becocalcidiol twice daily | 1 | 124 | Risk Difference (M‐H, Random, 95% CI) | 0.0 [‐0.03, 0.03] |
| Outcome or subgroup title | No. of studies | No. of participants | Statistical method | Effect size |
| 1 IAGI Show forest plot | 11 | 1904 | Std. Mean Difference (IV, Random, 95% CI) | 1.00 [‐1.18, ‐0.82] |
| 1.1 Betamethasone dipropionate OD | 2 | 739 | Std. Mean Difference (IV, Random, 95% CI) | ‐0.81 [‐0.98, ‐0.64] |
| 1.2 Betamethasone dipropionate twice daily | 4 | 537 | Std. Mean Difference (IV, Random, 95% CI) | ‐1.35 [‐1.56, ‐1.15] |
| 1.3 Betamethasone dipropionate, maintenance | 0 | 0 | Std. Mean Difference (IV, Random, 95% CI) | 0.0 [0.0, 0.0] |
| 1.4 Betamethasone valerate | 1 | 74 | Std. Mean Difference (IV, Random, 95% CI) | ‐1.41 [‐1.92, ‐0.90] |
| 1.5 Budesonide | 0 | 0 | Std. Mean Difference (IV, Random, 95% CI) | 0.0 [0.0, 0.0] |
| 1.6 Desonide | 1 | 76 | Std. Mean Difference (IV, Random, 95% CI) | ‐0.81 [‐1.34, ‐0.28] |
| 1.7 Diflorasone diacetate | 0 | 0 | Std. Mean Difference (IV, Random, 95% CI) | 0.0 [0.0, 0.0] |
| 1.8 Fluticasone propionate | 2 | 383 | Std. Mean Difference (IV, Random, 95% CI) | ‐0.93 [‐1.14, ‐0.72] |
| 1.9 Hydrocortisone buteprate | 0 | 0 | Std. Mean Difference (IV, Random, 95% CI) | 0.0 [0.0, 0.0] |
| 1.10 Mometasone furoate | 1 | 95 | Std. Mean Difference (IV, Random, 95% CI) | ‐0.75 [‐1.17, ‐0.34] |
| 2 TSS Show forest plot | 7 | 611 | Std. Mean Difference (IV, Random, 95% CI) | ‐0.77 [‐1.01, ‐0.52] |
| 2.1 Betamethasone dipropionate OD | 1 | 93 | Std. Mean Difference (IV, Random, 95% CI) | ‐0.74 [‐1.16, ‐0.32] |
| 2.2 Betamethasone dipropionate twice daily | 1 | 33 | Std. Mean Difference (IV, Random, 95% CI) | ‐0.77 [‐1.48, ‐0.06] |
| 2.3 Betamethasone dipropionate, maintenance | 1 | 38 | Std. Mean Difference (IV, Random, 95% CI) | ‐0.95 [‐1.62, ‐0.27] |
| 2.4 Betamethasone valerate | 1 | 22 | Std. Mean Difference (IV, Random, 95% CI) | ‐1.09 [‐2.00, ‐0.18] |
| 2.5 Budesonide | 0 | 0 | Std. Mean Difference (IV, Random, 95% CI) | 0.0 [0.0, 0.0] |
| 2.6 Desonide | 1 | 76 | Std. Mean Difference (IV, Random, 95% CI) | ‐1.16 [‐1.70, ‐0.61] |
| 2.7 Diflorasone diacetate | 1 | 93 | Std. Mean Difference (IV, Random, 95% CI) | ‐0.32 [‐0.73, 0.09] |
| 2.8 Fluticasone propionate | 0 | 0 | Std. Mean Difference (IV, Random, 95% CI) | 0.0 [0.0, 0.0] |
| 2.9 Hydrocortisone buteprate | 1 | 161 | Std. Mean Difference (IV, Random, 95% CI) | ‐0.46 [‐0.77, ‐0.15] |
| 2.10 Mometasone furoate | 1 | 95 | Std. Mean Difference (IV, Random, 95% CI) | ‐1.12 [‐1.55, ‐0.68] |
| 3 PASI Show forest plot | 3 | 1158 | Std. Mean Difference (IV, Random, 95% CI) | ‐0.97 [‐1.31, ‐0.62] |
| 3.1 Betamethasone dipropionate OD | 2 | 739 | Std. Mean Difference (IV, Random, 95% CI) | ‐0.79 [‐1.44, ‐0.14] |
| 3.2 Betamethasone dipropionate twice daily | 1 | 419 | Std. Mean Difference (IV, Random, 95% CI) | ‐1.21 [‐1.44, ‐0.97] |
| 3.3 Betamethasone dipropionate, maintenance | 0 | 0 | Std. Mean Difference (IV, Random, 95% CI) | 0.0 [0.0, 0.0] |
| 3.4 Betamethasone valerate | 0 | 0 | Std. Mean Difference (IV, Random, 95% CI) | 0.0 [0.0, 0.0] |
| 3.5 Budesonide | 0 | 0 | Std. Mean Difference (IV, Random, 95% CI) | 0.0 [0.0, 0.0] |
| 3.6 Desonide | 0 | 0 | Std. Mean Difference (IV, Random, 95% CI) | 0.0 [0.0, 0.0] |
| 3.7 Diflorasone diacetate | 0 | 0 | Std. Mean Difference (IV, Random, 95% CI) | 0.0 [0.0, 0.0] |
| 3.8 Fluticasone propionate | 0 | 0 | Std. Mean Difference (IV, Random, 95% CI) | 0.0 [0.0, 0.0] |
| 3.9 Hydrocortisone buteprate | 0 | 0 | Std. Mean Difference (IV, Random, 95% CI) | 0.0 [0.0, 0.0] |
| 3.10 Mometasone furoate | 0 | 0 | Std. Mean Difference (IV, Random, 95% CI) | 0.0 [0.0, 0.0] |
| 4 PAGI | 0 | 0 | Std. Mean Difference (IV, Random, 95% CI) | 0.0 [0.0, 0.0] |
| 4.1 Betamethasone dipropionate OD | 0 | 0 | Std. Mean Difference (IV, Random, 95% CI) | 0.0 [0.0, 0.0] |
| 4.2 Betamethasone dipropionate twice daily | 0 | 0 | Std. Mean Difference (IV, Random, 95% CI) | 0.0 [0.0, 0.0] |
| 4.3 Betamethasone dipropionate, maintenance | 0 | 0 | Std. Mean Difference (IV, Random, 95% CI) | 0.0 [0.0, 0.0] |
| 4.4 Betamethasone valerate | 0 | 0 | Std. Mean Difference (IV, Random, 95% CI) | 0.0 [0.0, 0.0] |
| 4.5 Budesonide | 0 | 0 | Std. Mean Difference (IV, Random, 95% CI) | 0.0 [0.0, 0.0] |
| 4.6 Desonide | 0 | 0 | Std. Mean Difference (IV, Random, 95% CI) | 0.0 [0.0, 0.0] |
| 4.7 Diflorasone diacetate | 0 | 0 | Std. Mean Difference (IV, Random, 95% CI) | 0.0 [0.0, 0.0] |
| 4.8 Fluticasone propionate | 0 | 0 | Std. Mean Difference (IV, Random, 95% CI) | 0.0 [0.0, 0.0] |
| 4.9 Hydrocortisone buteprate | 0 | 0 | Std. Mean Difference (IV, Random, 95% CI) | 0.0 [0.0, 0.0] |
| 4.10 Mometasone furoate | 0 | 0 | Std. Mean Difference (IV, Random, 95% CI) | 0.0 [0.0, 0.0] |
| 5 Combined end point (IAGI/TSS/PASI/PAGI) Show forest plot | 15 | 2311 | Std. Mean Difference (IV, Random, 95% CI) | ‐0.89 [‐1.06, ‐0.72] |
| 5.1 Betamethasone dipropionate OD | 3 | 832 | Std. Mean Difference (IV, Random, 95% CI) | ‐0.80 [‐0.96, ‐0.64] |
| 5.2 Betamethasone dipropionate twice daily | 4 | 537 | Std. Mean Difference (IV, Random, 95% CI) | ‐1.35 [‐1.56, ‐1.15] |
| 5.3 Betamethasone dipropionate, maintenance | 1 | 38 | Std. Mean Difference (IV, Random, 95% CI) | ‐0.95 [‐1.62, ‐0.27] |
| 5.4 Betamethasone valerate | 2 | 96 | Std. Mean Difference (IV, Random, 95% CI) | ‐1.33 [‐1.78, ‐0.89] |
| 5.5 Budesonide | 0 | 0 | Std. Mean Difference (IV, Random, 95% CI) | 0.0 [0.0, 0.0] |
| 5.6 Desonide | 1 | 76 | Std. Mean Difference (IV, Random, 95% CI) | ‐0.81 [‐1.34, ‐0.28] |
| 5.7 Diflorasone diacetate | 1 | 93 | Std. Mean Difference (IV, Random, 95% CI) | ‐0.32 [‐0.73, 0.09] |
| 5.8 Fluticasone propionate | 2 | 383 | Std. Mean Difference (IV, Random, 95% CI) | ‐0.93 [‐1.14, ‐0.72] |
| 5.9 Hydrocortisone buteprate | 1 | 161 | Std. Mean Difference (IV, Random, 95% CI) | ‐0.46 [‐0.77, ‐0.15] |
| 5.10 Mometasone furoate | 1 | 95 | Std. Mean Difference (IV, Random, 95% CI) | ‐0.75 [‐1.17, ‐0.34] |
| 6 Total withdrawals Show forest plot | 9 | 1673 | Risk Difference (M‐H, Random, 95% CI) | ‐0.14 [‐0.22, ‐0.05] |
| 6.1 Betamethasone dipropionate OD | 2 | 756 | Risk Difference (M‐H, Random, 95% CI) | ‐0.16 [‐0.28, ‐0.04] |
| 6.2 Betamethasone dipropionate twice daily | 1 | 421 | Risk Difference (M‐H, Random, 95% CI) | ‐0.06 [‐0.12, 0.01] |
| 6.3 Betamethasone dipropionate, maintenance | 2 | 134 | Risk Difference (M‐H, Random, 95% CI) | ‐0.45 [‐0.60, ‐0.30] |
| 6.4 Betamethasone valerate | 1 | 80 | Risk Difference (M‐H, Random, 95% CI) | 0.0 [‐0.12, 0.12] |
| 6.5 Budesonide | 1 | 22 | Risk Difference (M‐H, Random, 95% CI) | 0.0 [‐0.16, 0.16] |
| 6.6 Desonide | 1 | 80 | Risk Difference (M‐H, Random, 95% CI) | ‐0.18 [‐0.38, 0.02] |
| 6.7 Diflorasone diacetate | 0 | 0 | Risk Difference (M‐H, Random, 95% CI) | 0.0 [0.0, 0.0] |
| 6.8 Fluticasone propionate | 0 | 0 | Risk Difference (M‐H, Random, 95% CI) | 0.0 [0.0, 0.0] |
| 6.9 Hydrocortisone buteprate | 1 | 180 | Risk Difference (M‐H, Random, 95% CI) | 0.00 [‐0.09, 0.10] |
| 6.10 Mometasone furoate | 0 | 0 | Risk Difference (M‐H, Random, 95% CI) | 0.0 [0.0, 0.0] |
| 7 Withdrawals due to adverse events Show forest plot | 9 | 1292 | Risk Difference (M‐H, Random, 95% CI) | ‐0.01 [‐0.05, 0.02] |
| 7.1 Betamethasone dipropionate OD | 1 | 633 | Risk Difference (M‐H, Random, 95% CI) | ‐0.07 [‐0.11, ‐0.02] |
| 7.2 Betamethasone dipropionate twice daily | 1 | 33 | Risk Difference (M‐H, Random, 95% CI) | 0.0 [‐0.11, 0.11] |
| 7.3 Betamethasone dipropionate, maintenance | 2 | 134 | Risk Difference (M‐H, Random, 95% CI) | 0.0 [‐0.04, 0.04] |
| 7.4 Betamethasone valerate | 1 | 80 | Risk Difference (M‐H, Random, 95% CI) | 0.08 [‐0.02, 0.17] |
| 7.5 Budesonide | 1 | 22 | Risk Difference (M‐H, Random, 95% CI) | 0.0 [‐0.16, 0.16] |
| 7.6 Desonide | 1 | 80 | Risk Difference (M‐H, Random, 95% CI) | ‐0.1 [‐0.24, 0.04] |
| 7.7 Diflorasone diacetate | 0 | 0 | Risk Difference (M‐H, Random, 95% CI) | 0.0 [0.0, 0.0] |
| 7.8 Fluticasone propionate | 0 | 0 | Risk Difference (M‐H, Random, 95% CI) | 0.0 [0.0, 0.0] |
| 7.9 Hydrocortisone buteprate | 1 | 190 | Risk Difference (M‐H, Random, 95% CI) | 0.01 [‐0.02, 0.04] |
| 7.10 Mometasone furoate | 1 | 120 | Risk Difference (M‐H, Random, 95% CI) | ‐0.05 [‐0.11, 0.01] |
| 8 Withdrawals due to treatment failure Show forest plot | 6 | Risk Difference (M‐H, Random, 95% CI) | Subtotals only | |
| 8.1 Betamethasone dipropionate OD | 0 | 0 | Risk Difference (M‐H, Random, 95% CI) | 0.0 [0.0, 0.0] |
| 8.2 Betamethasone dipropionate twice daily | 0 | 0 | Risk Difference (M‐H, Random, 95% CI) | 0.0 [0.0, 0.0] |
| 8.3 Betamethasone dipropionate, maintenance | 2 | 130 | Risk Difference (M‐H, Random, 95% CI) | ‐0.46 [‐0.61, ‐0.31] |
| 8.4 Betamethasone valerate | 1 | 80 | Risk Difference (M‐H, Random, 95% CI) | 0.0 [‐0.05, 0.05] |
| 8.5 Budesonide | 1 | 22 | Risk Difference (M‐H, Random, 95% CI) | 0.0 [‐0.16, 0.16] |
| 8.6 Desonide | 1 | 80 | Risk Difference (M‐H, Random, 95% CI) | 0.0 [‐0.07, 0.07] |
| 8.7 Diflorasone diacetate | 0 | 0 | Risk Difference (M‐H, Random, 95% CI) | 0.0 [0.0, 0.0] |
| 8.8 Fluticasone propionate | 0 | 0 | Risk Difference (M‐H, Random, 95% CI) | 0.0 [0.0, 0.0] |
| 8.9 Hydrocortisone buteprate | 1 | 190 | Risk Difference (M‐H, Random, 95% CI) | 0.0 [‐0.02, 0.02] |
| 8.10 Mometasone furoate | 0 | 0 | Risk Difference (M‐H, Random, 95% CI) | 0.0 [0.0, 0.0] |
| 9 Adverse events (local) Show forest plot | 10 | 2117 | Risk Difference (M‐H, Random, 95% CI) | ‐0.04 [‐0.08, ‐0.00] |
| 9.1 Betamethasone dipropionate OD | 2 | 756 | Risk Difference (M‐H, Random, 95% CI) | ‐0.10 [‐0.15, ‐0.04] |
| 9.2 Betamethasone dipropionate twice daily | 2 | 454 | Risk Difference (M‐H, Random, 95% CI) | ‐0.05 [‐0.12, 0.03] |
| 9.3 Betamethasone dipropionate, maintenance | 2 | 134 | Risk Difference (M‐H, Random, 95% CI) | 0.0 [‐0.04, 0.04] |
| 9.4 Betamethasone valerate | 0 | 0 | Risk Difference (M‐H, Random, 95% CI) | 0.0 [0.0, 0.0] |
| 9.5 Budesonide | 0 | 0 | Risk Difference (M‐H, Random, 95% CI) | 0.0 [0.0, 0.0] |
| 9.6 Desonide | 1 | 80 | Risk Difference (M‐H, Random, 95% CI) | 0.0 [‐0.11, 0.11] |
| 9.7 Diflorasone diacetate | 0 | 0 | Risk Difference (M‐H, Random, 95% CI) | 0.0 [0.0, 0.0] |
| 9.8 Fluticasone propionate | 1 | 383 | Risk Difference (M‐H, Random, 95% CI) | 0.00 [‐0.05, 0.05] |
| 9.9 Hydrocortisone buteprate | 1 | 190 | Risk Difference (M‐H, Random, 95% CI) | ‐0.06 [‐0.18, 0.07] |
| 9.10 Mometasone furoate | 1 | 120 | Risk Difference (M‐H, Random, 95% CI) | ‐0.10 [‐0.23, 0.02] |
| 10 Adverse events (systemic) Show forest plot | 4 | 675 | Risk Difference (M‐H, Random, 95% CI) | 0.00 [‐0.01, 0.01] |
| 10.1 Betamethasone dipropionate OD | 0 | 0 | Risk Difference (M‐H, Random, 95% CI) | 0.0 [0.0, 0.0] |
| 10.2 Betamethasone dipropionate twice daily | 1 | 421 | Risk Difference (M‐H, Random, 95% CI) | 0.0 [‐0.01, 0.01] |
| 10.3 Betamethasone dipropionate, maintenance | 2 | 134 | Risk Difference (M‐H, Random, 95% CI) | 0.01 [‐0.07, 0.10] |
| 10.4 Budesonide | 0 | 0 | Risk Difference (M‐H, Random, 95% CI) | 0.0 [0.0, 0.0] |
| 10.5 Desonide | 0 | 0 | Risk Difference (M‐H, Random, 95% CI) | 0.0 [0.0, 0.0] |
| 10.6 Diflorasone diacetate | 0 | 0 | Risk Difference (M‐H, Random, 95% CI) | 0.0 [0.0, 0.0] |
| 10.7 Fluticasone propionate | 0 | 0 | Risk Difference (M‐H, Random, 95% CI) | 0.0 [0.0, 0.0] |
| 10.8 Hydrocortisone buteprate | 0 | 0 | Risk Difference (M‐H, Random, 95% CI) | 0.0 [0.0, 0.0] |
| 10.9 Betamethasone valerate | 0 | 0 | Risk Difference (M‐H, Random, 95% CI) | 0.0 [0.0, 0.0] |
| 10.10 Mometasone furoate | 1 | 120 | Risk Difference (M‐H, Random, 95% CI) | 0.0 [‐0.03, 0.03] |
| Outcome or subgroup title | No. of studies | No. of participants | Statistical method | Effect size |
| 1 IAGI Show forest plot | 5 | 540 | Std. Mean Difference (IV, Random, 95% CI) | ‐1.87 [‐2.38, ‐1.36] |
| 1.1 Clobetasol propionate | 4 | 471 | Std. Mean Difference (IV, Random, 95% CI) | ‐1.89 [‐2.53, ‐1.24] |
| 1.2 Halcinonide | 0 | 0 | Std. Mean Difference (IV, Random, 95% CI) | 0.0 [0.0, 0.0] |
| 1.3 Halobetasol | 1 | 69 | Std. Mean Difference (IV, Random, 95% CI) | ‐1.81 [‐2.37, ‐1.24] |
| 2 TSS Show forest plot | 3 | 545 | Std. Mean Difference (IV, Random, 95% CI) | ‐1.35 [‐1.80, ‐0.89] |
| 2.1 Clobetasol propionate | 3 | 545 | Std. Mean Difference (IV, Random, 95% CI) | ‐1.35 [‐1.80, ‐0.89] |
| 2.2 Halcinonide | 0 | 0 | Std. Mean Difference (IV, Random, 95% CI) | 0.0 [0.0, 0.0] |
| 2.3 Halobetasol | 0 | 0 | Std. Mean Difference (IV, Random, 95% CI) | 0.0 [0.0, 0.0] |
| 3 PASI | 0 | 0 | Std. Mean Difference (IV, Random, 95% CI) | 0.0 [0.0, 0.0] |
| 3.1 Clobetasol propionate | 0 | 0 | Std. Mean Difference (IV, Random, 95% CI) | 0.0 [0.0, 0.0] |
| 3.2 Halcinonide | 0 | 0 | Std. Mean Difference (IV, Random, 95% CI) | 0.0 [0.0, 0.0] |
| 3.3 Halobetasol | 0 | 0 | Std. Mean Difference (IV, Random, 95% CI) | 0.0 [0.0, 0.0] |
| 4 PAGI Show forest plot | 3 | 487 | Std. Mean Difference (IV, Random, 95% CI) | ‐1.22 [‐1.42, ‐1.02] |
| 4.1 Clobetasol propionate | 1 | 79 | Std. Mean Difference (IV, Random, 95% CI) | ‐1.01 [‐1.55, ‐0.47] |
| 4.2 Halcinonide | 0 | 0 | Std. Mean Difference (IV, Random, 95% CI) | 0.0 [0.0, 0.0] |
| 4.3 Halobetasol | 2 | 408 | Std. Mean Difference (IV, Random, 95% CI) | ‐1.25 [‐1.46, ‐1.04] |
| 5 Combined end point (IAGI/TSS/PASI/PAGI) Show forest plot | 10 | 1493 | Std. Mean Difference (IV, Random, 95% CI) | ‐1.56 [‐1.87, ‐1.26] |
| 5.1 Clobetasol propionate | 7 | 1016 | Std. Mean Difference (IV, Random, 95% CI) | ‐1.65 [‐2.10, ‐1.20] |
| 5.2 Halcinonide | 0 | 0 | Std. Mean Difference (IV, Random, 95% CI) | 0.0 [0.0, 0.0] |
| 5.3 Halobetasol | 3 | 477 | Std. Mean Difference (IV, Random, 95% CI) | ‐1.36 [‐1.65, ‐1.07] |
| 6 Total withdrawals Show forest plot | 8 | 1181 | Risk Difference (M‐H, Random, 95% CI) | ‐0.05 [‐0.10, 0.01] |
| 6.1 Clobetasol propionate | 7 | 1037 | Risk Difference (M‐H, Random, 95% CI) | ‐0.06 [‐0.13, 0.01] |
| 6.2 Halcinonide | 0 | 0 | Risk Difference (M‐H, Random, 95% CI) | 0.0 [0.0, 0.0] |
| 6.3 Halobetasol | 1 | 144 | Risk Difference (M‐H, Random, 95% CI) | 0.0 [‐0.03, 0.03] |
| 7 Withdrawals due to adverse events Show forest plot | 10 | 1601 | Risk Difference (M‐H, Random, 95% CI) | ‐0.00 [‐0.01, 0.01] |
| 7.1 Clobetasol propionate | 7 | 1037 | Risk Difference (M‐H, Random, 95% CI) | ‐0.00 [‐0.02, 0.01] |
| 7.2 Halcinonide | 0 | 0 | Risk Difference (M‐H, Random, 95% CI) | 0.0 [0.0, 0.0] |
| 7.3 Halobetasol | 3 | 564 | Risk Difference (M‐H, Random, 95% CI) | 0.0 [‐0.01, 0.01] |
| 8 Withdrawals due to treatment failure Show forest plot | 8 | 1189 | Risk Difference (M‐H, Random, 95% CI) | ‐0.00 [‐0.02, 0.01] |
| 8.1 Clobetasol propionate | 6 | 845 | Risk Difference (M‐H, Random, 95% CI) | ‐0.01 [‐0.03, 0.01] |
| 8.2 Halcinonide | 0 | 0 | Risk Difference (M‐H, Random, 95% CI) | 0.0 [0.0, 0.0] |
| 8.3 Halobetasol | 2 | 344 | Risk Difference (M‐H, Random, 95% CI) | 0.0 [‐0.02, 0.02] |
| 9 Adverse events (local) Show forest plot | 8 | 1265 | Risk Difference (M‐H, Random, 95% CI) | 0.00 [‐0.02, 0.02] |
| 9.1 Clobetasol propionate | 6 | 845 | Risk Difference (M‐H, Random, 95% CI) | 0.00 [‐0.03, 0.03] |
| 9.2 Halcinonide | 0 | 0 | Risk Difference (M‐H, Random, 95% CI) | 0.0 [0.0, 0.0] |
| 9.3 Halobetasol | 2 | 420 | Risk Difference (M‐H, Random, 95% CI) | 0.0 [‐0.02, 0.02] |
| 10 Adverse events (systemic) Show forest plot | 6 | 1056 | Risk Difference (M‐H, Random, 95% CI) | ‐0.00 [‐0.01, 0.01] |
| 10.1 Clobetasol propionate | 3 | 480 | Risk Difference (M‐H, Random, 95% CI) | ‐0.01 [‐0.02, 0.01] |
| 10.2 Halcinonide | 1 | 156 | Risk Difference (M‐H, Random, 95% CI) | 0.0 [‐0.02, 0.02] |
| 10.3 Halobetasol | 2 | 420 | Risk Difference (M‐H, Random, 95% CI) | 0.0 [‐0.01, 0.01] |
| Outcome or subgroup title | No. of studies | No. of participants | Statistical method | Effect size |
| 1 IAGI | 0 | 0 | Std. Mean Difference (IV, Random, 95% CI) | 0.0 [0.0, 0.0] |
| 2 TSS Show forest plot | 3 | 94 | Std. Mean Difference (IV, Random, 95% CI) | ‐1.06 [‐1.66, ‐0.46] |
| 3 PASI | 0 | 0 | Std. Mean Difference (IV, Random, 95% CI) | 0.0 [0.0, 0.0] |
| 4 PAGI | 0 | 0 | Std. Mean Difference (IV, Random, 95% CI) | 0.0 [0.0, 0.0] |
| 5 Combined end point (IAGI/TSS/PASI/PAGI) Show forest plot | 3 | 94 | Std. Mean Difference (IV, Random, 95% CI) | ‐1.06 [‐1.66, ‐0.46] |
| 6 Total withdrawals Show forest plot | 4 | 124 | Risk Difference (M‐H, Random, 95% CI) | 0.0 [‐0.09, 0.09] |
| 7 Withdrawals due to adverse events Show forest plot | 3 | 104 | Risk Difference (M‐H, Random, 95% CI) | 0.0 [‐0.05, 0.05] |
| 8 Withdrawals due to treatment failure Show forest plot | 2 | 44 | Risk Difference (M‐H, Random, 95% CI) | 0.0 [‐0.11, 0.11] |
| 9 Adverse events (local) Show forest plot | 3 | 94 | Risk Difference (M‐H, Random, 95% CI) | 0.26 [‐0.30, 0.82] |
| 10 Adverse events (systemic) Show forest plot | 1 | 20 | Risk Difference (M‐H, Random, 95% CI) | 0.0 [‐0.35, 0.35] |
| Outcome or subgroup title | No. of studies | No. of participants | Statistical method | Effect size |
| 1 IAGI Show forest plot | 5 | 2264 | Std. Mean Difference (IV, Random, 95% CI) | ‐1.44 [‐1.76, ‐1.12] |
| 1.1 Combination calcipotriol/betamethasone dipropionate, once daily | 4 | 1416 | Std. Mean Difference (IV, Random, 95% CI) | ‐1.21 [‐1.50, ‐0.91] |
| 1.2 Combination calcipotriol/betamethasone dipropionate, twice daily | 2 | 848 | Std. Mean Difference (IV, Random, 95% CI) | ‐1.90 [‐2.09, ‐1.71] |
| 2 TSS | 0 | 0 | Std. Mean Difference (IV, Random, 95% CI) | 0.0 [0.0, 0.0] |
| 2.1 Combination calcipotriol/betamethasone dipropionate, once daily | 0 | 0 | Std. Mean Difference (IV, Random, 95% CI) | 0.0 [0.0, 0.0] |
| 2.2 Combination calcipotriol/betamethasone dipropionate, twice daily | 0 | 0 | Std. Mean Difference (IV, Random, 95% CI) | 0.0 [0.0, 0.0] |
| 3 PASI Show forest plot | 5 | 2263 | Std. Mean Difference (IV, Random, 95% CI) | ‐1.24 [‐1.53, ‐0.95] |
| 3.1 Combination calcipotriol/betamethasone dipropionate, once daily | 4 | 1414 | Std. Mean Difference (IV, Random, 95% CI) | ‐1.14 [‐1.57, ‐0.70] |
| 3.2 Combination calcipotriol/betamethasone dipropionate, twice daily | 2 | 849 | Std. Mean Difference (IV, Random, 95% CI) | ‐1.41 [‐1.86, ‐0.97] |
| 4 PAGI Show forest plot | 1 | Std. Mean Difference (IV, Random, 95% CI) | Totals not selected | |
| 4.1 Combination calcipotriol/betamethasone dipropionate, once daily | 1 | Std. Mean Difference (IV, Random, 95% CI) | 0.0 [0.0, 0.0] | |
| 4.2 Combination calcipotriol/betamethasone dipropionate, twice daily | 0 | Std. Mean Difference (IV, Random, 95% CI) | 0.0 [0.0, 0.0] | |
| 5 Combined end point (IAGI/TSS/PASI/PAGI) Show forest plot | 5 | 2264 | Std. Mean Difference (IV, Random, 95% CI) | ‐1.44 [‐1.76, ‐1.12] |
| 5.1 Combination calcipotriol/betamethasone dipropionate, once daily | 4 | 1416 | Std. Mean Difference (IV, Random, 95% CI) | ‐1.21 [‐1.50, ‐0.91] |
| 5.2 Combination calcipotriol/betamethasone dipropionate, twice daily | 2 | 848 | Std. Mean Difference (IV, Random, 95% CI) | ‐1.90 [‐2.09, ‐1.71] |
| 6 Total withdrawals Show forest plot | 5 | 2340 | Risk Difference (M‐H, Random, 95% CI) | ‐0.12 [‐0.17, ‐0.07] |
| 6.1 Combination calcipotriol/betamethasone dipropionate, once daily | 4 | 1483 | Risk Difference (M‐H, Random, 95% CI) | ‐0.15 [‐0.22, ‐0.09] |
| 6.2 Combination calcipotriol/betamethasone dipropionate, twice daily | 2 | 857 | Risk Difference (M‐H, Random, 95% CI) | ‐0.07 [‐0.12, ‐0.03] |
| 7 Withdrawals due to adverse events Show forest plot | 3 | 1723 | Risk Difference (M‐H, Random, 95% CI) | ‐0.07 [‐0.11, ‐0.04] |
| 7.1 Combination calcipotriol/betamethasone dipropionate, once daily | 3 | 1280 | Risk Difference (M‐H, Random, 95% CI) | ‐0.07 [‐0.11, ‐0.03] |
| 7.2 Combination calcipotriol/betamethasone dipropionate, twice daily | 1 | 443 | Risk Difference (M‐H, Random, 95% CI) | ‐0.10 [‐0.14, ‐0.05] |
| 8 Withdrawals due to treatment failure Show forest plot | 1 | 802 | Risk Difference (M‐H, Random, 95% CI) | ‐0.09 [‐0.12, ‐0.06] |
| 8.1 Combination calcipotriol/betamethasone dipropionate, once daily | 1 | 359 | Risk Difference (M‐H, Random, 95% CI) | ‐0.09 [‐0.13, ‐0.05] |
| 8.2 Combination calcipotriol/betamethasone dipropionate, twice daily | 1 | 443 | Risk Difference (M‐H, Random, 95% CI) | ‐0.09 [‐0.13, ‐0.05] |
| 9 Adverse events (local) Show forest plot | 5 | 2334 | Risk Difference (M‐H, Random, 95% CI) | ‐0.05 [‐0.08, ‐0.02] |
| 9.1 Combination calcipotriol/betamethasone dipropionate, once daily | 4 | 1479 | Risk Difference (M‐H, Random, 95% CI) | ‐0.07 [‐0.11, ‐0.02] |
| 9.2 Combination calcipotriol/betamethasone dipropionate, twice daily | 2 | 855 | Risk Difference (M‐H, Random, 95% CI) | ‐0.03 [‐0.08, 0.01] |
| 10 Adverse events (systemic) Show forest plot | 1 | 412 | Risk Difference (M‐H, Random, 95% CI) | 0.0 [‐0.01, 0.01] |
| 10.1 Combination calcipotriol/betamethasone dipropionate, once daily | 0 | 0 | Risk Difference (M‐H, Random, 95% CI) | 0.0 [0.0, 0.0] |
| 10.2 Combination calcipotriol/betamethasone dipropionate, twice daily | 1 | 412 | Risk Difference (M‐H, Random, 95% CI) | 0.0 [‐0.01, 0.01] |
| Outcome or subgroup title | No. of studies | No. of participants | Statistical method | Effect size |
| 1 IAGI Show forest plot | 8 | Std. Mean Difference (IV, Random, 95% CI) | Totals not selected | |
| 1.1 Aloe vera extract 0.5% hydrophilic cream, three times per day | 0 | Std. Mean Difference (IV, Random, 95% CI) | 0.0 [0.0, 0.0] | |
| 1.2 Anti‐IL‐8 monoclonal antibody cream | 1 | Std. Mean Difference (IV, Random, 95% CI) | 0.0 [0.0, 0.0] | |
| 1.3 Betamethasone 17‐valerate 21‐acetate plus tretinoin plus salicylic acid | 1 | Std. Mean Difference (IV, Random, 95% CI) | 0.0 [0.0, 0.0] | |
| 1.4 Caffeine (topical) 10%, TD | 0 | Std. Mean Difference (IV, Random, 95% CI) | 0.0 [0.0, 0.0] | |
| 1.5 Calcipotriene 0.005% ointment + nicotinamide 0.05% or 0.1% or 0.7% or 1.4%, twice daily | 0 | Std. Mean Difference (IV, Random, 95% CI) | 0.0 [0.0, 0.0] | |
| 1.6 Dead Sea salts emollient lotion | 0 | Std. Mean Difference (IV, Random, 95% CI) | 0.0 [0.0, 0.0] | |
| 1.7 Fish oil plus occlusion | 0 | Std. Mean Difference (IV, Random, 95% CI) | 0.0 [0.0, 0.0] | |
| 1.8 Herbal skin care (Dr Michaels® cleansing gel, ointment and skin conditioner), twice daily | 0 | Std. Mean Difference (IV, Random, 95% CI) | 0.0 [0.0, 0.0] | |
| 1.9 Hexafluoro‐1,25‐dihydroxyvitamin D3 | 1 | Std. Mean Difference (IV, Random, 95% CI) | 0.0 [0.0, 0.0] | |
| 1.10 Indigo naturalis 1.4% ointment | 1 | Std. Mean Difference (IV, Random, 95% CI) | 0.0 [0.0, 0.0] | |
| 1.11 Kukui nut oil, TD | 1 | Std. Mean Difference (IV, Random, 95% CI) | 0.0 [0.0, 0.0] | |
| 1.12 Mahonia aquifolium (Reliéva™), twice daily | 0 | Std. Mean Difference (IV, Random, 95% CI) | 0.0 [0.0, 0.0] | |
| 1.13 Methotrexate gel | 1 | Std. Mean Difference (IV, Random, 95% CI) | 0.0 [0.0, 0.0] | |
| 1.14 Mycophenolic acid ointment | 0 | Std. Mean Difference (IV, Random, 95% CI) | 0.0 [0.0, 0.0] | |
| 1.15 NG‐monomethyl‐L‐arginine (L‐NMMA) cream | 0 | Std. Mean Difference (IV, Random, 95% CI) | 0.0 [0.0, 0.0] | |
| 1.16 Nicotinamide 1.4%, twice daily | 0 | Std. Mean Difference (IV, Random, 95% CI) | 0.0 [0.0, 0.0] | |
| 1.17 Oleum horwathiensis (Psoricur®) | 1 | Std. Mean Difference (IV, Random, 95% CI) | 0.0 [0.0, 0.0] | |
| 1.18 Omega‐3‐polyunsaturated fatty acids ointment | 0 | Std. Mean Difference (IV, Random, 95% CI) | 0.0 [0.0, 0.0] | |
| 1.19 Platelet aggregation activating factor (PAF)(Ro 24‐0238) | 1 | Std. Mean Difference (IV, Random, 95% CI) | 0.0 [0.0, 0.0] | |
| 1.20 Polymyxin B cream 200,000 U/g | 0 | Std. Mean Difference (IV, Random, 95% CI) | 0.0 [0.0, 0.0] | |
| 1.21 PTH (1‐34) in Novasome A® liposomal cream, twice daily | 0 | Std. Mean Difference (IV, Random, 95% CI) | 0.0 [0.0, 0.0] | |
| 1.22 Sirolimus (topical), 2.2% for 6 wks, then 8% for a further 6 wks | 0 | Std. Mean Difference (IV, Random, 95% CI) | 0.0 [0.0, 0.0] | |
| 1.23 Tacrolimus ointment | 0 | Std. Mean Difference (IV, Random, 95% CI) | 0.0 [0.0, 0.0] | |
| 1.24 Tar | 0 | Std. Mean Difference (IV, Random, 95% CI) | 0.0 [0.0, 0.0] | |
| 1.25 Tazarotene | 0 | Std. Mean Difference (IV, Random, 95% CI) | 0.0 [0.0, 0.0] | |
| 1.26 Theophylline 1% ointment, twice daily | 0 | Std. Mean Difference (IV, Random, 95% CI) | 0.0 [0.0, 0.0] | |
| 2 TSS Show forest plot | 17 | Std. Mean Difference (IV, Random, 95% CI) | Subtotals only | |
| 2.1 Aloe vera extract 0.5% hydrophilic cream, three times per day | 0 | 0 | Std. Mean Difference (IV, Random, 95% CI) | 0.0 [0.0, 0.0] |
| 2.2 Anti‐IL‐8 monoclonal antibody cream | 1 | 89 | Std. Mean Difference (IV, Random, 95% CI) | ‐0.70 [‐1.13, ‐0.27] |
| 2.3 Betamethasone 17‐valerate 21‐acetate plus tretinoin plus salicylic acid | 0 | 0 | Std. Mean Difference (IV, Random, 95% CI) | 0.0 [0.0, 0.0] |
| 2.4 Caffeine (topical) 10%, TD | 0 | 0 | Std. Mean Difference (IV, Random, 95% CI) | 0.0 [0.0, 0.0] |
| 2.5 Calcipotriene 0.005% ointment + nicotinamide 0.05% or 0.1% or 0.7% or 1.4%, twice daily | 1 | 192 | Std. Mean Difference (IV, Random, 95% CI) | ‐0.48 [‐0.81, ‐0.15] |
| 2.6 Dead Sea salts emollient lotion | 0 | 0 | Std. Mean Difference (IV, Random, 95% CI) | 0.0 [0.0, 0.0] |
| 2.7 Fish oil plus occlusion | 1 | 50 | Std. Mean Difference (IV, Random, 95% CI) | ‐1.05 [‐1.64, ‐0.46] |
| 2.8 Herbal skin care (Dr Michaels® cleansing gel, ointment and skin conditioner), twice daily | 0 | 0 | Std. Mean Difference (IV, Random, 95% CI) | 0.0 [0.0, 0.0] |
| 2.9 Hexafluoro‐1,25‐dihydroxyvitamin D3, twice daily | 1 | 30 | Std. Mean Difference (IV, Random, 95% CI) | ‐1.13 [‐1.91, ‐0.35] |
| 2.10 Indigo naturalis 1.4% ointment | 2 | 88 | Std. Mean Difference (IV, Random, 95% CI) | ‐1.64 [‐2.13, ‐1.15] |
| 2.11 Kukui nut oil, TD | 1 | 24 | Std. Mean Difference (IV, Random, 95% CI) | 0.33 [‐0.48, 1.14] |
| 2.12 Mahonia aquifolium (Reliéva™), twice daily | 0 | 0 | Std. Mean Difference (IV, Random, 95% CI) | 0.0 [0.0, 0.0] |
| 2.13 Methotrexate gel | 1 | 82 | Std. Mean Difference (IV, Random, 95% CI) | ‐0.48 [‐0.92, ‐0.04] |
| 2.14 Mycophenolic acid ointment | 1 | 14 | Std. Mean Difference (IV, Random, 95% CI) | ‐1.44 [‐2.67, ‐0.22] |
| 2.15 NG‐monomethyl‐L‐arginine (L‐NMMA) cream | 1 | 34 | Std. Mean Difference (IV, Random, 95% CI) | 0.08 [‐0.60, 0.75] |
| 2.16 Nicotinamide 1.4%, twice daily | 1 | 96 | Std. Mean Difference (IV, Random, 95% CI) | ‐0.20 [‐0.60, 0.20] |
| 2.17 Oleum horwathiensis (Psoricur®) | 1 | 42 | Std. Mean Difference (IV, Random, 95% CI) | ‐0.77 [‐1.40, ‐0.14] |
| 2.18 Omega‐3‐polyunsaturated fatty acids ointment | 0 | 0 | Std. Mean Difference (IV, Random, 95% CI) | 0.0 [0.0, 0.0] |
| 2.19 Platelet aggregation activating factor (PAF)(Ro 24‐0238) | 0 | 0 | Std. Mean Difference (IV, Random, 95% CI) | 0.0 [0.0, 0.0] |
| 2.20 Polymyxin B cream 200,000 U/g | 1 | 30 | Std. Mean Difference (IV, Random, 95% CI) | 0.13 [‐0.59, 0.85] |
| 2.21 PTH (1‐34) in Novasome A® liposomal cream, twice daily | 1 | 30 | Std. Mean Difference (IV, Random, 95% CI) | ‐2.31 [‐3.26, ‐1.36] |
| 2.22 Sirolimus (topical), 2.2% for 6 wks, then 8% for a further 6 wks | 1 | 44 | Std. Mean Difference (IV, Random, 95% CI) | ‐0.39 [‐0.98, 0.21] |
| 2.23 Tacrolimus ointment | 1 | 47 | Std. Mean Difference (IV, Random, 95% CI) | 0.06 [‐0.52, 0.63] |
| 2.24 Tar | 1 | 36 | Std. Mean Difference (IV, Random, 95% CI) | ‐0.45 [‐1.11, 0.22] |
| 2.25 Tazarotene | 1 | 318 | Std. Mean Difference (IV, Random, 95% CI) | ‐0.86 [‐1.11, ‐0.62] |
| 2.26 Theophylline 1% ointment, twice daily | 0 | 0 | Std. Mean Difference (IV, Random, 95% CI) | 0.0 [0.0, 0.0] |
| 3 PASI Show forest plot | 9 | Std. Mean Difference (IV, Random, 95% CI) | Totals not selected | |
| 3.1 Aloe vera extract 0.5% hydrophilic cream, three times per day | 1 | Std. Mean Difference (IV, Random, 95% CI) | 0.0 [0.0, 0.0] | |
| 3.2 Anti‐IL‐8 monoclonal antibody cream | 0 | Std. Mean Difference (IV, Random, 95% CI) | 0.0 [0.0, 0.0] | |
| 3.3 Betamethasone 17‐valerate 21‐acetate plus tretinoin plus salicylic acid | 1 | Std. Mean Difference (IV, Random, 95% CI) | 0.0 [0.0, 0.0] | |
| 3.4 Caffeine (topical) 10%, TD | 1 | Std. Mean Difference (IV, Random, 95% CI) | 0.0 [0.0, 0.0] | |
| 3.5 Calcipotriene 0.005% ointment + nicotinamide 0.05% or 0.1% or 0.7% or 1.4%, twice daily | 0 | Std. Mean Difference (IV, Random, 95% CI) | 0.0 [0.0, 0.0] | |
| 3.6 Dead Sea salts emollient lotion, 30% | 1 | Std. Mean Difference (IV, Random, 95% CI) | 0.0 [0.0, 0.0] | |
| 3.7 Fish oil plus occlusion | 0 | Std. Mean Difference (IV, Random, 95% CI) | 0.0 [0.0, 0.0] | |
| 3.8 Herbal skin care (Dr Michaels® cleansing gel, ointment and skin conditioner), twice daily | 1 | Std. Mean Difference (IV, Random, 95% CI) | 0.0 [0.0, 0.0] | |
| 3.9 Hexafluoro‐1,25‐dihydroxyvitamin D3, twice daily | 0 | Std. Mean Difference (IV, Random, 95% CI) | 0.0 [0.0, 0.0] | |
| 3.10 Indigo naturalis 1.4% ointment | 0 | Std. Mean Difference (IV, Random, 95% CI) | 0.0 [0.0, 0.0] | |
| 3.11 Kukui nut oil, twice daily | 1 | Std. Mean Difference (IV, Random, 95% CI) | 0.0 [0.0, 0.0] | |
| 3.12 Mahonia aquifolium (Reliéva™), twice daily | 1 | Std. Mean Difference (IV, Random, 95% CI) | 0.0 [0.0, 0.0] | |
| 3.13 Methotrexate gel | 1 | Std. Mean Difference (IV, Random, 95% CI) | 0.0 [0.0, 0.0] | |
| 3.14 Mycophenolic acid ointment | 0 | Std. Mean Difference (IV, Random, 95% CI) | 0.0 [0.0, 0.0] | |
| 3.15 NG‐monomethyl‐L‐arginine (L‐NMMA) cream | 0 | Std. Mean Difference (IV, Random, 95% CI) | 0.0 [0.0, 0.0] | |
| 3.16 Nicotinamide 1.4%, twice daily | 0 | Std. Mean Difference (IV, Random, 95% CI) | 0.0 [0.0, 0.0] | |
| 3.17 Oleum horwathiensis (Psoricur®) | 0 | Std. Mean Difference (IV, Random, 95% CI) | 0.0 [0.0, 0.0] | |
| 3.18 Omega‐3‐polyunsaturated fatty acids ointment | 0 | Std. Mean Difference (IV, Random, 95% CI) | 0.0 [0.0, 0.0] | |
| 3.19 Platelet aggregation activating factor (PAF)(Ro 24‐0238) | 0 | Std. Mean Difference (IV, Random, 95% CI) | 0.0 [0.0, 0.0] | |
| 3.20 Polymyxin B cream 200,000 U/g | 0 | Std. Mean Difference (IV, Random, 95% CI) | 0.0 [0.0, 0.0] | |
| 3.21 PTH (1‐34) in Novasome A® liposomal cream, twice daily | 0 | Std. Mean Difference (IV, Random, 95% CI) | 0.0 [0.0, 0.0] | |
| 3.22 Sirolimus (topical), 2.2% for 6 wks, then 8% for a further 6 wks | 0 | Std. Mean Difference (IV, Random, 95% CI) | 0.0 [0.0, 0.0] | |
| 3.23 Tacrolimus ointment | 0 | Std. Mean Difference (IV, Random, 95% CI) | 0.0 [0.0, 0.0] | |
| 3.24 Tar | 0 | Std. Mean Difference (IV, Random, 95% CI) | 0.0 [0.0, 0.0] | |
| 3.25 Tazarotene | 0 | Std. Mean Difference (IV, Random, 95% CI) | 0.0 [0.0, 0.0] | |
| 3.26 Theophylline 1% ointment, twice daily | 1 | Std. Mean Difference (IV, Random, 95% CI) | 0.0 [0.0, 0.0] | |
| 4 PAGI Show forest plot | 2 | Std. Mean Difference (IV, Random, 95% CI) | Totals not selected | |
| 4.1 Aloe vera extract 0.5% hydrophilic cream, three times per day | 0 | Std. Mean Difference (IV, Random, 95% CI) | 0.0 [0.0, 0.0] | |
| 4.2 Anti‐IL‐8 monoclonal antibody cream | 0 | Std. Mean Difference (IV, Random, 95% CI) | 0.0 [0.0, 0.0] | |
| 4.3 Betamethasone 17‐valerate 21‐acetate plus tretinoin plus salicylic acid | 1 | Std. Mean Difference (IV, Random, 95% CI) | 0.0 [0.0, 0.0] | |
| 4.4 Caffeine (topical) 10%, TD | 0 | Std. Mean Difference (IV, Random, 95% CI) | 0.0 [0.0, 0.0] | |
| 4.5 Calcipotriene 0.005% ointment + nicotinamide 0.05% or 0.1% or 0.7% or 1.4%, twice daily | 0 | Std. Mean Difference (IV, Random, 95% CI) | 0.0 [0.0, 0.0] | |
| 4.6 Dead Sea salts emollient lotion, 30% | 0 | Std. Mean Difference (IV, Random, 95% CI) | 0.0 [0.0, 0.0] | |
| 4.7 Fish oil plus occlusion | 0 | Std. Mean Difference (IV, Random, 95% CI) | 0.0 [0.0, 0.0] | |
| 4.8 Herbal skin care (Dr Michaels® cleansing gel, ointment and skin conditioner), twice daily | 0 | Std. Mean Difference (IV, Random, 95% CI) | 0.0 [0.0, 0.0] | |
| 4.9 Hexafluoro‐1,25‐dihydroxyvitamin D3, twice daily | 0 | Std. Mean Difference (IV, Random, 95% CI) | 0.0 [0.0, 0.0] | |
| 4.10 Indigo naturalis 1.4% ointment | 0 | Std. Mean Difference (IV, Random, 95% CI) | 0.0 [0.0, 0.0] | |
| 4.11 Kukui nut oil, TD | 1 | Std. Mean Difference (IV, Random, 95% CI) | 0.0 [0.0, 0.0] | |
| 4.12 Mahonia aquifolium (Reliéva™), twice daily | 0 | Std. Mean Difference (IV, Random, 95% CI) | 0.0 [0.0, 0.0] | |
| 4.13 Methotrexate gel | 0 | Std. Mean Difference (IV, Random, 95% CI) | 0.0 [0.0, 0.0] | |
| 4.14 Mycophenolic acid ointment | 0 | Std. Mean Difference (IV, Random, 95% CI) | 0.0 [0.0, 0.0] | |
| 4.15 NG‐monomethyl‐L‐arginine (L‐NMMA) cream | 0 | Std. Mean Difference (IV, Random, 95% CI) | 0.0 [0.0, 0.0] | |
| 4.16 Nicotinamide 1.4%, twice daily | 0 | Std. Mean Difference (IV, Random, 95% CI) | 0.0 [0.0, 0.0] | |
| 4.17 Oleum horwathiensis (Psoricur®) | 0 | Std. Mean Difference (IV, Random, 95% CI) | 0.0 [0.0, 0.0] | |
| 4.18 Omega‐3‐polyunsaturated fatty acids ointment | 0 | Std. Mean Difference (IV, Random, 95% CI) | 0.0 [0.0, 0.0] | |
| 4.19 Platelet aggregation activating factor (PAF)(Ro 24‐0238) | 0 | Std. Mean Difference (IV, Random, 95% CI) | 0.0 [0.0, 0.0] | |
| 4.20 Polymyxin B cream 200,000 U/g | 0 | Std. Mean Difference (IV, Random, 95% CI) | 0.0 [0.0, 0.0] | |
| 4.21 PTH (1‐34) in Novasome A® liposomal cream, twice daily | 0 | Std. Mean Difference (IV, Random, 95% CI) | 0.0 [0.0, 0.0] | |
| 4.22 Sirolimus (topical), 2.2% for 6 wks, then 8% for a further 6 wks | 0 | Std. Mean Difference (IV, Random, 95% CI) | 0.0 [0.0, 0.0] | |
| 4.23 Tacrolimus ointment | 0 | Std. Mean Difference (IV, Random, 95% CI) | 0.0 [0.0, 0.0] | |
| 4.24 Tar | 0 | Std. Mean Difference (IV, Random, 95% CI) | 0.0 [0.0, 0.0] | |
| 4.25 Tazarotene | 0 | Std. Mean Difference (IV, Random, 95% CI) | 0.0 [0.0, 0.0] | |
| 4.26 Theophylline 1% ointment, twice daily | 0 | Std. Mean Difference (IV, Random, 95% CI) | 0.0 [0.0, 0.0] | |
| 5 Combined end point (IAGI/TSS/PASI/PAGI) Show forest plot | 26 | Std. Mean Difference (IV, Random, 95% CI) | Subtotals only | |
| 5.1 Aloe vera extract 0.5% hydrophilic cream, three times per day | 1 | 60 | Std. Mean Difference (IV, Random, 95% CI) | ‐1.58 [‐2.16, ‐0.99] |
| 5.2 Anti‐IL‐8 monoclonal antibody cream | 1 | 89 | Std. Mean Difference (IV, Random, 95% CI) | ‐0.59 [‐1.01, ‐0.16] |
| 5.3 Betamethasone 17‐valerate 21‐acetate plus tretinoin plus salicylic acid | 1 | 81 | Std. Mean Difference (IV, Random, 95% CI) | ‐0.76 [‐1.21, ‐0.31] |
| 5.4 Caffeine (topical) 10%, TD | 1 | 78 | Std. Mean Difference (IV, Random, 95% CI) | ‐0.39 [‐0.84, 0.06] |
| 5.5 Calcipotriene 0.005% ointment + nicotinamide 0.05% or 0.1% or 0.7% or 1.4%, twice daily | 1 | 192 | Std. Mean Difference (IV, Random, 95% CI) | ‐0.48 [‐0.81, ‐0.15] |
| 5.6 Dead Sea salts emollient lotion, 30% | 1 | 19 | Std. Mean Difference (IV, Random, 95% CI) | 0.57 [‐0.36, 1.51] |
| 5.7 Fish oil plus occlusion | 1 | 50 | Std. Mean Difference (IV, Random, 95% CI) | ‐1.05 [‐1.64, ‐0.46] |
| 5.8 Herbal skin care (Dr Michaels® cleansing gel, ointment and skin conditioner), twice daily | 1 | 24 | Std. Mean Difference (IV, Random, 95% CI) | ‐2.96 [‐4.19, ‐1.74] |
| 5.9 Hexafluoro‐1,25‐dihydroxyvitamin D3 | 1 | 30 | Std. Mean Difference (IV, Random, 95% CI) | ‐0.62 [‐1.35, 0.12] |
| 5.10 Indigo naturalis 1.4% ointment | 2 | 88 | Std. Mean Difference (IV, Random, 95% CI) | ‐2.09 [‐2.62, ‐1.56] |
| 5.11 Kukui nut oil, TD | 1 | 24 | Std. Mean Difference (IV, Random, 95% CI) | 0.0 [‐0.80, 0.80] |
| 5.12 Mahonia aquifolium (Reliéva™), twice daily | 1 | 200 | Std. Mean Difference (IV, Random, 95% CI) | ‐0.77 [‐1.06, ‐0.48] |
| 5.13 Methotrexate gel | 2 | 142 | Std. Mean Difference (IV, Random, 95% CI) | ‐1.05 [‐2.04, ‐0.06] |
| 5.14 Mycophenolic acid ointment | 1 | 14 | Std. Mean Difference (IV, Random, 95% CI) | ‐1.44 [‐2.67, ‐0.22] |
| 5.15 NG‐monomethyl‐L‐arginine (L‐NMMA) cream | 1 | 34 | Std. Mean Difference (IV, Random, 95% CI) | 0.08 [‐0.60, 0.75] |
| 5.16 Nicotinamide 1.4%, twice daily | 1 | 96 | Std. Mean Difference (IV, Random, 95% CI) | ‐0.20 [‐0.60, 0.20] |
| 5.17 Oleum horwathiensis (Psoricur®) | 1 | 42 | Std. Mean Difference (IV, Random, 95% CI) | ‐0.02 [‐0.63, 0.58] |
| 5.18 Omega‐3‐polyunsaturated fatty acids ointment | 0 | 0 | Std. Mean Difference (IV, Random, 95% CI) | 0.0 [0.0, 0.0] |
| 5.19 Platelet aggregation activating factor (PAF)(Ro 24‐0238) | 1 | 80 | Std. Mean Difference (IV, Random, 95% CI) | ‐0.07 [‐0.50, 0.37] |
| 5.20 Polymyxin B cream 200,000 U/g | 1 | 30 | Std. Mean Difference (IV, Random, 95% CI) | 0.13 [‐0.59, 0.85] |
| 5.21 PTH (1‐34) in Novasome A® liposomal cream, twice daily | 1 | 30 | Std. Mean Difference (IV, Random, 95% CI) | ‐2.31 [‐3.26, ‐1.36] |
| 5.22 Sirolimus (topical), 2.2% for 6 wks, then 8% for a further 6 wks | 1 | 44 | Std. Mean Difference (IV, Random, 95% CI) | ‐0.39 [‐0.98, 0.21] |
| 5.23 Tacrolimus ointment | 1 | 47 | Std. Mean Difference (IV, Random, 95% CI) | 0.06 [‐0.52, 0.63] |
| 5.24 Tar | 1 | 36 | Std. Mean Difference (IV, Random, 95% CI) | ‐0.45 [‐1.11, 0.22] |
| 5.25 Tazarotene | 1 | 318 | Std. Mean Difference (IV, Random, 95% CI) | ‐0.86 [‐1.11, ‐0.62] |
| 5.26 Theophylline 1% ointment, twice daily | 1 | 22 | Std. Mean Difference (IV, Random, 95% CI) | ‐2.87 [‐4.13, ‐1.62] |
| 6 Total withdrawals Show forest plot | 23 | Risk Difference (M‐H, Random, 95% CI) | Subtotals only | |
| 6.1 Aloe vera extract 0.5% hydrophilic cream, three times per day | 1 | 60 | Risk Difference (M‐H, Random, 95% CI) | 0.0 [‐0.06, 0.06] |
| 6.2 Anti‐IL‐8 monoclonal antibody cream | 1 | 96 | Risk Difference (M‐H, Random, 95% CI) | ‐0.02 [‐0.12, 0.08] |
| 6.3 Betamethasone 17‐valerate 21‐acetate plus tretinoin plus salicylic acid | 1 | 85 | Risk Difference (M‐H, Random, 95% CI) | ‐0.00 [‐0.09, 0.09] |
| 6.4 Caffeine (topical) 10%, TD | 1 | 78 | Risk Difference (M‐H, Random, 95% CI) | 0.0 [‐0.12, 0.12] |
| 6.5 Calcipotriene 0.005% ointment + nicotinamide 0.05% or 0.1% or 0.7% or 1.4%, twice daily | 1 | 192 | Risk Difference (M‐H, Random, 95% CI) | 0.03 [‐0.01, 0.08] |
| 6.6 Dead Sea salts emollient lotion | 1 | 24 | Risk Difference (M‐H, Random, 95% CI) | 0.25 [‐0.06, 0.56] |
| 6.7 Fish oil plus occlusion | 1 | 50 | Risk Difference (M‐H, Random, 95% CI) | 0.0 [‐0.07, 0.07] |
| 6.8 Herbal skin care (Dr Michaels® cleansing gel, ointment and skin conditioner), twice daily | 0 | 0 | Risk Difference (M‐H, Random, 95% CI) | 0.0 [0.0, 0.0] |
| 6.9 Hexafluoro‐1,25‐dihydroxyvitamin D3 | 1 | 30 | Risk Difference (M‐H, Random, 95% CI) | 0.0 [‐0.12, 0.12] |
| 6.10 Indigo naturalis 1.4% ointment | 2 | 112 | Risk Difference (M‐H, Random, 95% CI) | 0.0 [‐0.15, 0.15] |
| 6.11 Kukui nut oil, TD | 1 | 30 | Risk Difference (M‐H, Random, 95% CI) | ‐0.13 [‐0.42, 0.15] |
| 6.12 Mahonia aquifolium (Reliéva™), twice daily | 1 | 200 | Risk Difference (M‐H, Random, 95% CI) | ‐0.23 [‐0.32, ‐0.14] |
| 6.13 Methotrexate gel | 1 | 60 | Risk Difference (M‐H, Random, 95% CI) | 0.0 [‐0.06, 0.06] |
| 6.14 Mycophenolic acid ointment | 1 | 14 | Risk Difference (M‐H, Random, 95% CI) | 0.0 [‐0.24, 0.24] |
| 6.15 NG‐monomethyl‐L‐arginine (L‐NMMA) cream | 1 | 34 | Risk Difference (M‐H, Random, 95% CI) | 0.0 [‐0.11, 0.11] |
| 6.16 Nicotinamide 1.4%, twice daily | 1 | 96 | Risk Difference (M‐H, Random, 95% CI) | 0.02 [‐0.04, 0.08] |
| 6.17 Oleum horwathiensis | 1 | 50 | Risk Difference (M‐H, Random, 95% CI) | 0.16 [‐0.04, 0.36] |
| 6.18 Omega‐3‐polyunsaturated fatty acids ointment | 1 | 146 | Risk Difference (M‐H, Random, 95% CI) | 0.0 [‐0.15, 0.15] |
| 6.19 Platelet aggregation activating factor (PAF)(Ro 24‐0238) | 1 | 104 | Risk Difference (M‐H, Random, 95% CI) | 0.0 [‐0.16, 0.16] |
| 6.20 Polymyxin B cream 200,000 U/g | 1 | 30 | Risk Difference (M‐H, Random, 95% CI) | 0.0 [‐0.24, 0.24] |
| 6.21 PTH (1‐34) in Novasome A® liposomal cream, twice daily | 1 | 30 | Risk Difference (M‐H, Random, 95% CI) | 0.0 [‐0.12, 0.12] |
| 6.22 Sirolimus (topical) | 0 | 0 | Risk Difference (M‐H, Random, 95% CI) | 0.0 [0.0, 0.0] |
| 6.23 Tacrolimus ointment | 0 | 0 | Risk Difference (M‐H, Random, 95% CI) | 0.0 [0.0, 0.0] |
| 6.24 Tar | 0 | 0 | Risk Difference (M‐H, Random, 95% CI) | 0.0 [0.0, 0.0] |
| 6.25 Tazarotene | 2 | 1627 | Risk Difference (M‐H, Random, 95% CI) | 0.04 [‐0.01, 0.09] |
| 6.26 Theophylline 1% ointment, twice daily | 1 | 22 | Risk Difference (M‐H, Random, 95% CI) | 0.0 [‐0.16, 0.16] |
| 7 Withdrawals due to adverse events Show forest plot | 19 | Risk Difference (M‐H, Random, 95% CI) | Subtotals only | |
| 7.1 Aloe vera extract 0.5% hydrophilic cream, three times per day | 1 | 60 | Risk Difference (M‐H, Random, 95% CI) | 0.0 [‐0.06, 0.06] |
| 7.2 Anti‐IL‐8 monoclonal antibody cream | 0 | 0 | Risk Difference (M‐H, Random, 95% CI) | 0.0 [0.0, 0.0] |
| 7.3 Betamethasone 17‐valerate 21‐acetate plus tretinoin plus salicylic acid | 1 | 85 | Risk Difference (M‐H, Random, 95% CI) | ‐0.00 [‐0.07, 0.06] |
| 7.4 Caffeine (topical) 10%, TD | 1 | 78 | Risk Difference (M‐H, Random, 95% CI) | 0.0 [‐0.05, 0.05] |
| 7.5 Calcipotriene 0.005% ointment + nicotinamide 0.05% or 0.1% or 0.7% or 1.4%, twice daily | 1 | 192 | Risk Difference (M‐H, Random, 95% CI) | 0.0 [‐0.03, 0.03] |
| 7.6 Dead Sea salts emollient lotion | 1 | 24 | Risk Difference (M‐H, Random, 95% CI) | 0.08 [‐0.18, 0.35] |
| 7.7 Fish oil plus occlusion | 1 | 50 | Risk Difference (M‐H, Random, 95% CI) | 0.0 [‐0.07, 0.07] |
| 7.8 Herbal skin care (Dr Michaels® cleansing gel, ointment and skin conditioner), twice daily | 0 | 0 | Risk Difference (M‐H, Random, 95% CI) | 0.0 [0.0, 0.0] |
| 7.9 Hexafluoro‐1,25‐dihydroxyvitamin D3 | 1 | 30 | Risk Difference (M‐H, Random, 95% CI) | 0.0 [‐0.12, 0.12] |
| 7.10 Indigo naturalis 1.4% ointment | 2 | 112 | Risk Difference (M‐H, Random, 95% CI) | 0.0 [‐0.04, 0.04] |
| 7.11 Kukui nut oil, TD | 1 | 30 | Risk Difference (M‐H, Random, 95% CI) | 0.0 [‐0.12, 0.12] |
| 7.12 Mahonia aquifolium (Reliéva™), twice daily | 0 | 0 | Risk Difference (M‐H, Random, 95% CI) | 0.0 [0.0, 0.0] |
| 7.13 Methotrexate gel | 1 | 60 | Risk Difference (M‐H, Random, 95% CI) | 0.0 [‐0.06, 0.06] |
| 7.14 Mycophenolic acid ointment | 1 | 14 | Risk Difference (M‐H, Random, 95% CI) | 0.0 [‐0.24, 0.24] |
| 7.15 NG‐monomethyl‐L‐arginine (L‐NMMA) cream | 1 | 34 | Risk Difference (M‐H, Random, 95% CI) | 0.0 [‐0.11, 0.11] |
| 7.16 Nicotinamide 1.4%, twice daily | 1 | 96 | Risk Difference (M‐H, Random, 95% CI) | 0.0 [‐0.04, 0.04] |
| 7.17 Oleum horwathiensis | 1 | 50 | Risk Difference (M‐H, Random, 95% CI) | 0.0 [‐0.07, 0.07] |
| 7.18 Omega‐3‐polyunsaturated fatty acids ointment | 1 | 146 | Risk Difference (M‐H, Random, 95% CI) | 0.0 [‐0.03, 0.03] |
| 7.19 Platelet aggregation activating factor (PAF)(Ro 24‐0238) | 0 | 0 | Risk Difference (M‐H, Random, 95% CI) | 0.0 [0.0, 0.0] |
| 7.20 Polymyxin B cream 200,000 U/g | 0 | 0 | Risk Difference (M‐H, Random, 95% CI) | 0.0 [0.0, 0.0] |
| 7.21 PTH (1‐34) in Novasome A® liposomal cream, twice daily | 1 | 30 | Risk Difference (M‐H, Random, 95% CI) | 0.0 [‐0.12, 0.12] |
| 7.22 Sirolimus (topical) | 0 | 0 | Risk Difference (M‐H, Random, 95% CI) | 0.0 [0.0, 0.0] |
| 7.23 Tacrolimus ointment | 0 | 0 | Risk Difference (M‐H, Random, 95% CI) | 0.0 [0.0, 0.0] |
| 7.24 Tar | 0 | 0 | Risk Difference (M‐H, Random, 95% CI) | 0.0 [0.0, 0.0] |
| 7.25 Tazarotene | 2 | 1627 | Risk Difference (M‐H, Random, 95% CI) | 0.07 [0.05, 0.10] |
| 7.26 Theophylline 1% ointment, twice daily | 1 | 22 | Risk Difference (M‐H, Random, 95% CI) | 0.0 [‐0.16, 0.16] |
| 8 Withdrawals due to treatment failure Show forest plot | 18 | Risk Difference (M‐H, Random, 95% CI) | Subtotals only | |
| 8.1 Aloe vera extract 0.5% hydrophilic cream, three times per day | 1 | 60 | Risk Difference (M‐H, Random, 95% CI) | 0.0 [‐0.06, 0.06] |
| 8.2 Anti‐IL‐8 monoclonal antibody cream | 0 | 0 | Risk Difference (M‐H, Random, 95% CI) | 0.0 [0.0, 0.0] |
| 8.3 Betamethasone 17‐valerate 21‐acetate plus tretinoin plus salicylic acid | 1 | 85 | Risk Difference (M‐H, Random, 95% CI) | 0.02 [‐0.04, 0.08] |
| 8.4 Caffeine (topical) 10%, TD | 1 | 78 | Risk Difference (M‐H, Random, 95% CI) | 0.0 [‐0.05, 0.05] |
| 8.5 Calcipotriene 0.005% ointment + nicotinamide 0.05% or 0.1% or 0.7% or 1.4%, twice daily | 1 | 192 | Risk Difference (M‐H, Random, 95% CI) | 0.0 [‐0.03, 0.03] |
| 8.6 Dead Sea salts emollient lotion | 1 | 24 | Risk Difference (M‐H, Random, 95% CI) | 0.08 [‐0.12, 0.29] |
| 8.7 Fish oil plus occlusion | 1 | 50 | Risk Difference (M‐H, Random, 95% CI) | 0.0 [‐0.07, 0.07] |
| 8.8 Herbal skin care (Dr Michaels® cleansing gel, ointment and skin conditioner), twice daily | 0 | 0 | Risk Difference (M‐H, Random, 95% CI) | 0.0 [0.0, 0.0] |
| 8.9 Hexafluoro‐1,25‐dihydroxyvitamin D3 | 1 | 30 | Risk Difference (M‐H, Random, 95% CI) | 0.0 [‐0.12, 0.12] |
| 8.10 Indigo naturalis 1.4% ointment | 1 | 28 | Risk Difference (M‐H, Random, 95% CI) | 0.0 [‐0.13, 0.13] |
| 8.11 Kukui nut oil, TD | 1 | 30 | Risk Difference (M‐H, Random, 95% CI) | 0.0 [‐0.12, 0.12] |
| 8.12 Mahonia aquifolium (Reliéva™), twice daily | 0 | 0 | Risk Difference (M‐H, Random, 95% CI) | 0.0 [0.0, 0.0] |
| 8.13 Methotrexate gel | 1 | 60 | Risk Difference (M‐H, Random, 95% CI) | 0.0 [‐0.06, 0.06] |
| 8.14 Mycophenolic acid ointment | 1 | 14 | Risk Difference (M‐H, Random, 95% CI) | 0.0 [‐0.24, 0.24] |
| 8.15 NG‐monomethyl‐L‐arginine (L‐NMMA) cream | 1 | 34 | Risk Difference (M‐H, Random, 95% CI) | 0.0 [‐0.11, 0.11] |
| 8.16 Nicotinamide 1.4%, twice daily | 1 | 96 | Risk Difference (M‐H, Random, 95% CI) | 0.0 [‐0.04, 0.04] |
| 8.17 Oleum horwathiensis | 1 | 50 | Risk Difference (M‐H, Random, 95% CI) | 0.0 [‐0.07, 0.07] |
| 8.18 Omega‐3‐polyunsaturated fatty acids ointment | 1 | 146 | Risk Difference (M‐H, Random, 95% CI) | 0.0 [‐0.03, 0.03] |
| 8.19 Platelet aggregation activating factor (PAF)(Ro 24‐0238) | 0 | 0 | Risk Difference (M‐H, Random, 95% CI) | 0.0 [0.0, 0.0] |
| 8.20 Polymyxin B cream 200,000 U/g | 0 | 0 | Risk Difference (M‐H, Random, 95% CI) | 0.0 [0.0, 0.0] |
| 8.21 PTH (1‐34) in Novasome A® liposomal cream, twice daily | 1 | 30 | Risk Difference (M‐H, Random, 95% CI) | 0.0 [‐0.12, 0.12] |
| 8.22 Sirolimus (topical) | 0 | 0 | Risk Difference (M‐H, Random, 95% CI) | 0.0 [0.0, 0.0] |
| 8.23 Tacrolimus ointment | 0 | 0 | Risk Difference (M‐H, Random, 95% CI) | 0.0 [0.0, 0.0] |
| 8.24 Tar | 0 | 0 | Risk Difference (M‐H, Random, 95% CI) | 0.0 [0.0, 0.0] |
| 8.25 Tazarotene | 2 | 1627 | Risk Difference (M‐H, Random, 95% CI) | ‐0.02 [‐0.04, 0.01] |
| 8.26 Theophylline 1% ointment, twice daily | 1 | 22 | Risk Difference (M‐H, Random, 95% CI) | 0.0 [‐0.16, 0.16] |
| 9 Adverse events (local) Show forest plot | 21 | Risk Difference (M‐H, Random, 95% CI) | Subtotals only | |
| 9.1 Aloe vera extract 0.5% hydrophilic cream, three times per day | 1 | 60 | Risk Difference (M‐H, Random, 95% CI) | 0.0 [‐0.06, 0.06] |
| 9.2 Anti‐IL‐8 monoclonal antibody cream | 1 | 92 | Risk Difference (M‐H, Random, 95% CI) | 0.02 [‐0.10, 0.14] |
| 9.3 Betamethasone 17‐valerate 21‐acetate plus tretinoin plus salicylic acid | 1 | 85 | Risk Difference (M‐H, Random, 95% CI) | ‐0.00 [‐0.07, 0.06] |
| 9.4 Caffeine (topical) 10%, TD | 1 | 78 | Risk Difference (M‐H, Random, 95% CI) | 0.05 [‐0.03, 0.13] |
| 9.5 Calcipotriene 0.005% ointment + nicotinamide 0.05% or 0.1% or 0.7% or 1.4%, twice daily | 1 | 192 | Risk Difference (M‐H, Random, 95% CI) | 0.13 [‐0.02, 0.27] |
| 9.6 Dead Sea salts emollient lotion | 1 | 24 | Risk Difference (M‐H, Random, 95% CI) | 0.08 [‐0.18, 0.35] |
| 9.7 Fish oil plus occlusion | 1 | 50 | Risk Difference (M‐H, Random, 95% CI) | 0.04 [‐0.06, 0.14] |
| 9.8 Herbal skin care (Dr Michaels® cleansing gel, ointment and skin conditioner), twice daily | 1 | 24 | Risk Difference (M‐H, Random, 95% CI) | ‐0.09 [‐0.44, 0.27] |
| 9.9 Hexafluoro‐1,25‐dihydroxyvitamin D3 | 1 | 30 | Risk Difference (M‐H, Random, 95% CI) | 0.13 [‐0.06, 0.33] |
| 9.10 Indigo naturalis 1.4% ointment | 2 | 88 | Risk Difference (M‐H, Random, 95% CI) | 0.0 [‐0.05, 0.05] |
| 9.11 Kukui nut oil, TD | 1 | 30 | Risk Difference (M‐H, Random, 95% CI) | 0.0 [‐0.12, 0.12] |
| 9.12 Mahonia aquifolium (Reliéva™), twice daily | 1 | 200 | Risk Difference (M‐H, Random, 95% CI) | ‐0.02 [‐0.06, 0.02] |
| 9.13 Methotrexate gel | 1 | 60 | Risk Difference (M‐H, Random, 95% CI) | 0.0 [‐0.06, 0.06] |
| 9.14 Mycophenolic acid ointment | 1 | 14 | Risk Difference (M‐H, Random, 95% CI) | 0.0 [‐0.24, 0.24] |
| 9.15 NG‐monomethyl‐L‐arginine (L‐NMMA) cream | 1 | 34 | Risk Difference (M‐H, Random, 95% CI) | 0.0 [‐0.11, 0.11] |
| 9.16 Nicotinamide 1.4%, twice daily | 1 | 96 | Risk Difference (M‐H, Random, 95% CI) | 0.10 [‐0.07, 0.28] |
| 9.17 Oleum horwathiensis | 1 | 50 | Risk Difference (M‐H, Random, 95% CI) | 0.04 [‐0.06, 0.14] |
| 9.18 Omega‐3‐polyunsaturated fatty acids ointment | 1 | 146 | Risk Difference (M‐H, Random, 95% CI) | 0.01 [‐0.02, 0.05] |
| 9.19 Platelet aggregation activating factor (PAF)(Ro 24‐0238) | 1 | 104 | Risk Difference (M‐H, Random, 95% CI) | 0.0 [‐0.19, 0.19] |
| 9.20 Polymyxin B cream 200,000 U/g | 0 | 0 | Risk Difference (M‐H, Random, 95% CI) | 0.0 [0.0, 0.0] |
| 9.21 PTH (1‐34) in Novasome A® liposomal cream, twice daily | 1 | 30 | Risk Difference (M‐H, Random, 95% CI) | 0.0 [‐0.12, 0.12] |
| 9.22 Sirolimus (topical) | 0 | 0 | Risk Difference (M‐H, Random, 95% CI) | 0.0 [0.0, 0.0] |
| 9.23 Tacrolimus ointment | 0 | 0 | Risk Difference (M‐H, Random, 95% CI) | 0.0 [0.0, 0.0] |
| 9.24 Tar | 0 | 0 | Risk Difference (M‐H, Random, 95% CI) | 0.0 [0.0, 0.0] |
| 9.25 Tazarotene | 0 | 0 | Risk Difference (M‐H, Random, 95% CI) | 0.0 [0.0, 0.0] |
| 9.26 Theophylline 1% ointment, twice daily | 1 | 22 | Risk Difference (M‐H, Random, 95% CI) | 0.0 [‐0.16, 0.16] |
| 10 Adverse events (systemic) Show forest plot | 12 | Risk Difference (M‐H, Random, 95% CI) | Subtotals only | |
| 10.1 Aloe vera extract 0.5% hydrophilic cream, three times per day | 0 | 0 | Risk Difference (M‐H, Random, 95% CI) | 0.0 [0.0, 0.0] |
| 10.2 Anti‐IL‐8 monoclonal antibody cream | 0 | 0 | Risk Difference (M‐H, Random, 95% CI) | 0.0 [0.0, 0.0] |
| 10.3 Betamethasone 17‐valerate 21‐acetate plus tretinoin plus salicylic acid | 1 | 85 | Risk Difference (M‐H, Random, 95% CI) | 0.0 [‐0.04, 0.04] |
| 10.4 Caffeine (topical) 10%, TD | 0 | 0 | Risk Difference (M‐H, Random, 95% CI) | 0.0 [0.0, 0.0] |
| 10.5 Calcipotriene 0.005% ointment + nicotinamide 0.05% or 0.1% or 0.7% or 1.4%, twice daily | 0 | 0 | Risk Difference (M‐H, Random, 95% CI) | 0.0 [0.0, 0.0] |
| 10.6 Dead Sea salts emollient lotion | 0 | 0 | Risk Difference (M‐H, Random, 95% CI) | 0.0 [0.0, 0.0] |
| 10.7 Fish oil plus occlusion | 0 | 0 | Risk Difference (M‐H, Random, 95% CI) | 0.0 [0.0, 0.0] |
| 10.8 Herbal skin care (Dr Michaels® cleansing gel, ointment and skin conditioner), twice daily | 0 | 0 | Risk Difference (M‐H, Random, 95% CI) | 0.0 [0.0, 0.0] |
| 10.9 Hexafluoro‐1,25‐dihydroxyvitamin D3 | 1 | 30 | Risk Difference (M‐H, Random, 95% CI) | 0.0 [‐0.12, 0.12] |
| 10.10 Indigo naturalis 1.4% ointment | 2 | 88 | Risk Difference (M‐H, Random, 95% CI) | 0.0 [‐0.05, 0.05] |
| 10.11 Kukui nut oil, TD | 0 | 0 | Risk Difference (M‐H, Random, 95% CI) | 0.0 [0.0, 0.0] |
| 10.12 Mahonia aquifolium (Reliéva™), twice daily | 0 | 0 | Risk Difference (M‐H, Random, 95% CI) | 0.0 [0.0, 0.0] |
| 10.13 Methotrexate gel | 2 | 166 | Risk Difference (M‐H, Random, 95% CI) | 0.0 [‐0.03, 0.03] |
| 10.14 Mycophenolic acid ointment | 0 | 0 | Risk Difference (M‐H, Random, 95% CI) | 0.0 [0.0, 0.0] |
| 10.15 NG‐monomethyl‐L‐arginine (L‐NMMA) cream | 1 | 34 | Risk Difference (M‐H, Random, 95% CI) | 0.0 [‐0.11, 0.11] |
| 10.16 Nicotinamide 1.4%, twice daily | 0 | 0 | Risk Difference (M‐H, Random, 95% CI) | 0.0 [0.0, 0.0] |
| 10.17 Oleum horwathiensis | 1 | 50 | Risk Difference (M‐H, Random, 95% CI) | 0.0 [‐0.07, 0.07] |
| 10.18 Omega‐3‐polyunsaturated fatty acids ointment | 0 | 0 | Risk Difference (M‐H, Random, 95% CI) | 0.0 [0.0, 0.0] |
| 10.19 Platelet aggregation activating factor (PAF)(Ro 24‐0238) | 1 | 104 | Risk Difference (M‐H, Random, 95% CI) | 0.0 [‐0.04, 0.04] |
| 10.20 Polymyxin B cream 200,000 U/g | 0 | 0 | Risk Difference (M‐H, Random, 95% CI) | 0.0 [0.0, 0.0] |
| 10.21 PTH (1‐34) in Novasome A® liposomal cream, twice daily | 1 | 30 | Risk Difference (M‐H, Random, 95% CI) | 0.0 [‐0.12, 0.12] |
| 10.22 Sirolimus (topical) | 0 | 0 | Risk Difference (M‐H, Random, 95% CI) | 0.0 [0.0, 0.0] |
| 10.23 Tacrolimus ointment | 0 | 0 | Risk Difference (M‐H, Random, 95% CI) | 0.0 [0.0, 0.0] |
| 10.24 Tar | 0 | 0 | Risk Difference (M‐H, Random, 95% CI) | 0.0 [0.0, 0.0] |
| 10.25 Tazarotene | 2 | 414 | Risk Difference (M‐H, Random, 95% CI) | 0.0 [‐0.01, 0.01] |
| 10.26 Theophylline 1% ointment, twice daily | 0 | 0 | Risk Difference (M‐H, Random, 95% CI) | 0.0 [0.0, 0.0] |
| Outcome or subgroup title | No. of studies | No. of participants | Statistical method | Effect size |
| 1 IAGI Show forest plot | 8 | Std. Mean Difference (IV, Random, 95% CI) | Subtotals only | |
| 1.1 Calcipotriol vs. betamethasone dipropionate | 3 | 1728 | Std. Mean Difference (IV, Random, 95% CI) | 0.43 [0.28, 0.58] |
| 1.2 Calcipotriol vs. betamethasone valerate | 1 | 412 | Std. Mean Difference (IV, Random, 95% CI) | ‐0.02 [‐0.21, 0.17] |
| 1.3 Calcipotriol vs. desoxymetasone | 0 | 0 | Std. Mean Difference (IV, Random, 95% CI) | 0.0 [0.0, 0.0] |
| 1.4 Calcipotriol vs. diflorasone diacetate | 1 | 256 | Std. Mean Difference (IV, Random, 95% CI) | 0.27 [0.02, 0.52] |
| 1.5 Calcipotriol vs. fluocinonide | 1 | 99 | Std. Mean Difference (IV, Random, 95% CI) | ‐0.58 [‐0.99, ‐0.18] |
| 1.6 Calcitriol vs. betamethasone dipropionate | 1 | 258 | Std. Mean Difference (IV, Random, 95% CI) | 0.21 [‐0.04, 0.45] |
| 1.7 Calcitriol vs. betamethasone valerate | 1 | 30 | Std. Mean Difference (IV, Random, 95% CI) | ‐0.19 [‐0.91, 0.53] |
| 1.8 Tacalcitol vs. betamethasone valerate | 0 | 0 | Std. Mean Difference (IV, Random, 95% CI) | 0.0 [0.0, 0.0] |
| 2 TSS Show forest plot | 6 | Std. Mean Difference (IV, Random, 95% CI) | Subtotals only | |
| 2.1 Calcipotriol vs. betamethasone dipropionate | 0 | 0 | Std. Mean Difference (IV, Random, 95% CI) | 0.0 [0.0, 0.0] |
| 2.2 Calcipotriol vs. betamethasone valerate | 1 | 684 | Std. Mean Difference (IV, Random, 95% CI) | ‐0.26 [‐0.41, ‐0.11] |
| 2.3 Calcipotriol vs. desoxymetasone | 0 | 0 | Std. Mean Difference (IV, Random, 95% CI) | 0.0 [0.0, 0.0] |
| 2.4 Calcipotriol vs. diflorasone diacetate | 1 | 256 | Std. Mean Difference (IV, Random, 95% CI) | 0.40 [0.15, 0.65] |
| 2.5 Calcipotriol vs. fluocinonide | 1 | 89 | Std. Mean Difference (IV, Random, 95% CI) | ‐0.50 [‐0.92, ‐0.07] |
| 2.6 Calcitriol vs. betamethasone dipropionate | 1 | 258 | Std. Mean Difference (IV, Random, 95% CI) | 0.27 [0.02, 0.51] |
| 2.7 Calcitriol vs. betamethasone valerate | 0 | 0 | Std. Mean Difference (IV, Random, 95% CI) | 0.0 [0.0, 0.0] |
| 2.8 Tacalcitol vs. betamethasone valerate | 2 | 148 | Std. Mean Difference (IV, Random, 95% CI) | 0.41 [0.09, 0.74] |
| 3 PASI Show forest plot | 9 | Std. Mean Difference (IV, Random, 95% CI) | Subtotals only | |
| 3.1 Calcipotriol vs. betamethasone dipropionate | 3 | 1728 | Std. Mean Difference (IV, Random, 95% CI) | 0.36 [0.22, 0.51] |
| 3.2 Calcipotriol vs. betamethasone valerate | 4 | 1505 | Std. Mean Difference (IV, Random, 95% CI) | ‐0.12 [‐0.22, ‐0.02] |
| 3.3 Calcipotriol vs. desoxymetasone | 1 | 20 | Std. Mean Difference (IV, Random, 95% CI) | 0.15 [‐0.73, 1.02] |
| 3.4 Calcipotriol vs. diflorasone diacetate | 0 | 0 | Std. Mean Difference (IV, Random, 95% CI) | 0.0 [0.0, 0.0] |
| 3.5 Calcipotriol vs. fluocinonide | 0 | 0 | Std. Mean Difference (IV, Random, 95% CI) | 0.0 [0.0, 0.0] |
| 3.6 Calcitriol vs. betamethasone dipropionate | 1 | 258 | Std. Mean Difference (IV, Random, 95% CI) | 0.39 [0.14, 0.63] |
| 3.7 Calcitriol vs. betamethasone valerate | 0 | 0 | Std. Mean Difference (IV, Random, 95% CI) | 0.0 [0.0, 0.0] |
| 3.8 Tacalcitol vs. betamethasone valerate | 0 | 0 | Std. Mean Difference (IV, Random, 95% CI) | 0.0 [0.0, 0.0] |
| 4 PAGI Show forest plot | 2 | 1080 | Std. Mean Difference (IV, Random, 95% CI) | ‐0.26 [‐0.38, ‐0.14] |
| 4.1 Calcipotriol vs. betamethasone dipropionate | 0 | 0 | Std. Mean Difference (IV, Random, 95% CI) | 0.0 [0.0, 0.0] |
| 4.2 Calcipotriol vs. betamethasone valerate | 2 | 1080 | Std. Mean Difference (IV, Random, 95% CI) | ‐0.26 [‐0.38, ‐0.14] |
| 4.3 Calcipotriol vs. desoxymetasone | 0 | 0 | Std. Mean Difference (IV, Random, 95% CI) | 0.0 [0.0, 0.0] |
| 4.4 Calcipotriol vs. diflorasone diacetate | 0 | 0 | Std. Mean Difference (IV, Random, 95% CI) | 0.0 [0.0, 0.0] |
| 4.5 Calcipotriol vs. fluocinonide | 0 | 0 | Std. Mean Difference (IV, Random, 95% CI) | 0.0 [0.0, 0.0] |
| 4.6 Calcitriol vs. betamethasone dipropionate | 0 | 0 | Std. Mean Difference (IV, Random, 95% CI) | 0.0 [0.0, 0.0] |
| 4.7 Calcitriol vs. betamethasone valerate | 0 | 0 | Std. Mean Difference (IV, Random, 95% CI) | 0.0 [0.0, 0.0] |
| 4.8 Tacalcitol vs. betamethasone valerate | 0 | 0 | Std. Mean Difference (IV, Random, 95% CI) | 0.0 [0.0, 0.0] |
| 5 Combined end point (IAGI/TSS/PASI/PAGI) Show forest plot | 14 | Std. Mean Difference (IV, Random, 95% CI) | Subtotals only | |
| 5.1 Calcipotriol vs. betamethasone dipropionate | 3 | 1728 | Std. Mean Difference (IV, Random, 95% CI) | 0.43 [0.28, 0.58] |
| 5.2 Calcipotriol vs. betamethasone valerate | 4 | 1557 | Std. Mean Difference (IV, Random, 95% CI) | ‐0.12 [‐0.26, 0.02] |
| 5.3 Calcipotriol vs. desoxymetasone | 1 | 20 | Std. Mean Difference (IV, Random, 95% CI) | 0.15 [‐0.73, 1.02] |
| 5.4 Calcipotriol vs. diflorasone diacetate | 1 | 256 | Std. Mean Difference (IV, Random, 95% CI) | 0.27 [0.02, 0.52] |
| 5.5 Calcipotriol vs. fluocinonide | 1 | 99 | Std. Mean Difference (IV, Random, 95% CI) | ‐0.58 [‐0.99, ‐0.18] |
| 5.6 Calcitriol vs. betamethasone dipropionate | 1 | 258 | Std. Mean Difference (IV, Random, 95% CI) | 0.21 [‐0.04, 0.45] |
| 5.7 Calcitriol vs. betamethasone valerate | 1 | 30 | Std. Mean Difference (IV, Random, 95% CI) | ‐0.19 [‐0.91, 0.53] |
| 5.8 Tacalcitol vs. betamethasone valerate | 2 | 148 | Std. Mean Difference (IV, Random, 95% CI) | 0.41 [0.09, 0.74] |
| 6 Total withdrawals Show forest plot | 11 | 3995 | Risk Difference (M‐H, Random, 95% CI) | 0.02 [0.00, 0.03] |
| 6.1 Calcipotriol vs. betamethasone dipropionate | 3 | 1739 | Risk Difference (M‐H, Random, 95% CI) | 0.03 [0.01, 0.06] |
| 6.2 Calcipotriol vs. betamethasone valerate | 3 | 1520 | Risk Difference (M‐H, Random, 95% CI) | 0.01 [‐0.01, 0.04] |
| 6.3 Calcipotriol vs. desoxymetasone | 0 | 0 | Risk Difference (M‐H, Random, 95% CI) | 0.0 [0.0, 0.0] |
| 6.4 Calcipotriol vs. diflorasone diacetate | 1 | 268 | Risk Difference (M‐H, Random, 95% CI) | 0.0 [‐0.05, 0.05] |
| 6.5 Calcipotriol vs. fluocinonide | 0 | 0 | Risk Difference (M‐H, Random, 95% CI) | 0.0 [0.0, 0.0] |
| 6.6 Calcitriol vs. betamethasone dipropionate | 1 | 258 | Risk Difference (M‐H, Random, 95% CI) | ‐0.02 [‐0.08, 0.03] |
| 6.7 Calcitriol vs. betamethasone valerate | 1 | 30 | Risk Difference (M‐H, Random, 95% CI) | 0.07 [‐0.10, 0.23] |
| 6.8 Tacalcitol vs. betamethasone valerate | 2 | 180 | Risk Difference (M‐H, Random, 95% CI) | 0.0 [‐0.11, 0.11] |
| 7 Withdrawals due to adverse events Show forest plot | 9 | 3058 | Risk Difference (M‐H, Random, 95% CI) | 0.01 [‐0.00, 0.01] |
| 7.1 Calcipotriol vs. betamethasone dipropionate | 1 | 956 | Risk Difference (M‐H, Random, 95% CI) | 0.02 [0.00, 0.04] |
| 7.2 Calcipotriol vs. betamethasone valerate | 3 | 1520 | Risk Difference (M‐H, Random, 95% CI) | 0.00 [‐0.00, 0.01] |
| 7.3 Calcipotriol vs. desoxymetasone | 0 | 0 | Risk Difference (M‐H, Random, 95% CI) | 0.0 [0.0, 0.0] |
| 7.4 Calcipotriol vs. diflorasone diacetate | 0 | 0 | Risk Difference (M‐H, Random, 95% CI) | 0.0 [0.0, 0.0] |
| 7.5 Calcipotriol vs. fluocinonide | 1 | 114 | Risk Difference (M‐H, Random, 95% CI) | ‐0.02 [‐0.06, 0.03] |
| 7.6 Calcitriol vs. betamethasone dipropionate | 1 | 258 | Risk Difference (M‐H, Random, 95% CI) | 0.01 [‐0.02, 0.03] |
| 7.7 Calcitriol vs. betamethasone valerate | 1 | 30 | Risk Difference (M‐H, Random, 95% CI) | 0.07 [‐0.10, 0.23] |
| 7.8 Tacalcitol vs. betamethasone valerate | 2 | 180 | Risk Difference (M‐H, Random, 95% CI) | 0.0 [‐0.02, 0.02] |
| 8 Withdrawals due to treatment failure Show forest plot | 5 | 1500 | Risk Difference (M‐H, Random, 95% CI) | ‐0.00 [‐0.01, 0.01] |
| 8.1 Calcipotriol vs. betamethasone dipropionate | 0 | 0 | Risk Difference (M‐H, Random, 95% CI) | 0.0 [0.0, 0.0] |
| 8.2 Calcipotriol vs. betamethasone valerate | 2 | 1099 | Risk Difference (M‐H, Random, 95% CI) | ‐0.00 [‐0.01, 0.01] |
| 8.3 Calcipotriol vs. desoxymetasone | 0 | 0 | Risk Difference (M‐H, Random, 95% CI) | 0.0 [0.0, 0.0] |
| 8.4 Calcipotriol vs. diflorasone diacetate | 0 | 0 | Risk Difference (M‐H, Random, 95% CI) | 0.0 [0.0, 0.0] |
| 8.5 Calcipotriol vs. fluocinonide | 1 | 113 | Risk Difference (M‐H, Random, 95% CI) | 0.0 [‐0.03, 0.03] |
| 8.6 Calcitriol vs. betamethasone dipropionate | 1 | 258 | Risk Difference (M‐H, Random, 95% CI) | 0.01 [‐0.03, 0.05] |
| 8.7 Calcitriol vs. betamethasone valerate | 1 | 30 | Risk Difference (M‐H, Random, 95% CI) | 0.0 [‐0.12, 0.12] |
| 8.8 Tacalcitol vs. betamethasone valerate | 0 | 0 | Risk Difference (M‐H, Random, 95% CI) | 0.0 [0.0, 0.0] |
| 9 Adverse events (local) Show forest plot | 9 | 3778 | Risk Difference (M‐H, Random, 95% CI) | 0.07 [0.02, 0.11] |
| 9.1 Calcipotriol vs. betamethasone dipropionate | 3 | 1739 | Risk Difference (M‐H, Random, 95% CI) | 0.07 [0.04, 0.09] |
| 9.2 Calcipotriol vs. betamethasone valerate | 3 | 1516 | Risk Difference (M‐H, Random, 95% CI) | 0.12 [‐0.02, 0.26] |
| 9.3 Calcipotriol vs. desoxymetasone | 0 | 0 | Risk Difference (M‐H, Random, 95% CI) | 0.0 [0.0, 0.0] |
| 9.4 Calcipotriol vs. diflorasone diacetate | 0 | 0 | Risk Difference (M‐H, Random, 95% CI) | 0.0 [0.0, 0.0] |
| 9.5 Calcipotriol vs. fluocinonide | 1 | 113 | Risk Difference (M‐H, Random, 95% CI) | 0.10 [‐0.02, 0.22] |
| 9.6 Calcitriol vs. betamethasone dipropionate | 1 | 258 | Risk Difference (M‐H, Random, 95% CI) | 0.00 [‐0.05, 0.06] |
| 9.7 Calcitriol vs. betamethasone valerate | 0 | 0 | Risk Difference (M‐H, Random, 95% CI) | 0.0 [0.0, 0.0] |
| 9.8 Tacalcitol vs. betamethasone valerate | 1 | 152 | Risk Difference (M‐H, Random, 95% CI) | ‐0.01 [‐0.07, 0.04] |
| 10 Adverse events (systemic) Show forest plot | 6 | 2547 | Risk Difference (M‐H, Random, 95% CI) | ‐0.00 [‐0.00, 0.00] |
| 10.1 Calcipotriol vs. betamethasone dipropionate | 1 | 621 | Risk Difference (M‐H, Random, 95% CI) | 0.0 [‐0.01, 0.01] |
| 10.2 Calcipotriol vs. betamethasone valerate | 3 | 1516 | Risk Difference (M‐H, Random, 95% CI) | ‐0.00 [‐0.00, 0.00] |
| 10.3 Calcipotriol vs. desoxymetasone | 0 | 0 | Risk Difference (M‐H, Random, 95% CI) | 0.0 [0.0, 0.0] |
| 10.4 Calcipotriol vs. diflorasone diacetate | 0 | 0 | Risk Difference (M‐H, Random, 95% CI) | 0.0 [0.0, 0.0] |
| 10.5 Calcipotriol vs. fluocinonide | 0 | 0 | Risk Difference (M‐H, Random, 95% CI) | 0.0 [0.0, 0.0] |
| 10.6 Calcitriol vs. betamethasone dipropionate | 1 | 258 | Risk Difference (M‐H, Random, 95% CI) | ‐0.01 [‐0.04, 0.03] |
| 10.7 Calcitriol vs. betamethasone valerate | 0 | 0 | Risk Difference (M‐H, Random, 95% CI) | 0.0 [0.0, 0.0] |
| 10.8 Tacalcitol vs. betamethasone valerate | 1 | 152 | Risk Difference (M‐H, Random, 95% CI) | 0.0 [‐0.09, 0.09] |
| Outcome or subgroup title | No. of studies | No. of participants | Statistical method | Effect size |
| 1 IAGI Show forest plot | 1 | Std. Mean Difference (IV, Random, 95% CI) | Totals not selected | |
| 1.1 Calcipotriol vs. Clobetasol propionate | 1 | Std. Mean Difference (IV, Random, 95% CI) | 0.0 [0.0, 0.0] | |
| 2 TSS | 0 | 0 | Std. Mean Difference (IV, Random, 95% CI) | 0.0 [0.0, 0.0] |
| 2.1 Calcipotriol vs. Clobetasol propionate | 0 | 0 | Std. Mean Difference (IV, Random, 95% CI) | 0.0 [0.0, 0.0] |
| 3 PASI Show forest plot | 1 | Std. Mean Difference (IV, Random, 95% CI) | Totals not selected | |
| 3.1 Calcipotriol vs. Clobetasol propionate | 1 | Std. Mean Difference (IV, Random, 95% CI) | 0.0 [0.0, 0.0] | |
| 4 PAGI Show forest plot | 1 | Std. Mean Difference (IV, Random, 95% CI) | Totals not selected | |
| 4.1 Calcipotriol vs. Clobetasol propionate | 1 | Std. Mean Difference (IV, Random, 95% CI) | 0.0 [0.0, 0.0] | |
| 5 Combined end point (IAGI/TSS/PASI/PAGI) Show forest plot | 2 | 82 | Std. Mean Difference (IV, Random, 95% CI) | ‐0.06 [‐0.57, 0.44] |
| 5.1 Calcipotriol vs. Clobetasol propionate | 2 | 82 | Std. Mean Difference (IV, Random, 95% CI) | ‐0.06 [‐0.57, 0.44] |
| 6 Total withdrawals Show forest plot | 1 | Risk Difference (M‐H, Random, 95% CI) | Totals not selected | |
| 6.1 Calcipotriol vs. Clobetasol propionate | 1 | Risk Difference (M‐H, Random, 95% CI) | 0.0 [0.0, 0.0] | |
| 7 Withdrawals due to adverse events Show forest plot | 1 | Risk Difference (M‐H, Random, 95% CI) | Totals not selected | |
| 7.1 Calcipotriol vs. Clobetasol propionate | 1 | Risk Difference (M‐H, Random, 95% CI) | 0.0 [0.0, 0.0] | |
| 8 Withdrawals due to treatment failure Show forest plot | 1 | Risk Difference (M‐H, Random, 95% CI) | Totals not selected | |
| 8.1 Calcipotriol vs. Clobetasol propionate | 1 | Risk Difference (M‐H, Random, 95% CI) | 0.0 [0.0, 0.0] | |
| 9 Adverse events (local) Show forest plot | 1 | Risk Difference (M‐H, Random, 95% CI) | Totals not selected | |
| 9.1 Calcipotriol vs. Clobetasol propionate | 1 | Risk Difference (M‐H, Random, 95% CI) | 0.0 [0.0, 0.0] | |
| 10 Adverse events (systemic) Show forest plot | 1 | Risk Difference (M‐H, Random, 95% CI) | Totals not selected | |
| 10.1 Calcipotriol vs. Clobetasol propionate | 1 | Risk Difference (M‐H, Random, 95% CI) | 0.0 [0.0, 0.0] | |
| Outcome or subgroup title | No. of studies | No. of participants | Statistical method | Effect size |
| 1 IAGI Show forest plot | 4 | Std. Mean Difference (IV, Random, 95% CI) | Subtotals only | |
| 1.1 Calcipotriol + betamethasone dipropionate vs. betamethasone dipropionate | 3 | 1926 | Std. Mean Difference (IV, Random, 95% CI) | ‐0.40 [‐0.52, ‐0.27] |
| 1.2 Calcipotriol + betamethasone dipropionate vs. clobetasol propionate | 0 | 0 | Std. Mean Difference (IV, Random, 95% CI) | 0.0 [0.0, 0.0] |
| 1.3 Calcipotriol + clobetasol propionate vs. clobetasol propionate | 1 | 65 | Std. Mean Difference (IV, Random, 95% CI) | ‐0.69 [‐1.22, ‐0.15] |
| 2 TSS Show forest plot | 1 | Std. Mean Difference (IV, Random, 95% CI) | Totals not selected | |
| 2.1 Calcipotriol + betamethasone dipropionate vs. betamethasone dipropionate | 0 | Std. Mean Difference (IV, Random, 95% CI) | 0.0 [0.0, 0.0] | |
| 2.2 Calcipotriol + betamethasone dipropionate vs. clobetasol propionate | 1 | Std. Mean Difference (IV, Random, 95% CI) | 0.0 [0.0, 0.0] | |
| 2.3 Calcipotriol + clobetasol propionate vs. clobetasol propionate | 0 | Std. Mean Difference (IV, Random, 95% CI) | 0.0 [0.0, 0.0] | |
| 3 PASI Show forest plot | 3 | 1876 | Std. Mean Difference (IV, Random, 95% CI) | ‐0.44 [‐0.55, ‐0.33] |
| 3.1 Calcipotriol + betamethasone dipropionate vs. betamethasone dipropionate | 3 | 1876 | Std. Mean Difference (IV, Random, 95% CI) | ‐0.44 [‐0.55, ‐0.33] |
| 3.2 Calcipotriol + betamethasone dipropionate vs. clobetasol propionate | 0 | 0 | Std. Mean Difference (IV, Random, 95% CI) | 0.0 [0.0, 0.0] |
| 3.3 Calcipotriol + clobetasol propionate vs. clobetasol propionate | 0 | 0 | Std. Mean Difference (IV, Random, 95% CI) | 0.0 [0.0, 0.0] |
| 4 PAGI Show forest plot | 1 | Std. Mean Difference (IV, Random, 95% CI) | Totals not selected | |
| 4.1 Calcipotriol + betamethasone dipropionate vs. betamethasone dipropionate | 0 | Std. Mean Difference (IV, Random, 95% CI) | 0.0 [0.0, 0.0] | |
| 4.2 Calcipotriol + betamethasone dipropionate vs. clobetasol propionate | 0 | Std. Mean Difference (IV, Random, 95% CI) | 0.0 [0.0, 0.0] | |
| 4.3 Calcipotriol + clobetasol propionate vs. clobetasol propionate | 1 | Std. Mean Difference (IV, Random, 95% CI) | 0.0 [0.0, 0.0] | |
| 5 Combined end point (IAGI/TSS/PASI/PAGI) Show forest plot | 5 | Std. Mean Difference (IV, Random, 95% CI) | Subtotals only | |
| 5.1 Calcipotriol + betamethasone dipropionate vs. betamethasone dipropionate | 3 | 1926 | Std. Mean Difference (IV, Random, 95% CI) | ‐0.40 [‐0.52, ‐0.27] |
| 5.2 Calcipotriol + betamethasone dipropionate vs. clobetasol propionate | 1 | 122 | Std. Mean Difference (IV, Random, 95% CI) | 0.45 [0.09, 0.81] |
| 5.3 Calcipotriol + clobetasol propionate vs. clobetasol propionate | 1 | 65 | Std. Mean Difference (IV, Random, 95% CI) | ‐0.69 [‐1.22, ‐0.15] |
| 6 Total withdrawals Show forest plot | 5 | 2135 | Risk Difference (M‐H, Random, 95% CI) | ‐0.00 [‐0.02, 0.01] |
| 6.1 Calcipotriol + betamethasone dipropionate vs. betamethasone dipropionate | 3 | 1948 | Risk Difference (M‐H, Random, 95% CI) | ‐0.00 [‐0.03, 0.03] |
| 6.2 Calcipotriol + betamethasone dipropionate vs. clobetasol propionate | 1 | 122 | Risk Difference (M‐H, Random, 95% CI) | 0.0 [‐0.03, 0.03] |
| 6.3 Calcipotriol + clobetasol propionate vs. clobetasol propionate | 1 | 65 | Risk Difference (M‐H, Random, 95% CI) | 0.0 [‐0.07, 0.07] |
| 7 Withdrawals due to adverse events Show forest plot | 3 | Risk Difference (M‐H, Random, 95% CI) | Totals not selected | |
| 7.1 Calcipotriol + betamethasone dipropionate vs. betamethasone dipropionate | 1 | Risk Difference (M‐H, Random, 95% CI) | 0.0 [0.0, 0.0] | |
| 7.2 Calcipotriol + betamethasone dipropionate vs. clobetasol propionate | 1 | Risk Difference (M‐H, Random, 95% CI) | 0.0 [0.0, 0.0] | |
| 7.3 Calcipotriol + clobetasol propionate vs. clobetasol propionate | 1 | Risk Difference (M‐H, Random, 95% CI) | 0.0 [0.0, 0.0] | |
| 8 Withdrawals due to treatment failure Show forest plot | 2 | Risk Difference (M‐H, Random, 95% CI) | Totals not selected | |
| 8.1 Calcipotriol + betamethasone dipropionate vs. betamethasone dipropionate | 0 | Risk Difference (M‐H, Random, 95% CI) | 0.0 [0.0, 0.0] | |
| 8.2 Calcipotriol + betamethasone dipropionate vs. clobetasol propionate | 1 | Risk Difference (M‐H, Random, 95% CI) | 0.0 [0.0, 0.0] | |
| 8.3 Calcipotriol + clobetasol propionate vs. clobetasol propionate | 1 | Risk Difference (M‐H, Random, 95% CI) | 0.0 [0.0, 0.0] | |
| 9 Adverse events (local) Show forest plot | 4 | Risk Difference (M‐H, Random, 95% CI) | Subtotals only | |
| 9.1 Calcipotriol + betamethasone dipropionate vs. betamethasone dipropionate | 3 | 1946 | Risk Difference (M‐H, Random, 95% CI) | 0.02 [‐0.00, 0.04] |
| 9.2 Calcipotriol + betamethasone dipropionate vs. clobetasol propionate | 1 | 122 | Risk Difference (M‐H, Random, 95% CI) | ‐0.04 [‐0.13, 0.06] |
| 9.3 Calcipotriol + clobetasol propionate vs. clobetasol propionate | 0 | 0 | Risk Difference (M‐H, Random, 95% CI) | 0.0 [0.0, 0.0] |
| 10 Adverse events (systemic) Show forest plot | 1 | Risk Difference (M‐H, Random, 95% CI) | Totals not selected | |
| 10.1 Calcipotriol + betamethasone dipropionate vs. betamethasone dipropionate | 1 | Risk Difference (M‐H, Random, 95% CI) | 0.0 [0.0, 0.0] | |
| 10.2 Calcipotriol + betamethasone dipropionate vs. clobetasol propionate | 0 | Risk Difference (M‐H, Random, 95% CI) | 0.0 [0.0, 0.0] | |
| 10.3 Calcipotriol + clobetasol propionate vs. clobetasol propionate | 0 | Risk Difference (M‐H, Random, 95% CI) | 0.0 [0.0, 0.0] | |
| Outcome or subgroup title | No. of studies | No. of participants | Statistical method | Effect size |
| 1 IAGI Show forest plot | 5 | Std. Mean Difference (IV, Random, 95% CI) | Subtotals only | |
| 1.1 Calcipotriol vs. dithranol | 4 | 994 | Std. Mean Difference (IV, Random, 95% CI) | ‐0.43 [‐0.85, ‐0.01] |
| 1.2 Calcitriol vs. dithranol | 1 | 114 | Std. Mean Difference (IV, Random, 95% CI) | 0.51 [0.13, 0.88] |
| 1.3 Tacalcitol vs. dithranol | 0 | 0 | Std. Mean Difference (IV, Random, 95% CI) | 0.0 [0.0, 0.0] |
| 2 TSS Show forest plot | 4 | Std. Mean Difference (IV, Random, 95% CI) | Subtotals only | |
| 2.1 Calcipotriol vs. dithranol | 2 | 210 | Std. Mean Difference (IV, Random, 95% CI) | ‐0.54 [‐1.16, 0.08] |
| 2.2 Calcitriol vs. dithranol | 1 | 114 | Std. Mean Difference (IV, Random, 95% CI) | 0.13 [‐0.24, 0.50] |
| 2.3 Tacalcitol vs. dithranol | 1 | 84 | Std. Mean Difference (IV, Random, 95% CI) | ‐0.18 [‐0.60, 0.25] |
| 3 PASI Show forest plot | 5 | Std. Mean Difference (IV, Random, 95% CI) | Totals not selected | |
| 3.1 Calcipotriol vs. dithranol | 3 | Std. Mean Difference (IV, Random, 95% CI) | 0.0 [0.0, 0.0] | |
| 3.2 Calcitriol vs. dithranol | 1 | Std. Mean Difference (IV, Random, 95% CI) | 0.0 [0.0, 0.0] | |
| 3.3 Tacalcitol vs. dithranol | 1 | Std. Mean Difference (IV, Random, 95% CI) | 0.0 [0.0, 0.0] | |
| 4 PAGI Show forest plot | 2 | Std. Mean Difference (IV, Random, 95% CI) | Subtotals only | |
| 4.1 Calcipotriol vs. dithranol | 2 | 544 | Std. Mean Difference (IV, Random, 95% CI) | ‐0.05 [‐0.90, 0.80] |
| 4.2 Calcitriol vs. dithranol | 0 | 0 | Std. Mean Difference (IV, Random, 95% CI) | 0.0 [0.0, 0.0] |
| 4.3 Tacalcitol vs. dithranol | 0 | 0 | Std. Mean Difference (IV, Random, 95% CI) | 0.0 [0.0, 0.0] |
| 5 Combined end point (IAGI/TSS/PASI/PAGI) Show forest plot | 8 | Std. Mean Difference (IV, Random, 95% CI) | Totals not selected | |
| 5.1 Calcipotriol vs. dithranol | 6 | Std. Mean Difference (IV, Random, 95% CI) | 0.0 [0.0, 0.0] | |
| 5.2 Calcitriol vs. dithranol | 1 | Std. Mean Difference (IV, Random, 95% CI) | 0.0 [0.0, 0.0] | |
| 5.3 Tacalcitol vs. dithranol | 1 | Std. Mean Difference (IV, Random, 95% CI) | 0.0 [0.0, 0.0] | |
| 6 Total withdrawals Show forest plot | 7 | 615 | Risk Difference (M‐H, Random, 95% CI) | ‐0.02 [‐0.06, 0.01] |
| 6.1 Calcipotriol vs. dithranol | 5 | 417 | Risk Difference (M‐H, Random, 95% CI) | ‐0.01 [‐0.07, 0.04] |
| 6.2 Calcitriol vs. dithranol | 1 | 114 | Risk Difference (M‐H, Random, 95% CI) | ‐0.10 [‐0.25, 0.06] |
| 6.3 Tacalcitol vs. dithranol | 1 | 84 | Risk Difference (M‐H, Random, 95% CI) | ‐0.02 [‐0.16, 0.11] |
| 7 Withdrawals due to adverse events Show forest plot | 7 | 1265 | Risk Difference (M‐H, Random, 95% CI) | ‐0.03 [‐0.06, ‐0.00] |
| 7.1 Calcipotriol vs. dithranol | 6 | 1151 | Risk Difference (M‐H, Random, 95% CI) | ‐0.03 [‐0.06, 0.00] |
| 7.2 Calcitriol vs. dithranol | 1 | 114 | Risk Difference (M‐H, Random, 95% CI) | ‐0.06 [‐0.13, 0.02] |
| 7.3 Tacalcitol vs. dithranol | 0 | 0 | Risk Difference (M‐H, Random, 95% CI) | 0.0 [0.0, 0.0] |
| 8 Withdrawals due to treatment failure Show forest plot | 5 | 788 | Risk Difference (M‐H, Random, 95% CI) | ‐0.00 [‐0.02, 0.02] |
| 8.1 Calcipotriol vs. dithranol | 4 | 674 | Risk Difference (M‐H, Random, 95% CI) | 0.00 [‐0.02, 0.02] |
| 8.2 Calcitriol vs. dithranol | 1 | 114 | Risk Difference (M‐H, Random, 95% CI) | ‐0.02 [‐0.08, 0.04] |
| 8.3 Tacalcitol vs. dithranol | 0 | 0 | Risk Difference (M‐H, Random, 95% CI) | 0.0 [0.0, 0.0] |
| 9 Adverse events (local) Show forest plot | 9 | 1543 | Risk Difference (M‐H, Random, 95% CI) | ‐0.32 [‐0.43, ‐0.20] |
| 9.1 Calcipotriol vs. dithranol | 7 | 1345 | Risk Difference (M‐H, Random, 95% CI) | ‐0.25 [‐0.32, ‐0.17] |
| 9.2 Calcitriol vs. dithranol | 1 | 114 | Risk Difference (M‐H, Random, 95% CI) | ‐0.67 [‐0.80, ‐0.54] |
| 9.3 Tacalcitol vs. dithranol | 1 | 84 | Risk Difference (M‐H, Random, 95% CI) | ‐0.36 [‐0.52, ‐0.20] |
| 10 Adverse events (systemic) Show forest plot | 4 | 746 | Risk Difference (M‐H, Random, 95% CI) | ‐0.00 [‐0.01, 0.01] |
| 10.1 Calcipotriol vs. dithranol | 2 | 548 | Risk Difference (M‐H, Random, 95% CI) | ‐0.00 [‐0.02, 0.01] |
| 10.2 Calcitriol vs. dithranol | 1 | 114 | Risk Difference (M‐H, Random, 95% CI) | 0.0 [‐0.03, 0.03] |
| 10.3 Tacalcitol vs. dithranol | 1 | 84 | Risk Difference (M‐H, Random, 95% CI) | 0.0 [‐0.05, 0.05] |
| Outcome or subgroup title | No. of studies | No. of participants | Statistical method | Effect size |
| 1 IAGI Show forest plot | 3 | Std. Mean Difference (IV, Random, 95% CI) | Subtotals only | |
| 1.1 Calcipotriol vs. calcitriol | 1 | 246 | Std. Mean Difference (IV, Random, 95% CI) | 0.0 [‐0.25, 0.25] |
| 1.2 Calcipotriol vs. tacalcitol | 1 | 226 | Std. Mean Difference (IV, Random, 95% CI) | ‐0.47 [‐0.73, ‐0.21] |
| 1.3 Calcipotriol vs. maxacalcitol | 1 | 52 | Std. Mean Difference (IV, Random, 95% CI) | 0.43 [‐0.12, 0.98] |
| 2 TSS Show forest plot | 3 | 589 | Std. Mean Difference (IV, Random, 95% CI) | ‐0.31 [‐0.55, ‐0.06] |
| 2.1 Calcipotriol vs. calcitriol | 1 | 250 | Std. Mean Difference (IV, Random, 95% CI) | ‐0.32 [‐0.57, ‐0.07] |
| 2.2 Calcipotriol vs. tacalcitol | 1 | 287 | Std. Mean Difference (IV, Random, 95% CI) | ‐0.45 [‐0.68, ‐0.22] |
| 2.3 Calcipotriol vs. maxacalcitol | 1 | 52 | Std. Mean Difference (IV, Random, 95% CI) | 0.13 [‐0.41, 0.68] |
| 3 PASI Show forest plot | 1 | Std. Mean Difference (IV, Random, 95% CI) | Totals not selected | |
| 3.1 Calcipotriol vs. calcitriol | 1 | Std. Mean Difference (IV, Random, 95% CI) | 0.0 [0.0, 0.0] | |
| 3.2 Calcipotriol vs. tacalcitol | 0 | Std. Mean Difference (IV, Random, 95% CI) | 0.0 [0.0, 0.0] | |
| 3.3 Calcipotriol vs. maxacalcitol | 0 | Std. Mean Difference (IV, Random, 95% CI) | 0.0 [0.0, 0.0] | |
| 4 PAGI Show forest plot | 1 | Std. Mean Difference (IV, Random, 95% CI) | Totals not selected | |
| 4.1 Calcipotriol vs. calcitriol | 1 | Std. Mean Difference (IV, Random, 95% CI) | 0.0 [0.0, 0.0] | |
| 4.2 Calcipotriol vs. tacalcitol | 0 | Std. Mean Difference (IV, Random, 95% CI) | 0.0 [0.0, 0.0] | |
| 4.3 Calcipotriol vs. maxacalcitol | 0 | Std. Mean Difference (IV, Random, 95% CI) | 0.0 [0.0, 0.0] | |
| 5 Combined end point (IAGI/TSS/PASI/PAGI) Show forest plot | 4 | 539 | Std. Mean Difference (IV, Random, 95% CI) | ‐0.17 [‐0.62, 0.27] |
| 5.1 Calcipotriol vs. calcitriol | 2 | 261 | Std. Mean Difference (IV, Random, 95% CI) | ‐0.41 [‐1.46, 0.64] |
| 5.2 Calcipotriol vs. tacalcitol | 1 | 226 | Std. Mean Difference (IV, Random, 95% CI) | ‐0.47 [‐0.73, ‐0.21] |
| 5.3 Calcipotriol vs. maxacalcitol | 1 | 52 | Std. Mean Difference (IV, Random, 95% CI) | 0.43 [‐0.12, 0.98] |
| 6 Total withdrawals Show forest plot | 3 | 334 | Risk Difference (M‐H, Random, 95% CI) | 0.02 [‐0.04, 0.08] |
| 6.1 Calcipotriol vs. calcitriol | 2 | 274 | Risk Difference (M‐H, Random, 95% CI) | 0.02 [‐0.04, 0.09] |
| 6.2 Calcipotriol vs. tacalcitol | 0 | 0 | Risk Difference (M‐H, Random, 95% CI) | 0.0 [0.0, 0.0] |
| 6.3 Calcipotriol vs. maxacalcitol | 1 | 60 | Risk Difference (M‐H, Random, 95% CI) | 0.0 [‐0.17, 0.17] |
| 7 Withdrawals due to adverse events Show forest plot | 3 | 334 | Risk Difference (M‐H, Random, 95% CI) | 0.02 [‐0.01, 0.06] |
| 7.1 Calcipotriol vs. calcitriol | 2 | 274 | Risk Difference (M‐H, Random, 95% CI) | 0.03 [‐0.01, 0.07] |
| 7.2 Calcipotriol vs. tacalcitol | 0 | 0 | Risk Difference (M‐H, Random, 95% CI) | 0.0 [0.0, 0.0] |
| 7.3 Calcipotriol vs. maxacalcitol | 1 | 60 | Risk Difference (M‐H, Random, 95% CI) | 0.0 [‐0.06, 0.06] |
| 8 Withdrawals due to treatment failure Show forest plot | 3 | 334 | Risk Difference (M‐H, Random, 95% CI) | ‐0.00 [‐0.02, 0.01] |
| 8.1 Calcipotriol vs. calcitriol | 2 | 274 | Risk Difference (M‐H, Random, 95% CI) | ‐0.01 [‐0.08, 0.07] |
| 8.2 Calcipotriol vs. tacalcitol | 0 | 0 | Risk Difference (M‐H, Random, 95% CI) | 0.0 [0.0, 0.0] |
| 8.3 Calcipotriol vs. maxacalcitol | 1 | 60 | Risk Difference (M‐H, Random, 95% CI) | 0.0 [‐0.06, 0.06] |
| 9 Adverse events (local) Show forest plot | 2 | 537 | Risk Difference (M‐H, Random, 95% CI) | 0.03 [‐0.05, 0.12] |
| 9.1 Calcipotriol vs. calcitriol | 1 | 250 | Risk Difference (M‐H, Random, 95% CI) | 0.07 [0.01, 0.14] |
| 9.2 Calcipotriol vs. tacalcitol | 1 | 287 | Risk Difference (M‐H, Random, 95% CI) | ‐0.01 [‐0.09, 0.07] |
| 9.3 Calcipotriol vs. maxacalcitol | 0 | 0 | Risk Difference (M‐H, Random, 95% CI) | 0.0 [0.0, 0.0] |
| 10 Adverse events (systemic) Show forest plot | 3 | 597 | Risk Difference (M‐H, Random, 95% CI) | 0.0 [‐0.01, 0.01] |
| 10.1 Calcipotriol vs. calcitriol | 1 | 250 | Risk Difference (M‐H, Random, 95% CI) | 0.0 [‐0.02, 0.02] |
| 10.2 Calcipotriol vs. tacalcitol | 1 | 287 | Risk Difference (M‐H, Random, 95% CI) | 0.0 [‐0.01, 0.01] |
| 10.3 Calcipotriol vs. maxacalcitol | 1 | 60 | Risk Difference (M‐H, Random, 95% CI) | 0.0 [‐0.06, 0.06] |
| Outcome or subgroup title | No. of studies | No. of participants | Statistical method | Effect size |
| 1 IAGI Show forest plot | 11 | Std. Mean Difference (IV, Random, 95% CI) | Subtotals only | |
| 1.1 Calcipotriol twice daily vs. calcipotriol OM, BMD ON | 1 | 154 | Std. Mean Difference (IV, Random, 95% CI) | 0.56 [0.23, 0.88] |
| 1.2 Calcipotriol OD vs. combined calcipotriol + BMD OD | 2 | 1194 | Std. Mean Difference (IV, Random, 95% CI) | 0.66 [0.31, 1.02] |
| 1.3 Calcipotriol twice daily vs. combined calcipotriol + BMD OD | 1 | 377 | Std. Mean Difference (IV, Random, 95% CI) | 0.27 [0.06, 0.48] |
| 1.4 Calcipotriol twice daily vs. combined calcipotriol + BMD twice daily | 3 | 1804 | Std. Mean Difference (IV, Random, 95% CI) | 0.66 [0.40, 0.93] |
| 1.5 Calcipotriol twice daily vs. calcipotriol OM, BMV ON | 2 | 510 | Std. Mean Difference (IV, Random, 95% CI) | 0.27 [‐0.19, 0.74] |
| 1.6 Calcipotriol twice daily vs. calcipotriol OM, clobetasone butyrate ON | 1 | 344 | Std. Mean Difference (IV, Random, 95% CI) | 0.27 [0.05, 0.48] |
| 1.7 Calcipotriol twice daily vs. calcipotriol twice daily + clobetasol propionate twice daily | 1 | 65 | Std. Mean Difference (IV, Random, 95% CI) | 0.88 [0.34, 1.42] |
| 1.8 Calcipotriol twice daily vs. calcipotriol OM, diflucortolone valerate ON | 0 | 0 | Std. Mean Difference (IV, Random, 95% CI) | 0.0 [0.0, 0.0] |
| 1.9 Calcipotriol OD vs. calcipotriol OM, fluocinonide acetonide ON | 0 | 0 | Std. Mean Difference (IV, Random, 95% CI) | 0.0 [0.0, 0.0] |
| 1.10 Calcipotriol OD vs. combined calcipotriol + hydrocortisone OD | 1 | 408 | Std. Mean Difference (IV, Random, 95% CI) | 0.14 [‐0.06, 0.33] |
| 1.11 Calcitriol twice daily vs. diflucortolone valerate OM, calcitriol ON | 0 | 0 | Std. Mean Difference (IV, Random, 95% CI) | 0.0 [0.0, 0.0] |
| 1.12 Tacalcitol OD vs. combined calcipotriol + BMD OD | 1 | 334 | Std. Mean Difference (IV, Random, 95% CI) | 0.48 [0.26, 0.70] |
| 2 TSS Show forest plot | 1 | Std. Mean Difference (IV, Random, 95% CI) | Totals not selected | |
| 2.1 Calcipotriol twice daily vs. calcipotriol OM, BMD ON | 0 | Std. Mean Difference (IV, Random, 95% CI) | 0.0 [0.0, 0.0] | |
| 2.2 Calcipotriol OD vs. combined calcipotriol + BMD OD | 0 | Std. Mean Difference (IV, Random, 95% CI) | 0.0 [0.0, 0.0] | |
| 2.3 Calcipotriol twice daily vs. combined calcipotriol + BMD OD | 1 | Std. Mean Difference (IV, Random, 95% CI) | 0.0 [0.0, 0.0] | |
| 2.4 Calcipotriol twice daily vs. combined calcipotriol + BMD twice daily | 0 | Std. Mean Difference (IV, Random, 95% CI) | 0.0 [0.0, 0.0] | |
| 2.5 Calcipotriol twice daily vs. calcipotriol OM, BMV ON | 0 | Std. Mean Difference (IV, Random, 95% CI) | 0.0 [0.0, 0.0] | |
| 2.6 Calcipotriol twice daily vs. calcipotriol OM, clobetasone butyrate ON | 0 | Std. Mean Difference (IV, Random, 95% CI) | 0.0 [0.0, 0.0] | |
| 2.7 Calcipotriol twice daily vs. calcipotriol twice daily + clobetasol propionate twice daily | 0 | Std. Mean Difference (IV, Random, 95% CI) | 0.0 [0.0, 0.0] | |
| 2.8 Calcipotriol twice daily vs. calcipotriol OM, diflucortolone valerate ON | 0 | Std. Mean Difference (IV, Random, 95% CI) | 0.0 [0.0, 0.0] | |
| 2.9 Calcipotriol OD vs. calcipotriol OM, fluocinonide acetonide ON | 0 | Std. Mean Difference (IV, Random, 95% CI) | 0.0 [0.0, 0.0] | |
| 2.10 Calcipotriol OD vs. combined calcipotriol + hydrocortisone OD | 0 | Std. Mean Difference (IV, Random, 95% CI) | 0.0 [0.0, 0.0] | |
| 2.11 Calcitriol twice daily vs. diflucortolone valerate OM, calcitriol ON | 0 | Std. Mean Difference (IV, Random, 95% CI) | 0.0 [0.0, 0.0] | |
| 2.12 Tacalcitol OD vs. combined calcipotriol + BMD OD | 0 | Std. Mean Difference (IV, Random, 95% CI) | 0.0 [0.0, 0.0] | |
| 3 PASI Show forest plot | 16 | Std. Mean Difference (IV, Random, 95% CI) | Subtotals only | |
| 3.1 Calcipotriol twice daily vs. calcipotriol OM, BMD ON | 1 | 124 | Std. Mean Difference (IV, Random, 95% CI) | 0.46 [0.10, 0.82] |
| 3.2 Calcipotriol OD vs. combined calcipotriol + BMD OD | 2 | 1191 | Std. Mean Difference (IV, Random, 95% CI) | 0.67 [0.23, 1.11] |
| 3.3 Calcipotriol twice daily vs. combined calcipotriol + BMD OD | 4 | 1204 | Std. Mean Difference (IV, Random, 95% CI) | 0.52 [0.38, 0.67] |
| 3.4 Calcipotriol twice daily vs. combined calcipotriol + BMD twice daily | 3 | 1744 | Std. Mean Difference (IV, Random, 95% CI) | 0.64 [0.46, 0.83] |
| 3.5 Calcipotriol twice daily vs. calcipotriol OM, BMV ON | 2 | 515 | Std. Mean Difference (IV, Random, 95% CI) | 0.43 [‐0.07, 0.93] |
| 3.6 Calcipotriol twice daily vs. calcipotriol OM, clobetasone butyrate ON | 1 | 344 | Std. Mean Difference (IV, Random, 95% CI) | 0.17 [‐0.04, 0.38] |
| 3.7 Calcipotriol twice daily vs. calcipotriol twice daily + clobetasol propionate twice daily | 0 | 0 | Std. Mean Difference (IV, Random, 95% CI) | 0.0 [0.0, 0.0] |
| 3.8 Calcipotriol twice daily vs. calcipotriol OM, diflucortolone valerate ON | 1 | 116 | Std. Mean Difference (IV, Random, 95% CI) | 0.08 [‐0.29, 0.44] |
| 3.9 Calcipotriol OD vs. calcipotriol OM, fluocinonide acetonide ON | 1 | 38 | Std. Mean Difference (IV, Random, 95% CI) | 0.53 [‐0.11, 1.18] |
| 3.10 Calcipotriol OD vs. combined calcipotriol + hydrocortisone OD | 1 | 408 | Std. Mean Difference (IV, Random, 95% CI) | 0.08 [‐0.11, 0.28] |
| 3.11 Calcitriol twice daily vs. diflucortolone valerate OM, calcitriol ON | 1 | 142 | Std. Mean Difference (IV, Random, 95% CI) | 0.24 [‐0.09, 0.57] |
| 3.12 Tacalcitol OD vs. combined calcipotriol + BMD OD | 1 | 334 | Std. Mean Difference (IV, Random, 95% CI) | 0.47 [0.25, 0.69] |
| 4 PAGI Show forest plot | 2 | 399 | Std. Mean Difference (IV, Random, 95% CI) | 0.49 [0.29, 0.69] |
| 4.1 Calcipotriol twice daily vs. calcipotriol OM, BMD ON | 0 | 0 | Std. Mean Difference (IV, Random, 95% CI) | 0.0 [0.0, 0.0] |
| 4.2 Calcipotriol OD vs. combined calcipotriol + BMD OD | 0 | 0 | Std. Mean Difference (IV, Random, 95% CI) | 0.0 [0.0, 0.0] |
| 4.3 Calcipotriol twice daily vs. combined calcipotriol + BMD OD | 0 | 0 | Std. Mean Difference (IV, Random, 95% CI) | 0.0 [0.0, 0.0] |
| 4.4 Calcipotriol twice daily vs. combined calcipotriol + BMD twice daily | 0 | 0 | Std. Mean Difference (IV, Random, 95% CI) | 0.0 [0.0, 0.0] |
| 4.5 Calcipotriol twice daily vs. calcipotriol OM, BMV ON | 0 | 0 | Std. Mean Difference (IV, Random, 95% CI) | 0.0 [0.0, 0.0] |
| 4.6 Calcipotriol twice daily vs. calcipotriol OM, clobetasone butyrate ON | 0 | 0 | Std. Mean Difference (IV, Random, 95% CI) | 0.0 [0.0, 0.0] |
| 4.7 Calcipotriol twice daily vs. calcipotriol twice daily + clobetasol propionate twice daily | 1 | 65 | Std. Mean Difference (IV, Random, 95% CI) | 0.70 [0.16, 1.23] |
| 4.8 Calcipotriol twice daily vs. calcipotriol OM, diflucortolone valerate ON | 0 | 0 | Std. Mean Difference (IV, Random, 95% CI) | 0.0 [0.0, 0.0] |
| 4.9 Calcipotriol OD vs. calcipotriol OM, fluocinonide acetonide ON | 0 | 0 | Std. Mean Difference (IV, Random, 95% CI) | 0.0 [0.0, 0.0] |
| 4.10 Calcipotriol OD vs. combined calcipotriol + hydrocortisone OD | 0 | 0 | Std. Mean Difference (IV, Random, 95% CI) | 0.0 [0.0, 0.0] |
| 4.11 Calcitriol twice daily vs. diflucortolone valerate OM, calcitriol ON | 0 | 0 | Std. Mean Difference (IV, Random, 95% CI) | 0.0 [0.0, 0.0] |
| 4.12 Tacalcitol OD vs. combined calcipotriol + BMD OD | 1 | 334 | Std. Mean Difference (IV, Random, 95% CI) | 0.46 [0.24, 0.68] |
| 5 Combined end point (IAGI/TSS/PASI/PAGI) Show forest plot | 17 | Std. Mean Difference (IV, Random, 95% CI) | Subtotals only | |
| 5.1 Calcipotriol twice daily vs. calcipotriol OM, BMD ON | 1 | 154 | Std. Mean Difference (IV, Random, 95% CI) | 0.56 [0.23, 0.88] |
| 5.2 Calcipotriol OD vs. combined calcipotriol + BMD OD | 2 | 1194 | Std. Mean Difference (IV, Random, 95% CI) | 0.66 [0.31, 1.02] |
| 5.3 Calcipotriol twice daily vs. combined calcipotriol + BMD OD | 4 | 1204 | Std. Mean Difference (IV, Random, 95% CI) | 0.43 [0.20, 0.66] |
| 5.4 Calcipotriol twice daily vs. combined calcipotriol + BMD twice daily | 3 | 1804 | Std. Mean Difference (IV, Random, 95% CI) | 0.66 [0.40, 0.93] |
| 5.5 Calcipotriol twice daily vs. calcipotriol OM, BMV ON | 2 | 510 | Std. Mean Difference (IV, Random, 95% CI) | 0.27 [‐0.19, 0.74] |
| 5.6 Calcipotriol twice daily vs. calcipotriol OM, clobetasone butyrate ON | 1 | 344 | Std. Mean Difference (IV, Random, 95% CI) | 0.27 [0.05, 0.48] |
| 5.7 Calcipotriol twice daily vs. calcipotriol twice daily + clobetasol propionate twice daily | 1 | 65 | Std. Mean Difference (IV, Random, 95% CI) | 0.88 [0.34, 1.42] |
| 5.8 Calcipotriol twice daily vs. calcipotriol OM, diflucortolone valerate ON | 1 | 116 | Std. Mean Difference (IV, Random, 95% CI) | 0.08 [‐0.29, 0.44] |
| 5.9 Calcipotriol OD vs. calcipotriol OM, fluocinonide acetonide ON | 1 | 38 | Std. Mean Difference (IV, Random, 95% CI) | 0.53 [‐0.11, 1.18] |
| 5.10 Calcipotriol OD vs. combined calcipotriol + hydrocortisone OD | 1 | 408 | Std. Mean Difference (IV, Random, 95% CI) | 0.14 [‐0.06, 0.33] |
| 5.11 Calcitriol twice daily vs. diflucortolone valerate OM, calcitriol ON | 1 | 142 | Std. Mean Difference (IV, Random, 95% CI) | 0.24 [‐0.09, 0.57] |
| 5.12 Tacalcitol OD vs. combined calcipotriol + BMD OD | 1 | 334 | Std. Mean Difference (IV, Random, 95% CI) | 0.48 [0.26, 0.70] |
| 6 Total withdrawals Show forest plot | 15 | 5494 | Risk Difference (M‐H, Random, 95% CI) | 0.03 [0.02, 0.05] |
| 6.1 Talcipotriol vs. calcipotriol and corticosteroid | 13 | 4985 | Risk Difference (M‐H, Random, 95% CI) | 0.03 [0.01, 0.05] |
| 6.2 Calcitriol vs. calcitriol and corticosteroid | 1 | 142 | Risk Difference (M‐H, Random, 95% CI) | 0.01 [‐0.08, 0.10] |
| 6.3 Tacalcitol vs. calcipotriol and corticosteroid | 1 | 367 | Risk Difference (M‐H, Random, 95% CI) | 0.05 [‐0.01, 0.11] |
| 7 Withdrawals due to adverse events Show forest plot | 13 | 4081 | Risk Difference (M‐H, Random, 95% CI) | 0.02 [0.01, 0.03] |
| 7.1 Calcipotriol vs. calcipotriol and corticosteroid | 11 | 3572 | Risk Difference (M‐H, Random, 95% CI) | 0.02 [0.01, 0.03] |
| 7.2 Calcitriol vs. calcitriol and corticosteroid | 1 | 142 | Risk Difference (M‐H, Random, 95% CI) | 0.03 [‐0.02, 0.07] |
| 7.3 Tacalcitol vs. calcipotriol and corticosteroid | 1 | 367 | Risk Difference (M‐H, Random, 95% CI) | 0.01 [‐0.02, 0.03] |
| 8 Withdrawals due to treatment failure Show forest plot | 7 | 1925 | Risk Difference (M‐H, Random, 95% CI) | 0.01 [‐0.00, 0.02] |
| 8.1 Calcipotriol vs. calcipotriol and corticosteroid | 7 | 1925 | Risk Difference (M‐H, Random, 95% CI) | 0.01 [‐0.00, 0.02] |
| 8.2 Calcitriol vs. calcitriol and corticosteroid | 0 | 0 | Risk Difference (M‐H, Random, 95% CI) | 0.0 [0.0, 0.0] |
| 8.3 Tacalcitol vs. calcipotriol and corticosteroid | 0 | 0 | Risk Difference (M‐H, Random, 95% CI) | 0.0 [0.0, 0.0] |
| 9 Adverse events (local) Show forest plot | 15 | 5581 | Risk Difference (M‐H, Random, 95% CI) | 0.06 [0.05, 0.08] |
| 9.1 Calcipotriol vs. calcipotriol and corticosteroid | 13 | 5084 | Risk Difference (M‐H, Random, 95% CI) | 0.06 [0.04, 0.08] |
| 9.2 Calcitriol vs. calcitriol and corticosteroid | 1 | 131 | Risk Difference (M‐H, Random, 95% CI) | 0.10 [0.02, 0.19] |
| 9.3 Tacalcitol vs. calcipotriol and corticosteroid | 1 | 366 | Risk Difference (M‐H, Random, 95% CI) | 0.09 [0.02, 0.15] |
| 10 Adverse events (systemic) Show forest plot | 6 | 2099 | Risk Difference (M‐H, Random, 95% CI) | 0.00 [‐0.00, 0.00] |
| 10.1 Calcipotriol vs. calcipotriol and corticosteroid | 5 | 1968 | Risk Difference (M‐H, Random, 95% CI) | 0.00 [‐0.00, 0.00] |
| 10.2 Calcitriol vs. calcitriol and corticosteroid | 1 | 131 | Risk Difference (M‐H, Random, 95% CI) | 0.0 [‐0.03, 0.03] |
| 10.3 Tacalcitol vs. calcipotriol and corticosteroid | 0 | 0 | Risk Difference (M‐H, Random, 95% CI) | 0.0 [0.0, 0.0] |
| Outcome or subgroup title | No. of studies | No. of participants | Statistical method | Effect size |
| 1 IAGI Show forest plot | 7 | Std. Mean Difference (IV, Random, 95% CI) | Subtotals only | |
| 1.1 Calcipotriol (12 wks) vs. combined calcipotriol + BMD (8 wks); then calcipotriol (4 wks) | 1 | 577 | Std. Mean Difference (IV, Random, 95% CI) | ‐0.12 [‐0.29, 0.04] |
| 1.2 Calcipotriol (12 wks) vs. combined calcipotriol + BMD (4 wks); then calcipotriol (8 wks) | 0 | 0 | Std. Mean Difference (IV, Random, 95% CI) | 0.0 [0.0, 0.0] |
| 1.3 Calcipotriol (12 wks) vs. combined calcipotriol + BMD (4 wks); then calcipotriol (w/dy) & combined calcipotriol + BMD (w/e) (8 wks) | 1 | 585 | Std. Mean Difference (IV, Random, 95% CI) | 0.13 [‐0.04, 0.29] |
| 1.4 Calcipotriol (6 wks) vs. clobetasol propionate (2 wks); then calcipotriol (4 wks) | 1 | 92 | Std. Mean Difference (IV, Random, 95% CI) | 0.60 [0.18, 1.02] |
| 1.5 Calcipotriol (6 wks) vs. calcipotriol OM, fluocinonide acetonide ON (2 wks); then calcipotriol twice daily (4 wks) | 0 | 0 | Std. Mean Difference (IV, Random, 95% CI) | 0.0 [0.0, 0.0] |
| 1.6 Calcipotriol (6 wks) vs. halometasone OM, calcipotriol ON (2 wks); then calcipotriol twice daily (w/dy), halometasone (w/e) (2 wks); then calcipotriol twice daily (2wks) | 1 | 76 | Std. Mean Difference (IV, Random, 95% CI) | 0.41 [‐0.05, 0.86] |
| 1.7 Calcipotriol ON, clobetasol propionate OM (2 to 4 wks); then calcipotriol twice daily (to wk 12) vs. calcitriol ON, clobetasol propionate OM (2 to 4 wks); then calcitriol twice daily (to wk 12) | 1 | 125 | Std. Mean Difference (IV, Random, 95% CI) | ‐0.19 [‐0.54, 0.16] |
| 1.8 Combined calcipotriol + BMD (4 wks); then placebo ointment twice daily (8 wks) vs. combined calcipotriol + BMD (4 wks); then calcipotriol ointment twice daily (8 wks) | 1 | 759 | Std. Mean Difference (IV, Random, 95% CI) | 0.27 [0.12, 0.41] |
| 1.9 Combined calcipotriol + BMD (4 wks); then placebo ointment twice daily (8 wks) vs. combined calcipotriol + BMD (4 wks); then calcipotriol (w/dy)+ combined calcipotriol + BMD (w/e) (8 wks) | 1 | 753 | Std. Mean Difference (IV, Random, 95% CI) | 0.51 [0.37, 0.66] |
| 1.10 Combined calcipotriol + BMD (4 wks); then calcipotriol ointment twice daily (8 wks) vs. combined calcipotriol + BMD (4 wks); then calcipotriol (w/dy)+ combined calcipotriol + BMD (w/e) (8 wks) | 1 | 760 | Std. Mean Difference (IV, Random, 95% CI) | 0.26 [0.11, 0.40] |
| 1.11 Combined calcipotriol + BMD (8 wks); then calcipotriol (4 wks) vs. combined calcipotriol + BMD (4 wks); then calcipotriol (w/dy) & combined calcipotriol + BMD (w/e) (8 wks) | 1 | 596 | Std. Mean Difference (IV, Random, 95% CI) | 0.24 [0.08, 0.40] |
| 1.12 Tacalcitol (8 wks) vs. combined calcipotriol + BMD (4 wks); then calcipotriol (4 wks) | 1 | 493 | Std. Mean Difference (IV, Random, 95% CI) | 0.54 [0.36, 0.72] |
| 2 TSS Show forest plot | 1 | Std. Mean Difference (IV, Random, 95% CI) | Subtotals only | |
| 2.1 Calcipotriol (12 wks) vs. combined calcipotriol + BMD (8 wks); then calcipotriol (4 wks) | 0 | 0 | Std. Mean Difference (IV, Random, 95% CI) | 0.0 [0.0, 0.0] |
| 2.2 Calcipotriol (12 wks) vs. combined calcipotriol + BMD (4 wks); then calcipotriol (8 wks) | 0 | 0 | Std. Mean Difference (IV, Random, 95% CI) | 0.0 [0.0, 0.0] |
| 2.3 Calcipotriol (12 wks) vs. combined calcipotriol + BMD (4 wks); then calcipotriol (w/dy) & combined calcipotriol + BMD (w/e) (8 wks) | 0 | 0 | Std. Mean Difference (IV, Random, 95% CI) | 0.0 [0.0, 0.0] |
| 2.4 Calcipotriol (6 wks) vs. clobetasol propionate (2wks); then calcipotriol (4 wks) | 1 | 92 | Std. Mean Difference (IV, Random, 95% CI) | 0.63 [0.21, 1.05] |
| 2.5 Calcipotriol (6 wks) vs. calcipotriol OM, fluocinonide acetonide ON (2 wks); then calcipotriol twice daily (4 wks) | 0 | 0 | Std. Mean Difference (IV, Random, 95% CI) | 0.0 [0.0, 0.0] |
| 2.6 Calcipotriol (6 wks) vs. halometasone OM, calcipotriol ON (2 wks); then calcipotriol twice daily (w/dy), halometasone (w/e) (2 wks); then calcipotriol twice daily (2 wks) | 0 | 0 | Std. Mean Difference (IV, Random, 95% CI) | 0.0 [0.0, 0.0] |
| 2.7 Calcipotriol ON, clobetasol propionate OM (2 to 4 wks); then calcipotriol twice daily (to wk 12) vs. calcitriol ON, clobetasol propionate OM (2 to 4 wks); then calcitriol twice daily (to wk 12) | 0 | 0 | Std. Mean Difference (IV, Random, 95% CI) | 0.0 [0.0, 0.0] |
| 2.8 Combined calcipotriol + BMD (4 wks); then placebo ointment twice daily (8 wks) vs. combined calcipotriol + BMD (4 wks); then calcipotriol ointment twice daily (8 wks) | 0 | 0 | Std. Mean Difference (IV, Random, 95% CI) | 0.0 [0.0, 0.0] |
| 2.9 Combined calcipotriol + BMD (4 wks); then placebo ointment twice daily (8 wks) vs. combined calcipotriol + BMD (4 wks); then calcipotriol (w/dy) + combined calcipotriol + BMD (w/e) (8 wks) | 0 | 0 | Std. Mean Difference (IV, Random, 95% CI) | 0.0 [0.0, 0.0] |
| 2.10 Combined calcipotriol + BMD (4 wks); then calcipotriol ointment twice daily (8 wks) vs. combined calcipotriol + BMD (4 wks); then calcipotriol (w/dy) + combined calcipotriol + BMD (w/e) (8 wks) | 0 | 0 | Std. Mean Difference (IV, Random, 95% CI) | 0.0 [0.0, 0.0] |
| 2.11 Combined calcipotriol + BMD (8 wks); then calcipotriol (4 wks) vs. combined calcipotriol + BMD (4 wks); then calcipotriol (w/dy) & combined calcipotriol + BMD (w/e) (8 wks) | 0 | 0 | Std. Mean Difference (IV, Random, 95% CI) | 0.0 [0.0, 0.0] |
| 2.12 Tacalcitol (8 wks) vs. combined calcipotriol + BMD (4 wks); then calcipotriol (4 wks) | 0 | 0 | Std. Mean Difference (IV, Random, 95% CI) | 0.0 [0.0, 0.0] |
| 3 PASI Show forest plot | 8 | Std. Mean Difference (IV, Random, 95% CI) | Subtotals only | |
| 3.1 Calcipotriol (12 wks) vs. combined calcipotriol + BMD (8 wks); then calcipotriol (4 wks) | 1 | 649 | Std. Mean Difference (IV, Random, 95% CI) | ‐0.04 [‐0.19, 0.11] |
| 3.2 Calcipotriol (12 wks) vs. combined calcipotriol + BMD (4 wks); then calcipotriol (8 wks) | 1 | 143 | Std. Mean Difference (IV, Random, 95% CI) | 0.29 [‐0.04, 0.62] |
| 3.3 Calcipotriol (12 wks) vs. combined calcipotriol + BMD (4 wks); then calcipotriol (w/dy) & combined calcipotriol + BMD (w/e) (8 wks) | 1 | 650 | Std. Mean Difference (IV, Random, 95% CI) | 0.10 [‐0.05, 0.25] |
| 3.4 Calcipotriol (6 wks) vs. clobetasol propionate (2 wks); then calcipotriol (4 wks) | 0 | 0 | Std. Mean Difference (IV, Random, 95% CI) | 0.0 [0.0, 0.0] |
| 3.5 Calcipotriol (6 wks) vs. calcipotriol OM, fluocinonide acetonide ON (2 wks); then calcipotriol twice daily (4 wks) | 1 | 38 | Std. Mean Difference (IV, Random, 95% CI) | 0.66 [0.01, 1.32] |
| 3.6 Calcipotriol (6 wks) vs. halometasone OM, calcipotriol ON (2 wks); then calcipotriol twice daily (w/dy), halometasone (w/e) (2 wks); then calcipotriol twice daily (2 wks) | 1 | 76 | Std. Mean Difference (IV, Random, 95% CI) | 1.13 [0.64, 1.62] |
| 3.7 Calcipotriol ON, clobetasol propionate OM (2 to 4 wks); then calcipotriol twice daily (to wk 12) vs. calcitriol ON, clobetasol propionate OM (2 to 4 wks); then calcitriol twice daily (to wk 12) | 1 | 125 | Std. Mean Difference (IV, Random, 95% CI) | ‐0.27 [‐0.62, 0.09] |
| 3.8 Combined calcipotriol + BMD (4 wks); then placebo ointment twice daily (8 wks) vs. combined calcipotriol + BMD (4 wks); then calcipotriol ointment twice daily (8 wks) | 1 | 759 | Std. Mean Difference (IV, Random, 95% CI) | 0.25 [0.10, 0.39] |
| 3.9 Combined calcipotriol + BMD (4 wks); then placebo ointment twice daily (8 wks) vs. combined calcipotriol + BMD (4 wks); then calcipotriol (w/dy) + combined calcipotriol + BMD (w/e) (8 wks) | 1 | 753 | Std. Mean Difference (IV, Random, 95% CI) | 0.59 [0.45, 0.74] |
| 3.10 Combined calcipotriol + BMD (4 wks); then calcipotriol ointment twice daily (8 wks) vs. combined calcipotriol + BMD (4 wks); then calcipotriol (w/dy) + combined calcipotriol + BMD (w/e) (8 wks) | 1 | 760 | Std. Mean Difference (IV, Random, 95% CI) | 0.30 [0.16, 0.45] |
| 3.11 Combined calcipotriol + BMD (8 wks); then calcipotriol (4 wks) vs. combined calcipotriol + BMD (4 wks); then calcipotriol (w/dy) & combined calcipotriol + BMD (w/e) (8 wks) | 1 | 645 | Std. Mean Difference (IV, Random, 95% CI) | 0.15 [‐0.01, 0.30] |
| 3.12 Tacalcitol (8 wks) vs. combined calcipotriol + BMD (4 wks); then calcipotriol (4 wks) | 1 | 501 | Std. Mean Difference (IV, Random, 95% CI) | 0.49 [0.31, 0.67] |
| 4 PAGI Show forest plot | 4 | Std. Mean Difference (IV, Random, 95% CI) | Subtotals only | |
| 4.1 Calcipotriol (12 wks) vs. combined calcipotriol + BMD (8 wks); then calcipotriol (4 wks) | 1 | 577 | Std. Mean Difference (IV, Random, 95% CI) | ‐0.14 [‐0.30, 0.02] |
| 4.2 Calcipotriol (12 wks) vs. combined calcipotriol + BMD (4 wks); then calcipotriol (8 wks) | 0 | 0 | Std. Mean Difference (IV, Random, 95% CI) | 0.0 [0.0, 0.0] |
| 4.3 Calcipotriol (12 wks) vs. combined calcipotriol + BMD (4 wks); then calcipotriol (w/dy) & combined calcipotriol + BMD (w/e) (8 wks) | 1 | 585 | Std. Mean Difference (IV, Random, 95% CI) | 0.10 [‐0.06, 0.26] |
| 4.4 Calcipotriol (6 wks) vs. clobetasol propionate (2 wks); then calcipotriol (4 wks) | 0 | 0 | Std. Mean Difference (IV, Random, 95% CI) | 0.0 [0.0, 0.0] |
| 4.5 Calcipotriol (6 wks) vs. calcipotriol OM, fluocinonide acetonide ON (2 wks); then calcipotriol twice daily (4 wks) | 0 | 0 | Std. Mean Difference (IV, Random, 95% CI) | 0.0 [0.0, 0.0] |
| 4.6 Calcipotriol (6 wks) vs. halometasone OM, calcipotriol ON (2 wks); then calcipotriol twice daily (w/dy), halometasone (w/e) (2 wks); then calcipotriol twice daily (2 wks) | 0 | 0 | Std. Mean Difference (IV, Random, 95% CI) | 0.0 [0.0, 0.0] |
| 4.7 Calcipotriol ON, clobetasol propionate OM (2 to 4 wks); then calcipotriol twice daily (to wk 12) vs. calcitriol ON, clobetasol propionate OM (2 to 4 wks); then calcitriol twice daily (to wk 12) | 0 | 0 | Std. Mean Difference (IV, Random, 95% CI) | 0.0 [0.0, 0.0] |
| 4.8 Combined calcipotriol + BMD (4 wks); then placebo ointment twice daily (8 wks) vs. combined calcipotriol + BMD (4 wks); then calcipotriol ointment twice daily (8 wks) | 1 | 759 | Std. Mean Difference (IV, Random, 95% CI) | 0.28 [0.13, 0.42] |
| 4.9 Combined calcipotriol + BMD (4 wks); then placebo ointment twice daily (8 wks) vs. combined calcipotriol + BMD (4 wks); then calcipotriol (w/dy) + combined calcipotriol + BMD (w/e) (8 wks) | 1 | 753 | Std. Mean Difference (IV, Random, 95% CI) | 0.71 [0.56, 0.85] |
| 4.10 Combined calcipotriol + BMD (4 wks); then calcipotriol ointment twice daily (8 wks) vs. combined calcipotriol + BMD (4 wks); then calcipotriol (w/dy) + combined calcipotriol + BMD (w/e) (8 wks) | 1 | 760 | Std. Mean Difference (IV, Random, 95% CI) | 0.44 [0.29, 0.58] |
| 4.11 Combined calcipotriol + BMD (8 wks); then calcipotriol (4 wks) vs. combined calcipotriol + BMD (4 wks); then calcipotriol (w/dy) & combined calcipotriol + BMD (w/e) (8 wks) | 1 | 596 | Std. Mean Difference (IV, Random, 95% CI) | 0.23 [0.07, 0.39] |
| 4.12 Tacalcitol (8 wks) vs. combined calcipotriol + BMD (4 wks); then calcipotriol (4 wks) | 1 | 493 | Std. Mean Difference (IV, Random, 95% CI) | 0.54 [0.36, 0.72] |
| 5 Combined end point (IAGI/TSS/PASI/PAGI) Show forest plot | 9 | Std. Mean Difference (IV, Random, 95% CI) | Subtotals only | |
| 5.1 Calcipotriol (12 wks) vs. combined calcipotriol + BMD (8 wks); then calcipotriol (4 wks) | 1 | 577 | Std. Mean Difference (IV, Random, 95% CI) | ‐0.12 [‐0.29, 0.04] |
| 5.2 Calcipotriol (12 wks) vs. combined calcipotriol + BMD (4 wks); then calcipotriol (8 wks) | 1 | 143 | Std. Mean Difference (IV, Random, 95% CI) | 0.29 [‐0.04, 0.62] |
| 5.3 Calcipotriol (12 wks) vs. combined calcipotriol + BMD (4 wks); then calcipotriol (w/dy) & combined calcipotriol + BMD (w/e) (8 wks) | 1 | 585 | Std. Mean Difference (IV, Random, 95% CI) | 0.13 [‐0.04, 0.29] |
| 5.4 Calcipotriol (6 wks) vs. clobetasol propionate (2 wks); then calcipotriol (4 wks) | 1 | 92 | Std. Mean Difference (IV, Random, 95% CI) | 0.60 [0.18, 1.02] |
| 5.5 Calcipotriol (6 wks) vs. calcipotriol OM, fluocinonide acetonide ON (2 wks); then calcipotriol twice daily (4 wks) | 1 | 38 | Std. Mean Difference (IV, Random, 95% CI) | 0.66 [0.01, 1.32] |
| 5.6 Calcipotriol (6 wks) vs. halometasone OM, calcipotriol ON (2 wks); then calcipotriol twice daily (w/dy), halometasone (w/e) (2 wks); then calcipotriol twice daily (2 wks) | 1 | 76 | Std. Mean Difference (IV, Random, 95% CI) | 0.41 [‐0.05, 0.86] |
| 5.7 Calcipotriol ON, clobetasol propionate OM (2 to 4 wks); then calcipotriol twice daily (to wk 12) vs. calcitriol ON, clobetasol propionate OM (2 to 4 wks); then calcitriol twice daily (to wk 12) | 1 | 125 | Std. Mean Difference (IV, Random, 95% CI) | ‐0.19 [‐0.54, 0.16] |
| 5.8 Combined calcipotriol + BMD (4 wks); then placebo ointment twice daily (8 wks) vs. combined calcipotriol + BMD (4 wks); then calcipotriol ointment twice daily (8 wks) | 1 | 759 | Std. Mean Difference (IV, Random, 95% CI) | 0.27 [0.12, 0.41] |
| 5.9 Combined calcipotriol + BMD (4 wks); then placebo ointment twice daily (8 wks) vs. combined calcipotriol + BMD (4 wks); then calcipotriol (w/dy)+ combined calcipotriol + BMD (w/e) (8 wks) | 1 | 753 | Std. Mean Difference (IV, Random, 95% CI) | 0.51 [0.37, 0.66] |
| 5.10 Combined calcipotriol + BMD (4 wks); then calcipotriol ointment twice daily (8 wks) vs. combined calcipotriol + BMD (4 wks); then calcipotriol (w/dy) + combined calcipotriol + BMD (w/e) (8 wks) | 1 | 760 | Std. Mean Difference (IV, Random, 95% CI) | 0.26 [0.11, 0.40] |
| 5.11 Combined calcipotriol + BMD (8 wks); then calcipotriol (4 wks) vs. combined calcipotriol + BMD (4 wks); then calcipotriol (w/dy) & combined calcipotriol + BMD (w/e) (8 wks) | 1 | 596 | Std. Mean Difference (IV, Random, 95% CI) | 0.24 [0.08, 0.40] |
| 5.12 Tacalcitol (8 wks) vs. combined calcipotriol + BMD (4 wks); then calcipotriol (4 wks) | 1 | 493 | Std. Mean Difference (IV, Random, 95% CI) | 0.54 [0.36, 0.72] |
| 6 Total withdrawals Show forest plot | 9 | Risk Difference (M‐H, Random, 95% CI) | Subtotals only | |
| 6.1 Calcipotriol (12 wks) vs. combined calcipotriol + BMD (8 wks); then calcipotriol (4 wks) | 1 | 649 | Risk Difference (M‐H, Random, 95% CI) | 0.05 [0.00, 0.10] |
| 6.2 Calcipotriol (12 wks) vs. combined calcipotriol + BMD (4 wks); then calcipotriol (8 wks) | 1 | 150 | Risk Difference (M‐H, Random, 95% CI) | 0.04 [‐0.09, 0.17] |
| 6.3 Calcipotriol (12 wks) vs. combined calcipotriol + BMD (4 wks); then calcipotriol (w/dy) & combined calcipotriol + BMD (w/e) (8 wks) | 1 | 649 | Risk Difference (M‐H, Random, 95% CI) | 0.08 [0.03, 0.13] |
| 6.4 Calcipotriol (6 wks) vs. clobetasol propionate (2 wks); then calcipotriol (4 wks) | 1 | 98 | Risk Difference (M‐H, Random, 95% CI) | 0.0 [‐0.09, 0.09] |
| 6.5 Calcipotriol (6 wks) vs. calcipotriol OM, fluocinonide acetonide ON (2 wks); then calcipotriol twice daily (4 wks) | 1 | 38 | Risk Difference (M‐H, Random, 95% CI) | 0.0 [‐0.10, 0.10] |
| 6.6 Calcipotriol (6 wks) vs. halometasone OM, calcipotriol ON (2 wks); then calcipotriol twice daily (w/dy), halometasone (w/e) (2 wks); then calcipotriol twice daily (2 wks) | 1 | 76 | Risk Difference (M‐H, Random, 95% CI) | 0.0 [‐0.05, 0.05] |
| 6.7 Calcipotriol ON, clobetasol propionate OM (2 to 4 wks); then calcipotriol twice daily (to wk 12) vs. calcitriol ON, clobetasol propionate OM (2 to 4 wks); then calcitriol twice daily (to wk 12) | 1 | 125 | Risk Difference (M‐H, Random, 95% CI) | ‐0.01 [‐0.12, 0.11] |
| 6.8 Combined calcipotriol + BMD (4 wks); then placebo ointment twice daily (8 wks) vs. combined calcipotriol + BMD (4 wks); then calcipotriol ointment twice daily (8 wks) | 1 | 759 | Risk Difference (M‐H, Random, 95% CI) | 0.08 [0.03, 0.14] |
| 6.9 Combined calcipotriol + BMD (4 wks); then placebo ointment twice daily (8 wks) vs. combined calcipotriol + BMD (4 wks); then calcipotriol (w/dy) + combined calcipotriol + BMD (w/e) (8 wks) | 1 | 753 | Risk Difference (M‐H, Random, 95% CI) | 0.11 [0.06, 0.17] |
| 6.10 Combined calcipotriol + BMD (4 wks); then calcipotriol ointment twice daily (8 wks) vs. combined calcipotriol + BMD (4 wks); then calcipotriol (w/dy) + combined calcipotriol + BMD (w/e) (8 wks) | 1 | 760 | Risk Difference (M‐H, Random, 95% CI) | 0.03 [‐0.01, 0.07] |
| 6.11 Combined calcipotriol + BMD (8 wks); then calcipotriol (4 wks) vs. combined calcipotriol + BMD (4 wks); then calcipotriol (w/dy) & combined calcipotriol + BMD (w/e) (8 wks) | 1 | 644 | Risk Difference (M‐H, Random, 95% CI) | 0.03 [‐0.01, 0.07] |
| 6.12 Tacalcitol (8 wks) vs. combined calcipotriol + BMD (4 wks); then calcipotriol (4 wks) | 1 | 501 | Risk Difference (M‐H, Random, 95% CI) | 0.05 [‐0.01, 0.12] |
| 7 Withdrawals due to adverse events Show forest plot | 8 | Risk Difference (M‐H, Random, 95% CI) | Subtotals only | |
| 7.1 Calcipotriol (12 wks) vs. combined calcipotriol + BMD (8 wks); then calcipotriol (4 wks) | 0 | 0 | Risk Difference (M‐H, Random, 95% CI) | 0.0 [0.0, 0.0] |
| 7.2 Calcipotriol (12 wks) vs. combined calcipotriol + BMD (4 wks); then calcipotriol (8 wks) | 1 | 150 | Risk Difference (M‐H, Random, 95% CI) | ‐0.04 [‐0.09, 0.01] |
| 7.3 Calcipotriol (12 wks) vs. combined calcipotriol + BMD (4 wks); then calcipotriol (w/dy) & combined calcipotriol + BMD (w/e) (8 wks) | 0 | 0 | Risk Difference (M‐H, Random, 95% CI) | 0.0 [0.0, 0.0] |
| 7.4 Calcipotriol (6 wks) vs. clobetasol propionate (2 wks); then calcipotriol (4 wks) | 1 | 98 | Risk Difference (M‐H, Random, 95% CI) | 0.0 [‐0.04, 0.04] |
| 7.5 Calcipotriol (6 wks) vs. calcipotriol OM, fluocinonide acetonide ON (2 wks); then calcipotriol twice daily (4 wks) | 1 | 38 | Risk Difference (M‐H, Random, 95% CI) | 0.0 [‐0.10, 0.10] |
| 7.6 Calcipotriol (6 wks) vs. halometasone OM, calcipotriol ON (2 wks); then calcipotriol twice daily (w/dy), halometasone (w/e) (2 wks); then calcipotriol twice daily (2 wks) | 1 | 76 | Risk Difference (M‐H, Random, 95% CI) | 0.0 [‐0.05, 0.05] |
| 7.7 Calcipotriol ON, clobetasol propionate OM (2 to 4 wks); then calcipotriol twice daily (to wk 12) vs. calcitriol ON, clobetasol propionate OM (2 to 4 wks); then calcitriol twice daily (to wk 12) | 1 | 125 | Risk Difference (M‐H, Random, 95% CI) | ‐0.02 [‐0.06, 0.03] |
| 7.8 Combined calcipotriol + BMD (4 wks); then placebo ointment twice daily (8 wks) vs. combined calcipotriol + BMD (4 wks); then calcipotriol ointment twice daily (8 wks) | 1 | 759 | Risk Difference (M‐H, Random, 95% CI) | 0.01 [‐0.01, 0.02] |
| 7.9 Combined calcipotriol + BMD (4 wks); then placebo ointment twice daily (8 wks) vs. combined calcipotriol + BMD (4 wks); then calcipotriol (w/dy) + combined calcipotriol + BMD (w/e) (8 wks) | 1 | 753 | Risk Difference (M‐H, Random, 95% CI) | ‐0.00 [‐0.02, 0.02] |
| 7.10 Combined calcipotriol + BMD (4 wks); then calcipotriol ointment twice daily (8 wks) vs. combined calcipotriol + BMD (4 wks); then calcipotriol (w/dy) + combined calcipotriol + BMD (w/e) (8 wks) | 1 | 760 | Risk Difference (M‐H, Random, 95% CI) | ‐0.01 [‐0.03, 0.01] |
| 7.11 Combined calcipotriol + BMD (8 wks); then calcipotriol (4 wks) vs. combined calcipotriol + BMD (4 wks); then calcipotriol (w/dy) & combined calcipotriol + BMD (w/e) (8 wks) | 0 | 0 | Risk Difference (M‐H, Random, 95% CI) | 0.0 [0.0, 0.0] |
| 7.12 Tacalcitol (8 wks) vs. combined calcipotriol + BMD (4 wks); then calcipotriol (4 wks) | 1 | 501 | Risk Difference (M‐H, Random, 95% CI) | 0.02 [‐0.01, 0.05] |
| 8 Withdrawals due to treatment failure Show forest plot | 6 | Risk Difference (M‐H, Random, 95% CI) | Subtotals only | |
| 8.1 Calcipotriol (12 wks) vs. combined calcipotriol + BMD (8 wks); then calcipotriol (4 wks) | 0 | 0 | Risk Difference (M‐H, Random, 95% CI) | 0.0 [0.0, 0.0] |
| 8.2 Calcipotriol (12 wks) vs. combined calcipotriol + BMD (4 wks); then calcipotriol (8 wks) | 1 | 150 | Risk Difference (M‐H, Random, 95% CI) | 0.21 [0.10, 0.33] |
| 8.3 Calcipotriol (12 wks) vs. combined calcipotriol + BMD (4 wks); then calcipotriol (w/dy) & combined calcipotriol + BMD (w/e) (8 wks) | 0 | 0 | Risk Difference (M‐H, Random, 95% CI) | 0.0 [0.0, 0.0] |
| 8.4 Calcipotriol (6 wks) vs. clobetasol propionate (2 wks); then calcipotriol (4 wks) | 1 | 98 | Risk Difference (M‐H, Random, 95% CI) | 0.0 [‐0.04, 0.04] |
| 8.5 Calcipotriol (6 wks) vs. calcipotriol OM, fluocinonide acetonide ON (2 wks); then calcipotriol twice daily (4 wks) | 1 | 38 | Risk Difference (M‐H, Random, 95% CI) | 0.0 [‐0.10, 0.10] |
| 8.6 Calcipotriol (6 wks) vs. halometasone OM, calcipotriol ON (2 wks); then calcipotriol twice daily (w/dy), halometasone (w/e) (2 wks); then calcipotriol twice daily (2 wks) | 1 | 76 | Risk Difference (M‐H, Random, 95% CI) | 0.0 [‐0.05, 0.05] |
| 8.7 Calcipotriol ON, clobetasol propionate OM (2 to 4 wks); then calcipotriol twice daily (to wk 12) vs. calcitriol ON, clobetasol propionate OM (2 to 4 wks); then calcitriol twice daily (to wk 12) | 1 | 125 | Risk Difference (M‐H, Random, 95% CI) | 0.03 [‐0.04, 0.10] |
| 8.8 Combined calcipotriol + BMD (4 wks); then placebo ointment twice daily (8 wks) vs. combined calcipotriol + BMD (4 wks); then calcipotriol ointment twice daily (8 wks) | 0 | 0 | Risk Difference (M‐H, Random, 95% CI) | 0.0 [0.0, 0.0] |
| 8.9 Combined calcipotriol + BMD (4 wks); then placebo ointment twice daily (8 wks) vs. combined calcipotriol + BMD (4 wks); then calcipotriol (w/dy) + combined calcipotriol + BMD (w/e) (8 wks) | 0 | 0 | Risk Difference (M‐H, Random, 95% CI) | 0.0 [0.0, 0.0] |
| 8.10 Combined calcipotriol + BMD (4 wks); then calcipotriol ointment twice daily (8 wks) vs. combined calcipotriol + BMD (4 wks); then calcipotriol (w/dy)+ combined calcipotriol + BMD (w/e) (8 wks) | 0 | 0 | Risk Difference (M‐H, Random, 95% CI) | 0.0 [0.0, 0.0] |
| 8.11 Combined calcipotriol + BMD (8 wks); then calcipotriol (4 wks) vs. combined calcipotriol + BMD (4 wks); then calcipotriol (w/dy) & combined calcipotriol + BMD (w/e) (8 wks) | 0 | 0 | Risk Difference (M‐H, Random, 95% CI) | 0.0 [0.0, 0.0] |
| 8.12 Tacalcitol (8 wks) vs. combined calcipotriol + BMD (4 wks); then calcipotriol (4 wks) | 1 | 501 | Risk Difference (M‐H, Random, 95% CI) | 0.05 [0.02, 0.08] |
| 9 Adverse events (local) Show forest plot | 8 | Risk Difference (M‐H, Random, 95% CI) | Subtotals only | |
| 9.1 Calcipotriol (12 wks) vs. combined calcipotriol + BMD (8 wks); then calcipotriol (4 wks) | 1 | 649 | Risk Difference (M‐H, Random, 95% CI) | 0.11 [0.06, 0.17] |
| 9.2 Calcipotriol (12 wks) vs. combined calcipotriol + BMD (4 wks); then calcipotriol (8 wks) | 0 | 0 | Risk Difference (M‐H, Random, 95% CI) | 0.0 [0.0, 0.0] |
| 9.3 Calcipotriol (12 wks) vs. combined calcipotriol + BMD (4 wks); then calcipotriol (w/dy) & combined calcipotriol + BMD (w/e) (8 wks) | 1 | 649 | Risk Difference (M‐H, Random, 95% CI) | 0.11 [0.05, 0.17] |
| 9.4 Calcipotriol (6 wks) vs. clobetasol propionate (2 wks); then calcipotriol (4 wks) | 1 | 98 | Risk Difference (M‐H, Random, 95% CI) | 0.02 [‐0.08, 0.12] |
| 9.5 Calcipotriol (6 wks) vs. calcipotriol OM, fluocinonide acetonide ON (2 wks); then calcipotriol twice daily (4 wks) | 1 | 38 | Risk Difference (M‐H, Random, 95% CI) | 0.0 [‐0.14, 0.14] |
| 9.6 Calcipotriol (6 wks) vs. halometasone OM, calcipotriol ON (2 wks); then calcipotriol twice daily (w/dy), halometasone (w/e) (2 wks); then calcipotriol twice daily (2 wks) | 1 | 76 | Risk Difference (M‐H, Random, 95% CI) | 0.26 [0.07, 0.45] |
| 9.7 Calcipotriol ON, clobetasol propionate OM (2 to 4 wks); then calcipotriol twice daily (to wk 12) vs. calcitriol ON, clobetasol propionate OM (2 to 4 wks); then calcitriol twice daily (to wk 12) | 1 | 125 | Risk Difference (M‐H, Random, 95% CI) | ‐0.02 [‐0.10, 0.06] |
| 9.8 Combined calcipotriol + BMD (4 wks); then placebo ointment twice daily (8 wks) vs. combined calcipotriol + BMD (4 wks); then calcipotriol ointment twice daily (8 wks) | 1 | 752 | Risk Difference (M‐H, Random, 95% CI) | ‐0.03 [‐0.07, 0.02] |
| 9.9 Combined calcipotriol + BMD (4 wks); then placebo ointment twice daily (8 wks) vs. combined calcipotriol + BMD (4 wks); then calcipotriol (w/dy) + combined calcipotriol + BMD (w/e) (8 wks) | 1 | 743 | Risk Difference (M‐H, Random, 95% CI) | 0.01 [‐0.03, 0.05] |
| 9.10 Combined calcipotriol + BMD (4 wks); then calcipotriol ointment twice daily (8 wks) vs. combined calcipotriol + BMD (4 wks); then calcipotriol (w/dy) + combined calcipotriol + BMD (w/e) (8 wks) | 1 | 749 | Risk Difference (M‐H, Random, 95% CI) | 0.04 [‐0.00, 0.08] |
| 9.11 Combined calcipotriol + BMD (8 wks); then calcipotriol (4 wks) vs. combined calcipotriol + BMD (4 wks); then calcipotriol (w/dy) & combined calcipotriol + BMD (w/e) (8 wks) | 1 | 644 | Risk Difference (M‐H, Random, 95% CI) | ‐0.01 [‐0.05, 0.04] |
| 9.12 Tacalcitol (8 wks) vs. combined calcipotriol + BMD (4 wks); then calcipotriol (4 wks) | 1 | 501 | Risk Difference (M‐H, Random, 95% CI) | 0.06 [0.01, 0.11] |
| 10 Adverse events (systemic) | 0 | 0 | Risk Difference (M‐H, Random, 95% CI) | 0.0 [0.0, 0.0] |
| 10.1 Calcipotriol (12 wks) vs. combined calcipotriol + BMD (8 wks); then calcipotriol (4 wks) | 0 | 0 | Risk Difference (M‐H, Random, 95% CI) | 0.0 [0.0, 0.0] |
| 10.2 Calcipotriol (12 wks) vs. combined calcipotriol + BMD (4 wks); then calcipotriol (8 wks) | 0 | 0 | Risk Difference (M‐H, Random, 95% CI) | 0.0 [0.0, 0.0] |
| 10.3 Calcipotriol (12 wks) vs. combined calcipotriol + BMD (4 wks); then calcipotriol (w/dy) & combined calcipotriol + BMD (w/e) (8 wks) | 0 | 0 | Risk Difference (M‐H, Random, 95% CI) | 0.0 [0.0, 0.0] |
| 10.4 Calcipotriol (6 wks) vs. clobetasol propionate (2 wks); then calcipotriol (4 wks) | 0 | 0 | Risk Difference (M‐H, Random, 95% CI) | 0.0 [0.0, 0.0] |
| 10.5 Calcipotriol (6 wks) vs. calcipotriol OM, fluocinonide acetonide ON (2 wks); then calcipotriol twice daily (4 wks) | 0 | 0 | Risk Difference (M‐H, Random, 95% CI) | 0.0 [0.0, 0.0] |
| 10.6 Calcipotriol (6 wks) vs. halometasone OM, calcipotriol ON (2 wks); then calcipotriol twice daily (w/dy), halometasone (w/e) (2 wks); then calcipotriol twice daily (2 wks) | 0 | 0 | Risk Difference (M‐H, Random, 95% CI) | 0.0 [0.0, 0.0] |
| 10.7 Calcipotriol ON, clobetasol propionate OM (2 to 4 wks); then calcipotriol twice daily (to wk 12) vs. calcitriol ON, clobetasol propionate OM (2 to 4 wks); then calcitriol twice daily (to wk 12) | 0 | 0 | Risk Difference (M‐H, Random, 95% CI) | 0.0 [0.0, 0.0] |
| 10.8 Combined calcipotriol + BMD (4 wks); then placebo ointment twice daily (8 wks) vs. combined calcipotriol + BMD (4 wks); then calcipotriol ointment twice daily (8 wks) | 0 | 0 | Risk Difference (M‐H, Random, 95% CI) | 0.0 [0.0, 0.0] |
| 10.9 Combined calcipotriol + BMD (4 wks); then placebo ointment twice daily (8 wks) vs. combined calcipotriol + BMD (4 wks); then calcipotriol (w/dy) + combined calcipotriol + BMD (w/e) (8 wks) | 0 | 0 | Risk Difference (M‐H, Random, 95% CI) | 0.0 [0.0, 0.0] |
| 10.10 Combined calcipotriol + BMD (4 wks); then calcipotriol ointment twice daily (8 wks) vs. combined calcipotriol + BMD (4 wks); then calcipotriol (w/dy) + combined calcipotriol + BMD (w/e) (8 wks) | 0 | 0 | Risk Difference (M‐H, Random, 95% CI) | 0.0 [0.0, 0.0] |
| 10.11 Combined calcipotriol + BMD (8 wks); then calcipotriol (4 wks) vs. combined calcipotriol + BMD (4 wks); then calcipotriol (w/dy) & combined calcipotriol + BMD (w/e) (8 wks) | 0 | 0 | Risk Difference (M‐H, Random, 95% CI) | 0.0 [0.0, 0.0] |
| 10.12 Tacalcitol (8 wks) vs. combined calcipotriol + BMD (4 wks); then calcipotriol (4 wks) | 0 | 0 | Risk Difference (M‐H, Random, 95% CI) | 0.0 [0.0, 0.0] |
| Outcome or subgroup title | No. of studies | No. of participants | Statistical method | Effect size |
| 1 IAGI Show forest plot | 1 | Std. Mean Difference (IV, Random, 95% CI) | Totals not selected | |
| 1.1 Combined calcipotriol + BMD (52 wks) vs. alternating: combined calcipotriol + BMD (4 wks); then calcipotriol (4 wks) | 1 | Std. Mean Difference (IV, Random, 95% CI) | 0.0 [0.0, 0.0] | |
| 1.2 Combined calcipotriol + BMD (52 wks) vs. combined calcipotriol + BMD (4 wks); then calcipotriol (48 wks) | 1 | Std. Mean Difference (IV, Random, 95% CI) | 0.0 [0.0, 0.0] | |
| 1.3 Alternating: combined calcipotriol + BMD (4 wks); then calcipotriol (4 wks) vs. combined calcipotriol + BMD (4 wks); then calcipotriol (48 wks) | 1 | Std. Mean Difference (IV, Random, 95% CI) | 0.0 [0.0, 0.0] | |
| 2 TSS | 0 | 0 | Std. Mean Difference (IV, Random, 95% CI) | 0.0 [0.0, 0.0] |
| 2.1 Combined calcipotriol + BMD (52 wks) vs. alternating: combined calcipotriol + BMD (4 wks); then calcipotriol (4 wks) | 0 | 0 | Std. Mean Difference (IV, Random, 95% CI) | 0.0 [0.0, 0.0] |
| 2.2 Combined calcipotriol + BMD (52 wks) vs. combined calcipotriol + BMD (4 wks); then calcipotriol (48 wks) | 0 | 0 | Std. Mean Difference (IV, Random, 95% CI) | 0.0 [0.0, 0.0] |
| 2.3 Alternating: combined calcipotriol + BMD (4 wks); then calcipotriol (4 wks) vs. combined calcipotriol + BMD (4 wks); then calcipotriol (48 wks) | 0 | 0 | Std. Mean Difference (IV, Random, 95% CI) | 0.0 [0.0, 0.0] |
| 3 PASI | 0 | 0 | Std. Mean Difference (IV, Random, 95% CI) | 0.0 [0.0, 0.0] |
| 3.1 Combined calcipotriol + BMD (52 wks) vs. alternating: combined calcipotriol + BMD (4 wks); then calcipotriol (4 wks) | 0 | 0 | Std. Mean Difference (IV, Random, 95% CI) | 0.0 [0.0, 0.0] |
| 3.2 Combined calcipotriol + BMD (52 wks) vs. combined calcipotriol + BMD (4 wks); then calcipotriol (48 wks) | 0 | 0 | Std. Mean Difference (IV, Random, 95% CI) | 0.0 [0.0, 0.0] |
| 3.3 Alternating: combined calcipotriol + BMD (4 wks); then calcipotriol (4 wks) vs. combined calcipotriol + BMD (4 wks); then calcipotriol (48 wks) | 0 | 0 | Std. Mean Difference (IV, Random, 95% CI) | 0.0 [0.0, 0.0] |
| 4 PAGI | 0 | 0 | Std. Mean Difference (IV, Random, 95% CI) | 0.0 [0.0, 0.0] |
| 4.1 Combined calcipotriol + BMD (52 wks) vs. alternating: combined calcipotriol + BMD (4 wks); then calcipotriol (4 wks) | 0 | 0 | Std. Mean Difference (IV, Random, 95% CI) | 0.0 [0.0, 0.0] |
| 4.2 Combined calcipotriol + BMD (52 wks) vs. combined calcipotriol + BMD (4 wks); then calcipotriol (48 wks) | 0 | 0 | Std. Mean Difference (IV, Random, 95% CI) | 0.0 [0.0, 0.0] |
| 4.3 Alternating: combined calcipotriol + BMD (4 wks); then calcipotriol (4 wks) vs. combined calcipotriol + BMD (4 wks); then calcipotriol (48 wks) | 0 | 0 | Std. Mean Difference (IV, Random, 95% CI) | 0.0 [0.0, 0.0] |
| 5 Combined end point (IAGI/TSS/PASI/PAGI) Show forest plot | 1 | Std. Mean Difference (IV, Random, 95% CI) | Totals not selected | |
| 5.1 Combined calcipotriol + BMD (52 wks) vs. alternating: combined calcipotriol + BMD (4 wks); then calcipotriol (4 wks) | 1 | Std. Mean Difference (IV, Random, 95% CI) | 0.0 [0.0, 0.0] | |
| 5.2 Combined calcipotriol + BMD (52 wks) vs. combined calcipotriol + BMD (4 wks); then calcipotriol (48 wks) | 1 | Std. Mean Difference (IV, Random, 95% CI) | 0.0 [0.0, 0.0] | |
| 5.3 Alternating: combined calcipotriol + BMD (4 wks); then calcipotriol (4 wks) vs. combined calcipotriol + BMD (4 wks); then calcipotriol (48 wks) | 1 | Std. Mean Difference (IV, Random, 95% CI) | 0.0 [0.0, 0.0] | |
| 6 Total withdrawals Show forest plot | 1 | Risk Difference (M‐H, Random, 95% CI) | Totals not selected | |
| 6.1 Combined calcipotriol + BMD (52 wks) vs. alternating: combined calcipotriol + BMD (4 wks); then calcipotriol (4 wks) | 1 | Risk Difference (M‐H, Random, 95% CI) | 0.0 [0.0, 0.0] | |
| 6.2 Combined calcipotriol + BMD (52 wks) vs. combined calcipotriol + BMD (4 wks); then calcipotriol (48 wks) | 1 | Risk Difference (M‐H, Random, 95% CI) | 0.0 [0.0, 0.0] | |
| 6.3 Alternating: combined calcipotriol + BMD (4 wks); then calcipotriol (4 wks) vs. combined calcipotriol + BMD (4 wks); then calcipotriol (48 wks) | 1 | Risk Difference (M‐H, Random, 95% CI) | 0.0 [0.0, 0.0] | |
| 7 Withdrawals due to adverse events Show forest plot | 1 | Risk Difference (M‐H, Random, 95% CI) | Totals not selected | |
| 7.1 Combined calcipotriol + BMD (52 wks) vs. alternating: combined calcipotriol + BMD (4 wks); then calcipotriol (4 wks) | 1 | Risk Difference (M‐H, Random, 95% CI) | 0.0 [0.0, 0.0] | |
| 7.2 Combined calcipotriol + BMD (52 wks) vs. combined calcipotriol + BMD (4 wks); then calcipotriol (48 wks) | 1 | Risk Difference (M‐H, Random, 95% CI) | 0.0 [0.0, 0.0] | |
| 7.3 Alternating: combined calcipotriol + BMD (4 wks); then calcipotriol (4 wks) vs. combined calcipotriol + BMD (4 wks); then calcipotriol (48 wks) | 1 | Risk Difference (M‐H, Random, 95% CI) | 0.0 [0.0, 0.0] | |
| 8 Withdrawals due to treatment failure Show forest plot | 1 | Risk Difference (M‐H, Random, 95% CI) | Totals not selected | |
| 8.1 Combined calcipotriol + BMD (52 wks) vs. alternating: combined calcipotriol + BMD (4 wks); then calcipotriol (4 wks) | 1 | Risk Difference (M‐H, Random, 95% CI) | 0.0 [0.0, 0.0] | |
| 8.2 Combined calcipotriol + BMD (52 wks) vs. combined calcipotriol + BMD (4 wks); then calcipotriol (48 wks) | 1 | Risk Difference (M‐H, Random, 95% CI) | 0.0 [0.0, 0.0] | |
| 8.3 Alternating: combined calcipotriol + BMD (4 wks); then calcipotriol (4 wks) vs. combined calcipotriol + BMD (4 wks); then calcipotriol (48 wks) | 1 | Risk Difference (M‐H, Random, 95% CI) | 0.0 [0.0, 0.0] | |
| 9 Adverse events (local) Show forest plot | 1 | Risk Difference (M‐H, Random, 95% CI) | Totals not selected | |
| 9.1 Combined calcipotriol + BMD (52 wks) vs. alternating: combined calcipotriol + BMD (4 wks); then calcipotriol (4 wks) | 1 | Risk Difference (M‐H, Random, 95% CI) | 0.0 [0.0, 0.0] | |
| 9.2 Combined calcipotriol + BMD (52 wks) vs. combined calcipotriol + BMD (4 wks); then calcipotriol (48 wks) | 1 | Risk Difference (M‐H, Random, 95% CI) | 0.0 [0.0, 0.0] | |
| 9.3 Alternating: combined calcipotriol + BMD (4 wks); then calcipotriol (4 wks) vs. combined calcipotriol + BMD (4 wks); then calcipotriol (48 wks) | 1 | Risk Difference (M‐H, Random, 95% CI) | 0.0 [0.0, 0.0] | |
| 10 Adverse events (systemic) | 0 | Risk Difference (M‐H, Random, 95% CI) | Subtotals only | |
| 10.1 Combined calcipotriol + BMD (52 wks) vs. alternating: combined calcipotriol + BMD (4 wks); then calcipotriol (4 wks) | 0 | 0 | Risk Difference (M‐H, Random, 95% CI) | 0.0 [0.0, 0.0] |
| 10.2 Combined calcipotriol + BMD (52 wks) vs. combined calcipotriol + BMD (4 wks); then calcipotriol (48 wks) | 0 | 0 | Risk Difference (M‐H, Random, 95% CI) | 0.0 [0.0, 0.0] |
| 10.3 Alternating: combined calcipotriol + BMD (4 wks); then calcipotriol (4 wks) vs. combined calcipotriol + BMD (4 wks); then calcipotriol (48 wks) | 0 | 0 | Risk Difference (M‐H, Random, 95% CI) | 0.0 [0.0, 0.0] |
| Outcome or subgroup title | No. of studies | No. of participants | Statistical method | Effect size |
| 1 IAGI Show forest plot | 10 | Std. Mean Difference (IV, Random, 95% CI) | Subtotals only | |
| 1.1 Calcipotriol vs. coal tar | 3 | 139 | Std. Mean Difference (IV, Random, 95% CI) | ‐0.53 [‐1.74, 0.68] |
| 1.2 Calcipotriol vs. coal tar polytherapy | 2 | 209 | Std. Mean Difference (IV, Random, 95% CI) | ‐0.59 [‐0.87, ‐0.31] |
| 1.3 Calcipotriol vs. nicotinamide 1.4%, twice daily | 0 | 0 | Std. Mean Difference (IV, Random, 95% CI) | 0.0 [0.0, 0.0] |
| 1.4 Calcipotriol vs. calcipotriol + nicotinamide 1.4%, twice daily | 0 | 0 | Std. Mean Difference (IV, Random, 95% CI) | 0.0 [0.0, 0.0] |
| 1.5 Calcipotriol vs. corticosteroid + salicylic acid | 1 | 200 | Std. Mean Difference (IV, Random, 95% CI) | ‐0.06 [‐0.33, 0.22] |
| 1.6 Calcipotriol vs. propylthiouracil cream | 0 | 0 | Std. Mean Difference (IV, Random, 95% CI) | 0.0 [0.0, 0.0] |
| 1.7 Calcipotriol vs. tazarotene | 0 | 0 | Std. Mean Difference (IV, Random, 95% CI) | 0.0 [0.0, 0.0] |
| 1.8 Calcipotriol vs. tacrolimus ointment | 1 | 124 | Std. Mean Difference (IV, Random, 95% CI) | ‐0.22 [‐0.60, 0.16] |
| 1.9 Calcipotriol vs. tazarotene gel plus mometasone furoate cream | 0 | 0 | Std. Mean Difference (IV, Random, 95% CI) | 0.0 [0.0, 0.0] |
| 1.10 Calcipotriol vs. vitamin B12 cream | 1 | 26 | Std. Mean Difference (IV, Random, 95% CI) | ‐0.55 [‐1.33, 0.24] |
| 1.11 Head‐to‐head vitamin D alone or in combination: twice daily vs OD | 2 | 728 | Std. Mean Difference (IV, Random, 95% CI) | ‐0.24 [‐0.38, ‐0.09] |
| 1.12 Head‐to‐head vitamin D alone or in combination: no occlusion vs. occlusion | 0 | 0 | Std. Mean Difference (IV, Random, 95% CI) | 0.0 [0.0, 0.0] |
| 2 TSS Show forest plot | 7 | Std. Mean Difference (IV, Random, 95% CI) | Subtotals only | |
| 2.1 Calcipotriol vs. coal tar | 0 | 0 | Std. Mean Difference (IV, Random, 95% CI) | 0.0 [0.0, 0.0] |
| 2.2 Calcipotriol vs. coal tar polytherapy | 1 | 132 | Std. Mean Difference (IV, Random, 95% CI) | ‐0.51 [‐0.86, ‐0.16] |
| 2.3 Calcipotriol vs. nicotinamide 1.4%, twice daily | 1 | 96 | Std. Mean Difference (IV, Random, 95% CI) | ‐0.09 [‐0.49, 0.31] |
| 2.4 Calcipotriol vs. calcipotriol+nicotinamide (0.05%, 0.1%, 0.7%, or 1.4%), twice daily | 1 | 192 | Std. Mean Difference (IV, Random, 95% CI) | 0.19 [‐0.14, 0.52] |
| 2.5 Calcipotriol vs. corticosteroid + salicylic acid | 0 | 0 | Std. Mean Difference (IV, Random, 95% CI) | 0.0 [0.0, 0.0] |
| 2.6 Calcipotriol vs. propylthiouracil cream | 0 | 0 | Std. Mean Difference (IV, Random, 95% CI) | 0.0 [0.0, 0.0] |
| 2.7 Calcipotriol vs. tacrolimus ointment | 2 | 171 | Std. Mean Difference (IV, Random, 95% CI) | ‐0.35 [‐1.51, 0.81] |
| 2.8 Calcipotriol vs. tazarotene | 1 | 199 | Std. Mean Difference (IV, Random, 95% CI) | ‐0.05 [‐0.33, 0.23] |
| 2.9 Calcipotriol vs. tazarotene gel plus mometasone furoate cream | 0 | 0 | Std. Mean Difference (IV, Random, 95% CI) | 0.0 [0.0, 0.0] |
| 2.10 Calcipotriol vs. vitamin B12 cream | 0 | 0 | Std. Mean Difference (IV, Random, 95% CI) | 0.0 [0.0, 0.0] |
| 2.11 Head‐to‐head vitamin D alone or in combination: twice daily vs OD | 0 | 0 | Std. Mean Difference (IV, Random, 95% CI) | 0.0 [0.0, 0.0] |
| 2.12 Head‐to‐head vitamin D alone or in combination: no occlusion vs. occlusion | 2 | 247 | Std. Mean Difference (IV, Random, 95% CI) | ‐0.18 [‐2.04, 1.68] |
| 3 PASI Show forest plot | 9 | Std. Mean Difference (IV, Random, 95% CI) | Subtotals only | |
| 3.1 Calcipotriol vs. coal tar | 2 | 109 | Std. Mean Difference (IV, Random, 95% CI) | ‐0.10 [‐1.54, 1.35] |
| 3.2 Calcipotriol vs. coal tar polytherapy | 1 | 87 | Std. Mean Difference (IV, Random, 95% CI) | ‐0.63 [‐1.06, ‐0.20] |
| 3.3 Calcipotriol vs. nicotinamide 1.4%, twice daily | 0 | 0 | Std. Mean Difference (IV, Random, 95% CI) | 0.0 [0.0, 0.0] |
| 3.4 Calcipotriol vs. calcipotriol + nicotinamide 1.4%, twice daily | 0 | 0 | Std. Mean Difference (IV, Random, 95% CI) | 0.0 [0.0, 0.0] |
| 3.5 Calcipotriol vs. corticosteroid + salicylic acid | 1 | 160 | Std. Mean Difference (IV, Random, 95% CI) | ‐0.05 [‐0.36, 0.26] |
| 3.6 Calcipotriol vs. propylthiouracil cream | 1 | 27 | Std. Mean Difference (IV, Random, 95% CI) | ‐2.24 [‐3.23, ‐1.25] |
| 3.7 Calcipotriol vs. tacrolimus ointment | 0 | 0 | Std. Mean Difference (IV, Random, 95% CI) | 0.0 [0.0, 0.0] |
| 3.8 Calcipotriol vs. tazarotene | 0 | 0 | Std. Mean Difference (IV, Random, 95% CI) | 0.0 [0.0, 0.0] |
| 3.9 Calcipotriol vs. tazarotene gel plus mometasone furoate cream | 0 | 0 | Std. Mean Difference (IV, Random, 95% CI) | 0.0 [0.0, 0.0] |
| 3.10 Calcipotriol vs. vitamin B12 cream | 1 | 26 | Std. Mean Difference (IV, Random, 95% CI) | ‐0.01 [‐0.78, 0.75] |
| 3.11 Head‐to‐head vitamin D alone or in combination: twice daily vs OD | 3 | 989 | Std. Mean Difference (IV, Random, 95% CI) | ‐0.12 [‐0.25, 0.00] |
| 3.12 Head‐to‐head vitamin D alone or in combination: no occlusion vs. occlusion | 0 | 0 | Std. Mean Difference (IV, Random, 95% CI) | 0.0 [0.0, 0.0] |
| 4 PAGI Show forest plot | 6 | Std. Mean Difference (IV, Random, 95% CI) | Subtotals only | |
| 4.1 Calcipotriol vs. coal tar | 1 | 54 | Std. Mean Difference (IV, Random, 95% CI) | ‐1.51 [‐2.12, ‐0.90] |
| 4.2 Calcipotriol vs. coal tar polytherapy | 1 | 87 | Std. Mean Difference (IV, Random, 95% CI) | ‐0.56 [‐0.99, ‐0.13] |
| 4.3 Calcipotriol vs. nicotinamide 1.4%, twice daily | 0 | 0 | Std. Mean Difference (IV, Random, 95% CI) | 0.0 [0.0, 0.0] |
| 4.4 Calcipotriol vs. calcipotriol + nicotinamide 1.4%, twice daily | 0 | 0 | Std. Mean Difference (IV, Random, 95% CI) | 0.0 [0.0, 0.0] |
| 4.5 Calcipotriol vs. corticosteroid + salicylic acid | 1 | 186 | Std. Mean Difference (IV, Random, 95% CI) | ‐0.49 [‐0.79, ‐0.20] |
| 4.6 Calcipotriol vs. propylthiouracil cream | 0 | 0 | Std. Mean Difference (IV, Random, 95% CI) | 0.0 [0.0, 0.0] |
| 4.7 Calcipotriol vs. tacrolimus ointment | 1 | 124 | Std. Mean Difference (IV, Random, 95% CI) | ‐0.13 [‐0.51, 0.24] |
| 4.8 Calcipotriol vs. tazarotene | 1 | 38 | Std. Mean Difference (IV, Random, 95% CI) | ‐0.35 [‐0.99, 0.29] |
| 4.9 Calcipotriol vs. tazarotene gel plus mometasone furoate cream | 0 | 0 | Std. Mean Difference (IV, Random, 95% CI) | 0.0 [0.0, 0.0] |
| 4.10 Calcipotriol vs. vitamin B12 cream | 1 | 26 | Std. Mean Difference (IV, Random, 95% CI) | ‐0.55 [‐1.33, 0.24] |
| 4.11 Head‐to‐head vitamin D alone or in combination: twice daily vs OD | 0 | 0 | Std. Mean Difference (IV, Random, 95% CI) | 0.0 [0.0, 0.0] |
| 4.12 Head‐to‐head vitamin D alone or in combination: no occlusion vs. occlusion | 0 | 0 | Std. Mean Difference (IV, Random, 95% CI) | 0.0 [0.0, 0.0] |
| 5 Combined end point (IAGI/TSS/PASI/PAGI) Show forest plot | 19 | Std. Mean Difference (IV, Random, 95% CI) | Subtotals only | |
| 5.1 Calcipotriol vs. coal tar | 3 | 139 | Std. Mean Difference (IV, Random, 95% CI) | ‐0.53 [‐1.74, 0.68] |
| 5.2 Calcipotriol vs. coal tar polytherapy | 2 | 209 | Std. Mean Difference (IV, Random, 95% CI) | ‐0.59 [‐0.87, ‐0.31] |
| 5.3 Calcipotriol vs. nicotinamide 1.4%, twice daily | 1 | 96 | Std. Mean Difference (IV, Random, 95% CI) | ‐0.09 [‐0.49, 0.31] |
| 5.4 Calcipotriol vs. calcipotriol + nicotinamide (0.05%, 0.1%, 0.7%, or 1.4%), twice daily | 1 | 192 | Std. Mean Difference (IV, Random, 95% CI) | 0.19 [‐0.14, 0.52] |
| 5.5 Calcipotriol vs. corticosteroid + salicylic acid | 2 | 360 | Std. Mean Difference (IV, Random, 95% CI) | ‐0.05 [‐0.26, 0.15] |
| 5.6 Calcipotriol vs. propylthiouracil cream | 1 | 27 | Std. Mean Difference (IV, Random, 95% CI) | ‐2.24 [‐3.23, ‐1.25] |
| 5.7 Calcipotriol vs. tacrolimus ointment | 2 | 171 | Std. Mean Difference (IV, Random, 95% CI) | ‐0.55 [‐1.28, 0.17] |
| 5.8 Calcipotriol vs. tazarotene | 2 | 237 | Std. Mean Difference (IV, Random, 95% CI) | ‐0.10 [‐0.35, 0.16] |
| 5.9 Calcipotriol vs. tazarotene gel plus mometasone furoate cream | 0 | 0 | Std. Mean Difference (IV, Random, 95% CI) | 0.0 [0.0, 0.0] |
| 5.10 Calcipotriol vs. vitamin B12 cream | 1 | 26 | Std. Mean Difference (IV, Random, 95% CI) | ‐0.55 [‐1.33, 0.24] |
| 5.11 Head‐to‐head vitamin D alone or in combination: twice daily vs OD | 3 | 988 | Std. Mean Difference (IV, Random, 95% CI) | ‐0.20 [‐0.32, ‐0.07] |
| 5.12 Head‐to‐head vitamin D alone or in combination: no occlusion vs. occlusion | 2 | 247 | Std. Mean Difference (IV, Random, 95% CI) | ‐0.18 [‐2.04, 1.68] |
| 6 Total withdrawals Show forest plot | 15 | Risk Difference (M‐H, Random, 95% CI) | Subtotals only | |
| 6.1 Calcipotriol vs. coal tar | 2 | 120 | Risk Difference (M‐H, Random, 95% CI) | ‐0.02 [‐0.12, 0.08] |
| 6.2 Calcipotriol vs. coal tar polytherapy | 2 | 220 | Risk Difference (M‐H, Random, 95% CI) | ‐0.03 [‐0.10, 0.04] |
| 6.3 Calcipotriol vs. nicotinamide 1.4%, twice daily | 1 | 96 | Risk Difference (M‐H, Random, 95% CI) | 0.02 [‐0.05, 0.09] |
| 6.4 Calcipotriol vs. calcipotriol + nicotinamide (0.05%, 0.1%, 0.7%, or 1.4%), twice daily | 1 | 192 | Risk Difference (M‐H, Random, 95% CI) | 0.01 [‐0.06, 0.07] |
| 6.5 Calcipotriol vs. corticosteroid + salicylic acid | 1 | 160 | Risk Difference (M‐H, Random, 95% CI) | 0.04 [‐0.09, 0.17] |
| 6.6 Calcipotriol vs. propylthiouracil cream | 1 | 28 | Risk Difference (M‐H, Random, 95% CI) | 0.07 [‐0.16, 0.30] |
| 6.7 Calcipotriol vs. tacrolimus ointment | 1 | 124 | Risk Difference (M‐H, Random, 95% CI) | ‐0.13 [‐0.25, ‐0.01] |
| 6.8 Calcipotriol vs. tazarotene | 2 | 254 | Risk Difference (M‐H, Random, 95% CI) | ‐0.04 [‐0.10, 0.01] |
| 6.9 Calcipotriol vs. tazarotene gel plus mometasone furoate cream | 1 | 120 | Risk Difference (M‐H, Random, 95% CI) | ‐0.03 [‐0.15, 0.08] |
| 6.10 Calcipotriol vs. vitamin B12 cream | 1 | 26 | Risk Difference (M‐H, Random, 95% CI) | 0.0 [‐0.14, 0.14] |
| 6.11 Head‐to‐head vitamin D alone or in combination: twice daily vs OD | 3 | 1001 | Risk Difference (M‐H, Random, 95% CI) | 0.01 [‐0.03, 0.05] |
| 6.12 Head‐to‐head vitamin D alone or in combination: no occlusion vs. occlusion | 0 | 0 | Risk Difference (M‐H, Random, 95% CI) | 0.0 [0.0, 0.0] |
| 7 Withdrawals due to adverse events Show forest plot | 15 | Risk Difference (M‐H, Random, 95% CI) | Subtotals only | |
| 7.1 Calcipotriol vs. coal tar | 2 | 120 | Risk Difference (M‐H, Random, 95% CI) | 0.01 [‐0.04, 0.06] |
| 7.2 Calcipotriol vs. coal tar polytherapy | 2 | 210 | Risk Difference (M‐H, Random, 95% CI) | ‐0.02 [‐0.07, 0.03] |
| 7.3 Calcipotriol vs. nicotinamide 1.4%, twice daily | 1 | 96 | Risk Difference (M‐H, Random, 95% CI) | 0.0 [‐0.04, 0.04] |
| 7.4 Calcipotriol vs. calcipotriol + nicotinamide (0.05%, 0.1%, 0.7%, or 1.4%), twice daily | 1 | 192 | Risk Difference (M‐H, Random, 95% CI) | 0.0 [‐0.03, 0.03] |
| 7.5 Calcipotriol vs. corticosteroid + salicylic acid | 1 | 160 | Risk Difference (M‐H, Random, 95% CI) | 0.05 [‐0.00, 0.10] |
| 7.6 Calcipotriol vs. propylthiouracil cream | 1 | 28 | Risk Difference (M‐H, Random, 95% CI) | 0.07 [‐0.16, 0.30] |
| 7.7 Calcipotriol vs. tacrolimus ointment | 1 | 124 | Risk Difference (M‐H, Random, 95% CI) | 0.02 [‐0.08, 0.11] |
| 7.8 Calcipotriol vs. tazarotene | 2 | 254 | Risk Difference (M‐H, Random, 95% CI) | ‐0.05 [‐0.16, 0.05] |
| 7.9 Calcipotriol vs. tazarotene gel plus mometasone furoate cream | 1 | 120 | Risk Difference (M‐H, Random, 95% CI) | ‐0.02 [‐0.10, 0.07] |
| 7.10 Calcipotriol vs. vitamin B12 cream | 1 | 26 | Risk Difference (M‐H, Random, 95% CI) | 0.0 [‐0.14, 0.14] |
| 7.11 Head‐to‐head vitamin D alone or in combination: twice daily vs OD | 3 | 998 | Risk Difference (M‐H, Random, 95% CI) | 0.01 [‐0.01, 0.02] |
| 7.12 Head‐to‐head vitamin D alone or in combination: no occlusion vs. occlusion | 0 | 0 | Risk Difference (M‐H, Random, 95% CI) | 0.0 [0.0, 0.0] |
| 8 Withdrawals due to treatment failure Show forest plot | 12 | Risk Difference (M‐H, Random, 95% CI) | Subtotals only | |
| 8.1 Calcipotriol vs. coal tar | 1 | 60 | Risk Difference (M‐H, Random, 95% CI) | 0.0 [‐0.06, 0.06] |
| 8.2 Calcipotriol vs. coal tar polytherapy | 1 | 88 | Risk Difference (M‐H, Random, 95% CI) | 0.00 [‐0.06, 0.07] |
| 8.3 Calcipotriol vs. nicotinamide 1.4%, twice daily | 1 | 96 | Risk Difference (M‐H, Random, 95% CI) | 0.0 [‐0.04, 0.04] |
| 8.4 Calcipotriol vs. calcipotriol + nicotinamide (0.05%, 0.1%, 0.7%, or 1.4%), twice daily | 1 | 192 | Risk Difference (M‐H, Random, 95% CI) | 0.0 [‐0.03, 0.03] |
| 8.5 Calcipotriol vs. corticosteroid + salicylic acid | 1 | 160 | Risk Difference (M‐H, Random, 95% CI) | ‐0.02 [‐0.07, 0.02] |
| 8.6 Calcipotriol vs. propylthiouracil cream | 1 | 28 | Risk Difference (M‐H, Random, 95% CI) | ‐0.07 [‐0.25, 0.11] |
| 8.7 Calcipotriol vs. tacrolimus ointment | 1 | 124 | Risk Difference (M‐H, Random, 95% CI) | ‐0.02 [‐0.07, 0.03] |
| 8.8 Calcipotriol vs. tazarotene | 1 | 208 | Risk Difference (M‐H, Random, 95% CI) | 0.0 [‐0.02, 0.02] |
| 8.9 Calcipotriol vs. tazarotene gel plus mometasone furoate cream | 1 | 120 | Risk Difference (M‐H, Random, 95% CI) | 0.0 [‐0.05, 0.05] |
| 8.10 Calcipotriol vs. vitamin B12 cream | 1 | 26 | Risk Difference (M‐H, Random, 95% CI) | 0.0 [‐0.14, 0.14] |
| 8.11 Head‐to‐head vitamin D alone or in combination: twice daily vs OD | 3 | 998 | Risk Difference (M‐H, Random, 95% CI) | 0.00 [‐0.01, 0.01] |
| 8.12 Head‐to‐head vitamin D alone or in combination: no occlusion vs. occlusion | 0 | 0 | Risk Difference (M‐H, Random, 95% CI) | 0.0 [0.0, 0.0] |
| 9 Adverse events (local) Show forest plot | 11 | Risk Difference (M‐H, Random, 95% CI) | Subtotals only | |
| 9.1 Calcipotriol vs. coal tar | 2 | 120 | Risk Difference (M‐H, Random, 95% CI) | 0.02 [‐0.06, 0.10] |
| 9.2 Calcipotriol vs. coal tar polytherapy | 1 | 122 | Risk Difference (M‐H, Random, 95% CI) | 0.06 [‐0.09, 0.20] |
| 9.3 Calcipotriol vs. nicotinamide 1.4%, twice daily | 1 | 96 | Risk Difference (M‐H, Random, 95% CI) | ‐0.15 [‐0.32, 0.03] |
| 9.4 Calcipotriol vs. calcipotriol + nicotinamide (0.05%, 0.1%, 0.7%, or 1.4%), twice daily | 1 | 192 | Risk Difference (M‐H, Random, 95% CI) | ‐0.17 [‐0.30, ‐0.03] |
| 9.5 Calcipotriol vs. corticosteroid + salicylic acid | 1 | 160 | Risk Difference (M‐H, Random, 95% CI) | 0.09 [0.02, 0.15] |
| 9.6 Calcipotriol vs. propylthiouracil cream | 1 | 28 | Risk Difference (M‐H, Random, 95% CI) | ‐0.07 [‐0.25, 0.11] |
| 9.7 Calcipotriol vs. tacrolimus ointment | 1 | 124 | Risk Difference (M‐H, Random, 95% CI) | ‐0.19 [‐0.37, ‐0.01] |
| 9.8 Calcipotriol vs. tazarotene | 1 | 204 | Risk Difference (M‐H, Random, 95% CI) | ‐0.03 [‐0.11, 0.06] |
| 9.9 Calcipotriol vs. tazarotene gel plus mometasone furoate cream | 0 | 0 | Risk Difference (M‐H, Random, 95% CI) | 0.0 [0.0, 0.0] |
| 9.10 Calcipotriol vs. vitamin B12 cream | 1 | 26 | Risk Difference (M‐H, Random, 95% CI) | 0.23 [‐0.06, 0.52] |
| 9.11 Head‐to‐head vitamin D alone or in combination: twice daily vs OD | 2 | 731 | Risk Difference (M‐H, Random, 95% CI) | ‐0.00 [‐0.06, 0.05] |
| 9.12 Head‐to‐head vitamin D alone or in combination: no occlusion vs. occlusion | 0 | 0 | Risk Difference (M‐H, Random, 95% CI) | 0.0 [0.0, 0.0] |
| 10 Adverse events (systemic) Show forest plot | 8 | Risk Difference (M‐H, Random, 95% CI) | Subtotals only | |
| 10.1 Calcipotriol vs. coal tar | 1 | 60 | Risk Difference (M‐H, Random, 95% CI) | 0.0 [‐0.09, 0.09] |
| 10.2 Calcipotriol vs. coal tar polytherapy | 1 | 88 | Risk Difference (M‐H, Random, 95% CI) | 0.0 [‐0.04, 0.04] |
| 10.3 Calcipotriol vs. nicotinamide 1.4%, twice daily | 0 | 0 | Risk Difference (M‐H, Random, 95% CI) | 0.0 [0.0, 0.0] |
| 10.4 Calcipotriol vs. calcipotriol + nicotinamide 1.4%, twice daily | 0 | 0 | Risk Difference (M‐H, Random, 95% CI) | 0.0 [0.0, 0.0] |
| 10.5 Calcipotriol vs. corticosteroid + salicylic acid | 1 | 160 | Risk Difference (M‐H, Random, 95% CI) | 0.0 [‐0.02, 0.02] |
| 10.6 Calcipotriol vs. propylthiouracil cream | 1 | 28 | Risk Difference (M‐H, Random, 95% CI) | 0.0 [‐0.13, 0.13] |
| 10.7 Calcipotriol vs. tacrolimus ointment | 1 | 124 | Risk Difference (M‐H, Random, 95% CI) | 0.0 [‐0.04, 0.04] |
| 10.8 Calcipotriol vs. tazarotene | 1 | 183 | Risk Difference (M‐H, Random, 95% CI) | ‐0.01 [‐0.05, 0.03] |
| 10.9 Calcipotriol vs. tazarotene gel plus mometasone furoate cream | 0 | 0 | Risk Difference (M‐H, Random, 95% CI) | 0.0 [0.0, 0.0] |
| 10.10 Calcipotriol vs. vitamin B12 cream | 0 | 0 | Risk Difference (M‐H, Random, 95% CI) | 0.0 [0.0, 0.0] |
| 10.11 Head‐to‐head vitamin D alone or in combination: twice daily vs OD | 1 | 264 | Risk Difference (M‐H, Random, 95% CI) | 0.0 [‐0.01, 0.01] |
| 10.12 Head‐to‐head vitamin D alone or in combination: no occlusion vs. occlusion | 1 | 38 | Risk Difference (M‐H, Random, 95% CI) | 0.0 [‐0.10, 0.10] |
| Outcome or subgroup title | No. of studies | No. of participants | Statistical method | Effect size |
| 1 IAGI Show forest plot | 1 | Std. Mean Difference (IV, Random, 95% CI) | Totals not selected | |
| 1.1 Betamethasone valerate 0.1%, OD | 0 | Std. Mean Difference (IV, Random, 95% CI) | 0.0 [0.0, 0.0] | |
| 1.2 Calcipotriol ointment, OD | 0 | Std. Mean Difference (IV, Random, 95% CI) | 0.0 [0.0, 0.0] | |
| 1.3 Pimecrolimus cream, 1% OD/twice daily | 1 | Std. Mean Difference (IV, Random, 95% CI) | 0.0 [0.0, 0.0] | |
| 1.4 Tacrolimus ointment 0.1%, twice daily | 0 | Std. Mean Difference (IV, Random, 95% CI) | 0.0 [0.0, 0.0] | |
| 2 TSS Show forest plot | 1 | Std. Mean Difference (IV, Random, 95% CI) | Totals not selected | |
| 2.1 Betamethasone valerate 0.1%, OD | 0 | Std. Mean Difference (IV, Random, 95% CI) | 0.0 [0.0, 0.0] | |
| 2.2 Calcipotriol ointment, OD | 0 | Std. Mean Difference (IV, Random, 95% CI) | 0.0 [0.0, 0.0] | |
| 2.3 Pimecrolimus cream, 1% OD/twice daily | 1 | Std. Mean Difference (IV, Random, 95% CI) | 0.0 [0.0, 0.0] | |
| 2.4 Tacrolimus ointment 0.1%, twice daily | 0 | Std. Mean Difference (IV, Random, 95% CI) | 0.0 [0.0, 0.0] | |
| 3 PASI Show forest plot | 1 | Std. Mean Difference (IV, Random, 95% CI) | Totals not selected | |
| 3.1 Betamethasone valerate 0.1%, OD | 1 | Std. Mean Difference (IV, Random, 95% CI) | 0.0 [0.0, 0.0] | |
| 3.2 Calcipotriol ointment, OD | 1 | Std. Mean Difference (IV, Random, 95% CI) | 0.0 [0.0, 0.0] | |
| 3.3 Pimecrolimus cream, 1% OD/twice daily | 1 | Std. Mean Difference (IV, Random, 95% CI) | 0.0 [0.0, 0.0] | |
| 3.4 Tacrolimus ointment 0.1%, twice daily | 0 | Std. Mean Difference (IV, Random, 95% CI) | 0.0 [0.0, 0.0] | |
| 4 PAGI Show forest plot | 1 | Std. Mean Difference (IV, Random, 95% CI) | Subtotals only | |
| 4.1 Betamethasone valerate 0.1%, OD | 0 | 0 | Std. Mean Difference (IV, Random, 95% CI) | 0.0 [0.0, 0.0] |
| 4.2 Calcipotriol ointment, OD | 0 | 0 | Std. Mean Difference (IV, Random, 95% CI) | 0.0 [0.0, 0.0] |
| 4.3 Pimecrolimus cream, 1% OD/twice daily | 1 | 47 | Std. Mean Difference (IV, Random, 95% CI) | ‐0.65 [‐1.24, ‐0.06] |
| 4.4 Tacrolimus ointment 0.1%, twice daily | 0 | 0 | Std. Mean Difference (IV, Random, 95% CI) | 0.0 [0.0, 0.0] |
| 5 Combined end point (IAGI/TSS/PASI/PAGI) Show forest plot | 2 | Std. Mean Difference (IV, Random, 95% CI) | Subtotals only | |
| 5.1 Betamethasone valerate 0.1%, OD | 1 | 36 | Std. Mean Difference (IV, Random, 95% CI) | ‐2.83 [‐3.79, ‐1.88] |
| 5.2 Calcipotriol ointment, OD | 1 | 38 | Std. Mean Difference (IV, Random, 95% CI) | ‐1.08 [‐1.77, ‐0.40] |
| 5.3 Pimecrolimus cream, 1% OD/twice daily | 2 | 86 | Std. Mean Difference (IV, Random, 95% CI) | ‐0.86 [‐1.30, ‐0.41] |
| 5.4 Tacrolimus ointment 0.1%, twice daily | 0 | 0 | Std. Mean Difference (IV, Random, 95% CI) | 0.0 [0.0, 0.0] |
| 6 Total withdrawals Show forest plot | 3 | Risk Difference (M‐H, Random, 95% CI) | Subtotals only | |
| 6.1 Betamethasone valerate 0.1%, OD | 1 | 40 | Risk Difference (M‐H, Random, 95% CI) | 0.10 [‐0.08, 0.28] |
| 6.2 Calcipotriol ointment, OD | 1 | 40 | Risk Difference (M‐H, Random, 95% CI) | 0.0 [‐0.14, 0.14] |
| 6.3 Pimecrolimus cream, 1% OD/twice daily | 2 | 97 | Risk Difference (M‐H, Random, 95% CI) | ‐0.06 [‐0.16, 0.04] |
| 6.4 Tacrolimus ointment 0.1%, twice daily | 1 | 167 | Risk Difference (M‐H, Random, 95% CI) | ‐0.17 [‐0.30, ‐0.03] |
| 7 Withdrawals due to adverse events Show forest plot | 3 | Risk Difference (M‐H, Random, 95% CI) | Subtotals only | |
| 7.1 Betamethasone valerate 0.1%, OD | 1 | 40 | Risk Difference (M‐H, Random, 95% CI) | 0.0 [‐0.09, 0.09] |
| 7.2 Calcipotriol ointment, OD | 1 | 40 | Risk Difference (M‐H, Random, 95% CI) | 0.0 [‐0.09, 0.09] |
| 7.3 Pimecrolimus cream, 1% OD/twice daily | 2 | 97 | Risk Difference (M‐H, Random, 95% CI) | 0.0 [‐0.05, 0.05] |
| 7.4 Tacrolimus ointment 0.1%, twice daily | 1 | 167 | Risk Difference (M‐H, Random, 95% CI) | ‐0.02 [‐0.06, 0.03] |
| 8 Withdrawals due to treatment failure Show forest plot | 3 | Risk Difference (M‐H, Random, 95% CI) | Subtotals only | |
| 8.1 Betamethasone valerate 0.1%, OD | 1 | 40 | Risk Difference (M‐H, Random, 95% CI) | ‐0.05 [‐0.18, 0.08] |
| 8.2 Calcipotriol ointment, OD | 1 | 40 | Risk Difference (M‐H, Random, 95% CI) | ‐0.05 [‐0.18, 0.08] |
| 8.3 Pimecrolimus cream, 1% OD/twice daily | 2 | 97 | Risk Difference (M‐H, Random, 95% CI) | ‐0.04 [‐0.13, 0.04] |
| 8.4 Tacrolimus ointment 0.1%, twice daily | 1 | 167 | Risk Difference (M‐H, Random, 95% CI) | ‐0.11 [‐0.19, ‐0.02] |
| 9 Adverse events (local) Show forest plot | 3 | Risk Difference (M‐H, Random, 95% CI) | Subtotals only | |
| 9.1 Betamethasone valerate 0.1%, OD | 1 | 40 | Risk Difference (M‐H, Random, 95% CI) | ‐0.05 [‐0.18, 0.08] |
| 9.2 Calcipotriol ointment, OD | 1 | 40 | Risk Difference (M‐H, Random, 95% CI) | 0.05 [‐0.11, 0.21] |
| 9.3 Pimecrolimus cream 1%, OD/twice daily | 2 | 97 | Risk Difference (M‐H, Random, 95% CI) | 0.08 [‐0.15, 0.31] |
| 9.4 Tacrolimus ointment 0.1%, twice daily | 1 | 167 | Risk Difference (M‐H, Random, 95% CI) | ‐0.17 [‐0.30, ‐0.03] |
| 10 Adverse events (systemic) Show forest plot | 1 | Risk Difference (M‐H, Random, 95% CI) | Totals not selected | |
| 10.1 Betamethasone valerate 0.1%, OD | 0 | Risk Difference (M‐H, Random, 95% CI) | 0.0 [0.0, 0.0] | |
| 10.2 Calcipotriol ointment, OD | 0 | Risk Difference (M‐H, Random, 95% CI) | 0.0 [0.0, 0.0] | |
| 10.3 Pimecrolimus cream 1%, OD/twice daily | 0 | Risk Difference (M‐H, Random, 95% CI) | 0.0 [0.0, 0.0] | |
| 10.4 Tacrolimus ointment 0.1%, twice daily | 1 | Risk Difference (M‐H, Random, 95% CI) | 0.0 [0.0, 0.0] | |
| Outcome or subgroup title | No. of studies | No. of participants | Statistical method | Effect size |
| 1 IAGI Show forest plot | 2 | Std. Mean Difference (IV, Random, 95% CI) | Subtotals only | |
| 1.1 Calcipotriol vs. BMV | 0 | 0 | Std. Mean Difference (IV, Random, 95% CI) | 0.0 [0.0, 0.0] |
| 1.2 Calcipotriol vs. calcipotriol + hydrocortisone | 1 | 408 | Std. Mean Difference (IV, Random, 95% CI) | 0.30 [0.11, 0.50] |
| 1.3 Calcipotriol vs. calcitriol | 0 | 0 | Std. Mean Difference (IV, Random, 95% CI) | 0.0 [0.0, 0.0] |
| 1.4 Calcipotriol vs. pimecrolimus | 0 | 0 | Std. Mean Difference (IV, Random, 95% CI) | 0.0 [0.0, 0.0] |
| 1.5 Calcitriol vs. tacrolimus | 1 | 49 | Std. Mean Difference (IV, Random, 95% CI) | 0.42 [‐0.15, 0.98] |
| 2 TSS Show forest plot | 2 | Std. Mean Difference (IV, Random, 95% CI) | Subtotals only | |
| 2.1 Calcipotriol vs. BMV | 0 | 0 | Std. Mean Difference (IV, Random, 95% CI) | 0.0 [0.0, 0.0] |
| 2.2 Calcipotriol vs. calcipotriol + hydrocortisone | 0 | 0 | Std. Mean Difference (IV, Random, 95% CI) | 0.0 [0.0, 0.0] |
| 2.3 Calcipotriol vs. calcitriol | 1 | 150 | Std. Mean Difference (IV, Random, 95% CI) | 0.61 [0.28, 0.94] |
| 2.4 Calcipotriol vs. pimecrolimus | 0 | 0 | Std. Mean Difference (IV, Random, 95% CI) | 0.0 [0.0, 0.0] |
| 2.5 Calcitriol vs. tacrolimus | 1 | 49 | Std. Mean Difference (IV, Random, 95% CI) | 0.29 [‐0.27, 0.85] |
| 3 PASI Show forest plot | 2 | Std. Mean Difference (IV, Random, 95% CI) | Subtotals only | |
| 3.1 Calcipotriol vs. BMV | 1 | 36 | Std. Mean Difference (IV, Random, 95% CI) | 2.02 [1.20, 2.84] |
| 3.2 Calcipotriol vs. calcipotriol + hydrocortisone | 1 | 408 | Std. Mean Difference (IV, Random, 95% CI) | 0.32 [0.12, 0.51] |
| 3.3 Calcipotriol vs. calcitriol | 0 | 0 | Std. Mean Difference (IV, Random, 95% CI) | 0.0 [0.0, 0.0] |
| 3.4 Calcipotriol vs. pimecrolimus | 1 | 39 | Std. Mean Difference (IV, Random, 95% CI) | ‐0.53 [‐1.17, 0.11] |
| 3.5 Calcitriol vs. tacrolimus | 0 | 0 | Std. Mean Difference (IV, Random, 95% CI) | 0.0 [0.0, 0.0] |
| 4 PAGI | 0 | Std. Mean Difference (IV, Random, 95% CI) | Subtotals only | |
| 4.1 Calcipotriol vs. BMV | 0 | 0 | Std. Mean Difference (IV, Random, 95% CI) | 0.0 [0.0, 0.0] |
| 4.2 Calcipotriol vs. calcipotriol + hydrocortisone | 0 | 0 | Std. Mean Difference (IV, Random, 95% CI) | 0.0 [0.0, 0.0] |
| 4.3 Calcipotriol vs. calcitriol | 0 | 0 | Std. Mean Difference (IV, Random, 95% CI) | 0.0 [0.0, 0.0] |
| 4.4 Calcipotriol vs. pimecrolimus | 0 | 0 | Std. Mean Difference (IV, Random, 95% CI) | 0.0 [0.0, 0.0] |
| 4.5 Calcitriol vs. tacrolimus | 0 | 0 | Std. Mean Difference (IV, Random, 95% CI) | 0.0 [0.0, 0.0] |
| 5 Combined end point (IAGI/TSS/PASI/PAGI) Show forest plot | 4 | Std. Mean Difference (IV, Random, 95% CI) | Subtotals only | |
| 5.1 Calcipotriol vs. BMV | 1 | 36 | Std. Mean Difference (IV, Random, 95% CI) | 2.02 [1.20, 2.84] |
| 5.2 Calcipotriol vs. calcipotriol + hydrocortisone | 1 | 408 | Std. Mean Difference (IV, Random, 95% CI) | 0.30 [0.11, 0.50] |
| 5.3 Calcipotriol vs. calcitriol | 1 | 150 | Std. Mean Difference (IV, Random, 95% CI) | 0.61 [0.28, 0.94] |
| 5.4 Calcipotriol vs. pimecrolimus | 1 | 39 | Std. Mean Difference (IV, Random, 95% CI) | ‐0.53 [‐1.17, 0.11] |
| 5.5 Calcitriol vs. tacrolimus | 1 | 49 | Std. Mean Difference (IV, Random, 95% CI) | 0.42 [‐0.15, 0.98] |
| 6 Total withdrawals Show forest plot | 4 | Risk Difference (M‐H, Random, 95% CI) | Subtotals only | |
| 6.1 Calcipotriol vs. BMV | 1 | 40 | Risk Difference (M‐H, Random, 95% CI) | ‐0.10 [‐0.28, 0.08] |
| 6.2 Calcipotriol vs. calcipotriol + hydrocortisone | 1 | 408 | Risk Difference (M‐H, Random, 95% CI) | 0.04 [‐0.03, 0.11] |
| 6.3 Calcipotriol vs. calcitriol | 1 | 150 | Risk Difference (M‐H, Random, 95% CI) | 0.0 [‐0.11, 0.11] |
| 6.4 Calcipotriol vs. pimecrolimus | 1 | 40 | Risk Difference (M‐H, Random, 95% CI) | 0.05 [‐0.08, 0.18] |
| 6.5 Calcitriol vs. tacrolimus | 1 | 50 | Risk Difference (M‐H, Random, 95% CI) | 0.12 [‐0.02, 0.26] |
| 7 Withdrawals due to adverse events Show forest plot | 4 | Risk Difference (M‐H, Random, 95% CI) | Subtotals only | |
| 7.1 Calcipotriol vs. BMV | 1 | 40 | Risk Difference (M‐H, Random, 95% CI) | 0.0 [‐0.09, 0.09] |
| 7.2 Calcipotriol vs. calcipotriol + hydrocortisone | 1 | 408 | Risk Difference (M‐H, Random, 95% CI) | 0.06 [0.02, 0.11] |
| 7.3 Calcipotriol vs. calcitriol | 1 | 150 | Risk Difference (M‐H, Random, 95% CI) | 0.09 [0.01, 0.18] |
| 7.4 Calcipotriol vs. pimecrolimus | 1 | 40 | Risk Difference (M‐H, Random, 95% CI) | 0.0 [‐0.09, 0.09] |
| 7.5 Calcitriol vs. tacrolimus | 1 | 50 | Risk Difference (M‐H, Random, 95% CI) | 0.0 [‐0.07, 0.07] |
| 8 Withdrawals due to treatment failure Show forest plot | 4 | Risk Difference (M‐H, Random, 95% CI) | Subtotals only | |
| 8.1 Calcipotriol vs. BMV | 1 | 40 | Risk Difference (M‐H, Random, 95% CI) | 0.0 [‐0.09, 0.09] |
| 8.2 Calcipotriol vs. calcipotriol + hydrocortisone | 1 | 408 | Risk Difference (M‐H, Random, 95% CI) | 0.02 [‐0.01, 0.05] |
| 8.3 Calcipotriol vs. calcitriol | 1 | 150 | Risk Difference (M‐H, Random, 95% CI) | 0.0 [‐0.03, 0.03] |
| 8.4 Calcipotriol vs. pimecrolimus | 1 | 40 | Risk Difference (M‐H, Random, 95% CI) | 0.0 [‐0.09, 0.09] |
| 8.5 Calcitriol vs. tacrolimus | 1 | 50 | Risk Difference (M‐H, Random, 95% CI) | 0.0 [‐0.07, 0.07] |
| 9 Adverse events (local) Show forest plot | 3 | Risk Difference (M‐H, Random, 95% CI) | Subtotals only | |
| 9.1 calcipotriol vs. BMV | 1 | 40 | Risk Difference (M‐H, Random, 95% CI) | 0.10 [‐0.05, 0.25] |
| 9.2 Calcipotriol vs. calcipotriol + hydrocortisone | 1 | 404 | Risk Difference (M‐H, Random, 95% CI) | 0.15 [0.08, 0.23] |
| 9.3 Calcipotriol vs. calcitriol | 1 | 150 | Risk Difference (M‐H, Random, 95% CI) | 0.09 [0.02, 0.17] |
| 9.4 Calcipotriol vs. pimecrolimus | 1 | 40 | Risk Difference (M‐H, Random, 95% CI) | ‐0.15 [‐0.38, 0.08] |
| 9.5 Calcitriol vs. tacrolimus | 0 | 0 | Risk Difference (M‐H, Random, 95% CI) | 0.0 [0.0, 0.0] |
| 10 Adverse events (systemic) | 0 | Risk Difference (M‐H, Random, 95% CI) | Subtotals only | |
| 10.1 Calcipotriol vs. BMV | 0 | 0 | Risk Difference (M‐H, Random, 95% CI) | 0.0 [0.0, 0.0] |
| 10.2 Calcipotriol vs. calcipotriol + hydrocortisone | 0 | 0 | Risk Difference (M‐H, Random, 95% CI) | 0.0 [0.0, 0.0] |
| 10.3 Calcipotriol vs. calcitriol | 0 | 0 | Risk Difference (M‐H, Random, 95% CI) | 0.0 [0.0, 0.0] |
| 10.4 Calcipotriol vs. pimecrolimus | 0 | 0 | Risk Difference (M‐H, Random, 95% CI) | 0.0 [0.0, 0.0] |
| 10.5 Calcitriol vs. tacrolimus | 0 | 0 | Risk Difference (M‐H, Random, 95% CI) | 0.0 [0.0, 0.0] |
| Outcome or subgroup title | No. of studies | No. of participants | Statistical method | Effect size |
| 1 IAGI Show forest plot | 9 | Std. Mean Difference (IV, Random, 95% CI) | Subtotals only | |
| 1.1 Vitamin D: calcipotriol | 2 | 457 | Std. Mean Difference (IV, Random, 95% CI) | ‐0.72 [‐1.28, ‐0.16] |
| 1.2 Potent steroid: betamethasone dipropionate | 2 | 712 | Std. Mean Difference (IV, Random, 95% CI) | ‐1.09 [‐1.29, ‐0.90] |
| 1.3 Potent steroid: betamethasone valerate | 0 | 0 | Std. Mean Difference (IV, Random, 95% CI) | 0.0 [0.0, 0.0] |
| 1.4 Very potent steroid: amcinonide | 1 | 132 | Std. Mean Difference (IV, Random, 95% CI) | ‐1.42 [‐1.80, ‐1.04] |
| 1.5 Very potent steroid: clobetasol propionate | 2 | 458 | Std. Mean Difference (IV, Random, 95% CI) | ‐1.73 [‐1.99, ‐1.48] |
| 1.6 Very potent steroid: halcinonide | 1 | 54 | Std. Mean Difference (IV, Random, 95% CI) | ‐1.11 [‐1.69, ‐0.53] |
| 1.7 Vitamin D in combination: calcipotriol + BMD | 2 | 854 | Std. Mean Difference (IV, Random, 95% CI) | ‐0.97 [‐1.61, ‐0.32] |
| 1.8 Other treatment: betamethasone‐17,21‐dipropionate plus salicylic acid | 1 | 20 | Std. Mean Difference (IV, Random, 95% CI) | ‐1.48 [‐2.50, ‐0.47] |
| 1.9 Other treatment: ciclopirox olamine shampoo | 0 | 0 | Std. Mean Difference (IV, Random, 95% CI) | 0.0 [0.0, 0.0] |
| 1.10 Other treatment: fluocinolone acetonide, plus occlusion | 1 | 84 | Std. Mean Difference (IV, Random, 95% CI) | ‐1.22 [‐1.69, ‐0.76] |
| 1.11 Other treatment: salicylic acid | 1 | 20 | Std. Mean Difference (IV, Random, 95% CI) | ‐0.86 [‐1.79, 0.06] |
| 2 TSS Show forest plot | 11 | Std. Mean Difference (IV, Random, 95% CI) | Subtotals only | |
| 2.1 Vitamin D: calcipotriol | 2 | 457 | Std. Mean Difference (IV, Random, 95% CI) | ‐0.44 [‐0.64, ‐0.25] |
| 2.2 Potent steroid: betamethasone dipropionate | 2 | 712 | Std. Mean Difference (IV, Random, 95% CI) | ‐1.00 [‐1.19, ‐0.81] |
| 2.3 Potent steroid: betamethasone valerate | 1 | 172 | Std. Mean Difference (IV, Random, 95% CI) | ‐1.40 [‐1.75, ‐1.05] |
| 2.4 Very potent steroid: amcinonide | 1 | 126 | Std. Mean Difference (IV, Random, 95% CI) | ‐1.58 [‐1.98, ‐1.18] |
| 2.5 Very potent steroid: clobetasol propionate | 3 | 707 | Std. Mean Difference (IV, Random, 95% CI) | ‐1.53 [‐1.77, ‐1.28] |
| 2.6 Very potent steroid: halcinonide | 0 | 0 | Std. Mean Difference (IV, Random, 95% CI) | 0.0 [0.0, 0.0] |
| 2.7 Vitamin D in combination: calcipotriol + BMD | 2 | 854 | Std. Mean Difference (IV, Random, 95% CI) | ‐0.92 [‐1.42, ‐0.43] |
| 2.8 Other treatment: betamethasone‐17,21‐dipropionate plus salicylic acid | 1 | 20 | Std. Mean Difference (IV, Random, 95% CI) | ‐1.15 [‐2.11, ‐0.19] |
| 2.9 Other treatment: ciclopirox olamine shampoo | 1 | 37 | Std. Mean Difference (IV, Random, 95% CI) | ‐0.07 [‐0.82, 0.68] |
| 2.10 Other treatment: fluocinolone acetonide, plus occlusion | 1 | 84 | Std. Mean Difference (IV, Random, 95% CI) | ‐0.89 [‐1.34, ‐0.44] |
| 2.11 Other treatment: salicylic acid | 1 | 20 | Std. Mean Difference (IV, Random, 95% CI) | ‐0.57 [‐1.47, 0.32] |
| 3 PASI | 0 | Std. Mean Difference (IV, Random, 95% CI) | Subtotals only | |
| 3.1 Vitamin D: calcipotriol | 0 | 0 | Std. Mean Difference (IV, Random, 95% CI) | 0.0 [0.0, 0.0] |
| 3.2 Potent steroid: betamethasone dipropionate | 0 | 0 | Std. Mean Difference (IV, Random, 95% CI) | 0.0 [0.0, 0.0] |
| 3.3 Potent steroid: betamethasone valerate | 0 | 0 | Std. Mean Difference (IV, Random, 95% CI) | 0.0 [0.0, 0.0] |
| 3.4 Very potent steroid: amcinonide | 0 | 0 | Std. Mean Difference (IV, Random, 95% CI) | 0.0 [0.0, 0.0] |
| 3.5 Very potent steroid: clobetasol propionate | 0 | 0 | Std. Mean Difference (IV, Random, 95% CI) | 0.0 [0.0, 0.0] |
| 3.6 Very potent steroid: halcinonide | 0 | 0 | Std. Mean Difference (IV, Random, 95% CI) | 0.0 [0.0, 0.0] |
| 3.7 Vitamin D in combination: calcipotriol + BMD | 0 | 0 | Std. Mean Difference (IV, Random, 95% CI) | 0.0 [0.0, 0.0] |
| 3.8 Other treatment: betamethasone‐17,21‐dipropionate plus salicylic acid | 0 | 0 | Std. Mean Difference (IV, Random, 95% CI) | 0.0 [0.0, 0.0] |
| 3.9 Other treatment: ciclopirox olamine shampoo | 0 | 0 | Std. Mean Difference (IV, Random, 95% CI) | 0.0 [0.0, 0.0] |
| 3.10 Other treatment: fluocinolone acetonide, plus occlusion | 0 | 0 | Std. Mean Difference (IV, Random, 95% CI) | 0.0 [0.0, 0.0] |
| 3.11 Other treatment: salicylic acid | 0 | 0 | Std. Mean Difference (IV, Random, 95% CI) | 0.0 [0.0, 0.0] |
| 4 PAGI Show forest plot | 5 | Std. Mean Difference (IV, Random, 95% CI) | Subtotals only | |
| 4.1 Vitamin D: calcipotriol | 2 | 450 | Std. Mean Difference (IV, Random, 95% CI) | ‐0.66 [‐1.28, ‐0.05] |
| 4.2 Potent steroid: betamethasone dipropionate | 1 | 685 | Std. Mean Difference (IV, Random, 95% CI) | ‐1.23 [‐1.43, ‐1.03] |
| 4.3 Potent steroid: betamethasone valerate | 0 | 0 | Std. Mean Difference (IV, Random, 95% CI) | 0.0 [0.0, 0.0] |
| 4.4 Very potent steroid: amcinonide | 1 | 132 | Std. Mean Difference (IV, Random, 95% CI) | ‐0.97 [‐1.33, ‐0.61] |
| 4.5 Very potent steroid: clobetasol propionate | 0 | 0 | Std. Mean Difference (IV, Random, 95% CI) | 0.0 [0.0, 0.0] |
| 4.6 Very potent steroid: halcinonide | 0 | 0 | Std. Mean Difference (IV, Random, 95% CI) | 0.0 [0.0, 0.0] |
| 4.7 Vitamin D in combination: calcipotriol + BMD | 2 | 841 | Std. Mean Difference (IV, Random, 95% CI) | ‐1.00 [‐1.79, ‐0.22] |
| 4.8 Other treatment: betamethasone‐17,21‐dipropionate plus salicylic acid | 0 | 0 | Std. Mean Difference (IV, Random, 95% CI) | 0.0 [0.0, 0.0] |
| 4.9 Other treatment: ciclopirox olamine shampoo | 1 | 37 | Std. Mean Difference (IV, Random, 95% CI) | ‐0.11 [‐0.86, 0.64] |
| 4.10 Other treatment: fluocinolone acetonide, plus occlusion | 0 | 0 | Std. Mean Difference (IV, Random, 95% CI) | 0.0 [0.0, 0.0] |
| 4.11 Other treatment: salicylic acid | 0 | 0 | Std. Mean Difference (IV, Random, 95% CI) | 0.0 [0.0, 0.0] |
| 5 Combined end point (IAGI/TSS/PASI/PAGI) Show forest plot | 13 | Std. Mean Difference (IV, Random, 95% CI) | Subtotals only | |
| 5.1 Vitamin D: calcipotriol | 2 | 457 | Std. Mean Difference (IV, Random, 95% CI) | ‐0.72 [‐1.28, ‐0.16] |
| 5.2 Potent steroid: betamethasone dipropionate | 2 | 712 | Std. Mean Difference (IV, Random, 95% CI) | ‐1.09 [‐1.29, ‐0.90] |
| 5.3 Potent steroid: betamethasone valerate | 1 | 172 | Std. Mean Difference (IV, Random, 95% CI) | ‐1.40 [‐1.75, ‐1.05] |
| 5.4 Very potent steroid: amcinonide | 1 | 132 | Std. Mean Difference (IV, Random, 95% CI) | ‐1.42 [‐1.80, ‐1.04] |
| 5.5 Very potent steroid: clobetasol propionate | 4 | 788 | Std. Mean Difference (IV, Random, 95% CI) | ‐1.57 [‐1.81, ‐1.34] |
| 5.6 Very potent steroid: halcinonide | 1 | 54 | Std. Mean Difference (IV, Random, 95% CI) | ‐1.11 [‐1.69, ‐0.53] |
| 5.7 Vitamin D in combination: calcipotriol + BMD | 2 | 854 | Std. Mean Difference (IV, Random, 95% CI) | ‐0.97 [‐1.61, ‐0.32] |
| 5.8 Other treatment: betamethasone‐17,21‐dipropionate plus salicylic acid | 1 | 20 | Std. Mean Difference (IV, Random, 95% CI) | ‐1.48 [‐2.50, ‐0.47] |
| 5.9 Other treatment: ciclopirox olamine shampoo | 1 | 37 | Std. Mean Difference (IV, Random, 95% CI) | ‐0.07 [‐0.82, 0.68] |
| 5.10 Other treatment: fluocinolone acetonide, plus occlusion | 1 | 84 | Std. Mean Difference (IV, Random, 95% CI) | ‐1.22 [‐1.69, ‐0.76] |
| 5.11 Other treatment: salicylic acid | 1 | 20 | Std. Mean Difference (IV, Random, 95% CI) | ‐0.86 [‐1.79, 0.06] |
| 6 Total withdrawals Show forest plot | 13 | Risk Difference (M‐H, Random, 95% CI) | Subtotals only | |
| 6.1 Vitamin D: calcipotriol | 3 | 517 | Risk Difference (M‐H, Random, 95% CI) | ‐0.02 [‐0.08, 0.05] |
| 6.2 Potent steroid: betamethasone dipropionate | 1 | 692 | Risk Difference (M‐H, Random, 95% CI) | ‐0.14 [‐0.21, ‐0.06] |
| 6.3 Potent steroid: betamethasone valerate | 0 | 0 | Risk Difference (M‐H, Random, 95% CI) | 0.0 [0.0, 0.0] |
| 6.4 Very potent steroid: amcinonide | 1 | 165 | Risk Difference (M‐H, Random, 95% CI) | ‐0.00 [‐0.11, 0.11] |
| 6.5 Very potent steroid: clobetasol propionate | 5 | 1006 | Risk Difference (M‐H, Random, 95% CI) | ‐0.03 [‐0.10, 0.04] |
| 6.6 Very potent steroid: halcinonide | 1 | 58 | Risk Difference (M‐H, Random, 95% CI) | 0.0 [‐0.13, 0.13] |
| 6.7 Vitamin D in combination: calcipotriol + BMD | 2 | 854 | Risk Difference (M‐H, Random, 95% CI) | ‐0.09 [‐0.16, ‐0.03] |
| 6.8 Other treatment: betamethasone‐17,21‐dipropionate plus salicylic acid | 0 | 0 | Risk Difference (M‐H, Random, 95% CI) | 0.0 [0.0, 0.0] |
| 6.9 Other treatment: ciclopirox olamine shampoo | 1 | 40 | Risk Difference (M‐H, Random, 95% CI) | ‐0.15 [‐0.38, 0.09] |
| 6.10 Other treatment: fluocinolone acetonide, plus occlusion | 1 | 89 | Risk Difference (M‐H, Random, 95% CI) | ‐0.04 [‐0.13, 0.04] |
| 6.11 Other treatment: salicylic acid | 0 | 0 | Risk Difference (M‐H, Random, 95% CI) | 0.0 [0.0, 0.0] |
| 7 Withdrawals due to adverse events Show forest plot | 13 | Risk Difference (M‐H, Random, 95% CI) | Subtotals only | |
| 7.1 Vitamin D: calcipotriol | 3 | 517 | Risk Difference (M‐H, Random, 95% CI) | 0.02 [‐0.02, 0.05] |
| 7.2 Potent steroid: betamethasone dipropionate | 2 | 712 | Risk Difference (M‐H, Random, 95% CI) | ‐0.04 [‐0.08, ‐0.00] |
| 7.3 Potent steroid: betamethasone valerate | 1 | 172 | Risk Difference (M‐H, Random, 95% CI) | 0.0 [‐0.03, 0.03] |
| 7.4 Very potent steroid: amcinonide | 1 | 165 | Risk Difference (M‐H, Random, 95% CI) | 0.01 [‐0.02, 0.04] |
| 7.5 Very potent steroid: clobetasol propionate | 5 | 1006 | Risk Difference (M‐H, Random, 95% CI) | ‐0.00 [‐0.02, 0.01] |
| 7.6 Very potent steroid: halcinonide | 1 | 58 | Risk Difference (M‐H, Random, 95% CI) | 0.0 [‐0.06, 0.06] |
| 7.7 Vitamin D in combination: calcipotriol + BMD | 1 | 677 | Risk Difference (M‐H, Random, 95% CI) | ‐0.04 [‐0.08, 0.00] |
| 7.8 Other treatment: betamethasone‐17,21‐dipropionate plus salicylic acid | 1 | 20 | Risk Difference (M‐H, Random, 95% CI) | 0.0 [‐0.17, 0.17] |
| 7.9 Other treatment: ciclopirox olamine shampoo | 1 | 40 | Risk Difference (M‐H, Random, 95% CI) | ‐0.18 [‐0.42, 0.05] |
| 7.10 Other treatment: fluocinolone acetonide, plus occlusion | 0 | 0 | Risk Difference (M‐H, Random, 95% CI) | 0.0 [0.0, 0.0] |
| 7.11 Other treatment: salicylic acid | 1 | 20 | Risk Difference (M‐H, Random, 95% CI) | 0.0 [‐0.17, 0.17] |
| 8 Withdrawals due to treatment failure Show forest plot | 9 | Risk Difference (M‐H, Random, 95% CI) | Subtotals only | |
| 8.1 Vitamin D: calcipotriol | 2 | 457 | Risk Difference (M‐H, Random, 95% CI) | ‐0.05 [‐0.11, 0.00] |
| 8.2 Potent steroid: betamethasone dipropionate | 1 | 692 | Risk Difference (M‐H, Random, 95% CI) | ‐0.10 [‐0.16, ‐0.05] |
| 8.3 Potent steroid: betamethasone valerate | 0 | 0 | Risk Difference (M‐H, Random, 95% CI) | 0.0 [0.0, 0.0] |
| 8.4 Very potent steroid: amcinonide | 1 | 165 | Risk Difference (M‐H, Random, 95% CI) | ‐0.01 [‐0.05, 0.02] |
| 8.5 Very potent steroid: clobetasol propionate | 5 | 1006 | Risk Difference (M‐H, Random, 95% CI) | ‐0.01 [‐0.05, 0.02] |
| 8.6 Very potent steroid: halcinonide | 0 | 0 | Risk Difference (M‐H, Random, 95% CI) | 0.0 [0.0, 0.0] |
| 8.7 Vitamin D in combination: calcipotriol + BMD | 1 | 677 | Risk Difference (M‐H, Random, 95% CI) | ‐0.11 [‐0.17, ‐0.06] |
| 8.8 Other treatment: betamethasone‐17,21‐dipropionate plus salicylic acid | 0 | 0 | Risk Difference (M‐H, Random, 95% CI) | 0.0 [0.0, 0.0] |
| 8.9 Other treatment: ciclopirox olamine shampoo | 1 | 40 | Risk Difference (M‐H, Random, 95% CI) | ‐0.09 [‐0.28, 0.10] |
| 8.10 Other treatment: fluocinolone acetonide, plus occlusion | 0 | 0 | Risk Difference (M‐H, Random, 95% CI) | 0.0 [0.0, 0.0] |
| 8.11 Other treatment: salicylic acid | 0 | 0 | Risk Difference (M‐H, Random, 95% CI) | 0.0 [0.0, 0.0] |
| 9 Adverse events (local) Show forest plot | 12 | Risk Difference (M‐H, Random, 95% CI) | Subtotals only | |
| 9.1 Vitamin D: calcipotriol | 3 | 510 | Risk Difference (M‐H, Random, 95% CI) | ‐0.00 [‐0.05, 0.04] |
| 9.2 Potent steroid: betamethasone dipropionate | 2 | 703 | Risk Difference (M‐H, Random, 95% CI) | ‐0.07 [‐0.13, ‐0.01] |
| 9.3 Potent steroid: betamethasone valerate | 0 | 0 | Risk Difference (M‐H, Random, 95% CI) | 0.0 [0.0, 0.0] |
| 9.4 Very potent steroid: amcinonide | 0 | 0 | Risk Difference (M‐H, Random, 95% CI) | 0.0 [0.0, 0.0] |
| 9.5 Very potent steroid: clobetasol propionate | 4 | 817 | Risk Difference (M‐H, Random, 95% CI) | 0.00 [‐0.03, 0.04] |
| 9.6 Very potent steroid: halcinonide | 1 | 58 | Risk Difference (M‐H, Random, 95% CI) | ‐0.03 [‐0.12, 0.06] |
| 9.7 Vitamin D in combination: calcipotriol + BMD | 2 | 831 | Risk Difference (M‐H, Random, 95% CI) | ‐0.06 [‐0.13, 0.02] |
| 9.8 Other treatment: betamethasone‐17,21‐dipropionate plus salicylic acid | 1 | 20 | Risk Difference (M‐H, Random, 95% CI) | 0.0 [‐0.17, 0.17] |
| 9.9 Other treatment: ciclopirox olamine shampoo | 1 | 40 | Risk Difference (M‐H, Random, 95% CI) | ‐0.06 [‐0.24, 0.13] |
| 9.10 Other treatment: fluocinolone acetonide, plus occlusion | 1 | 89 | Risk Difference (M‐H, Random, 95% CI) | 0.02 [‐0.04, 0.08] |
| 9.11 Other treatment: salicylic acid | 1 | 20 | Risk Difference (M‐H, Random, 95% CI) | 0.0 [‐0.17, 0.17] |
| 10 Adverse events (systemic) Show forest plot | 4 | Risk Difference (M‐H, Random, 95% CI) | Subtotals only | |
| 10.1 Vitamin D: calcipotriol | 1 | 408 | Risk Difference (M‐H, Random, 95% CI) | 0.0 [‐0.01, 0.01] |
| 10.2 Potent steroid: betamethasone dipropionate | 1 | 692 | Risk Difference (M‐H, Random, 95% CI) | 0.0 [‐0.01, 0.01] |
| 10.3 Potent steroid: betamethasone valerate | 0 | 0 | Risk Difference (M‐H, Random, 95% CI) | 0.0 [0.0, 0.0] |
| 10.4 Very potent steroid: amcinonide | 0 | 0 | Risk Difference (M‐H, Random, 95% CI) | 0.0 [0.0, 0.0] |
| 10.5 Very potent steroid: clobetasol propionate | 2 | 385 | Risk Difference (M‐H, Random, 95% CI) | ‐0.01 [‐0.03, 0.02] |
| 10.6 Very potent steroid: halcinonide | 0 | 0 | Risk Difference (M‐H, Random, 95% CI) | 0.0 [0.0, 0.0] |
| 10.7 Vitamin D in combination: calcipotriol + BMD | 2 | 843 | Risk Difference (M‐H, Random, 95% CI) | 0.0 [‐0.01, 0.01] |
| 10.8 Other treatment: betamethasone‐17,21‐dipropionate plus salicylic acid | 0 | 0 | Risk Difference (M‐H, Random, 95% CI) | 0.0 [0.0, 0.0] |
| 10.9 Other treatment: ciclopirox olamine shampoo | 0 | 0 | Risk Difference (M‐H, Random, 95% CI) | 0.0 [0.0, 0.0] |
| 10.10 Other treatment: fluocinolone acetonide, plus occlusion | 0 | 0 | Risk Difference (M‐H, Random, 95% CI) | 0.0 [0.0, 0.0] |
| 10.11 Other treatment: salicylic acid | 0 | 0 | Risk Difference (M‐H, Random, 95% CI) | 0.0 [0.0, 0.0] |
| Outcome or subgroup title | No. of studies | No. of participants | Statistical method | Effect size |
| 1 IAGI Show forest plot | 9 | Std. Mean Difference (IV, Random, 95% CI) | Subtotals only | |
| 1.1 Vitamin D vs. corticosteroid (potent): calcipotriol vs. BMD | 2 | 1676 | Std. Mean Difference (IV, Random, 95% CI) | 0.48 [0.32, 0.64] |
| 1.2 Vitamin D vs. corticosteroid (potent): calcipotriol vs. BMV | 2 | 510 | Std. Mean Difference (IV, Random, 95% CI) | 0.37 [0.20, 0.55] |
| 1.3 Vitamin D vs. corticosteroid (very potent): calcipotriol vs. clobetasol propionate | 0 | 0 | Std. Mean Difference (IV, Random, 95% CI) | 0.0 [0.0, 0.0] |
| 1.4 Vitamin D + corticosteroid vs. corticosteroid: calcipotriol + BMD vs. BMD | 3 | 2444 | Std. Mean Difference (IV, Random, 95% CI) | ‐0.18 [‐0.26, ‐0.10] |
| 1.5 Vitamin D vs. vitamin D + corticosteroid: calcipotriol vs. calcipotriol + BMD | 4 | 2581 | Std. Mean Difference (IV, Random, 95% CI) | 0.64 [0.44, 0.84] |
| 1.6 Vitamin D vs. other treatments: calcipotriol vs. coal tar polytherapy | 2 | 748 | Std. Mean Difference (IV, Random, 95% CI) | ‐0.24 [‐0.73, 0.25] |
| 2 TSS Show forest plot | 10 | Std. Mean Difference (IV, Random, 95% CI) | Subtotals only | |
| 2.1 Vitamin D vs. corticosteroid (potent): calcipotriol vs. BMD | 2 | 1676 | Std. Mean Difference (IV, Random, 95% CI) | 0.45 [0.28, 0.63] |
| 2.2 Vitamin D vs. corticosteroid (potent): calcipotriol vs. BMV | 2 | 487 | Std. Mean Difference (IV, Random, 95% CI) | 0.09 [‐0.09, 0.27] |
| 2.3 Vitamin D vs. corticosteroid (very potent): calcipotriol vs. clobetasol propionate | 1 | 151 | Std. Mean Difference (IV, Random, 95% CI) | 0.37 [0.05, 0.69] |
| 2.4 Vitamin D + corticosteroid vs. corticosteroid: calcipotriol + BMD vs. BMD | 3 | 2444 | Std. Mean Difference (IV, Random, 95% CI) | ‐0.19 [‐0.27, ‐0.11] |
| 2.5 Vitamin D vs. vitamin D + corticosteroid: calcipotriol vs. calcipotriol + BMD | 3 | 1978 | Std. Mean Difference (IV, Random, 95% CI) | 0.70 [0.56, 0.84] |
| 2.6 Vitamin D vs. other treatments: calcipotriol vs. coal tar polytherapy | 3 | 925 | Std. Mean Difference (IV, Random, 95% CI) | ‐0.30 [‐0.84, 0.24] |
| 3 PASI | 0 | Std. Mean Difference (IV, Random, 95% CI) | Subtotals only | |
| 3.1 Vitamin D vs. corticosteroid (potent): calcipotriol vs. BMD | 0 | 0 | Std. Mean Difference (IV, Random, 95% CI) | 0.0 [0.0, 0.0] |
| 3.2 Vitamin D vs. corticosteroid (potent): calcipotriol vs. BMV | 0 | 0 | Std. Mean Difference (IV, Random, 95% CI) | 0.0 [0.0, 0.0] |
| 3.3 Vitamin D vs. corticosteroid (very potent): calcipotriol vs. clobetasol propionate | 0 | 0 | Std. Mean Difference (IV, Random, 95% CI) | 0.0 [0.0, 0.0] |
| 3.4 Vitamin D + corticosteroid vs. corticosteroid: calcipotriol + BMD vs. BMD | 0 | 0 | Std. Mean Difference (IV, Random, 95% CI) | 0.0 [0.0, 0.0] |
| 3.5 Vitamin D vs. vitamin D + corticosteroid: calcipotriol vs. calcipotriol + BMD | 0 | 0 | Std. Mean Difference (IV, Random, 95% CI) | 0.0 [0.0, 0.0] |
| 3.6 Vitamin D vs. other treatments: calcipotriol vs. coal tar polytherapy | 0 | 0 | Std. Mean Difference (IV, Random, 95% CI) | 0.0 [0.0, 0.0] |
| 4 PAGI Show forest plot | 5 | Std. Mean Difference (IV, Random, 95% CI) | Subtotals only | |
| 4.1 Vitamin D vs. corticosteroid (potent): calcipotriol vs. BMD | 2 | 1654 | Std. Mean Difference (IV, Random, 95% CI) | 0.56 [0.31, 0.81] |
| 4.2 Vitamin D vs. corticosteroid (potent): calcipotriol vs. BMV | 1 | 468 | Std. Mean Difference (IV, Random, 95% CI) | 0.41 [0.22, 0.59] |
| 4.3 Vitamin D vs. corticosteroid (very potent): calcipotriol vs. clobetasol propionate | 0 | 0 | Std. Mean Difference (IV, Random, 95% CI) | 0.0 [0.0, 0.0] |
| 4.4 Vitamin D + corticosteroid vs. corticosteroid: calcipotriol + BMD vs. BMD | 3 | 2414 | Std. Mean Difference (IV, Random, 95% CI) | ‐0.17 [‐0.25, ‐0.09] |
| 4.5 Vitamin D vs. vitamin D + corticosteroid: calcipotriol vs. calcipotriol + BMD | 3 | 1952 | Std. Mean Difference (IV, Random, 95% CI) | 0.84 [0.61, 1.08] |
| 4.6 Vitamin D vs. other treatments: calcipotriol vs. coal tar polytherapy | 0 | 0 | Std. Mean Difference (IV, Random, 95% CI) | 0.0 [0.0, 0.0] |
| 5 Combined end point (IAGI/TSS/PASI/PAGI) Show forest plot | 11 | Std. Mean Difference (IV, Random, 95% CI) | Subtotals only | |
| 5.1 Vitamin D vs. corticosteroid (potent): calcipotriol vs. BMD | 2 | 1676 | Std. Mean Difference (IV, Random, 95% CI) | 0.48 [0.32, 0.64] |
| 5.2 Vitamin D vs. corticosteroid (potent): calcipotriol vs. BMV | 2 | 510 | Std. Mean Difference (IV, Random, 95% CI) | 0.37 [0.20, 0.55] |
| 5.3 Vitamin D vs. corticosteroid (very potent): calcipotriol vs. clobetasol propionate | 1 | 151 | Std. Mean Difference (IV, Random, 95% CI) | 0.37 [0.05, 0.69] |
| 5.4 Vitamin D + corticosteroid vs. corticosteroid: calcipotriol + BMD vs. BMD | 3 | 2444 | Std. Mean Difference (IV, Random, 95% CI) | ‐0.18 [‐0.26, ‐0.10] |
| 5.5 Vitamin D vs. vitamin D + corticosteroid: calcipotriol vs. calcipotriol + BMD | 4 | 2581 | Std. Mean Difference (IV, Random, 95% CI) | 0.64 [0.44, 0.84] |
| 5.6 Vitamin D vs. other treatments: calcipotriol vs. coal tar polytherapy | 3 | 835 | Std. Mean Difference (IV, Random, 95% CI) | ‐0.45 [‐0.92, 0.02] |
| 6 Total withdrawals Show forest plot | 10 | Risk Difference (M‐H, Random, 95% CI) | Subtotals only | |
| 6.1 Vitamin D vs. corticosteroid (potent): calcipotriol vs. BMD | 2 | 1676 | Risk Difference (M‐H, Random, 95% CI) | 0.07 [‐0.04, 0.18] |
| 6.2 Vitamin D vs. corticosteroid (potent): calcipotriol vs. BMV | 2 | 516 | Risk Difference (M‐H, Random, 95% CI) | 0.04 [‐0.00, 0.08] |
| 6.3 Vitamin D vs. corticosteroid (very potent): calcipotriol vs. clobetasol propionate | 2 | 194 | Risk Difference (M‐H, Random, 95% CI) | 0.05 [‐0.07, 0.18] |
| 6.4 Vitamin D + corticosteroid vs. corticosteroid: calcipotriol + BMD vs. BMD | 3 | 2444 | Risk Difference (M‐H, Random, 95% CI) | 0.01 [‐0.04, 0.06] |
| 6.5 Vitamin D vs. vitamin D + corticosteroid: calcipotriol vs. calcipotriol + BMD | 4 | 2847 | Risk Difference (M‐H, Random, 95% CI) | 0.11 [0.05, 0.18] |
| 6.6 Vitamin D vs. other treatments: calcipotriol vs. coal tar polytherapy | 1 | 475 | Risk Difference (M‐H, Random, 95% CI) | 0.01 [‐0.07, 0.09] |
| 7 Withdrawals due to adverse events Show forest plot | 10 | Risk Difference (M‐H, Random, 95% CI) | Subtotals only | |
| 7.1 Vitamin D vs. corticosteroid (potent): calcipotriol vs. BMD | 2 | 1676 | Risk Difference (M‐H, Random, 95% CI) | 0.04 [‐0.01, 0.09] |
| 7.2 Vitamin D vs. corticosteroid (potent): calcipotriol vs. BMV | 2 | 516 | Risk Difference (M‐H, Random, 95% CI) | 0.03 [0.01, 0.06] |
| 7.3 Vitamin D vs. corticosteroid (very potent): calcipotriol vs. clobetasol propionate | 2 | 194 | Risk Difference (M‐H, Random, 95% CI) | 0.05 [‐0.05, 0.15] |
| 7.4 Vitamin D + corticosteroid vs. corticosteroid: calcipotriol + BMD vs. BMD | 3 | 2444 | Risk Difference (M‐H, Random, 95% CI) | ‐0.00 [‐0.01, 0.01] |
| 7.5 Vitamin D vs. vitamin D + corticosteroid: calcipotriol vs. calcipotriol + BMD | 4 | 2847 | Risk Difference (M‐H, Random, 95% CI) | 0.06 [0.02, 0.09] |
| 7.6 Vitamin D vs. other treatments: calcipotriol vs. coal tar polytherapy | 1 | 445 | Risk Difference (M‐H, Random, 95% CI) | 0.08 [0.02, 0.14] |
| 8 Withdrawals due to treatment failure Show forest plot | 8 | Risk Difference (M‐H, Random, 95% CI) | Subtotals only | |
| 8.1 Vitamin D vs. corticosteroid (potent): calcipotriol vs. BMD | 2 | 1676 | Risk Difference (M‐H, Random, 95% CI) | 0.03 [‐0.01, 0.07] |
| 8.2 Vitamin D vs. corticosteroid (potent): calcipotriol vs. BMV | 2 | 516 | Risk Difference (M‐H, Random, 95% CI) | 0.01 [‐0.01, 0.03] |
| 8.3 Vitamin D vs. corticosteroid (very potent): calcipotriol vs. clobetasol propionate | 2 | 194 | Risk Difference (M‐H, Random, 95% CI) | 0.01 [‐0.02, 0.04] |
| 8.4 Vitamin D + corticosteroid vs. corticosteroid: calcipotriol + BMD vs. BMD | 3 | 2444 | Risk Difference (M‐H, Random, 95% CI) | ‐0.01 [‐0.02, ‐0.00] |
| 8.5 Vitamin D vs. vitamin D + corticosteroid: calcipotriol vs. calcipotriol + BMD | 3 | 2535 | Risk Difference (M‐H, Random, 95% CI) | 0.05 [0.01, 0.10] |
| 8.6 Vitamin D vs. other treatments: calcipotriol vs. coal tar polytherapy | 0 | 0 | Risk Difference (M‐H, Random, 95% CI) | 0.0 [0.0, 0.0] |
| 9 Adverse events (local) Show forest plot | 10 | Risk Difference (M‐H, Random, 95% CI) | Subtotals only | |
| 9.1 Vitamin D vs. corticosteroid (potent): calcipotriol vs. BMD | 2 | 1652 | Risk Difference (M‐H, Random, 95% CI) | 0.07 [0.04, 0.11] |
| 9.2 Vitamin D vs. corticosteroid (potent): calcipotriol vs. BMV | 2 | 516 | Risk Difference (M‐H, Random, 95% CI) | 0.17 [0.01, 0.33] |
| 9.3 Vitamin D vs. corticosteroid (very potent): calcipotriol vs. clobetasol propionate | 2 | 194 | Risk Difference (M‐H, Random, 95% CI) | 0.19 [0.10, 0.28] |
| 9.4 Vitamin D + corticosteroid vs. corticosteroid: calcipotriol + BMD vs. BMD | 3 | 2415 | Risk Difference (M‐H, Random, 95% CI) | ‐0.00 [‐0.02, 0.01] |
| 9.5 Vitamin D vs. vitamin D + corticosteroid: calcipotriol vs. calcipotriol + BMD | 4 | 2801 | Risk Difference (M‐H, Random, 95% CI) | 0.09 [0.06, 0.12] |
| 9.6 Vitamin D vs. other treatments: calcipotriol vs. coal tar polytherapy | 1 | 445 | Risk Difference (M‐H, Random, 95% CI) | 0.24 [0.15, 0.33] |
| 10 Adverse events (systemic) Show forest plot | 6 | Risk Difference (M‐H, Random, 95% CI) | Subtotals only | |
| 10.1 Vitamin D vs. corticosteroid (potent): calcipotriol vs. BMD | 2 | 1666 | Risk Difference (M‐H, Random, 95% CI) | 0.0 [‐0.00, 0.00] |
| 10.2 Vitamin D vs. corticosteroid (potent): calcipotriol vs. BMV | 1 | 474 | Risk Difference (M‐H, Random, 95% CI) | 0.0 [‐0.01, 0.01] |
| 10.3 Vitamin D vs. corticosteroid (very potent): calcipotriol vs. clobetasol propionate | 1 | 151 | Risk Difference (M‐H, Random, 95% CI) | 0.0 [‐0.03, 0.03] |
| 10.4 Vitamin D + corticosteroid vs. corticosteroid: calcipotriol + BMD vs. BMD | 2 | 2216 | Risk Difference (M‐H, Random, 95% CI) | 0.0 [‐0.00, 0.00] |
| 10.5 Vitamin D vs. vitamin D + corticosteroid: calcipotriol vs. calcipotriol + BMD | 3 | 1970 | Risk Difference (M‐H, Random, 95% CI) | 0.0 [‐0.00, 0.00] |
| 10.6 Vitamin D vs. other treatments: calcipotriol vs. coal tar polytherapy | 1 | 445 | Risk Difference (M‐H, Random, 95% CI) | 0.0 [‐0.01, 0.01] |