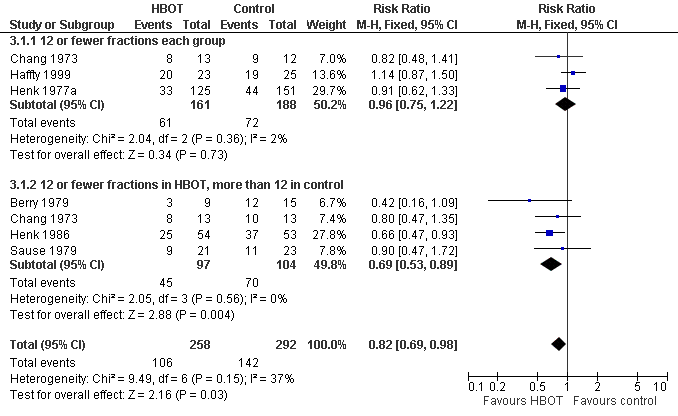
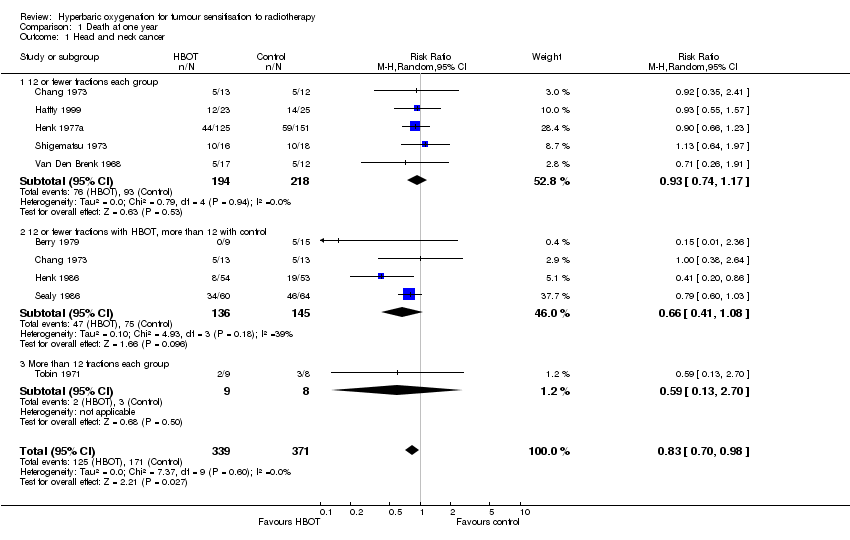
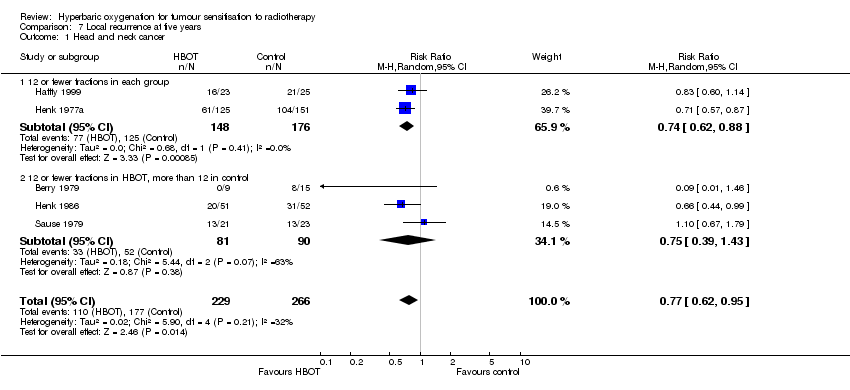
| 1 Head and neck cancer Show forest plot | 9 | 710 | Risk Ratio (M‐H, Random, 95% CI) | 0.83 [0.70, 0.98] |
|
| 1.1 12 or fewer fractions each group | 5 | 412 | Risk Ratio (M‐H, Random, 95% CI) | 0.93 [0.74, 1.17] |
| 1.2 12 or fewer fractions with HBOT, more than 12 with control | 4 | 281 | Risk Ratio (M‐H, Random, 95% CI) | 0.66 [0.41, 1.08] |
| 1.3 More than 12 fractions each group | 1 | 17 | Risk Ratio (M‐H, Random, 95% CI) | 0.59 [0.13, 2.70] |
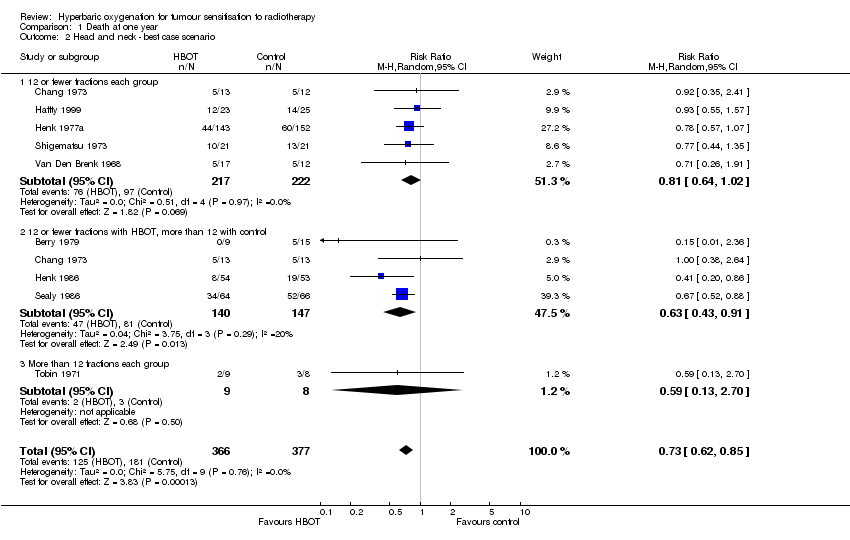
| 2 Head and neck ‐ best case scenario Show forest plot | 9 | 743 | Risk Ratio (M‐H, Random, 95% CI) | 0.73 [0.62, 0.85] |
|
| 2.1 12 or fewer fractions each group | 5 | 439 | Risk Ratio (M‐H, Random, 95% CI) | 0.81 [0.64, 1.02] |
| 2.2 12 or fewer fractions with HBOT, more than 12 with control | 4 | 287 | Risk Ratio (M‐H, Random, 95% CI) | 0.63 [0.43, 0.91] |
| 2.3 More than 12 fractions each group | 1 | 17 | Risk Ratio (M‐H, Random, 95% CI) | 0.59 [0.13, 2.70] |
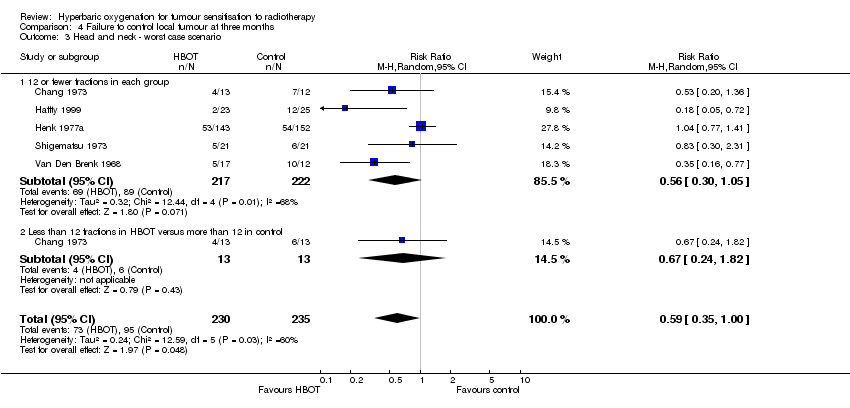
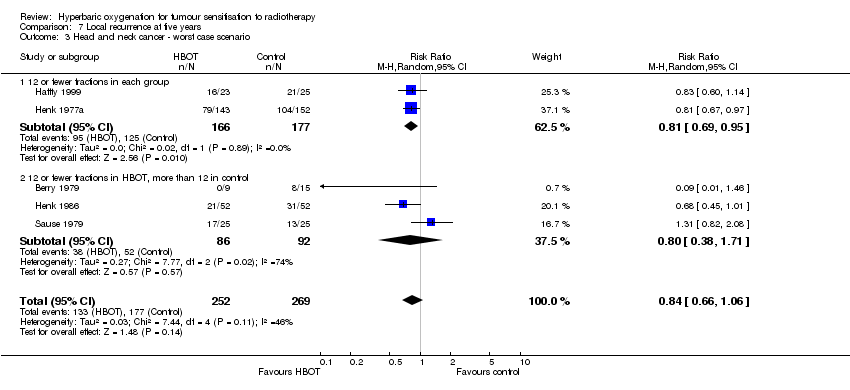
| 3 Head and neck ‐ worst case scenario Show forest plot | 9 | 743 | Risk Ratio (M‐H, Random, 95% CI) | 0.93 [0.76, 1.15] |
|
| 3.1 12 or fewer fractions each group | 5 | 439 | Risk Ratio (M‐H, Random, 95% CI) | 1.10 [0.90, 1.36] |
| 3.2 12 or fewer fractions with HBOT, more than 12 with control | 4 | 287 | Risk Ratio (M‐H, Random, 95% CI) | 0.71 [0.45, 1.13] |
| 3.3 More than 12 fractions each group | 1 | 17 | Risk Ratio (M‐H, Random, 95% CI) | 0.59 [0.13, 2.70] |
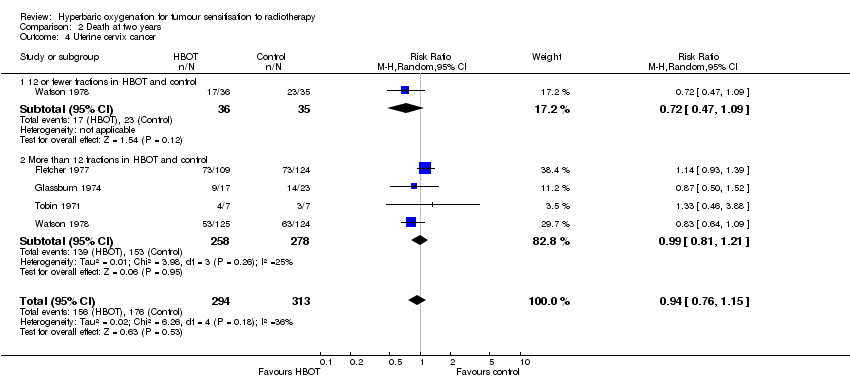
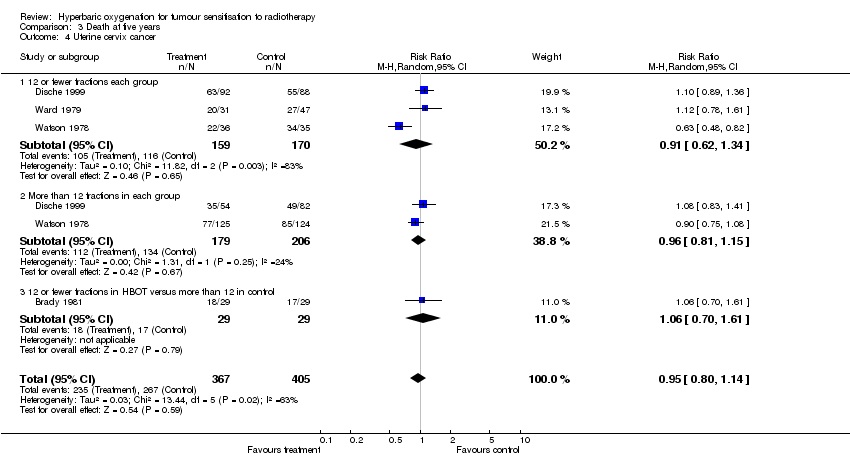
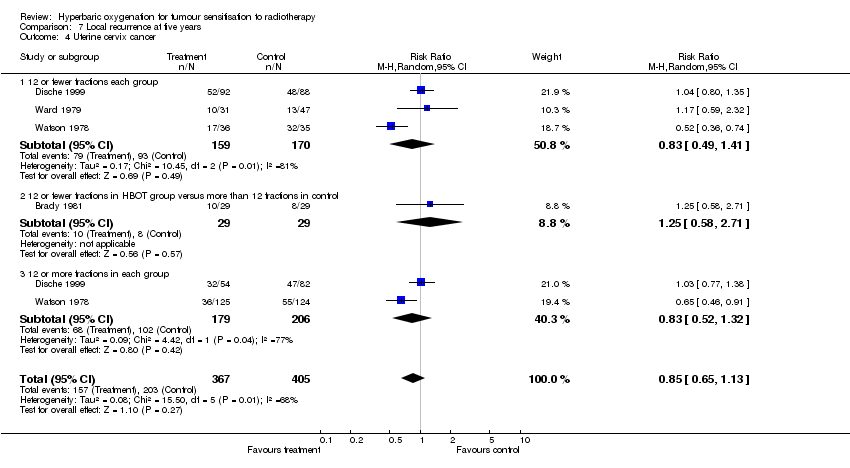
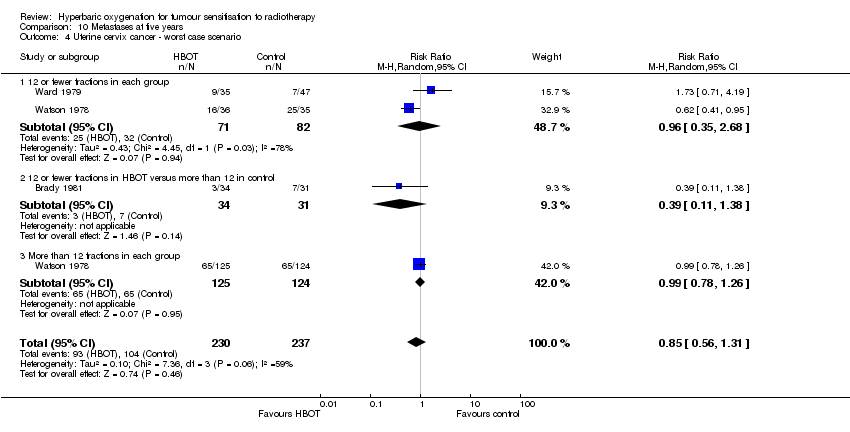
| 4 Uterine cervix cancer Show forest plot | 4 | 728 | Risk Ratio (M‐H, Fixed, 95% CI) | 0.88 [0.69, 1.11] |
|
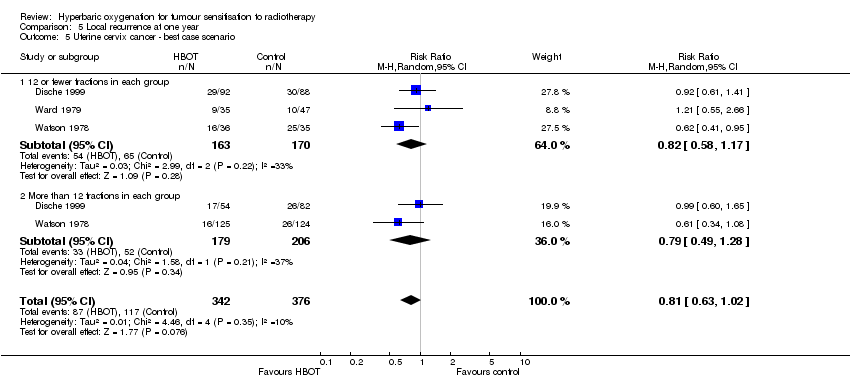
| 4.1 12 or fewer fractions each groups | 3 | 329 | Risk Ratio (M‐H, Fixed, 95% CI) | 0.98 [0.70, 1.38] |
| 4.2 More than 12 fractions each group | 3 | 399 | Risk Ratio (M‐H, Fixed, 95% CI) | 0.79 [0.57, 1.10] |
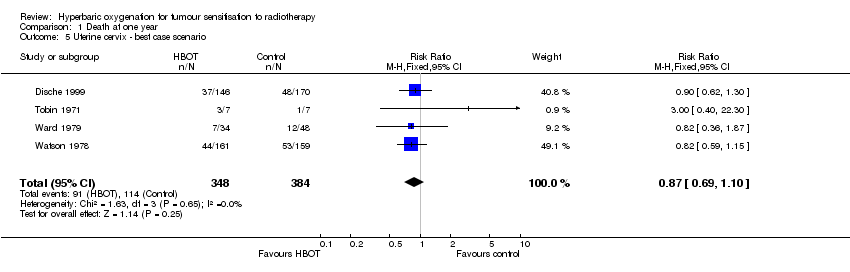
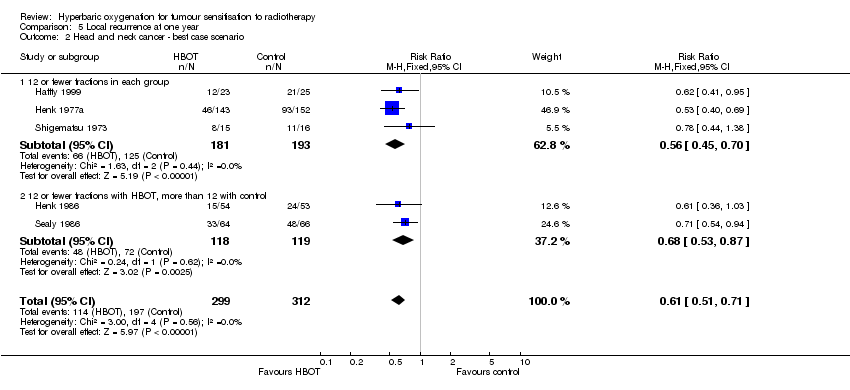
| 5 Uterine cervix ‐ best case scenario Show forest plot | 4 | 732 | Risk Ratio (M‐H, Fixed, 95% CI) | 0.87 [0.69, 1.10] |
|
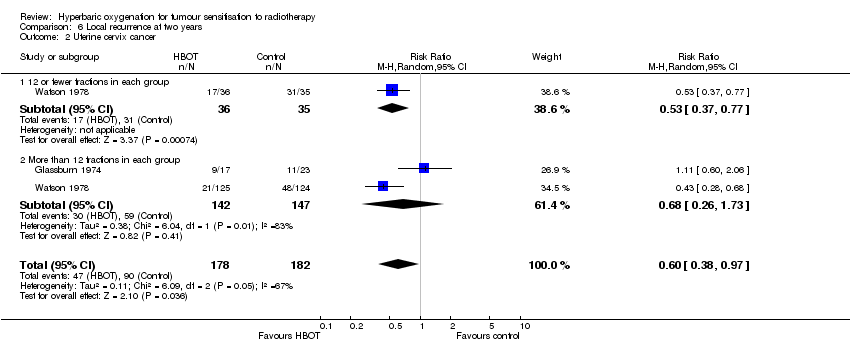
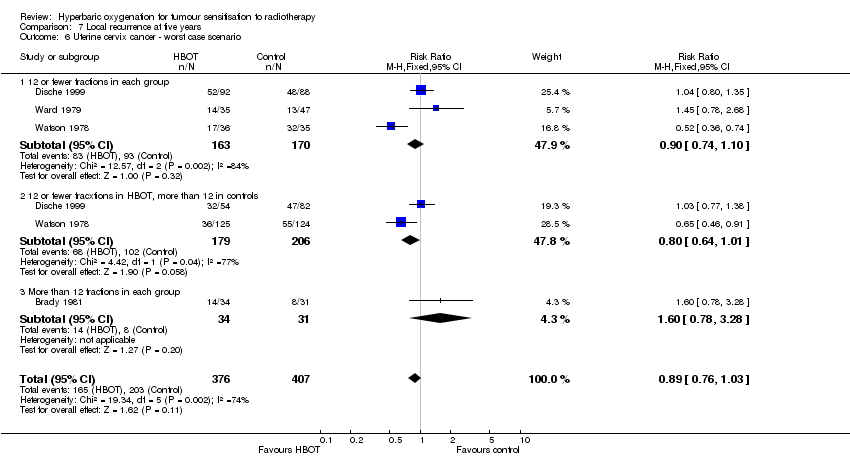
| 6 Uterine cervix ‐ worst case scenario Show forest plot | 4 | 732 | Risk Ratio (M‐H, Fixed, 95% CI) | 0.91 [0.72, 1.15] |
|
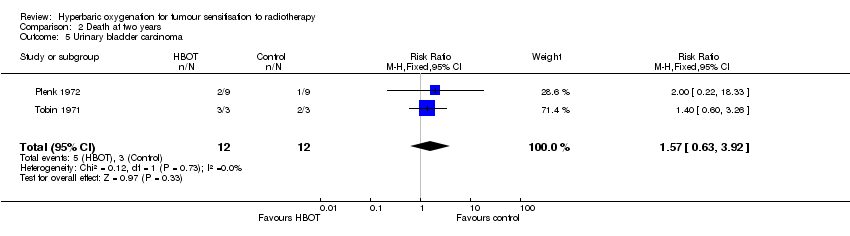
| 7 Urinary bladder cancer Show forest plot | 4 | 330 | Risk Ratio (M‐H, Fixed, 95% CI) | 0.97 [0.74, 1.27] |
|
| 7.1 12 or fewer fractions each group | 1 | 16 | Risk Ratio (M‐H, Fixed, 95% CI) | 0.2 [0.03, 1.35] |
| 7.2 12 or fewer fractions with HBOT, more than 12 with control | 1 | 38 | Risk Ratio (M‐H, Fixed, 95% CI) | 0.82 [0.44, 1.51] |
| 7.3 More than 12 fractions each group | 1 | 40 | Risk Ratio (M‐H, Fixed, 95% CI) | 1.43 [0.68, 3.00] |
| 7.4 Mixed fractionation scheme | 1 | 236 | Risk Ratio (M‐H, Fixed, 95% CI) | 1.02 [0.73, 1.44] |
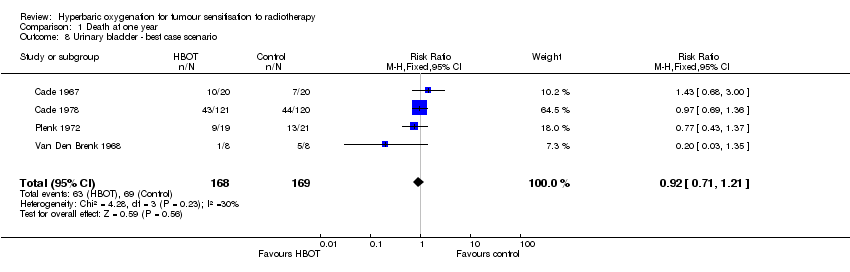
| 8 Urinary bladder ‐ best case scenario Show forest plot | 4 | 337 | Risk Ratio (M‐H, Fixed, 95% CI) | 0.92 [0.71, 1.21] |
|
| 9 Urinary bladder ‐ worst case scenario Show forest plot | 4 | 337 | Risk Ratio (M‐H, Fixed, 95% CI) | 1.03 [0.78, 1.34] |
|
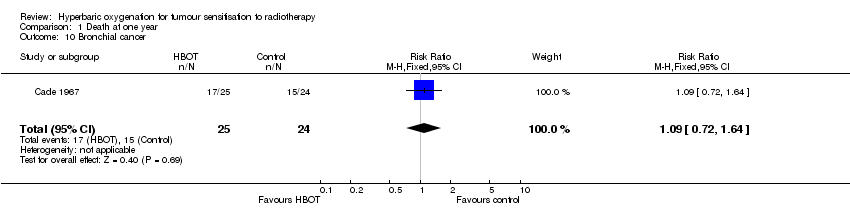
| 10 Bronchial cancer Show forest plot | 1 | 49 | Risk Ratio (M‐H, Fixed, 95% CI) | 1.09 [0.72, 1.64] |
|
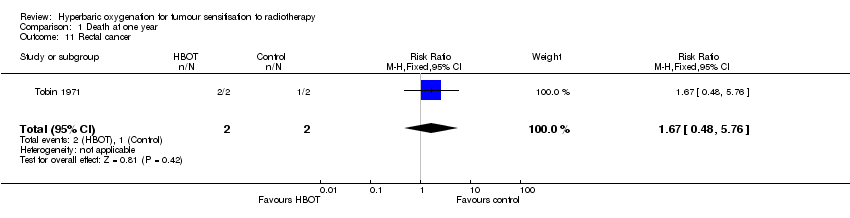
| 11 Rectal cancer Show forest plot | 1 | 4 | Risk Ratio (M‐H, Fixed, 95% CI) | 1.67 [0.48, 5.76] |
|
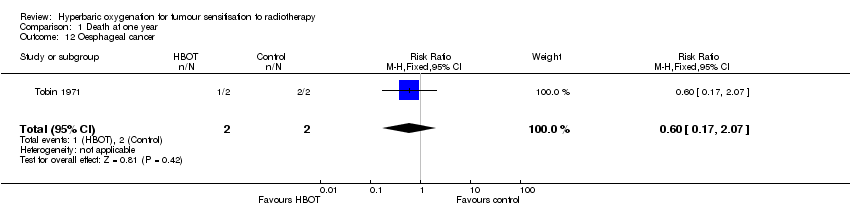
| 12 Oesphageal cancer Show forest plot | 1 | 4 | Risk Ratio (M‐H, Fixed, 95% CI) | 0.6 [0.17, 2.07] |
|
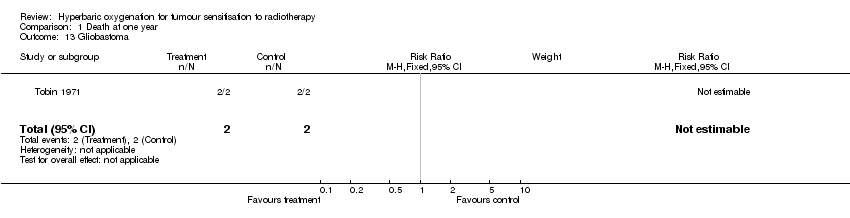
| 13 Gliobastoma Show forest plot | 1 | 4 | Risk Ratio (M‐H, Fixed, 95% CI) | 0.0 [0.0, 0.0] |
|