Contenido relacionado
Revisiones y protocolos relacionados
Anna C Furmaniak, Matthias Menig, Martina H Markes | 21 septiembre 2016
Ian M Lahart, George S Metsios, Alan M Nevill, Amtul R Carmichael | 29 enero 2018
Holger Cramer, Romy Lauche, Petra Klose, Silke Lange, Jost Langhorst, Gustav J Dobos | 3 enero 2017
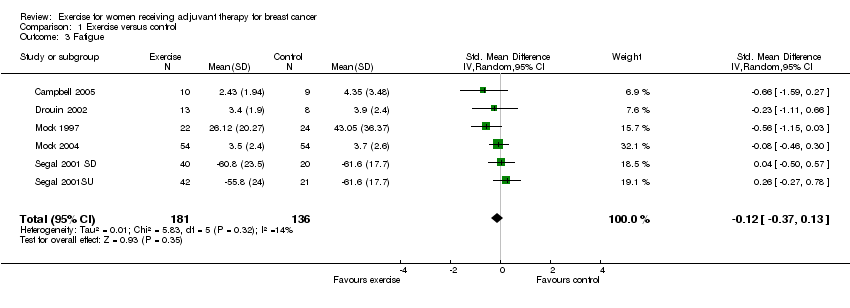
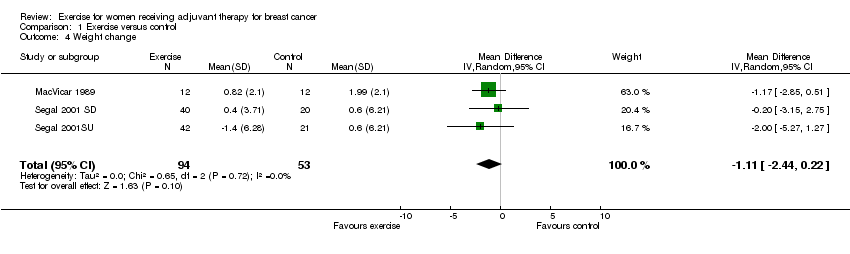
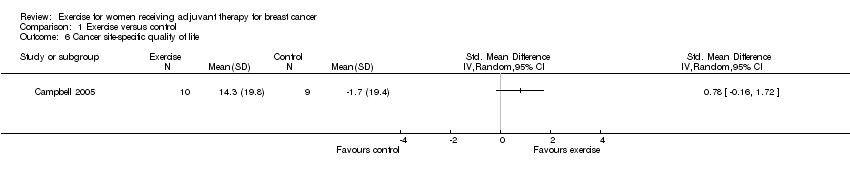
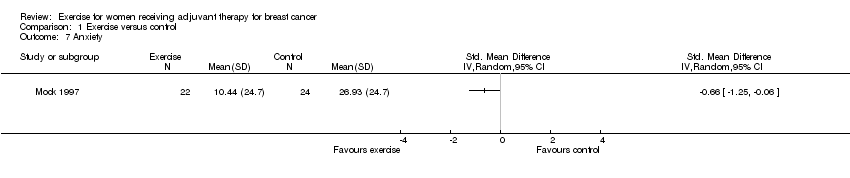
Margaret L McNeely, Kristin Campbell, Maria Ospina, Brian H Rowe, Kelly Dabbs, Terry P Klassen, John Mackey, Kerry Courneya | 16 junio 2010
Brigid E Hickey, Daniel P Francis, Margot Lehman | 30 abril 2013
Milita Zaheed, Nicholas Wilcken, Melina L Willson, Dianne L O'Connell, Annabel Goodwin | 18 febrero 2019
Lisa K Schell, Ina Monsef, Achim Wöckel, Nicole Skoetz | 27 marzo 2019
Jeanette Ezzo, Eric Manheimer, Margaret L McNeely, Doris M Howell, Robert Weiss, Karin I Johansson, Ting Bao, Linda Bily, Catherine M Tuppo, Anne F Williams, Didem Karadibak | 21 mayo 2015
Fary Khan, Bhasker Amatya, Louisa Ng, Marina Demetrios, Nina Y Zhang, Lynne Turner-Stokes | 12 diciembre 2012
Ghufran A Jassim, Sally Doherty, David L Whitford, Ali S Khashan | 11 enero 2023