Rawatan untuk tromboflebitis permukaan kaki
Abstract
Background
The optimal treatment of superficial thrombophlebitis (ST) of the legs remains poorly defined. While improving or relieving the local painful symptoms, treatment should aim at preventing venous thromboembolism (VTE), which might complicate the natural history of ST. This is the third update of a review first published in 2007.
Objectives
To assess the efficacy and safety of topical, medical, and surgical treatments for ST of the leg in improving local symptoms and decreasing thromboembolic complications.
Search methods
For this update, the Cochrane Vascular Information Specialist searched the Cochrane Vascular Specialised Register (March 2017), CENTRAL (2017, Issue 2), and trials registries (March 2017). We handsearched the reference lists of relevant papers and conference proceedings.
Selection criteria
Randomised controlled trials (RCTs) evaluating topical, medical, and surgical treatments for ST of the legs that included people with a clinical diagnosis of ST of the legs or objective diagnosis of a thrombus in a superficial vein.
Data collection and analysis
Two authors assessed the trials for inclusion in the review, extracted the data, and assessed the quality of the studies. Data were independently extracted from the included studies and any disagreements resolved by consensus. We assessed the quality of the evidence using the GRADE approach.
Main results
We identified three additional trials (613 participants), therefore this update considered 33 studies involving 7296 people with ST of the legs. Treatment included fondaparinux; rivaroxaban; low molecular weight heparin (LMWH); unfractionated heparin (UFH); non‐steroidal anti‐inflammatory drugs (NSAIDs); compression stockings; and topical, intramuscular, or intravenous treatment to surgical interventions such as thrombectomy or ligation. Only a minority of trials compared treatment with placebo rather than an alternative treatment and many studies were small and of poor quality. Pooling of the data was possible for few outcomes, and none were part of a placebo‐controlled trial. In one large, placebo‐controlled RCT of 3002 participants, subcutaneous fondaparinux was associated with a significant reduction in symptomatic VTE (risk ratio (RR) 0.15, 95% confidence interval (CI) 0.04 to 0.50; moderate‐quality evidence), ST extension (RR 0.08, 95% CI 0.03 to 0.22; moderate‐quality evidence), and ST recurrence (RR 0.21, 95% CI 0.08 to 0.54; moderate‐quality evidence) relative to placebo. Major bleeding was infrequent in both groups with very wide CIs around risk estimate (RR 0.99, 95% CI 0.06 to 15.86; moderate‐quality evidence). In one RCT on 472 high‐risk participants with ST, fondaparinux was associated with a non‐significant reduction of symptomatic VTE compared to rivaroxaban 10 mg (RR 0.33, 95% CI 0.03 to 3.18; low‐quality evidence). There were no major bleeding events in either group (low‐quality evidence). In another placebo‐controlled trial, both prophylactic and therapeutic doses of LMWH (prophylactic: RR 0.44, 95% CI 0.26 to 0.74; therapeutic: RR 0.46, 95% CI 0.27 to 0.77) and NSAIDs (RR 0.46, 95% CI 0.27 to 0.78) reduced the extension (low‐quality evidence) and recurrence of ST (low‐quality evidence) in comparison to placebo, with no significant effects on symptomatic VTE (low‐quality evidence) or major bleeding (low‐quality evidence). Overall, topical treatments improved local symptoms compared with placebo, but no data were provided on the effects on VTE and ST extension. Surgical treatment combined with elastic stockings was associated with a lower VTE rate and ST progression compared with elastic stockings alone. However, the majority of studies that compared different oral treatments, topical treatments, or surgery did not report VTE, ST progression, adverse events, or treatment adverse effects.
Authors' conclusions
Prophylactic dose fondaparinux given for 45 days appears to be a valid therapeutic option for ST of the legs for most people. The evidence on topical treatment or surgery is too limited and does not inform clinical practice about the effects of these treatments in terms of VTE. Further research is needed to assess the role of rivaroxaban and other direct oral factor‐X or thrombin inhibitors, LMWH, and NSAIDs; the optimal doses and duration of treatment in people at various risk of recurrence; and whether a combination therapy may be more effective than single treatment. Adequately designed and conducted studies are required to clarify the role of topical and surgical treatments.
PICO
Ringkasan bahasa mudah
Rawatan untuk tromboflebitis permukaan kaki
Latar belakang
Tromboflebitis superfisial (ST) adalah proses keradangan yang agak biasa dikaitkan dengan pembekuan darah (thrombus) yang memberi kesan kepada urat dangkal (urat yang hampir dengan permukaan kulit badan). Gejala dan tanda‐tandanya termasuk rasa sakit setempat, gatal‐gatal, tender, kemerahan kulit, dan pengerasan tisu sekitarnya. Terdapat beberapa bukti untuk menunjukkan hubungan antara ST dan tromboembolisme vena (VTE; keadaan di mana pembekuan darah terbentuk (paling kerap) dalam urat dibahagian kaki dan boleh bergerak dalam peredaran dan menyumbat di paru‐paru). Rawatan bertujuan untuk melegakan simptom‐simptom setempat dan untuk mencegah sambungan bekuan ke dalam vena dalam, ST berulang, atau perkembangan peristiwa yang lebih serius yang disebabkan oleh VTE. Ini adalah kemaskini ketiga ulasan yang diterbitkan pada tahun 2007. Bukti terkini sehingga Mac 2017.
Ciri‐ciri kajian dan keputusan utama
Kemaskini ini termasuk 33 kajian rawak terkawal (kajian klinikal di mana orang secara rawak dimasukkan ke dalam satu daripada dua atau lebih kumpulan rawatan) yang melibatkan 7296 peserta. Rawatan seperti rivaroxaban (ubat yang dipanggil perencat oral langsung faktor X yang aktif), suntikan ubat‐ubatan di bawah kulit untuk mengelakkan pembekuan darah (misalnya fondaparinux, heparin dengan berat molekul yang rendah, atau heparin bukan pecahan), stoking mampatan elastik, ubat anti‐radang bukan steroid(NSAIDs; ubat tahan sakit), rawatan topikal (ubat yang digunakan untuk kulit), dan pembedahan.
Satu kajian yang besar, menyumbang kepada separuh daripada peserta yang termasuk dalam ulasan, menunjukkan rawatan dengan fondaparinux selama 45 hari dikaitkan dengan pengurangan yang ketara dalam VTE gejala (di mana gejala menunjukkan terdapat VTE), sambungan ST (di mana bekuan bergerak lebih jauh sehingga kaki), dan pengulangan ST (di mana beku kembali) berbanding dengan plasebo. Pendarahan utama jarang berlaku dalam kedua‐dua kumpulan. Dalam satu kajian melibatkan pesakit ST yang berisiko tinggi dengan kejadian tromboembolik yang berulang, fondaparinux dikaitkan dengan pengurangan VTE gejala yang tidak ketara berbanding dengan rivaroxaban. Tiada peristiwa pendarahan melampau dalam kedua‐dua kumpulan. Kedua‐dua dengan berat molekul yang rendah, heparin dan NSAID mengurangkan kejadian lanjutan atau pengulangan ST tanpa kesan pada VTE gejala atau pendarahan besar. Rawatan topikal melegakan simptom setempat tetapi kajian tidak melaporkan perkembangan kepada VTE. Rawatan pembedahan dan memakai stoking elastik dikaitkan dengan kadar VTE yang lebih rendah dan perkembangan ST berbanding dengan stok elastik sahaja.
Kualiti bukti
Secara keseluruhannya, kualiti bukti adalah sangat rendah untuk kebanyakan rawatan kerana reka bentuk kajian yang kurang baik, ketidaktepatan keputusan, kurang kumpulan plasebo (tidak dirawat) dan hanya satu kajian dalam beberapa perbandingan. Kualiti bukti adalah rendah hingga sederhana untuk perbandingan dalam dua kajian plasebo terkawal.
Sebagai kesimpulan, fondaparinux nampaknya merupakan rawatan yang mencukupi untuk kebanyakan pengidap ST. Dos yang optimum dan tempoh rawatan perlu distandardkan pada orang yang berisiko tinggi serta orang yang berisiko rendah untuk kejadian trombotik yang berulang. Kajian lanjut diperlukan untuk menilai peranan rivaroxaban dan lain‐lain ubat, atau thrombin, heparin dengan berat molekul yang rendah atau NSAID dan untuk menunjukkan keberkesanan, jika ada, rawatan topikal, atau pembedahan dari segi VTE.
Authors' conclusions
Summary of findings
| Fondaparinux compared to placebo for superficial thrombophlebitis of the leg | ||||||
| Patient or population: people with ST of the leg | ||||||
| Outcomes | Illustrative comparative risks* (95% CI) | Relative effect | No of participants | Quality of the evidence | Comments | |
| Assumed risk | Corresponding risk | |||||
| Placebo | Fondaparinux | |||||
| Symptomatic VTE | 13 per 1000 | 2 per 1000 | RR 0.15 | 3002 | ⊕⊕⊕⊝ | ‐ |
| Major bleeding | 1 per 1000 | 1 per 1000 | RR 0.99 | 2987 | ⊕⊕⊕⊝ | ‐ |
| Extension of ST | 34 per 1000 | 3 per 1000 | RR 0.08 | 3002 | ⊕⊕⊕⊝ | ‐ |
| Recurrence of ST | 16 per 1000 | 3 per 1000 | RR 0.21 | 3002 | ⊕⊕⊕⊝ | ‐ |
| Mortality | 1 per 1000 | 1 per 1000 | RR 2 | 3002 | ⊕⊕⊕⊝ | ‐ |
| Minor bleeding | 4 per 1000 | 6 per 1000 | RR 1.49 | 2987 | ⊕⊕⊕⊝ | ‐ |
| Adverse effects of treatment | 33 per 1000 | 37 per 1000 | RR 1.13 | 2987 | ⊕⊕⊕⊝ | ‐ |
| *The basis for the assumed risk (e.g. the median control group risk across studies) is provided in footnotes. The corresponding risk (and its 95% confidence interval) is based on the assumed risk in the comparison group and the relative effect of the intervention (and its 95% CI). | ||||||
| GRADE Working Group grades of evidence | ||||||
| 1Evidence downgraded one level for imprecision due to a low number of events. | ||||||
| Prophylactic LMWH versus placebo for superficial thrombophlebitis of the leg | ||||||
| Patient or population: people with ST of the leg | ||||||
| Outcomes | Illustrative comparative risks* (95% CI) | Relative effect | No of participants | Quality of the evidence | Comments | |
| Assumed risk | Corresponding risk | |||||
| Placebo | Prophylactic LMWH | |||||
| Symptomatic VTE | 45 per 1000 | 54 per 1000 | RR 1.22 | 222 | ⊕⊕⊝⊝ | ‐ |
| Major bleeding | See comment | See comment | Not estimable | 222 | ⊕⊕⊝⊝ | 0 episodes of major bleeding |
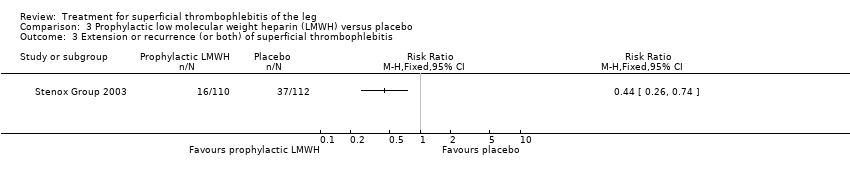
| Extension or recurrence (or both) of ST | 330 per 1000 | 145 per 1000 | RR 0.44 | 222 | ⊕⊕⊝⊝ | ‐ |
| Mortality | See comment | See comment | See comment | ‐ | See comment | Data not available |
| Minor bleeding | See comment | See comment | See comment | ‐ | See comment | Data not available |
| Adverse effects of treatment | See comment | See comment | See comment | ‐ | See comment | Data not available |
| *The basis for the assumed risk (e.g. the median control group risk across studies) is provided in footnotes. The corresponding risk (and its 95% confidence interval) is based on the assumed risk in the comparison group and the relative effect of the intervention (and its 95% CI). | ||||||
| GRADE Working Group grades of evidence | ||||||
| 1Evidence downgraded one level due to unclear random sequence generation and incomplete outcome data. | ||||||
| Therapeutic LMWH versus placebo for superficial thrombophlebitis of the leg | ||||||
| Patient or population: people with ST of the leg | ||||||
| Outcomes | Illustrative comparative risks* (95% CI) | Relative effect | No of participants | Quality of the evidence | Comments | |
| Assumed risk | Corresponding risk | |||||
| Placebo | Therapeutic LMWH | |||||
| Symptomatic VTE | 45 per 1000 | 38 per 1000 (10 to 137) | RR 0.85 | 218 | ⊕⊕⊝⊝ | ‐ |
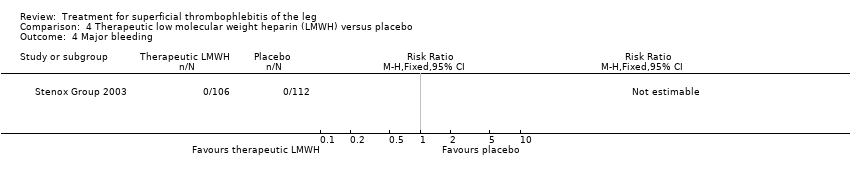
| Major bleeding | See comment | See comment | Not estimable | 218 | ⊕⊕⊝⊝ | No episodes of major bleeding |
| Extension or recurrence (or both) of ST | 330 per 1000 | 152 per 1000 (89 to 254) | RR 0.46 | 218 | ⊕⊕⊝⊝ | ‐ |
| Mortality | See comment | See comment | See comment | ‐ | See comment | Data not available |
| Minor bleeding | See comment | See comment | See comment | ‐ | See comment | Data not available |
| Adverse effects of treatment | See comment | See comment | See comment | ‐ | See comment | Data not available |
| *The basis for the assumed risk (e.g. the median control group risk across studies) is provided in footnotes. The corresponding risk (and its 95% confidence interval) is based on the assumed risk in the comparison group and the relative effect of the intervention (and its 95% CI). | ||||||
| GRADE Working Group grades of evidence | ||||||
| 1Evidence downgraded one level due to an unclear random sequence generation and incomplete outcome data. | ||||||
| NSAIDs versus placebo for superficial thrombophlebitis of the leg | ||||||
| Patient or population: people with superficial thrombophlebitis of the leg | ||||||
| Outcomes | Illustrative comparative risks* (95% CI) | Relative effect | No of participants | Quality of the evidence | Comments | |
| Assumed risk | Corresponding risk | |||||
| Placebo | NSAIDs | |||||
| Symptomatic VTE | 45 per 1000 | 41 per 1000 | RR 0.91 | 211 | ⊕⊕⊝⊝ | ‐ |
| Major bleeding | See comment | See comment | Not estimable | 211 | ⊕⊕⊝⊝ | 0 episodes of major bleeding |
| Extension or recurrence (or both) of ST | 330 per 1000 | 152 per 1000 | RR 0.46 | 211 | ⊕⊕⊝⊝ | ‐ |
| Mortality | See comment | See comment | See comment | ‐ | See comment | Data not available |
| Minor bleeding | See comment | See comment | See comment | ‐ | See comment | Data not available |
| Adverse effects of treatment | See comment | See comment | See comment | ‐ | See comment | Data not available |
| *The basis for the assumed risk (e.g. the median control group risk across studies) is provided in footnotes. The corresponding risk (and its 95% confidence interval) is based on the assumed risk in the comparison group and the relative effect of the intervention (and its 95% CI). | ||||||
| GRADE Working Group grades of evidence | ||||||
| 1Evidence downgraded one level due to an unclear random sequence generation and incomplete outcome data. | ||||||
Background
Description of the condition
The term superficial thrombophlebitis (ST), also known as superficial venous thrombosis, refers to a pathological state characterised by an inflammatory‐thrombotic process in a superficial vein. Distinctive clinical findings include pain and a reddened, warm, tender cord extending along the vein. The surrounding area may show signs of erythema (reddening of the skin) and oedema (swelling of the tissue). ST is a relatively common disease and, although its incidence has never been properly determined, it is estimated to be higher than that of deep vein thrombosis (DVT), which is about 1 per 1000 cases (De Weese 1991; Nordstrom 1992). In one community‐based study conducted in a population of 265,687 adults in France, the annual diagnosis rate of symptomatic, confirmed ST was 0.64% (95% confidence interval (CI) 0.55% to 0.74%) (Frappé 2014).
While the majority of ST occurs in varicose veins, additional predisposing risk factors similar to those for venous thromboembolism (VTE) include immobilisation, trauma, postoperative states, pregnancy, puerperium (the period immediately following childbirth), active malignancy, autoimmune diseases, use of oral contraceptive pills or hormonal replacement therapy, advanced age, obesity, and a history of previous VTE (Barrelier 1993; Bergqvist 1986; Chengelis 1996; de Moerloose 1998; Lutter 1991; Samlaska 1990a). Furthermore, the presence of inherited thrombophilia (a disorder where there is a tendency for thrombosis to occur, for example factor V Leiden, the prothrombin 20210A mutation, and deficiencies of the natural anticoagulant proteins C and S) in ST suggests a similar pathophysiology as VTE (de Moerloose 1998; Hanson 1998; Martinelli 1999; Samlaska 1990a; Samlaska 1990b). Traditionally, ST has been considered a relatively benign disease, but several studies have described an association between ST and VTE (Bergqvist 1986; Blumenberg 1998; Bounameaux 1997; Chengelis 1996; Jorgensen 1993; Krunes 1999; Lutter 1991; Quenet 2003; Unno 2002; Verlato 1999). In people with a diagnosis of ST, 6% to 44% have an associated (or develop) DVT, 20% to 33% have asymptomatic pulmonary embolism (PE), and 2% to 13% have symptomatic PE (Bergqvist 1986; Blumenberg 1998; Bounameaux 1997; Chengelis 1996; Frappé 2014; Jorgensen 1993; Krunes 1999; Lutter 1991; Plate 1985; Quenet 2003; Skillman 1990; Unno 2002; Verlato 1999). ST located in the saphenous main trunk seems to have the strongest association with VTE (Bergqvist 1986; Blumenberg 1998; Chengelis 1996; Jorgensen 1993; Lutter 1991; Quenet 2003; Unno 2002; Verlato 1999). The variations in estimates reported in the literature are probably due to the retrospective design of most studies, the small number of participants included, and the fact that ST was often diagnosed in vascular laboratories where people were referred for suspected DVT. In one cross‐sectional and prospective epidemiological cohort study, ST at diagnosis was associated with VTE in 25% of the cases (Decousus 2010a). During a three‐month follow‐up, 10% of people with ST developed thromboembolic complications despite 90% having received anticoagulant drugs, and about 98% had used elastic compression stockings. In one nationwide population‐based cohort study of 10,973 people with a first diagnosis of ST, the incidence of VTE in the first three months after ST diagnosis was 3.4%, which was estimated to be over 70 times higher compared to the general population without ST (Cannegieter 2015).
Description of the intervention
There is no consensus on the optimal treatment of ST in clinical practice as suggested by a survey in 2011 among practitioners mostly from North America showing a large variability in the management of ST (Dua 2014). Several therapies have been proposed in the literature, including surgery (ligation or stripping of the affected veins), elastic stockings, non‐steroidal anti‐inflammatory drugs (NSAIDs) that aim to reduce pain and inflammation, and several anticoagulant agents. It is unclear whether different locations of ST may influence the choice of treatment. The thrombus location in trunks of either the great saphenous vein (saphena magna) or small saphenous vein (saphena parva) may have the highest risk of extension into the deep vein system and thus could require an aggressive form of treatment, whereas other locations may be associated with a lower risk of extension and thus may warrant a less aggressive approach. Validated risk stratification tools based on ST location and patient characteristics are currently unavailable.
Why it is important to do this review
While the estimates of VTE prevalence in people with ST vary, management of ST should consider the prevention of this scaring complication beyond the mere resolution of local symptoms (Cannegieter 2015; Decousus 2010a; Wichers 2005). Conservative management, mainly focusing on the painful symptoms of disease, might therefore be insufficient. While provision of adequate treatment for ST may help prevent (fatal) VTE, the efficacy of the intervention needs to be balanced against the potential associated risks, such as (major) bleeding events with anticoagulants.
Objectives
To assess the efficacy and safety of topical, medical, and surgical treatments for ST of the leg in improving local symptoms and decreasing thromboembolic complications.
Methods
Criteria for considering studies for this review
Types of studies
Randomised controlled trials (RCTs) evaluating topical, medical, and surgical treatments for ST of the legs.
Types of participants
Hospitalised and non‐hospitalised people with a diagnosis of ST of the lower extremities based on signs and symptoms of ST (e.g. pain, tenderness, induration (hardening of the tissue), or erythema (redness of the skin)) in a superficial vein, and objective diagnosis of the thrombus in the superficial vein by means of compression ultrasonography that excludes any concomitant DVT.
Types of interventions
Interventions included any treatment to relieve the symptoms and signs or to prevent complications of ST, such as topical treatments, compression stockings, compression bandages, leg elevation, medical treatments (e.g. NSAIDs, anticoagulants such as fondaparinux, low molecular weight heparin (LMWH) or the oral direct inhibitors of factor Xa or thrombin), and surgical intervention (e.g. ligation, vein stripping, crossectomy). Each treatment could be compared with another form of treatment, placebo, or no intervention. Combinations of therapies could be used.
Types of outcome measures
We included RCTs assessing any of the following outcome measures for any of the reviewed interventions.
Primary outcomes
Primary efficacy outcome:
-
symptomatic VTE (i.e. the combined of symptomatic PE and symptomatic DVT).
Primary safety outcome:
-
major bleeding.
The presence of PE or DVT had to be confirmed by an objective test, namely pulmonary angiography, ventilation/perfusion lung scan, or spiral computed tomography for PE; and ultrasonography, venography, or plethysmography for DVT.
Secondary outcomes
The secondary outcomes considered for the review were:
-
symptomatic PE;
-
symptomatic DVT or the progression of ST into DVT;
-
extension (symptomatic and asymptomatic) of ST;
-
recurrence (symptomatic and asymptomatic) of ST;
-
symptoms (e.g. pain);
-
signs (e.g. induration and erythema);
-
quality of life (assessed by means of disease‐specific and non‐specific questionnaires);
-
mortality;
-
adverse effects of treatment (e.g. minor bleeding, thrombocytopenia (reduced platelet count), allergic reactions, or surgery complications);
-
arterial thromboembolic events.
Search methods for identification of studies
We searched for RCTs comparing any treatment versus placebo or another treatment in people with ST of the legs. There was no restriction on language.
Electronic searches
For this update, the Cochrane Vascular Information Specialist (CIS) searched the following databases for relevant trials:
-
Cochrane Vascular Specialised Register (March 2017);
-
Cochrane Central Register of Controlled Trials (CENTRAL; 2017, Issue 2) via the Cochrane Register of Studies Online.
See Appendix 1 for details of the search strategy used to search CENTRAL.
The Cochrane Vascular Specialised Register is maintained by the CIS and is constructed from weekly electronic searches of MEDLINE Ovid, Embase Ovid, CINAHL, and AMED, and through handsearching of relevant journals. The full list of the databases, journals, and conference proceedings that have been searched, as well as the search strategies used, are described in the Specialised Register section of the Cochrane Vascular module in the Cochrane Library (www.cochranelibrary.com).
The CIS searched the following trials registries for details of ongoing and unpublished studies in March 2017:
-
ClinicalTrials.gov (www.clinicaltrials.gov);
-
World Health Organization International Clinical Trials Registry Platform (www.who.int/trialsearch);
-
ISRCTN Register (www.isrctn.com/).
See Appendix 2.
Searching other resources
We searched reference lists of relevant papers and conference proceedings of the International Society for Thrombosis and Hemostasis (2003 to 2016) and American Society of Hematology (2004 to 2014), and we attempted to contact known experts in the field.
Data collection and analysis
Selection of studies
Two authors (MDN and IMW) independently reviewed titles and abstracts identified from the database searches to determine whether the inclusion criteria were satisfied. Two authors (MDN and IMW) independently assessed trials for inclusion in the review, and resolved any disagreements through discussion or involvement of a third author (SM). We independently reviewed the full text of identified articles, including those where there was disagreement in the initial title or abstract scanning stage, to ensure that the inclusion criteria were met. We obtained hard copies of the full text of studies that fulfilled the selection criteria. We were not blinded to the journal, institution, or results of the study. Titles and abstracts of non‐English articles were translated into English and assessed for inclusion. We documented reasons for excluding studies and resolved disagreements by consensus. One author (MDN) scanned conference proceedings, identified articles from other sources (experts or reference lists), and contacted trialists for further information if required.
Data extraction and management
Two authors (MDN and IMW) independently extracted the data from the included studies using an agreed format. We resolved any disagreements by consensus and, if necessary, by the involvement of the third author (SM). For any study published twice, we extracted the data from the more complete study. Collected information included methodological quality, characteristics of participants, type of intervention and control, and outcomes.
Assessment of risk of bias in included studies
Two authors independently assessed randomisation, blinding, and adequacy of analyses (Juni 2001). We resolved disagreements by consensus.
Two components of randomisation were assessed: generation of allocation sequences and concealment of allocation. Generation of allocation sequences was considered adequate if it resulted in an unpredictable allocation schedule. Mechanisms considered adequate included random‐number tables, computer‐generated random numbers, minimisation, coin tossing, shuffling cards, and drawing lots. Trials using an unpredictable allocation sequence were considered randomised. Trials using potentially predictable allocation mechanisms, such as alternation or the allocation of participants according to date of birth, were considered quasi‐randomised.
Concealment of allocation was considered adequate if participants and investigators responsible for participants selection were unable to predict, before allocation, which treatment was next. Methods considered adequate included central randomisation; pharmacy‐controlled randomisation using identical prenumbered containers; and sequentially numbered, sealed, opaque envelopes.
Blinding of participants and therapists was considered adequate if experimental and control preparations were explicitly described as indistinguishable or if a double‐dummy technique was used. Assessors were considered blinded if this was explicitly mentioned by the investigators.
Analyses were considered adequate if all randomised participants were included in the analysis according to the intention‐to‐treat (ITT) principle. The item 'free of selective reporting' was classified as at 'low risk of bias' if we had both the protocol and the full report of a given study, where the full report presented results for all outcomes listed in the protocol. We classified a study as at 'high risk of bias' if a report did not present data on all outcomes reported in either the protocol or the methods section. The risk of bias item 'free of other bias' was not considered in this review. We assessed the reporting of primary outcomes and sample size calculations.
Data synthesis
Prior to obtaining the global effect estimators (a balanced mean of the effect in different trials), we planned to evaluate the heterogeneity of treatment effects between trials using the I2 statistic (Higgins 2003), which describes the percentage of total variation across trials that is attributable to heterogeneity rather than chance. I2 values of 25%, 50%, and 75% may be interpreted as low, moderate, and high between‐trial heterogeneity, although the interpretation of the I2 statistic depends on the size and number of trials included (Rücker 2008). In the presence of no or low heterogeneity, we planned to use the fixed‐effect model (Mantel‐Haenszel method) and the random‐effects model to pool and analyse summary effect sizes. Where possible, we presented results as summary risk ratios (RR) or hazard ratios (HRs) for dichotomous variables and mean differences (MD) for all continuous variables. We determined the 95% CI for each estimate. The unit of analysis was the number of participants with the outcome of interest. Where possible, we analysed the results by ITT, including every individual in the randomly assigned treatment group regardless of whether they completed the treatment or withdrew from the trial.
We planned to evaluate publication bias and other biases related to small study size using funnel plots, plotting effect sizes on the vertical axis against their standard errors on the horizontal axis. We planned to assess asymmetry using the asymmetry coefficient: the difference in effect size per unit increase in standard error (Sterne 2001), which is mainly a surrogate for sample size. Symmetry would be expected in the absence of any bias related to small study size.
We used Review Manager 5 for data analysis (RevMan 2014).
'Summary of findings' tables
We presented the main findings of the review concerning the quality of evidence and the magnitude of treatment effects in the 'Summary of findings' tables, according to the GRADE principles described by Higgins 2011 and Guyatt 2008. We used GRADEproGDT software (GRADEproGDT 2015) to create the tables. We included the primary efficacy and safety outcomes of the review as well as the major secondary outcomes (i.e. extension and recurrence of ST, minor bleeding, adverse effects of treatment, and mortality). We focused on the active treatments fondaparinux, LMWH, and NSAIDs with placebo as comparator and at least one primary outcome comparison.
Results
Description of studies
See Characteristics of included studies; Characteristics of excluded studies; and Characteristics of ongoing studies tables.
Results of the search
See Figure 1.
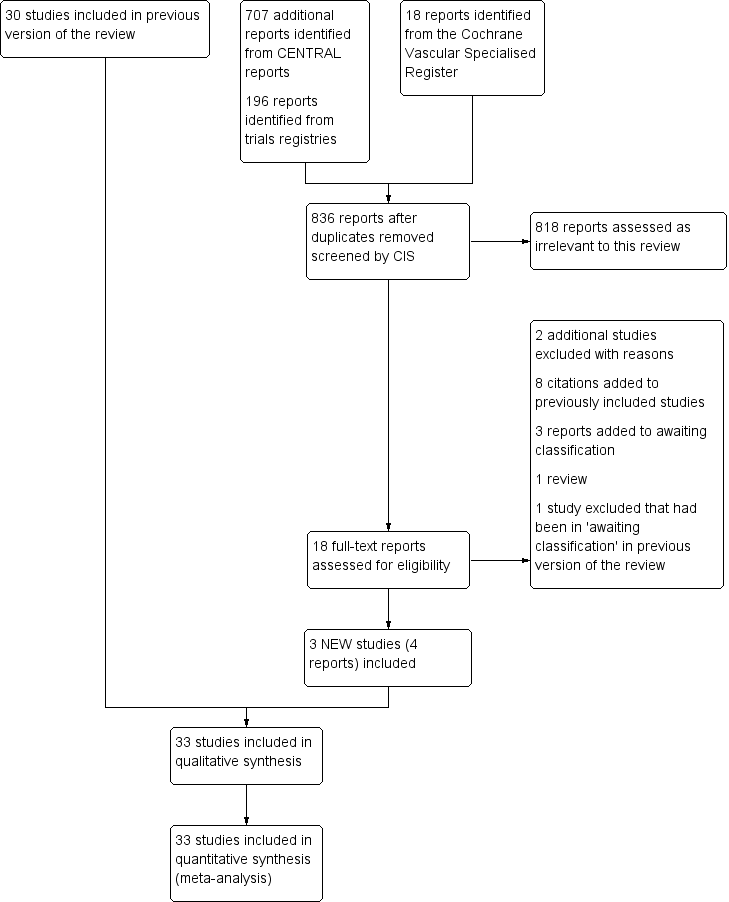
Study flow diagram.
There were three new included studies (Beyer‐Westendorf 2017; Boehler 2014; Spirkoska 2015).
Included studies
Three additional studies were included in this third update (Beyer‐Westendorf 2017; Boehler 2014; Spirkoska 2015), giving a total of 33 studies involving 7296 participants (Andreozzi 1996; Anonymous 1970; Archer 1977; Belcaro 1989; Belcaro 1990; Belcaro 1999; Belcaro 2011; Beyer‐Westendorf 2017; Boehler 2014; Cosmi 2012; Decousus 2010b; De Sanctis 2001; Ferrari 1992; Gorski 2005; Holzgreve 1989; Incandela 2001; Katzenschlager 2003; Koshkin 2001; Kuhlwein 1985; Lozano 2003; Marchiori 2002; Marshall 2001; Messa 1997; Nocker 1991; Nusser 1991; Pinto 1992; Rathbun 2012; Spirkoska 2015; Stenox Group 2003; Titon 1994; Uncu 2009; Vesalio Group 2005; Winter 1986). Nine studies reported data for 50 participants or fewer, 13 trials for 50 to 100 participants, and 11 studies for 100 participants or more.
Interventions and comparisons varied greatly among the studies. Nine trials included a topical treatment group (Belcaro 2011; De Sanctis 2001; Gorski 2005; Holzgreve 1989; Incandela 2001; Katzenschlager 2003; Nocker 1991; Pinto 1992; Winter 1986); three used a surgical treatment group (Belcaro 1989; Belcaro 1999; Lozano 2003); 14 used LMWH (Belcaro 1989; Belcaro 1990; Belcaro 1999; Cosmi 2012; Gorski 2005; Katzenschlager 2003; Lozano 2003; Marchiori 2002; Rathbun 2012; Spirkoska 2015; Stenox Group 2003; Titon 1994; Uncu 2009; Vesalio Group 2005); six used NSAIDs (Anonymous 1970; Ferrari 1992; Nusser 1991; Rathbun 2012; Stenox Group 2003; Titon 1994); two used fondaparinux (Beyer‐Westendorf 2017; Decousus 2010b); one used rivaroxaban (Beyer‐Westendorf 2017), and nine studies used another oral (Archer 1977; Belcaro 1989; Belcaro 1999; Koshkin 2001; Kuhlwein 1985; Messa 1997), intramuscular (Andreozzi 1996), intravenous (Marshall 2001), or non‐pharmacological (Boehler 2014) treatment.
Excluded studies
Two additional studies were excluded in this update (Ng 2010; Supe 2013) and one study which had previously been in the Studies awaiting classification section (Bijuan 2003) was also excluded making a total of 37 excluded studies. The reasons for exclusion are listed in the Characteristics of excluded studies table. Twenty‐one studies included a mixed population and it was not possible to extract data separately for ST (Allegra 1981; Annoni 1991; Argenteri 1983; Bagliani 1983; Becherucci 2000; Bergqvist 1990; Bracale 1996; Bruni 1979; Della Marchina 1989; Luttichau 1989; Mari 1982; Marsala 1985; Mauro 1992; Paciaroni 1982; Porters 1981; Pozza 1980; Seccia 1989; Seghezzi 1972; Seligman 1969; Stolle 1986; Tomamichel 1983). In one study it was not possible to extract outcome data separately for the two study treatment groups (Agus 1993). Four studies included people without a diagnosis of ST of the legs (Bernicot 1980; Gandhi 1984; Resta 1967; van Cauwenberge 1972), and two studies included people with DVT (Di Perri 1986; Rea 1981). In one study, it was unclear whether the study was randomised or not (Giorgetti 1990). Six studies included people with ST of the arm (Gouping 2003; Mehta 1975; Ng 2010; Rozsos 1994; Supe 2013; van der Knaap 1988), and in one study, the evaluated outcomes were not among those considered in the present review (Ibanez‐Bermudez 1996). For one study, we were unable to retrieve sufficient information to judge eligibility fully (Bijuan 2003).
Ongoing studies
One study is still ongoing (Rabe 2009). See Characteristics of ongoing studies table.
Risk of bias in included studies
Details of the methodological quality for each trial are reported in the Characteristics of included studies table. A risk of bias summary is presented in Figure 2.
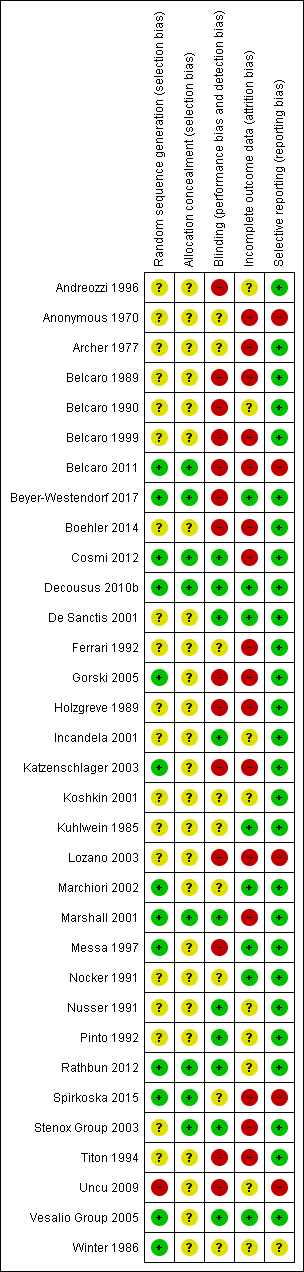
Risk of bias summary: review authors' judgements about each risk of bias item for each included study.
Allocation
Thirteen studies adequately generated the randomisation sequence (Belcaro 2011; Beyer‐Westendorf 2017; Cosmi 2012; Decousus 2010b; Gorski 2005; Katzenschlager 2003; Marchiori 2002; Marshall 2001; Messa 1997; Rathbun 2012; Spirkoska 2015; Vesalio Group 2005; Winter 1986), one was not adequate (Uncu 2009), and the remaining 18 studies were unclear. Eighteen studies adequately concealed allocation (Belcaro 2011; Beyer‐Westendorf 2017; Cosmi 2012; Decousus 2010b; Marshall 2001; Rathbun 2012; Spirkoska 2015; Stenox Group 2003), and the remaining 25 studies were unclear.
Blinding
Ten studies had a double‐blinded design (Cosmi 2012; Decousus 2010b; De Sanctis 2001; Incandela 2001; Marshall 2001; Nusser 1991; Pinto 1992; Rathbun 2012; Stenox Group 2003; Vesalio Group 2005), and in nine studies it was unclear whether blinding was attempted (Anonymous 1970; Archer 1977; Ferrari 1992; Koshkin 2001; Kuhlwein 1985; Marchiori 2002; Nocker 1991; Spirkoska 2015; Winter 1986). The remaining 14 studies did not attempt to blind the assessment of the outcomes or did not report whether blinding was used.
Incomplete outcome data
Seven studies performed the analysis according to the ITT principle (Beyer‐Westendorf 2017; Decousus 2010b; De Sanctis 2001; Kuhlwein 1985; Marchiori 2002; Messa 1997; Nocker 1991; Vesalio Group 2005); in nine this was unclear, while in the remaining studies the percentage of participants randomised and subsequently excluded from the analysis ranged from 2% to 33% (Anonymous 1970; Archer 1977; Belcaro 1989; Belcaro 1999; Belcaro 2011; Boehler 2014; Cosmi 2012; Ferrari 1992; Gorski 2005; Holzgreve 1989; Katzenschlager 2003; Lozano 2003; Marshall 2001; Spirkoska 2015; Stenox Group 2003; Titon 1994). In Beyer‐Westendorf 2017 the primary analysis was originally planned as ITT analysis, but later modified into a per‐protocol analysis. Although 7.6% (36/471) participants randomised were excluded from the primary analysis authors report results also according to the ITT principle.
Selective reporting
Most studies were free of selective reporting except Anonymous 1970; Belcaro 2011; Lozano 2003; Spirkoska 2015; and Uncu 2009 (all high risk), which did not provide data on some of the specified outcomes and Winter 1986 (unclear risk), which was reported as an abstract only and did not prespecify outcomes.
Effects of interventions
See: Summary of findings for the main comparison Fondaparinux compared to placebo for superficial thrombophlebitis of the leg; Summary of findings 2 Prophylactic LMWH versus placebo for superficial thrombophlebitis of the leg; Summary of findings 3 Therapeutic LMWH versus placebo for superficial thrombophlebitis of the leg; Summary of findings 4 NSAIDs versus placebo for superficial thrombophlebitis of the leg
None of the studies evaluated similar treatments on the same study outcomes. Treatment included fondaparinux, rivaroxaban, LMWH, unfractionated heparin (UFH), NSAIDs, topical treatment, oral treatment, intramuscular treatment, and intravenous treatment to surgery.
Fondaparinux
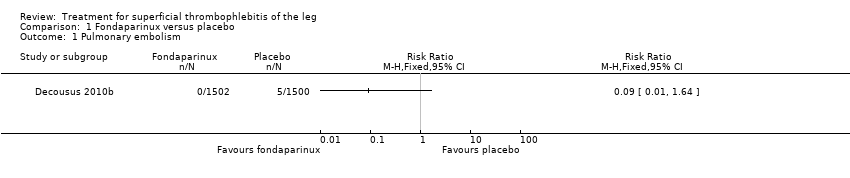
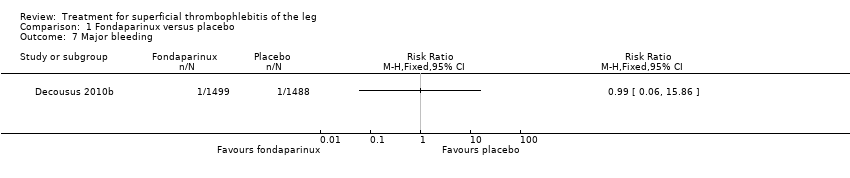
The CALISTO study, a large double‐blinded, placebo‐controlled RCT, evaluated a prophylactic dose (2.5 mg subcutaneously (sc) once daily) of fondaparinux given for 45 days (Decousus 2010b). The primary efficacy outcome of this RCT (i.e. composite of death from any cause, symptomatic PE, symptomatic DVT, or symptomatic extension to the saphenofemoral junction or symptomatic recurrence of ST up to day 47) was reduced by 85% by fondaparinux (RR 0.15, 95% CI 0.08 to 0.26) with a number needed to treat for an additional beneficial outcome (NNTB) of 20. The incidence of each component of the primary efficacy outcome was significantly reduced in the fondaparinux group compared with the placebo group except for the incidence of PE and of death, which did not differ significantly between the two groups (Analysis 1.1; Analysis 1.6). The risk of the composite of symptomatic DVT or PE was reduced by 85% with fondaparinux compared with placebo (RR 0.15, 95% CI 0.04 to 0.50) with a NNTB of 88. Fondaparinux was associated with lower rates of extension (RR 0.08, 95% CI 0.03 to 0.22) and recurrence of ST (RR 0.21, 95% CI 0.08 to 0.54). By day 47, major bleeding had occurred in one participant (0.1%) in each group (RR 0.99, 95% CI 0.06 to 15.86; P = 1.00). The rate of clinically relevant non‐major, minor, and total bleeding; arterial thromboembolic complications; and adverse effects of treatment did not differ significantly between the two groups.
In the SURPRISE study, 472 people with ST and one or more risk factors for thromboembolic complications (older than 65 years, male sex, previous ST or DVT or PE, active cancer or history of cancer, autoimmune disease, or involvement of non‐varicose veins) were randomised to fondaparinux (2.5 mg sc once daily) or the oral direct factor Xa inhibitor rivaroxaban (10 mg once daily) (Beyer‐Westendorf 2017). In the per‐protocol analysis, the incidence of the primary efficacy outcome (i.e. composite of symptomatic DVT or PE, progression or recurrence of ST, and all‐cause mortality at 45 days) was comparable in the rivaroxaban and fondaparinux groups at day 45 (3% with rivaroxaban versus 2% with fondaparinux; HR 1.9, 95% CI 0.6 to 6.4) and at 90 days, (7% with rivaroxaban versus 7% with fondaparinux; HR 1.1, 95% CI 0.5 to 2.2).
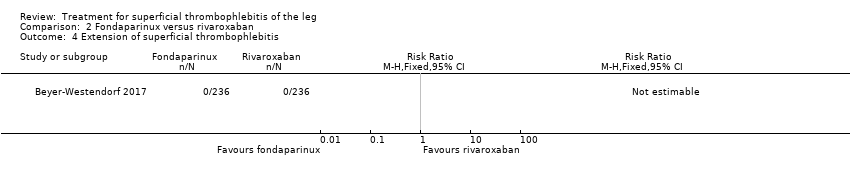
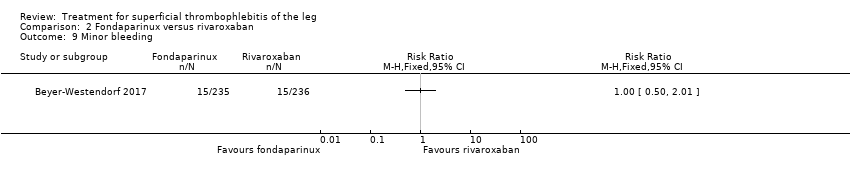
There were similar results when the analysis was performed according to the ITT principle. Fondaparinux was associated with a non‐statistically significant reduction of symptomatic VTE, DVT, recurrence of ST, mortality, clinically relevant non‐major bleeding, serious adverse events, or adverse effects of treatment compared with rivaroxaban (Analysis 2.2; Analysis 2.3; Analysis 2.5; Analysis 2.6; Analysis 2.8; Analysis 2.10; Analysis 2.11). There were no cases of PE, extension of ST or major bleeding in either treatment arm.
Low molecular weight heparin and unfractionated heparin
Fourteen studies included a LMWH group (Belcaro 1989; Belcaro 1990; Belcaro 1999; Cosmi 2012; Gorski 2005; Katzenschlager 2003; Lozano 2003; Marchiori 2002; Rathbun 2012; Spirkoska 2015; Stenox Group 2003; Titon 1994; Uncu 2009; Vesalio Group 2005).
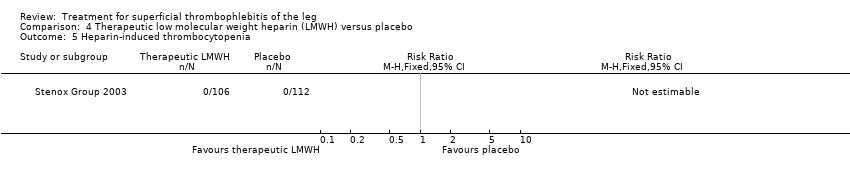
Although not statistically significant, the incidence of VTE tended to be lower with both prophylactic and therapeutic LMWH compared with placebo shortly after treatment (prophylactic: RR 0.25, 95% CI 0.03 to 2.24; therapeutic: RR 0.26, 95% CI 0.03 to 2.33). However, at the end of the three‐month follow‐up, this difference was even less evident suggesting a catch‐up phenomenon (Analysis 3.2; Analysis 4.2) (Stenox Group 2003). Prophylactic and therapeutic LMWH given for eight to 12 days significantly reduced ST extension or recurrence, or both, compared with placebo (prophylactic: RR 0.44, 95% CI 0.26 to 0.74; therapeutic: RR 0.46, 95% CI 0.27 to 0.77). There were no episodes of major bleeding or heparin‐induced thrombocytopenia (HIT) in any treatment group (Stenox Group 2003).
Combined therapy with LMWH plus elastic compression stockings seemed to reduce the incidence of VTE and ST extension or recurrence, or both, compared with elastic stockings alone (VTE: RR 0.08, 95% CI 0.00 to 1.38; ST extension or recurrence, or both: RR 0.08, 95% CI 0.01 to 0.59), although the former difference was not statistically significant (Belcaro 1999). This study did not provide data on safety outcomes.
Two studies randomised participants to topical treatment with heparin spray gel or LMWH (Gorski 2005; Katzenschlager 2003). There was a non‐significant decrease in DVT with LMWH (RR 0.30, 95% CI 0.03 to 2.70) and relief of local symptoms of ST was similar between both treatments at 21 days (Gorski 2005).
One study evaluated LMWH versus surgical treatment (saphenofemoral disconnection) (Lozano 2003). There was a comparable reduction of VTE events and a similar safety profile in the two study groups. There were numerically more cases of ST extension or recurrence with LMWH, although numbers were low and differences were not statistically significant (RR 3.00, 95% CI 0.33 to 27.23).
Three studies evaluated LMWH versus NSAIDs (Rathbun 2012; Stenox Group 2003; Titon 1994). Compared to NSAIDs, both fixed‐dose LMWH and weight‐adjusted LMWH seemed to have a similar effect on VTE (RR 0.93, 95% CI 0.24 to 3.63) and ST recurrence (RR 1.01, 95% CI 0.58 to 1.78). In the study by Rathbun 2012, there was one case of ST progression into the posterior tibial veins and one symptomatic PE, both in the LMWH group. Rathbun 2012 was not pooled with the other two studies for the outcome VTE since the administration of therapeutic LMWH in any person with thrombus progression during follow‐up could have introduced significant confounding. In Stenox Group 2003, which used placebo as a control group, an indirect comparison between prophylactic LMWH and NSAIDs suggested a non‐statistically significant reduction in VTE at the end of treatment (RR 0.45, 95% CI 0.04 to 4.89). There were no major bleeding events or HIT in either group. Rathbun 2012 reported two episodes of cutaneous rash with LMWH. In addition, there was a significant reduction in pain with both LMWH and NSAIDs with no differences between the groups.
One study compared LMWH alone versus LMWH combined with the anti‐inflammatory agent acemetacin (Uncu 2009). There were no cases of VTE, extension of ST, or major bleeding in either group. The effects on signs and symptoms of ST were not statistically different (Analysis 14.4; Analysis 14.5; Analysis 14.6; Analysis 14.7).
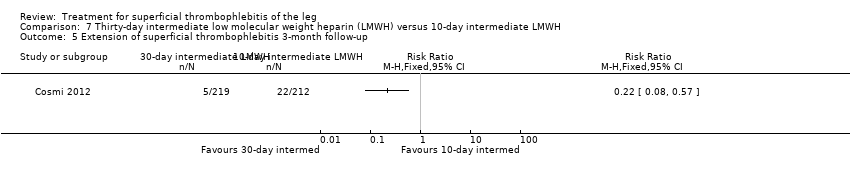
Three studies compared different regimens of LMWH head‐to‐head but without using a placebo or inactive control group (Cosmi 2012; Spirkoska 2015; Vesalio Group 2005). In Cosmi 2012 (the STEFLUX study), the incidence of symptomatic VTE at the end of treatment and at the three‐month follow‐up was not different in the 30‐day intermediate‐dose LMWH and 30‐day prophylactic dose LMWH groups (Analysis 5.1; Analysis 5.2), and it was lower in the 30‐day intermediate‐dose LMWH compared with the 10‐day intermediate‐dose LMWH (VTE end‐of‐treatment: 0.46% with 30‐day intermediate‐dose LMWH versus 4.72% with 10‐day intermediate‐dose LMWH, RR 0.10, 95% CI 0.01 to 0.75; VTE 3‐month follow‐up: 1.82% with 30‐day intermediate‐dose LMWH versus 5.19% with 10‐day intermediate‐dose LMWH, RR 0.35, 95% CI 0.11 to 1.09; Analysis 7.1; Analysis 7.2). At the three‐month follow‐up, symptomatic PE had occurred in none of the participants of the 30‐day intermediate‐dose group and in one participant of both the 10‐day intermediate‐dose and 30‐day prophylactic‐dose LMWH groups. The incidence of symptomatic DVT did not differ between the three groups (Analysis 5.4; Analysis 6.4; Analysis 7.4). ST extension at three months was significantly reduced by the 30‐day intermediate‐dose LMWH in comparison to both the 30‐day prophylactic (2.28% with 30‐day intermediate‐dose versus 8.29% with 30‐day prophylactic dose LMWH; RR 0.28, 95% CI 0.10 to 0.73) and 10‐day intermediate dose LMWH (10.38%, RR 0.22, 95% CI 0.08 to 0.57), while recurrence of ST was similar in the 30‐day intermediate‐dose LMWH and the other two groups (Analysis 5.6; Analysis 7.6). There were no cases of major bleeding or HIT. The intensity of local symptoms evaluated by visual analogue scales (VAS) was comparable in the 30‐day intermediate‐dose, 10‐day intermediate‐dose, and the 30‐day prophylactic‐dose LMWH at the start of treatment (5.0 with 30‐day intermediate‐dose, 5.1 with 10‐day intermediate‐dose, 5.1 with 30‐day prophylactic‐dose; P = 0.97) as well as at the end of treatment (0.7 with 30‐day intermediate‐dose, 0.6 with 10‐day intermediate‐dose, 0.8 with 30‐day prophylactic‐dose; P = 0.10) and at three months (0.2 with 30‐day intermediate‐dose, 0.3 with 10‐day intermediate‐dose, 0.4 with 30‐day prophylactic‐dose; P = 0.47). Allergic reactions occurred in 0.4% with 30‐day intermediate‐dose, 1.4% with 10‐day intermediate‐dose, and 0% with 30‐day prophylactic‐dose.
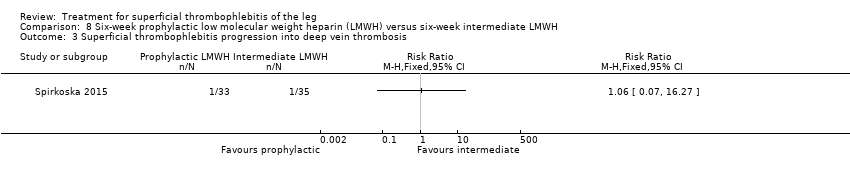
In Spirkoska 2015, one participant in the intermediate‐dose LMWH group developed a symptomatic PE versus none in the prophylactic‐dose LMWH group. Asymptomatic ST progression into DVT occurred in one participant in each group. There were no major bleeding events. The authors reported a regression of the thrombus at the end of the study period in 66% of participants receiving the prophylactic‐dose LMWH compared to 80% in the intermediate‐dose LMWH and a complete thrombus resolution with recanalisation in three participants (9.7%) in the prophylactic‐dose LMWH and six (19.4%) participants in the intermediate‐dose LMWH. These differences were not statistically significant.
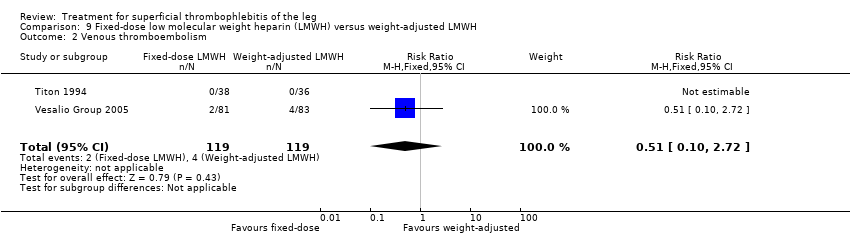
In the Vesalio Group 2005, one month of weight‐adjusted full therapeutic dose of LMWH or fixed prophylactic‐dose LMWH led to a similar reduction in ST extension or recurrence, or VTE (RR 1.20, 95% CI 0.42 to 3.40) over a three‐month follow‐up. In the prophylactic‐dose LMWH group most of the VTE events (77%) occurred while participants were still on treatment, whereas only 33% of participants on therapeutic‐dose LMWH developed VTE during LMWH administration. This advantage was lost after drug discontinuation with no difference at the end of the study period. There was no major bleeding or HIT during the study. Local symptoms and signs regressed faster with therapeutic dose LMWH although the difference was not statistically significant.
Two studies used sc UFH at prophylactic doses as the comparator treatment (Belcaro 1999; Marchiori 2002). Relative to elastic stockings alone, prophylactic sc UFH plus elastic stockings was associated with a statistically non‐significant lower VTE rate (RR 0.08, 95% CI 0.00 to 1.47) and a 83% reduction in ST extension or recurrence (RR 0.17, 95% CI 0.04 to 0.72) (Belcaro 1999). One study compared high‐ versus low‐dose sc UFH. There was a non‐significant 83% reduction in VTE (RR 0.17, 95% CI 0.02 to 1.30) and a 27% (RR 0.73, 95% CI 0.34 to 1.55) reduced rate of ST extension or recurrence among participants treated with high‐dose UFH (Marchiori 2002). There were no episodes of major bleeding or HIT in either study group.
Two studies evaluated sc heparin calcium (Belcaro 1989; Belcaro 1990). The combination of elastic stockings plus heparin calcium did not significantly improve local symptoms and signs compared with elastic stockings alone. Treatment with heparin calcium was correlated with a faster reduction of the analogue score and the area at maximum temperature than with defibrotide, although the difference was not significant. There were no adverse effects.
Non‐steroidal anti‐inflammatory drugs
Six studies included an NSAID group (Anonymous 1970; Ferrari 1992; Nusser 1991; Rathbun 2012; Stenox Group 2003; Titon 1994). Of these, two compared NSAIDs with placebo (Anonymous 1970; Stenox Group 2003), three NSAID with LMWH (Rathbun 2012; Stenox Group 2003; Titon 1994), and two randomised participants to two different NSAIDs (Ferrari 1992; Nusser 1991). The trials comparing NSAIDs versus LMWH have been discussed previously (Rathbun 2012; Stenox Group 2003; Titon 1994).
NSAIDs significantly reduced the risk of ST extension or recurrence, or both, by 54% compared with placebo (RR 0.46, 95% CI 0.27 to 0.78) (Stenox Group 2003). However, there were no differences in the incidence of VTE or in the resolution of local symptoms and signs. While there were no major bleeding episodes recorded in any of the NSAID or placebo groups, indomethacin tended to increase the rate of adverse effects compared with placebo (RR 2.60, 95% CI 0.95 to 7.08) (Anonymous 1970).
In one study, oral acemetacin led to a better resolution of the local clinical picture than diclofenac (Nusser 1991). Another trial compared nimesulide with diclofenac sodium (Ferrari 1992). Local symptoms were similarly improved by both treatments. In the group of participants randomised to nimesulide, there was a lower incidence of gastric pain episodes (RR 0.25, 95% CI 0.03 to 2.08) although this difference was not statistically significant (Ferrari 1992).
Topical treatment
Nine studies included a topical treatment group (Belcaro 2011; De Sanctis 2001; Gorski 2005; Holzgreve 1989; Incandela 2001; Katzenschlager 2003; Nocker 1991; Pinto 1992; Winter 1986). The comparison of heparin spray gel versus LMWH has been discussed earlier (see Low molecular weight heparin and unfractionated heparin section; Gorski 2005; Katzenschlager 2003).
Belcaro 2011 randomised participants to three doses of heparin spray gel versus placebo for seven to 14 days. After one week, there was a significant reduction in pain assessed by the VAS with heparin spray gel (‐93.13% reduction with heparin spray gel versus ‐61.35% reduction with placebo; P < 0.0001), a lower erythema extension (‐92% with heparin spray gel versus ‐26% with placebo; P < 0.012), and thrombus length (‐40.81 with heparin spray gel versus ‐4.22 with placebo; P < 0.0001). There were no adverse events or drug‐related reactions reported.
One study randomised participants to receive topical methylthioadenosine or placebo (Pinto 1992). Methylthioadenosine was associated with a non‐significant reduction in local signs and symptoms relative to placebo.
A significant improvement in the local symptomatology was observed with diclofenac gel (Nocker 1991) and essaven gel (De Sanctis 2001; Incandela 2001) compared with placebo.
Holzgreve 1989 and Winter 1986 compared two different types of gel. Holzgreve 1989 evaluated diclofenac gel versus etofenak gel and showed a comparable efficacy profile of the two topical medications. Winter 1986 compared diclofenac gel and heparin gel and found a better efficacy with diclofenac gel.
None of the studies evaluating a topical treatment reported data on VTE or ST recurrence.
Surgery
Three studies included a surgical treatment (Belcaro 1989; Belcaro 1999; Lozano 2003). One study compared surgery (saphenofemoral disconnection) with LMWH (see Low molecular weight heparin and unfractionated heparin section; Lozano 2003). The remaining two studies compared surgery combined with elastic stockings with elastic stockings alone (Belcaro 1989; Belcaro 1999).
One trial found that thrombectomy plus elastic stockings with or without venoruton led to an improvement of the local clinical signs and a greater reduction in the number of veins with ST compared with elastic compression bandages alone (Belcaro 1989). There were no cases of DVT in either group. One trial found that ligation of the vein plus elastic stockings was associated with a non‐significant reduction in VTE events (RR 0.33, 95% CI 0.07 to 1.60) and ST recurrence and extension (RR 0.46, 95% CI 0.18 to 1.15) relative to the control treatment (Belcaro 1999).
Compared with elastic stockings alone, venous stripping plus elastic stockings decreased the risk of ST extension and recurrence (RR 0.09, 95% CI 0.01 to 0.64) and seemed to be associated with a lower, non‐significant, incidence of VTE (RR 0.37, 95% CI 0.08 to 1.78) (Belcaro 1999).
Other
Nine studies evaluated an oral (Archer 1977; Belcaro 1989; Belcaro 1999; Koshkin 2001; Kuhlwein 1985; Messa 1997), intramuscular (Andreozzi 1996), intravenous (Marshall 2001), or non‐pharmacological (Boehler 2014) treatment. Beyer‐Westendorf 2017 compared oral rivaroxaban with fondaparinux and has been presented above (see Fondaparinux section).
Compared with placebo, oral vasotonin was associated with a higher proportion of participants who were cured or improved (Kuhlwein 1985). The criteria to determine the response to study treatment were not described. Vasotonin seemed to be well tolerated, with one case of poor tolerability among participants treated with vasotonin (3%) versus five cases (13%) in the placebo arm (RR 0.20, 95% CI 0.02 to 1.63).
The combination of venoruton, thrombectomy, and elastic stockings versus elastic stockings alone has been discussed above (see Low molecular weight heparin and unfractionated heparin section; Belcaro 1989). In the same trial, venoruton combined with elastic stockings led to an improvement of local symptoms compared with elastic stockings alone.
One study evaluating oral heparansulphate versus oral sulodexide suggested a greater decrease in local pain, itching, and redness in participants receiving oral heparansulphate than in the group receiving sulodexide (Messa 1997).
Compared with placebo, oxyphenbutazone reduced local tenderness four‐fold and halved the intensity of pain and erythema (Archer 1977).
One study evaluated oral vitamin K antagonists in combination with elastic stockings, which suggested a non‐significant reduction in VTE events (RR 0.08, 95% CI 0.00 to 1.47) and ST extension or recurrence (RR 0.42, 95% CI 0.16 to 1.13) with vitamin K antagonists plus elastic stockings compared with elastic stockings alone (Belcaro 1999).
Two studies addressed the use of enzyme therapy versus placebo (Koshkin 2001; Marshall 2001). Enzyme treatment seemed to improve local symptoms although the criteria to evaluate the response to study treatment were not reported.
One trial assessed the efficacy of three doses of desmin (Andreozzi 1996). There was a better control of local symptoms with higher doses of desmin without any increase in the risk of adverse events.
One study evaluated LMWH plus compression stockings versus LMWH alone (Boehler 2014). At the three‐week follow‐up, there was no difference between the two groups with regard to pain intensity (mean difference ‐0.15 cm, 95% CI ‐0.95 to 0.65), skin erythema (‐6.54 cm2, 95% CI ‐17.94 to 4.86), or quality of life evaluated through the 36‐item Short Form (SF‐36) Physical score (mean difference 2.92, 95% CI ‐1.04 to 6.88) and SF‐36 Mental score (‐2.98, 95% CI ‐7.30 to 1.34). There was no DVT or HIT.
Discussion
Uncertainty still exists around the optimal treatment of ST of the legs. The therapeutic approach for ST should aim at the resolution or improvement of the local symptoms but also, and even more importantly, at preventing the possible extension of the superficial vein thrombosis into the deep venous system (Wichers 2005).
This review summarised data from 7296 people with ST of the legs. About half of the participants were included in the CALISTO study, which compared 45 days of fondaparinux versus placebo using a double‐blind method (Decousus 2010b). Fondaparinux reduced the incidence of symptomatic VTE by 85%, ST extension by 92%, and the recurrence of ST by 79%. A total of 88 participants would need to be treated with fondaparinux to prevent one PE or DVT. These benefits were achieved without apparently increasing the risk of bleeding and they were maintained at one‐month follow‐up after discontinuation of treatment. However, CIs around bleeding estimate were broad and did not exclude a significantly higher risk with the drug. In the SURPRISE study, people with ST and one or more risk factors for thromboembolic complications were randomised to 45 days of fondaparinux or rivaroxaban 10 mg (Beyer‐Westendorf 2017). The results suggested that rivaroxaban was as effective as fondaparinux; however, the study was not powered to prove non‐inferiority. In addition, the authors observed a non‐statistically significant increase of the primary composite outcome as well as of clinically relevant non‐major bleedings in the rivaroxaban group which require further evaluation in appropriately sized studies. In contrast to the CALISTO study, the risk of thromboembolic events seemed to increase after treatment withdrawal at 45 days suggesting that a longer treatment may be required for people at high risk.
Compared with placebo or topical treatments, both NSAIDs and LMWH could help preventing ST extension while effectively controlling local symptoms (Stenox Group 2003; Titon 1994). When compared with each other, LMWH and NSAIDs seemed to be associated with a similar reduction in the incidence of VTE and worsening of ST. However, these conclusions need to be taken cautiously due to the methodological drawbacks, the low incidence of VTE, and the sample size of the available studies, which did not have enough power for a direct comparison between LMWH and NSAIDs. Thus, these data remain preliminary and further research is required to determine which treatment works better in terms of VTE prevention, and whether a combination may be more effective. Moreover, the benefits of LMWH and NSAIDs should be balanced against the associated adverse effects such as bleeding and gastric complications. None of the studies reported major bleeding episodes in participants randomised to LMWH. NSAIDs increased the risk of gastric pain three‐fold compared with placebo. To date, no study has evaluated NSAIDs versus surgery whereas one trial directly compared LMWH with surgical treatment, showing a comparable efficacy and safety (Lozano 2003). Despite the methodological limitations of this study, the results would suggest that a medical approach with LMWH would be as effective and safe as an invasive surgical treatment.
Cosmi 2012 and Vesalio Group 2005 compared different regimens of LMWH head‐to‐head. While symptomatic VTE occurred at a similar rate with prophylactic and higher (intermediate or therapeutic) dose LMWH, the higher‐dose LMWH seemed to be associated with a significant 70% reduction in ST progression (Cosmi 2012). Furthermore, the findings of Cosmi 2012 suggested that treatment with LMWH should be prolonged for at least 30 days to reduce the incidence of symptomatic VTE, compared to shorter usage of LMWH. However, it should be noted that neither Cosmi 2012 nor Vesalio Group 2005 had a placebo or inactive control group and Cosmi 2012 was prematurely interrupted, which may have led to an overestimation of the differences between the groups.
In the study of Boehler 2014, the addition of compression stockings to prophylactic dose LMWH seemed to carry no additional benefit in terms of clinical improvement.
Preliminary data suggested that high‐dose UFH can be effective in the treatment of ST although this needs to be confirmed in larger studies (Marchiori 2002). While not directly evaluated against UFH, fondaparinux and LMWH may still be preferable due to the easier mode of administration and the more predictable response not requiring laboratory monitoring as for UFH.
Most of the studies comparing oral treatment, topical treatment, or surgery did not report VTE, ST progression, adverse events, or treatment adverse effects. In addition, the methodological quality of these studies was often poor, with major study design flaws such as an unclear method of allocation or randomisation, the lack of a placebo as control group, or an unacceptably high dropout rate. All these limitations weaken the clinical applicability of the results and cast doubt about the actual efficacy and safety of these treatments.
Summary of main results
Fondaparinux was associated with a significant lower incidence of VTE, ST extension, or ST recurrence relative to placebo with similar risk of bleeding. Rivaroxaban 10 mg requires further evaluation. As compared to placebo, LMWH and NSAIDs appeared to reduce the extension or recurrence of ST, or both, whereas the available data did not show any significant effect on VTE. The evidence on oral treatments, topical treatment, or surgery was too limited and did not inform clinical practice about the effects of these treatments in terms of VTE.
Quality of the evidence
Our systematic approach to searching, study selection, and data extraction followed that of the Cochrane Handbook for Systematic Reviews of Interventions (Higgins 2011). The methodological quality of the included studies varied from low to high (see Figure 2). Poor reporting did not allow proper scoring of relevant study design features, such as sequence generation and allocation concealment, in the majority of included studies. Overall, the quality of evidence was very low for most intervention outcomes due to limitations in study design, imprecision of results and single study comparisons. The quality of evidence was low to moderate for outcomes in the two placebo‐controlled studies included in this review (Decousus 2010b; Stenox Group 2003). See summary of findings Table for the main comparison; summary of findings Table 2; summary of findings Table 3; and summary of findings Table 4.
Potential biases in the review process
One limitation of this review is that, despite the relatively large number of comparisons found, only a few studies compared the same treatment on the same study outcomes. The 'no difference' findings on a specific outcome may thus be the result of insufficient power of the analysis to show a difference between treatment groups as well as the absence of a true effect. For similar reasons, it was not possible to conduct subgroup analyses for the primary efficacy outcomes to evaluate the interaction of trial characteristics with treatment effects.
Agreements and disagreements with other studies or reviews
Since our previous systematic review on the prevention of VTE in people with ST of the leg (Wichers 2005), the results of two large RCTs on the efficacy of fondaparinux for the treatment of ST have become available (Beyer‐Westendorf 2017; Decousus 2010b). The high methodological quality and the size of the CALISTO study (Decousus 2010b), which alone accounted for half of the overall review population, made it a landmark investigation in the field. The SURPRISE study was the first to compare one of the direct oral factor Xa inhibitors, rivaroxaban, with fondaparinux and to select people with ST based on their underlying risk of thromboembolic events.

Study flow diagram.

Risk of bias summary: review authors' judgements about each risk of bias item for each included study.
Comparison 1 Fondaparinux versus placebo, Outcome 1 Pulmonary embolism.

Comparison 1 Fondaparinux versus placebo, Outcome 2 Deep vein thrombosis.

Comparison 1 Fondaparinux versus placebo, Outcome 3 Deep vein thrombosis or pulmonary embolism.

Comparison 1 Fondaparinux versus placebo, Outcome 4 Extension of superficial thrombophlebitis.

Comparison 1 Fondaparinux versus placebo, Outcome 5 Recurrence of superficial thrombophlebitis.

Comparison 1 Fondaparinux versus placebo, Outcome 6 Mortality.
Comparison 1 Fondaparinux versus placebo, Outcome 7 Major bleeding.

Comparison 1 Fondaparinux versus placebo, Outcome 8 Clinically relevant non‐major bleeding.

Comparison 1 Fondaparinux versus placebo, Outcome 9 Minor bleeding.

Comparison 1 Fondaparinux versus placebo, Outcome 10 Arterial thromboembolic complication.

Comparison 1 Fondaparinux versus placebo, Outcome 11 Adverse effects of treatment.

Comparison 1 Fondaparinux versus placebo, Outcome 12 Non‐fatal serious adverse event.

Comparison 2 Fondaparinux versus rivaroxaban, Outcome 1 Pulmonary embolism.

Comparison 2 Fondaparinux versus rivaroxaban, Outcome 2 Deep vein thrombosis.

Comparison 2 Fondaparinux versus rivaroxaban, Outcome 3 Deep vein thrombosis or pulmonary embolism.
Comparison 2 Fondaparinux versus rivaroxaban, Outcome 4 Extension of superficial thrombophlebitis.

Comparison 2 Fondaparinux versus rivaroxaban, Outcome 5 Recurrence of superficial thrombophlebitis.

Comparison 2 Fondaparinux versus rivaroxaban, Outcome 6 Mortality.

Comparison 2 Fondaparinux versus rivaroxaban, Outcome 7 Major bleeding.

Comparison 2 Fondaparinux versus rivaroxaban, Outcome 8 Clinically relevant non‐major bleeding.
Comparison 2 Fondaparinux versus rivaroxaban, Outcome 9 Minor bleeding.

Comparison 2 Fondaparinux versus rivaroxaban, Outcome 10 Serious adverse events.

Comparison 2 Fondaparinux versus rivaroxaban, Outcome 11 Adverse effects of treatment.

Comparison 3 Prophylactic low molecular weight heparin (LMWH) versus placebo, Outcome 1 Venous thromboembolism end‐of‐treatment.

Comparison 3 Prophylactic low molecular weight heparin (LMWH) versus placebo, Outcome 2 Venous thromboembolism 3‐month follow‐up.
Comparison 3 Prophylactic low molecular weight heparin (LMWH) versus placebo, Outcome 3 Extension or recurrence (or both) of superficial thrombophlebitis.

Comparison 3 Prophylactic low molecular weight heparin (LMWH) versus placebo, Outcome 4 Major bleeding.

Comparison 3 Prophylactic low molecular weight heparin (LMWH) versus placebo, Outcome 5 Heparin‐induced thrombocytopenia.

Comparison 4 Therapeutic low molecular weight heparin (LMWH) versus placebo, Outcome 1 Venous thromboembolism end‐of‐treatment.

Comparison 4 Therapeutic low molecular weight heparin (LMWH) versus placebo, Outcome 2 Venous thromboembolism 3‐month follow‐up.

Comparison 4 Therapeutic low molecular weight heparin (LMWH) versus placebo, Outcome 3 Extension or recurrence (or both) of superficial thrombophlebitis.
Comparison 4 Therapeutic low molecular weight heparin (LMWH) versus placebo, Outcome 4 Major bleeding.
Comparison 4 Therapeutic low molecular weight heparin (LMWH) versus placebo, Outcome 5 Heparin‐induced thrombocytopenia.

Comparison 5 Thirty‐day prophylactic low molecular weight heparin (LMWH) versus 30‐day intermediate LMWH, Outcome 1 Venous thromboembolism end‐of‐treatment.

Comparison 5 Thirty‐day prophylactic low molecular weight heparin (LMWH) versus 30‐day intermediate LMWH, Outcome 2 Venous thromboembolism 3‐month follow‐up.

Comparison 5 Thirty‐day prophylactic low molecular weight heparin (LMWH) versus 30‐day intermediate LMWH, Outcome 3 Symptomatic deep vein thrombosis end‐of‐treatment.

Comparison 5 Thirty‐day prophylactic low molecular weight heparin (LMWH) versus 30‐day intermediate LMWH, Outcome 4 Symptomatic deep vein thrombosis 3‐month follow‐up.

Comparison 5 Thirty‐day prophylactic low molecular weight heparin (LMWH) versus 30‐day intermediate LMWH, Outcome 5 Extension of superficial thrombophlebitis 3‐month follow‐up.

Comparison 5 Thirty‐day prophylactic low molecular weight heparin (LMWH) versus 30‐day intermediate LMWH, Outcome 6 Recurrence of superficial thrombophlebitis 3‐month follow‐up.

Comparison 6 Thirty‐day prophylactic low molecular weight heparin (LMWH) versus 10‐day intermediate LMWH, Outcome 1 Venous thromboembolism end‐of‐treatment.

Comparison 6 Thirty‐day prophylactic low molecular weight heparin (LMWH) versus 10‐day intermediate LMWH, Outcome 2 Venous thromboembolism 3‐month follow‐up.

Comparison 6 Thirty‐day prophylactic low molecular weight heparin (LMWH) versus 10‐day intermediate LMWH, Outcome 3 Symptomatic deep vein thrombosis end‐of‐treatment.

Comparison 6 Thirty‐day prophylactic low molecular weight heparin (LMWH) versus 10‐day intermediate LMWH, Outcome 4 Symptomatic deep vein thrombosis 3‐month follow‐up.

Comparison 6 Thirty‐day prophylactic low molecular weight heparin (LMWH) versus 10‐day intermediate LMWH, Outcome 5 Extension of superficial thrombophlebitis 3‐month follow‐up.

Comparison 6 Thirty‐day prophylactic low molecular weight heparin (LMWH) versus 10‐day intermediate LMWH, Outcome 6 Recurrence of superficial thrombophlebitis 3‐month follow‐up.

Comparison 7 Thirty‐day intermediate low molecular weight heparin (LMWH) versus 10‐day intermediate LMWH, Outcome 1 Venous thromboembolism end‐of‐treatment.

Comparison 7 Thirty‐day intermediate low molecular weight heparin (LMWH) versus 10‐day intermediate LMWH, Outcome 2 Venous thromboembolism 3‐month follow‐up.

Comparison 7 Thirty‐day intermediate low molecular weight heparin (LMWH) versus 10‐day intermediate LMWH, Outcome 3 Symptomatic deep vein thrombosis end‐of‐treatment.

Comparison 7 Thirty‐day intermediate low molecular weight heparin (LMWH) versus 10‐day intermediate LMWH, Outcome 4 Symptomatic deep vein thrombosis 3‐month follow‐up.
Comparison 7 Thirty‐day intermediate low molecular weight heparin (LMWH) versus 10‐day intermediate LMWH, Outcome 5 Extension of superficial thrombophlebitis 3‐month follow‐up.

Comparison 7 Thirty‐day intermediate low molecular weight heparin (LMWH) versus 10‐day intermediate LMWH, Outcome 6 Recurrence of superficial thrombophlebitis 3‐month follow‐up.

Comparison 8 Six‐week prophylactic low molecular weight heparin (LMWH) versus six‐week intermediate LMWH, Outcome 1 Symptomatic venous thromboembolism.

Comparison 8 Six‐week prophylactic low molecular weight heparin (LMWH) versus six‐week intermediate LMWH, Outcome 2 Symptomatic pulmonary embolism.
Comparison 8 Six‐week prophylactic low molecular weight heparin (LMWH) versus six‐week intermediate LMWH, Outcome 3 Superficial thrombophlebitis progression into deep vein thrombosis.

Comparison 8 Six‐week prophylactic low molecular weight heparin (LMWH) versus six‐week intermediate LMWH, Outcome 4 Major bleeding.

Comparison 9 Fixed‐dose low molecular weight heparin (LMWH) versus weight‐adjusted LMWH, Outcome 1 Superficial thrombophlebitis or venous thromboembolism.
Comparison 9 Fixed‐dose low molecular weight heparin (LMWH) versus weight‐adjusted LMWH, Outcome 2 Venous thromboembolism.

Comparison 9 Fixed‐dose low molecular weight heparin (LMWH) versus weight‐adjusted LMWH, Outcome 3 Superficial thrombophlebitis.

Comparison 9 Fixed‐dose low molecular weight heparin (LMWH) versus weight‐adjusted LMWH, Outcome 4 Swelling disappearance.

Comparison 9 Fixed‐dose low molecular weight heparin (LMWH) versus weight‐adjusted LMWH, Outcome 5 Tenderness disappearance.

Comparison 9 Fixed‐dose low molecular weight heparin (LMWH) versus weight‐adjusted LMWH, Outcome 6 Pain disappearance.
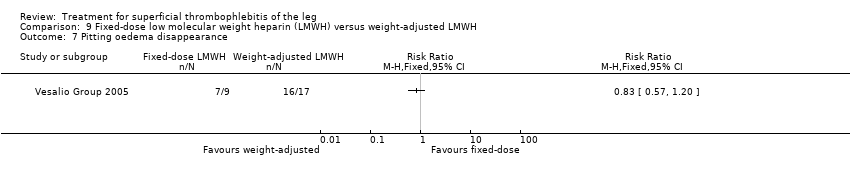
Comparison 9 Fixed‐dose low molecular weight heparin (LMWH) versus weight‐adjusted LMWH, Outcome 7 Pitting oedema disappearance.

Comparison 9 Fixed‐dose low molecular weight heparin (LMWH) versus weight‐adjusted LMWH, Outcome 8 Collateral veins disappearance.

Comparison 9 Fixed‐dose low molecular weight heparin (LMWH) versus weight‐adjusted LMWH, Outcome 9 Redness disappearance.

Comparison 9 Fixed‐dose low molecular weight heparin (LMWH) versus weight‐adjusted LMWH, Outcome 10 Palpable cord disappearance.

Comparison 9 Fixed‐dose low molecular weight heparin (LMWH) versus weight‐adjusted LMWH, Outcome 11 Major bleeding.

Comparison 9 Fixed‐dose low molecular weight heparin (LMWH) versus weight‐adjusted LMWH, Outcome 12 Heparin‐induced thrombocytopenia.

Comparison 10 Therapeutic low molecular weight heparin (LMWH) versus saphenofemoral disconnection, Outcome 1 Venous thromboembolism.

Comparison 10 Therapeutic low molecular weight heparin (LMWH) versus saphenofemoral disconnection, Outcome 2 Extension or recurrence (or both) of superficial thrombophlebitis.

Comparison 10 Therapeutic low molecular weight heparin (LMWH) versus saphenofemoral disconnection, Outcome 3 Major bleeding.

Comparison 10 Therapeutic low molecular weight heparin (LMWH) versus saphenofemoral disconnection, Outcome 4 Complications.

Comparison 11 Fixed‐dose low molecular weight heparin (LMWH) versus non‐steroidal anti‐inflammatory drugs (NSAIDs), Outcome 1 Venous thromboembolism.

Comparison 11 Fixed‐dose low molecular weight heparin (LMWH) versus non‐steroidal anti‐inflammatory drugs (NSAIDs), Outcome 2 Extension or recurrence (or both) of superficial thrombophlebitis.

Comparison 11 Fixed‐dose low molecular weight heparin (LMWH) versus non‐steroidal anti‐inflammatory drugs (NSAIDs), Outcome 3 Major bleeding.

Comparison 11 Fixed‐dose low molecular weight heparin (LMWH) versus non‐steroidal anti‐inflammatory drugs (NSAIDs), Outcome 4 Heparin‐induced thrombocytopenia.

Comparison 12 Weight‐adjusted low molecular weight heparin (LMWH) versus non‐steroidal anti‐inflammatory drugs (NSAIDs), Outcome 1 Venous thromboembolism.

Comparison 12 Weight‐adjusted low molecular weight heparin (LMWH) versus non‐steroidal anti‐inflammatory drugs (NSAIDs), Outcome 2 Extension or recurrence (or both) of superficial thrombophlebitis.

Comparison 12 Weight‐adjusted low molecular weight heparin (LMWH) versus non‐steroidal anti‐inflammatory drugs (NSAIDs), Outcome 3 Major bleeding.

Comparison 12 Weight‐adjusted low molecular weight heparin (LMWH) versus non‐steroidal anti‐inflammatory drugs (NSAIDs), Outcome 4 Heparin‐induced thrombocytopenia.
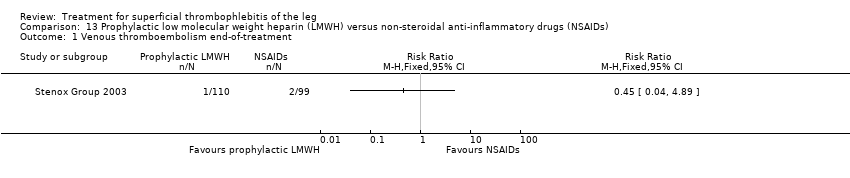
Comparison 13 Prophylactic low molecular weight heparin (LMWH) versus non‐steroidal anti‐inflammatory drugs (NSAIDs), Outcome 1 Venous thromboembolism end‐of‐treatment.

Comparison 13 Prophylactic low molecular weight heparin (LMWH) versus non‐steroidal anti‐inflammatory drugs (NSAIDs), Outcome 2 Venous thromboembolism 3‐month follow‐up.

Comparison 13 Prophylactic low molecular weight heparin (LMWH) versus non‐steroidal anti‐inflammatory drugs (NSAIDs), Outcome 3 Extension or recurrence (or both) of superficial thrombophlebitis.

Comparison 13 Prophylactic low molecular weight heparin (LMWH) versus non‐steroidal anti‐inflammatory drugs (NSAIDs), Outcome 4 Major bleeding.

Comparison 13 Prophylactic low molecular weight heparin (LMWH) versus non‐steroidal anti‐inflammatory drugs (NSAIDs), Outcome 5 Heparin‐induced thrombocytopenia.
Comparison 14 Low molecular weight heparin (LMWH) versus LMWH plus acemetacin, Outcome 1 Pulmonary embolism.

Comparison 14 Low molecular weight heparin (LMWH) versus LMWH plus acemetacin, Outcome 2 Deep vein thrombosis.

Comparison 14 Low molecular weight heparin (LMWH) versus LMWH plus acemetacin, Outcome 3 Extension of superficial thrombophlebitis.

Comparison 14 Low molecular weight heparin (LMWH) versus LMWH plus acemetacin, Outcome 4 Pain reduction.

Comparison 14 Low molecular weight heparin (LMWH) versus LMWH plus acemetacin, Outcome 5 Hyperaemia reduction.

Comparison 14 Low molecular weight heparin (LMWH) versus LMWH plus acemetacin, Outcome 6 Tenderness reduction.

Comparison 14 Low molecular weight heparin (LMWH) versus LMWH plus acemetacin, Outcome 7 Palpable cord reduction.

Comparison 14 Low molecular weight heparin (LMWH) versus LMWH plus acemetacin, Outcome 8 Mortality.

Comparison 14 Low molecular weight heparin (LMWH) versus LMWH plus acemetacin, Outcome 9 Major bleeding.

Comparison 14 Low molecular weight heparin (LMWH) versus LMWH plus acemetacin, Outcome 10 Minor bleeding.

Comparison 14 Low molecular weight heparin (LMWH) versus LMWH plus acemetacin, Outcome 11 Adverse events.

Comparison 15 Prophylactic low molecular weight heparin (LMWH) plus elastic compression stockings (ECS) versus ECS alone, Outcome 1 Venous thromboembolism.

Comparison 15 Prophylactic low molecular weight heparin (LMWH) plus elastic compression stockings (ECS) versus ECS alone, Outcome 2 Extension or recurrence (or both) of superficial thrombophlebitis.
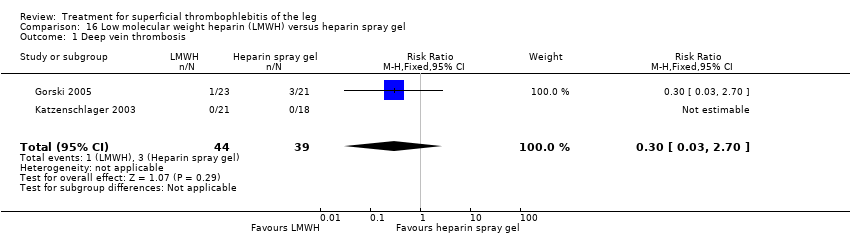
Comparison 16 Low molecular weight heparin (LMWH) versus heparin spray gel, Outcome 1 Deep vein thrombosis.

Comparison 16 Low molecular weight heparin (LMWH) versus heparin spray gel, Outcome 2 Participants with thrombus at 21 days.

Comparison 16 Low molecular weight heparin (LMWH) versus heparin spray gel, Outcome 3 Allergic reaction or elevated sedimentation rate.

Comparison 17 High‐dose unfractionated heparin (UFH) versus low‐dose UFH, Outcome 1 Incidence of venous thromboembolism.

Comparison 17 High‐dose unfractionated heparin (UFH) versus low‐dose UFH, Outcome 2 Extension or recurrence (or both) of superficial thrombophlebitis.

Comparison 17 High‐dose unfractionated heparin (UFH) versus low‐dose UFH, Outcome 3 Major bleeding.

Comparison 17 High‐dose unfractionated heparin (UFH) versus low‐dose UFH, Outcome 4 Heparin‐induced thrombocytopenia.

Comparison 18 Heparin calcium plus elastic compression bandage (ECB) versus ECB alone, Outcome 1 Deep vein thrombosis.
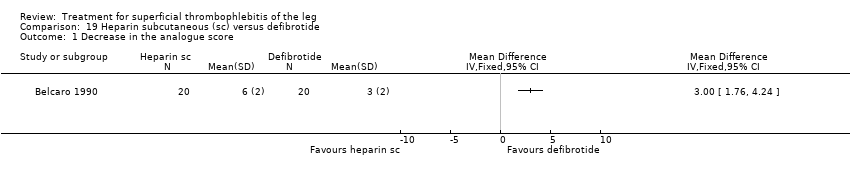
Comparison 19 Heparin subcutaneous (sc) versus defibrotide, Outcome 1 Decrease in the analogue score.

Comparison 19 Heparin subcutaneous (sc) versus defibrotide, Outcome 2 Adverse effects of treatment.

Comparison 20 Non‐steroidal anti‐inflammatory drugs (NSAIDs) versus placebo, Outcome 1 Venous thromboembolism.

Comparison 20 Non‐steroidal anti‐inflammatory drugs (NSAIDs) versus placebo, Outcome 2 Extension or recurrence (or both) of superficial thrombophlebitis.

Comparison 20 Non‐steroidal anti‐inflammatory drugs (NSAIDs) versus placebo, Outcome 3 Major bleeding.

Comparison 20 Non‐steroidal anti‐inflammatory drugs (NSAIDs) versus placebo, Outcome 4 Heparin‐induced thrombocytopenia.

Comparison 21 Indomethacin versus placebo, Outcome 1 Adverse effects.

Comparison 22 Nimesulide versus diclofenac sodium, Outcome 1 Gastric pain.
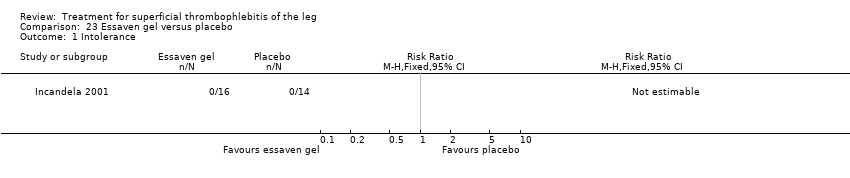
Comparison 23 Essaven gel versus placebo, Outcome 1 Intolerance.

Comparison 24 Thrombectomy plus venoruton plus elastic compression bandage (ECB) versus ECB alone, Outcome 1 Deep vein thrombosis.
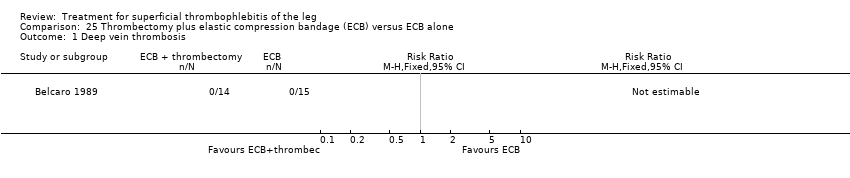
Comparison 25 Thrombectomy plus elastic compression bandage (ECB) versus ECB alone, Outcome 1 Deep vein thrombosis.

Comparison 26 Ligation plus elastic compression stockings (ECS) versus ECS alone, Outcome 1 Venous thromboembolism.

Comparison 26 Ligation plus elastic compression stockings (ECS) versus ECS alone, Outcome 2 Extension or recurrence (or both) of superficial thrombophlebitis.

Comparison 27 Prophylactic unfractionated heparin (UFH) plus elastic compression stockings (ECS) versus ECS alone, Outcome 1 Venous thromboembolism.

Comparison 27 Prophylactic unfractionated heparin (UFH) plus elastic compression stockings (ECS) versus ECS alone, Outcome 2 Extension or recurrence (or both) of superficial thrombophlebitis.

Comparison 28 Oral vasotonin versus placebo, Outcome 1 Cured or substantially better.

Comparison 28 Oral vasotonin versus placebo, Outcome 2 Poor tolerability.

Comparison 29 Elastic compression bandage (ECB) plus venoruton versus ECB alone, Outcome 1 Deep vein thrombosis.

Comparison 30 Oral heparansulphate versus oral sulodexide, Outcome 1 Redness disappearance.

Comparison 30 Oral heparansulphate versus oral sulodexide, Outcome 2 Pain disappearance.

Comparison 30 Oral heparansulphate versus oral sulodexide, Outcome 3 Disappearance of itching.

Comparison 30 Oral heparansulphate versus oral sulodexide, Outcome 4 Oedema improvement.

Comparison 30 Oral heparansulphate versus oral sulodexide, Outcome 5 Trophism improvement.

Comparison 31 Oxyphenbutazone versus placebo, Outcome 1 Tenderness improvement.

Comparison 32 Vitamin K antagonist (VKA) plus elastic compression stockings (ECS) versus ECS alone, Outcome 1 Venous thromboembolism.

Comparison 32 Vitamin K antagonist (VKA) plus elastic compression stockings (ECS) versus ECS alone, Outcome 2 Extension or recurrence (or both) of superficial thrombophlebitis.

Comparison 33 Stripping plus elastic compression stockings (ECS) versus ECS alone, Outcome 1 Venous thromboembolism.

Comparison 33 Stripping plus elastic compression stockings (ECS) versus ECS alone, Outcome 2 Extension or recurrence (or both) of superficial thrombophlebitis.

Comparison 34 Enzyme therapy versus placebo, Outcome 1 Pain reduction.

Comparison 34 Enzyme therapy versus placebo, Outcome 2 Responders.

Comparison 35 Desmin intramuscular (im) 200 versus desmin 100, Outcome 1 Adverse events.

Comparison 35 Desmin intramuscular (im) 200 versus desmin 100, Outcome 2 Adverse drug reactions.

Comparison 36 Desmin subcutaneous (sc) 2 × 100 versus desmin 100, Outcome 1 Adverse events.

Comparison 36 Desmin subcutaneous (sc) 2 × 100 versus desmin 100, Outcome 2 Adverse drug reactions.

Comparison 37 Prophylactic low molecular weight heparin (LMWH) plus elastic compression stockings (ECS) versus prophylactic LMWH, Outcome 1 Pain (VAS, cm) at 3 weeks.

Comparison 37 Prophylactic low molecular weight heparin (LMWH) plus elastic compression stockings (ECS) versus prophylactic LMWH, Outcome 2 Skin erythema (cm2) at 3 weeks.

Comparison 37 Prophylactic low molecular weight heparin (LMWH) plus elastic compression stockings (ECS) versus prophylactic LMWH, Outcome 3 SF‐36 physical score at 3 weeks.
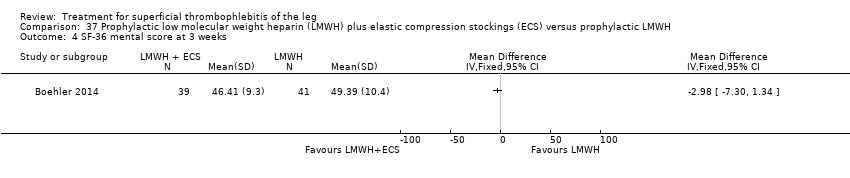
Comparison 37 Prophylactic low molecular weight heparin (LMWH) plus elastic compression stockings (ECS) versus prophylactic LMWH, Outcome 4 SF‐36 mental score at 3 weeks.
| Fondaparinux compared to placebo for superficial thrombophlebitis of the leg | ||||||
| Patient or population: people with ST of the leg | ||||||
| Outcomes | Illustrative comparative risks* (95% CI) | Relative effect | No of participants | Quality of the evidence | Comments | |
| Assumed risk | Corresponding risk | |||||
| Placebo | Fondaparinux | |||||
| Symptomatic VTE | 13 per 1000 | 2 per 1000 | RR 0.15 | 3002 | ⊕⊕⊕⊝ | ‐ |
| Major bleeding | 1 per 1000 | 1 per 1000 | RR 0.99 | 2987 | ⊕⊕⊕⊝ | ‐ |
| Extension of ST | 34 per 1000 | 3 per 1000 | RR 0.08 | 3002 | ⊕⊕⊕⊝ | ‐ |
| Recurrence of ST | 16 per 1000 | 3 per 1000 | RR 0.21 | 3002 | ⊕⊕⊕⊝ | ‐ |
| Mortality | 1 per 1000 | 1 per 1000 | RR 2 | 3002 | ⊕⊕⊕⊝ | ‐ |
| Minor bleeding | 4 per 1000 | 6 per 1000 | RR 1.49 | 2987 | ⊕⊕⊕⊝ | ‐ |
| Adverse effects of treatment | 33 per 1000 | 37 per 1000 | RR 1.13 | 2987 | ⊕⊕⊕⊝ | ‐ |
| *The basis for the assumed risk (e.g. the median control group risk across studies) is provided in footnotes. The corresponding risk (and its 95% confidence interval) is based on the assumed risk in the comparison group and the relative effect of the intervention (and its 95% CI). | ||||||
| GRADE Working Group grades of evidence | ||||||
| 1Evidence downgraded one level for imprecision due to a low number of events. | ||||||
| Prophylactic LMWH versus placebo for superficial thrombophlebitis of the leg | ||||||
| Patient or population: people with ST of the leg | ||||||
| Outcomes | Illustrative comparative risks* (95% CI) | Relative effect | No of participants | Quality of the evidence | Comments | |
| Assumed risk | Corresponding risk | |||||
| Placebo | Prophylactic LMWH | |||||
| Symptomatic VTE | 45 per 1000 | 54 per 1000 | RR 1.22 | 222 | ⊕⊕⊝⊝ | ‐ |
| Major bleeding | See comment | See comment | Not estimable | 222 | ⊕⊕⊝⊝ | 0 episodes of major bleeding |
| Extension or recurrence (or both) of ST | 330 per 1000 | 145 per 1000 | RR 0.44 | 222 | ⊕⊕⊝⊝ | ‐ |
| Mortality | See comment | See comment | See comment | ‐ | See comment | Data not available |
| Minor bleeding | See comment | See comment | See comment | ‐ | See comment | Data not available |
| Adverse effects of treatment | See comment | See comment | See comment | ‐ | See comment | Data not available |
| *The basis for the assumed risk (e.g. the median control group risk across studies) is provided in footnotes. The corresponding risk (and its 95% confidence interval) is based on the assumed risk in the comparison group and the relative effect of the intervention (and its 95% CI). | ||||||
| GRADE Working Group grades of evidence | ||||||
| 1Evidence downgraded one level due to unclear random sequence generation and incomplete outcome data. | ||||||
| Therapeutic LMWH versus placebo for superficial thrombophlebitis of the leg | ||||||
| Patient or population: people with ST of the leg | ||||||
| Outcomes | Illustrative comparative risks* (95% CI) | Relative effect | No of participants | Quality of the evidence | Comments | |
| Assumed risk | Corresponding risk | |||||
| Placebo | Therapeutic LMWH | |||||
| Symptomatic VTE | 45 per 1000 | 38 per 1000 (10 to 137) | RR 0.85 | 218 | ⊕⊕⊝⊝ | ‐ |
| Major bleeding | See comment | See comment | Not estimable | 218 | ⊕⊕⊝⊝ | No episodes of major bleeding |
| Extension or recurrence (or both) of ST | 330 per 1000 | 152 per 1000 (89 to 254) | RR 0.46 | 218 | ⊕⊕⊝⊝ | ‐ |
| Mortality | See comment | See comment | See comment | ‐ | See comment | Data not available |
| Minor bleeding | See comment | See comment | See comment | ‐ | See comment | Data not available |
| Adverse effects of treatment | See comment | See comment | See comment | ‐ | See comment | Data not available |
| *The basis for the assumed risk (e.g. the median control group risk across studies) is provided in footnotes. The corresponding risk (and its 95% confidence interval) is based on the assumed risk in the comparison group and the relative effect of the intervention (and its 95% CI). | ||||||
| GRADE Working Group grades of evidence | ||||||
| 1Evidence downgraded one level due to an unclear random sequence generation and incomplete outcome data. | ||||||
| NSAIDs versus placebo for superficial thrombophlebitis of the leg | ||||||
| Patient or population: people with superficial thrombophlebitis of the leg | ||||||
| Outcomes | Illustrative comparative risks* (95% CI) | Relative effect | No of participants | Quality of the evidence | Comments | |
| Assumed risk | Corresponding risk | |||||
| Placebo | NSAIDs | |||||
| Symptomatic VTE | 45 per 1000 | 41 per 1000 | RR 0.91 | 211 | ⊕⊕⊝⊝ | ‐ |
| Major bleeding | See comment | See comment | Not estimable | 211 | ⊕⊕⊝⊝ | 0 episodes of major bleeding |
| Extension or recurrence (or both) of ST | 330 per 1000 | 152 per 1000 | RR 0.46 | 211 | ⊕⊕⊝⊝ | ‐ |
| Mortality | See comment | See comment | See comment | ‐ | See comment | Data not available |
| Minor bleeding | See comment | See comment | See comment | ‐ | See comment | Data not available |
| Adverse effects of treatment | See comment | See comment | See comment | ‐ | See comment | Data not available |
| *The basis for the assumed risk (e.g. the median control group risk across studies) is provided in footnotes. The corresponding risk (and its 95% confidence interval) is based on the assumed risk in the comparison group and the relative effect of the intervention (and its 95% CI). | ||||||
| GRADE Working Group grades of evidence | ||||||
| 1Evidence downgraded one level due to an unclear random sequence generation and incomplete outcome data. | ||||||
| Outcome or subgroup title | No. of studies | No. of participants | Statistical method | Effect size |
| 1 Pulmonary embolism Show forest plot | 1 | Risk Ratio (M‐H, Fixed, 95% CI) | Totals not selected | |
| 2 Deep vein thrombosis Show forest plot | 1 | Risk Ratio (M‐H, Fixed, 95% CI) | Totals not selected | |
| 3 Deep vein thrombosis or pulmonary embolism Show forest plot | 1 | Risk Ratio (M‐H, Fixed, 95% CI) | Totals not selected | |
| 4 Extension of superficial thrombophlebitis Show forest plot | 1 | Risk Ratio (M‐H, Fixed, 95% CI) | Totals not selected | |
| 5 Recurrence of superficial thrombophlebitis Show forest plot | 1 | Risk Ratio (M‐H, Fixed, 95% CI) | Totals not selected | |
| 6 Mortality Show forest plot | 1 | Risk Ratio (M‐H, Fixed, 95% CI) | Totals not selected | |
| 7 Major bleeding Show forest plot | 1 | Risk Ratio (M‐H, Fixed, 95% CI) | Totals not selected | |
| 8 Clinically relevant non‐major bleeding Show forest plot | 1 | Risk Ratio (M‐H, Fixed, 95% CI) | Totals not selected | |
| 9 Minor bleeding Show forest plot | 1 | Risk Ratio (M‐H, Fixed, 95% CI) | Totals not selected | |
| 10 Arterial thromboembolic complication Show forest plot | 1 | Risk Ratio (M‐H, Fixed, 95% CI) | Totals not selected | |
| 11 Adverse effects of treatment Show forest plot | 1 | Risk Ratio (M‐H, Fixed, 95% CI) | Totals not selected | |
| 12 Non‐fatal serious adverse event Show forest plot | 1 | Risk Ratio (M‐H, Fixed, 95% CI) | Totals not selected | |
| Outcome or subgroup title | No. of studies | No. of participants | Statistical method | Effect size |
| 1 Pulmonary embolism Show forest plot | 1 | Risk Ratio (M‐H, Fixed, 95% CI) | Totals not selected | |
| 2 Deep vein thrombosis Show forest plot | 1 | Risk Ratio (M‐H, Fixed, 95% CI) | Totals not selected | |
| 3 Deep vein thrombosis or pulmonary embolism Show forest plot | 1 | Risk Ratio (M‐H, Fixed, 95% CI) | Totals not selected | |
| 4 Extension of superficial thrombophlebitis Show forest plot | 1 | Risk Ratio (M‐H, Fixed, 95% CI) | Totals not selected | |
| 5 Recurrence of superficial thrombophlebitis Show forest plot | 1 | Risk Ratio (M‐H, Fixed, 95% CI) | Totals not selected | |
| 6 Mortality Show forest plot | 1 | Risk Ratio (M‐H, Fixed, 95% CI) | Totals not selected | |
| 7 Major bleeding Show forest plot | 1 | Risk Ratio (M‐H, Fixed, 95% CI) | Totals not selected | |
| 8 Clinically relevant non‐major bleeding Show forest plot | 1 | Risk Ratio (M‐H, Fixed, 95% CI) | Totals not selected | |
| 9 Minor bleeding Show forest plot | 1 | Risk Ratio (M‐H, Fixed, 95% CI) | Totals not selected | |
| 10 Serious adverse events Show forest plot | 1 | Risk Ratio (M‐H, Fixed, 95% CI) | Totals not selected | |
| 11 Adverse effects of treatment Show forest plot | 1 | Risk Ratio (M‐H, Fixed, 95% CI) | Totals not selected | |
| Outcome or subgroup title | No. of studies | No. of participants | Statistical method | Effect size |
| 1 Venous thromboembolism end‐of‐treatment Show forest plot | 1 | Risk Ratio (M‐H, Fixed, 95% CI) | Totals not selected | |
| 2 Venous thromboembolism 3‐month follow‐up Show forest plot | 1 | Risk Ratio (M‐H, Fixed, 95% CI) | Totals not selected | |
| 3 Extension or recurrence (or both) of superficial thrombophlebitis Show forest plot | 1 | Risk Ratio (M‐H, Fixed, 95% CI) | Totals not selected | |
| 4 Major bleeding Show forest plot | 1 | Risk Ratio (M‐H, Fixed, 95% CI) | Totals not selected | |
| 5 Heparin‐induced thrombocytopenia Show forest plot | 1 | Risk Ratio (M‐H, Fixed, 95% CI) | Totals not selected | |
| Outcome or subgroup title | No. of studies | No. of participants | Statistical method | Effect size |
| 1 Venous thromboembolism end‐of‐treatment Show forest plot | 1 | Risk Ratio (M‐H, Fixed, 95% CI) | Totals not selected | |
| 2 Venous thromboembolism 3‐month follow‐up Show forest plot | 1 | Risk Ratio (M‐H, Fixed, 95% CI) | Totals not selected | |
| 3 Symptomatic deep vein thrombosis end‐of‐treatment Show forest plot | 1 | Risk Ratio (M‐H, Fixed, 95% CI) | Totals not selected | |
| 4 Symptomatic deep vein thrombosis 3‐month follow‐up Show forest plot | 1 | Risk Ratio (M‐H, Fixed, 95% CI) | Totals not selected | |
| 5 Extension of superficial thrombophlebitis 3‐month follow‐up Show forest plot | 1 | Risk Ratio (M‐H, Fixed, 95% CI) | Totals not selected | |
| 6 Recurrence of superficial thrombophlebitis 3‐month follow‐up Show forest plot | 1 | Risk Ratio (M‐H, Fixed, 95% CI) | Totals not selected | |
| Outcome or subgroup title | No. of studies | No. of participants | Statistical method | Effect size |
| 1 Symptomatic venous thromboembolism Show forest plot | 1 | Risk Ratio (M‐H, Fixed, 95% CI) | Totals not selected | |
| 2 Symptomatic pulmonary embolism Show forest plot | 1 | Risk Ratio (M‐H, Fixed, 95% CI) | Totals not selected | |
| 3 Superficial thrombophlebitis progression into deep vein thrombosis Show forest plot | 1 | Risk Ratio (M‐H, Fixed, 95% CI) | Totals not selected | |
| 4 Major bleeding Show forest plot | 1 | Risk Ratio (M‐H, Fixed, 95% CI) | Totals not selected | |
| Outcome or subgroup title | No. of studies | No. of participants | Statistical method | Effect size |
| 1 Superficial thrombophlebitis or venous thromboembolism Show forest plot | 1 | Risk Ratio (M‐H, Fixed, 95% CI) | Totals not selected | |
| 2 Venous thromboembolism Show forest plot | 2 | 238 | Risk Ratio (M‐H, Fixed, 95% CI) | 0.51 [0.10, 2.72] |
| 3 Superficial thrombophlebitis Show forest plot | 1 | Risk Ratio (M‐H, Fixed, 95% CI) | Totals not selected | |
| 4 Swelling disappearance Show forest plot | 1 | Risk Ratio (M‐H, Fixed, 95% CI) | Totals not selected | |
| 5 Tenderness disappearance Show forest plot | 1 | Risk Ratio (M‐H, Fixed, 95% CI) | Totals not selected | |
| 6 Pain disappearance Show forest plot | 1 | Risk Ratio (M‐H, Fixed, 95% CI) | Totals not selected | |
| 7 Pitting oedema disappearance Show forest plot | 1 | Risk Ratio (M‐H, Fixed, 95% CI) | Totals not selected | |
| 8 Collateral veins disappearance Show forest plot | 1 | Risk Ratio (M‐H, Fixed, 95% CI) | Totals not selected | |
| 9 Redness disappearance Show forest plot | 1 | Risk Ratio (M‐H, Fixed, 95% CI) | Totals not selected | |
| 10 Palpable cord disappearance Show forest plot | 1 | Risk Ratio (M‐H, Fixed, 95% CI) | Totals not selected | |
| 11 Major bleeding Show forest plot | 2 | 238 | Risk Ratio (M‐H, Fixed, 95% CI) | 0.0 [0.0, 0.0] |
| 12 Heparin‐induced thrombocytopenia Show forest plot | 2 | 238 | Risk Ratio (M‐H, Fixed, 95% CI) | 1.02 [0.07, 16.11] |
| Outcome or subgroup title | No. of studies | No. of participants | Statistical method | Effect size |
| 1 Venous thromboembolism Show forest plot | 1 | Risk Ratio (M‐H, Fixed, 95% CI) | Totals not selected | |
| 2 Extension or recurrence (or both) of superficial thrombophlebitis Show forest plot | 1 | Risk Ratio (M‐H, Fixed, 95% CI) | Totals not selected | |
| 3 Major bleeding Show forest plot | 1 | Risk Ratio (M‐H, Fixed, 95% CI) | Totals not selected | |
| 4 Complications Show forest plot | 1 | Risk Ratio (M‐H, Fixed, 95% CI) | Totals not selected | |
| Outcome or subgroup title | No. of studies | No. of participants | Statistical method | Effect size |
| 1 Venous thromboembolism Show forest plot | 2 | 278 | Risk Ratio (M‐H, Fixed, 95% CI) | 0.93 [0.24, 3.63] |
| 2 Extension or recurrence (or both) of superficial thrombophlebitis Show forest plot | 3 | 331 | Risk Ratio (M‐H, Fixed, 95% CI) | 1.01 [0.58, 1.78] |
| 3 Major bleeding Show forest plot | 3 | 335 | Risk Ratio (M‐H, Fixed, 95% CI) | 0.0 [0.0, 0.0] |
| 4 Heparin‐induced thrombocytopenia Show forest plot | 2 | 278 | Risk Ratio (M‐H, Fixed, 95% CI) | 0.0 [0.0, 0.0] |
| Outcome or subgroup title | No. of studies | No. of participants | Statistical method | Effect size |
| 1 Venous thromboembolism Show forest plot | 1 | Risk Ratio (M‐H, Fixed, 95% CI) | Totals not selected | |
| 2 Extension or recurrence (or both) of superficial thrombophlebitis Show forest plot | 1 | Risk Ratio (M‐H, Fixed, 95% CI) | Totals not selected | |
| 3 Major bleeding Show forest plot | 1 | Risk Ratio (M‐H, Fixed, 95% CI) | Totals not selected | |
| 4 Heparin‐induced thrombocytopenia Show forest plot | 1 | Risk Ratio (M‐H, Fixed, 95% CI) | Totals not selected | |
| Outcome or subgroup title | No. of studies | No. of participants | Statistical method | Effect size |
| 1 Venous thromboembolism end‐of‐treatment Show forest plot | 1 | Risk Ratio (M‐H, Fixed, 95% CI) | Totals not selected | |
| 2 Venous thromboembolism 3‐month follow‐up Show forest plot | 1 | Risk Ratio (M‐H, Fixed, 95% CI) | Totals not selected | |
| 3 Extension or recurrence (or both) of superficial thrombophlebitis Show forest plot | 1 | Risk Ratio (M‐H, Fixed, 95% CI) | Totals not selected | |
| 4 Major bleeding Show forest plot | 1 | Risk Ratio (M‐H, Fixed, 95% CI) | Totals not selected | |
| 5 Heparin‐induced thrombocytopenia Show forest plot | 1 | Risk Ratio (M‐H, Fixed, 95% CI) | Totals not selected | |
| Outcome or subgroup title | No. of studies | No. of participants | Statistical method | Effect size |
| 1 Pulmonary embolism Show forest plot | 1 | Risk Ratio (M‐H, Fixed, 95% CI) | Totals not selected | |
| 2 Deep vein thrombosis Show forest plot | 1 | Risk Ratio (M‐H, Fixed, 95% CI) | Totals not selected | |
| 3 Extension of superficial thrombophlebitis Show forest plot | 1 | Risk Ratio (M‐H, Fixed, 95% CI) | Totals not selected | |
| 4 Pain reduction Show forest plot | 1 | Mean Difference (IV, Fixed, 95% CI) | Totals not selected | |
| 5 Hyperaemia reduction Show forest plot | 1 | Mean Difference (IV, Fixed, 95% CI) | Totals not selected | |
| 6 Tenderness reduction Show forest plot | 1 | Mean Difference (IV, Fixed, 95% CI) | Totals not selected | |
| 7 Palpable cord reduction Show forest plot | 1 | Mean Difference (IV, Fixed, 95% CI) | Totals not selected | |
| 8 Mortality Show forest plot | 1 | Risk Ratio (M‐H, Fixed, 95% CI) | Totals not selected | |
| 9 Major bleeding Show forest plot | 1 | Risk Ratio (M‐H, Fixed, 95% CI) | Totals not selected | |
| 10 Minor bleeding Show forest plot | 1 | Risk Ratio (M‐H, Fixed, 95% CI) | Totals not selected | |
| 11 Adverse events Show forest plot | 1 | Risk Ratio (M‐H, Fixed, 95% CI) | Totals not selected | |
| Outcome or subgroup title | No. of studies | No. of participants | Statistical method | Effect size |
| 1 Venous thromboembolism Show forest plot | 1 | Risk Ratio (M‐H, Fixed, 95% CI) | Totals not selected | |
| 2 Extension or recurrence (or both) of superficial thrombophlebitis Show forest plot | 1 | Risk Ratio (M‐H, Fixed, 95% CI) | Totals not selected | |
| Outcome or subgroup title | No. of studies | No. of participants | Statistical method | Effect size |
| 1 Deep vein thrombosis Show forest plot | 2 | 83 | Risk Ratio (M‐H, Fixed, 95% CI) | 0.30 [0.03, 2.70] |
| 2 Participants with thrombus at 21 days Show forest plot | 1 | Risk Ratio (M‐H, Fixed, 95% CI) | Totals not selected | |
| 3 Allergic reaction or elevated sedimentation rate Show forest plot | 1 | Risk Ratio (M‐H, Fixed, 95% CI) | Totals not selected | |
| Outcome or subgroup title | No. of studies | No. of participants | Statistical method | Effect size |
| 1 Incidence of venous thromboembolism Show forest plot | 1 | Risk Ratio (M‐H, Fixed, 95% CI) | Totals not selected | |
| 2 Extension or recurrence (or both) of superficial thrombophlebitis Show forest plot | 1 | Risk Ratio (M‐H, Fixed, 95% CI) | Totals not selected | |
| 3 Major bleeding Show forest plot | 1 | Risk Ratio (M‐H, Fixed, 95% CI) | Totals not selected | |
| 4 Heparin‐induced thrombocytopenia Show forest plot | 1 | Risk Ratio (M‐H, Fixed, 95% CI) | Totals not selected | |
| Outcome or subgroup title | No. of studies | No. of participants | Statistical method | Effect size |
| 1 Deep vein thrombosis Show forest plot | 1 | Risk Ratio (M‐H, Fixed, 95% CI) | Totals not selected | |
| Outcome or subgroup title | No. of studies | No. of participants | Statistical method | Effect size |
| 1 Decrease in the analogue score Show forest plot | 1 | Mean Difference (IV, Fixed, 95% CI) | Totals not selected | |
| 2 Adverse effects of treatment Show forest plot | 1 | Risk Ratio (M‐H, Fixed, 95% CI) | Totals not selected | |
| Outcome or subgroup title | No. of studies | No. of participants | Statistical method | Effect size |
| 1 Venous thromboembolism Show forest plot | 1 | Risk Ratio (M‐H, Fixed, 95% CI) | Totals not selected | |
| 2 Extension or recurrence (or both) of superficial thrombophlebitis Show forest plot | 1 | Risk Ratio (M‐H, Fixed, 95% CI) | Totals not selected | |
| 3 Major bleeding Show forest plot | 1 | Risk Ratio (M‐H, Fixed, 95% CI) | Totals not selected | |
| 4 Heparin‐induced thrombocytopenia Show forest plot | 1 | Risk Ratio (M‐H, Fixed, 95% CI) | Totals not selected | |
| Outcome or subgroup title | No. of studies | No. of participants | Statistical method | Effect size |
| 1 Adverse effects Show forest plot | 1 | Risk Ratio (M‐H, Fixed, 95% CI) | Totals not selected | |
| Outcome or subgroup title | No. of studies | No. of participants | Statistical method | Effect size |
| 1 Gastric pain Show forest plot | 1 | Risk Ratio (M‐H, Fixed, 95% CI) | Totals not selected | |
| Outcome or subgroup title | No. of studies | No. of participants | Statistical method | Effect size |
| 1 Intolerance Show forest plot | 1 | Risk Ratio (M‐H, Fixed, 95% CI) | Totals not selected | |
| Outcome or subgroup title | No. of studies | No. of participants | Statistical method | Effect size |
| 1 Deep vein thrombosis Show forest plot | 1 | Risk Ratio (M‐H, Fixed, 95% CI) | Totals not selected | |
| Outcome or subgroup title | No. of studies | No. of participants | Statistical method | Effect size |
| 1 Deep vein thrombosis Show forest plot | 1 | Risk Ratio (M‐H, Fixed, 95% CI) | Totals not selected | |
| Outcome or subgroup title | No. of studies | No. of participants | Statistical method | Effect size |
| 1 Venous thromboembolism Show forest plot | 1 | Risk Ratio (M‐H, Fixed, 95% CI) | Totals not selected | |
| 2 Extension or recurrence (or both) of superficial thrombophlebitis Show forest plot | 1 | Risk Ratio (M‐H, Fixed, 95% CI) | Totals not selected | |
| Outcome or subgroup title | No. of studies | No. of participants | Statistical method | Effect size |
| 1 Cured or substantially better Show forest plot | 1 | Risk Ratio (M‐H, Fixed, 95% CI) | Totals not selected | |
| 2 Poor tolerability Show forest plot | 1 | Risk Ratio (M‐H, Fixed, 95% CI) | Totals not selected | |
| Outcome or subgroup title | No. of studies | No. of participants | Statistical method | Effect size |
| 1 Deep vein thrombosis Show forest plot | 1 | Risk Ratio (M‐H, Fixed, 95% CI) | Totals not selected | |
| Outcome or subgroup title | No. of studies | No. of participants | Statistical method | Effect size |
| 1 Redness disappearance Show forest plot | 1 | Risk Ratio (M‐H, Fixed, 95% CI) | Totals not selected | |
| 2 Pain disappearance Show forest plot | 1 | Risk Ratio (M‐H, Fixed, 95% CI) | Totals not selected | |
| 3 Disappearance of itching Show forest plot | 1 | Risk Ratio (M‐H, Fixed, 95% CI) | Totals not selected | |
| 4 Oedema improvement Show forest plot | 1 | Risk Ratio (M‐H, Fixed, 95% CI) | Totals not selected | |
| 5 Trophism improvement Show forest plot | 1 | Risk Ratio (M‐H, Fixed, 95% CI) | Totals not selected | |
| Outcome or subgroup title | No. of studies | No. of participants | Statistical method | Effect size |
| 1 Tenderness improvement Show forest plot | 1 | Risk Ratio (M‐H, Fixed, 95% CI) | Totals not selected | |
| Outcome or subgroup title | No. of studies | No. of participants | Statistical method | Effect size |
| 1 Venous thromboembolism Show forest plot | 1 | Risk Ratio (M‐H, Fixed, 95% CI) | Totals not selected | |
| 2 Extension or recurrence (or both) of superficial thrombophlebitis Show forest plot | 1 | Risk Ratio (M‐H, Fixed, 95% CI) | Totals not selected | |
| Outcome or subgroup title | No. of studies | No. of participants | Statistical method | Effect size |
| 1 Pain reduction Show forest plot | 1 | Mean Difference (IV, Fixed, 95% CI) | Totals not selected | |
| 2 Responders Show forest plot | 1 | Risk Ratio (M‐H, Fixed, 95% CI) | Totals not selected | |
| Outcome or subgroup title | No. of studies | No. of participants | Statistical method | Effect size |
| 1 Adverse events Show forest plot | 1 | Risk Ratio (M‐H, Fixed, 95% CI) | Totals not selected | |
| 2 Adverse drug reactions Show forest plot | 1 | Risk Ratio (M‐H, Fixed, 95% CI) | Totals not selected | |
| Outcome or subgroup title | No. of studies | No. of participants | Statistical method | Effect size |
| 1 Pain (VAS, cm) at 3 weeks Show forest plot | 1 | Mean Difference (IV, Fixed, 95% CI) | Totals not selected | |
| 2 Skin erythema (cm2) at 3 weeks Show forest plot | 1 | Mean Difference (IV, Fixed, 95% CI) | Totals not selected | |
| 3 SF‐36 physical score at 3 weeks Show forest plot | 1 | Mean Difference (IV, Fixed, 95% CI) | Totals not selected | |
| 4 SF‐36 mental score at 3 weeks Show forest plot | 1 | Mean Difference (IV, Fixed, 95% CI) | Totals not selected | |