Tratamiento con oxígeno hiperbárico para el accidente cerebrovascular isquémico agudo
Información
- DOI:
- https://doi.org/10.1002/14651858.CD004954.pub3Copiar DOI

- Base de datos:
-
- Cochrane Database of Systematic Reviews
- Versión publicada:
-
- 12 noviembre 2014see what's new
- Tipo:
-
- Intervention
- Etapa:
-
- Review
- Grupo Editorial Cochrane:
-
Grupo Cochrane de Accidentes cerebrovasculares
- Copyright:
-
- Copyright © 2014 The Cochrane Collaboration. Published by John Wiley & Sons, Ltd.
Cifras del artículo
Altmetric:
Citado por:
Autores
Contributions of authors
MH Bennett: conception of review, background, critical appraisal, hyperbaric medicine content expert, statistical analysis, co‐author for description of studies and discussion.
S Weibel: 2014 update of search, critical appraisal, clinical epidemiology expert, co‐author of 2014 update
J Wasiak: search strategy and execution, critical appraisal, systematic review expert, co‐author for description of studies and discussion.
C French: background to review, neurology context expert, critical appraisal.
P Kranke: critical appraisal, hyperbaric content expert, text editor.
A Schnabel: protocol development, critical appraisal, text editor.
Declarations of interest
None known. Dr Bennett is a hyperbaric physician who does not routinely treat people with stroke.
Acknowledgements
The review authors acknowledge the support and suggestions of Hazel Fraser and the editors of the Cochrane Stroke Group for assistance provided in preparation of this review. In particular, we acknowledge the help of Brenda Thomas in developing the search strategy used and of Daniel Rusyniak, Peter Langhorne, Ale Algra, Anne Rowat and Steff Lewis for extensive editorial assistance provided.
Version history
| Published | Title | Stage | Authors | Version |
| 2014 Nov 12 | Hyperbaric oxygen therapy for acute ischaemic stroke | Review | Michael H Bennett, Stephanie Weibel, Jason Wasiak, Alexander Schnabel, Christopher French, Peter Kranke | |
| 2005 Jul 20 | Hyperbaric oxygen therapy for acute ischaemic stroke | Review | Michael H Bennett, Jason Wasiak, Alexander Schnabel, Peter Kranke, Christopher French | |
| 2004 Apr 19 | Hyperbaric oxygen therapy for acute ischaemic stroke | Protocol | Michael H Bennett, Jason Wasiak, Christopher French, Peter Kranke, Alexander Schnabel | |
Keywords
MeSH
Medical Subject Headings (MeSH) Keywords
Medical Subject Headings Check Words
Female; Humans; Male;
PICO

Study flow diagram.

Methodological quality summary: review authors' judgements about each methodological quality item for each included study.
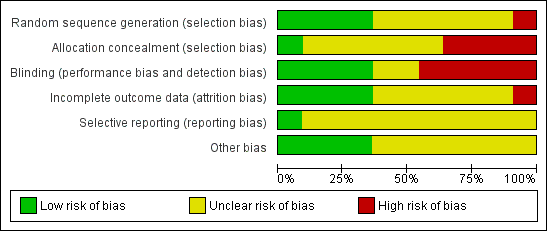
Methodological quality graph: review authors' judgements about each methodological quality item presented as percentages across all included studies.
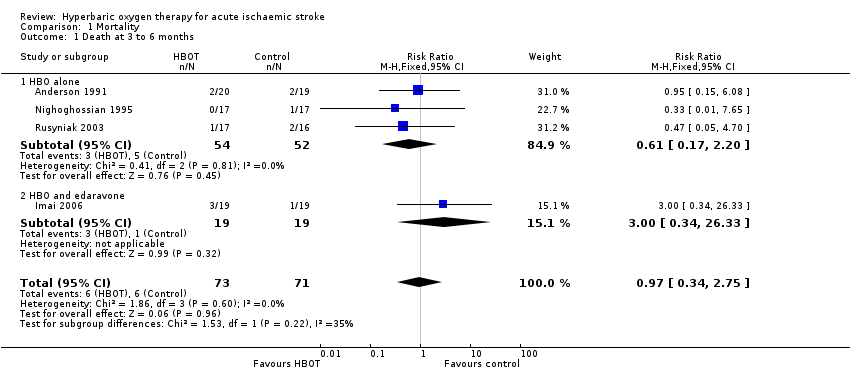
Comparison 1 Mortality, Outcome 1 Death at 3 to 6 months.
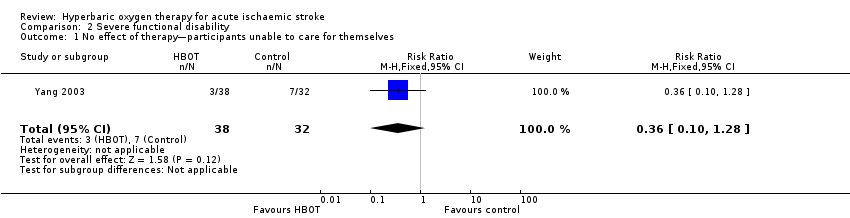
Comparison 2 Severe functional disability, Outcome 1 No effect of therapy—participants unable to care for themselves.

Comparison 3 Functional scales, Outcome 1 Mean neurological score at day 5.

Comparison 3 Functional scales, Outcome 2 Mean neurological score at week 6.
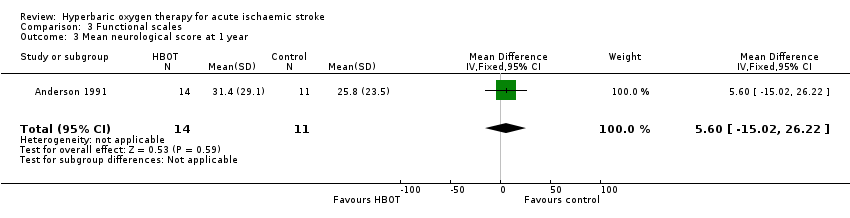
Comparison 3 Functional scales, Outcome 3 Mean neurological score at 1 year.

Comparison 3 Functional scales, Outcome 4 Mean Orgogozo score at 6 months.
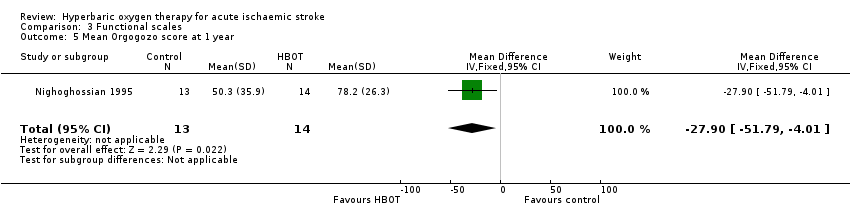
Comparison 3 Functional scales, Outcome 5 Mean Orgogozo score at 1 year.

Comparison 3 Functional scales, Outcome 6 Mean Trouillas score at 6 months.

Comparison 3 Functional scales, Outcome 7 Mean Trouillas score at 1 year.

Comparison 3 Functional scales, Outcome 8 Mean Rankin score at 6 months.

Comparison 3 Functional scales, Outcome 9 Mean Rankin score at 1 year.

Comparison 3 Functional scales, Outcome 10 Mean neurological recovery score at 12 months.
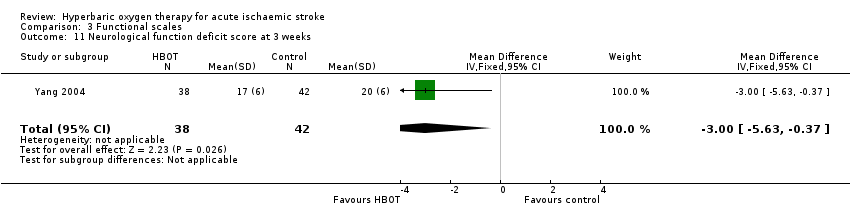
Comparison 3 Functional scales, Outcome 11 Neurological function deficit score at 3 weeks.
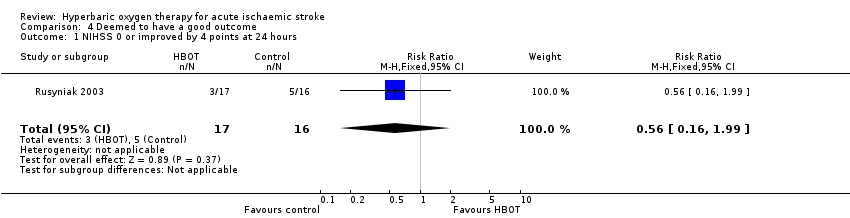
Comparison 4 Deemed to have a good outcome, Outcome 1 NIHSS 0 or improved by 4 points at 24 hours.
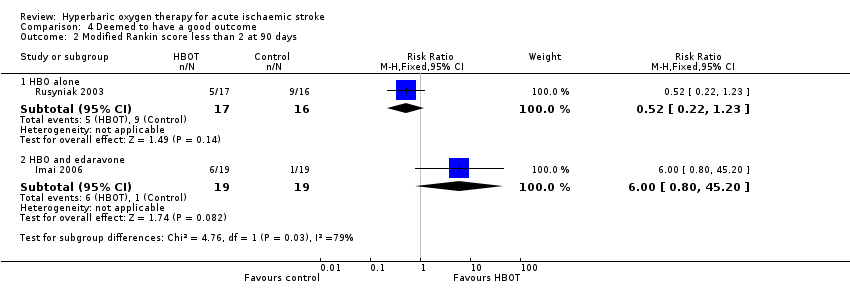
Comparison 4 Deemed to have a good outcome, Outcome 2 Modified Rankin score less than 2 at 90 days.
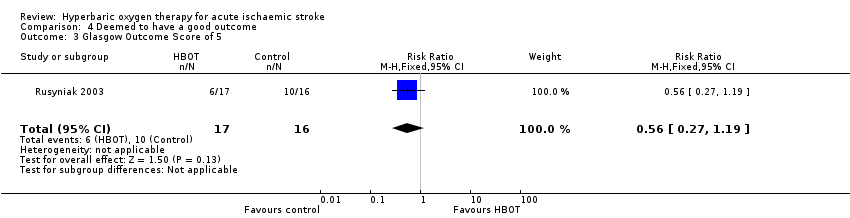
Comparison 4 Deemed to have a good outcome, Outcome 3 Glasgow Outcome Score of 5.

Comparison 4 Deemed to have a good outcome, Outcome 4 NIHSS less than 2.

Comparison 4 Deemed to have a good outcome, Outcome 5 Deemed cured and self‐caring.

Comparison 5 Activities of daily living, Outcome 1 Barthel Index 95 or 100 at 90 days.

Comparison 5 Activities of daily living, Outcome 2 Mean Barthel Index at 3 weeks.

Comparison 6 Mean volume of infarct on CT, Outcome 1 Mean volume of infarct at 4 months.

Comparison 7 Adverse effects of therapy, Outcome 1 Ear pain.
| Should hyperbaric oxygen therapy be used as an adjuvant therapy to routine therapy and rehabilitation for acute ischaemic stroke? | ||||||
| Patient or population: people with acute ischaemic stroke | ||||||
| Outcomes | Illustrative comparative risks* (95% CI) | Relative effect | Number of participants | Quality of the evidence | Comments | |
| Assumed risk | Corresponding risk | |||||
| Routine therapy and rehabilitation | Hyperbaric oxygen therapy used as adjuvant therapy | |||||
| Death | Low‐risk population | RR 0.97 | 144 | ⊕⊕⊕⊝ | ||
| 20 per 1000 | 19 per 1000 | |||||
| Medium‐risk population | ||||||
| 80 per 1000 | 78 per 1000 | |||||
| High‐risk population | ||||||
| 120 per 1000 | 116 per 1000 | |||||
| *The basis for the assumed risk (e.g. median control group risk across studies) is provided in footnotes. The corresponding risk (and its 95% confidence interval) is based on the assumed risk in the comparison group and the relative effect of the intervention (and its 95% CI). | ||||||
| GRADE Working Group grades of evidence. | ||||||
| a Small trials, with most not blinded to allocation. | ||||||
| Outcome or subgroup title | No. of studies | No. of participants | Statistical method | Effect size |
| 1 Death at 3 to 6 months Show forest plot | 4 | 144 | Risk Ratio (M‐H, Fixed, 95% CI) | 0.97 [0.34, 2.75] |
| 1.1 HBO alone | 3 | 106 | Risk Ratio (M‐H, Fixed, 95% CI) | 0.61 [0.17, 2.20] |
| 1.2 HBO and edaravone | 1 | 38 | Risk Ratio (M‐H, Fixed, 95% CI) | 3.0 [0.34, 26.33] |
| Outcome or subgroup title | No. of studies | No. of participants | Statistical method | Effect size |
| 1 No effect of therapy—participants unable to care for themselves Show forest plot | 1 | 70 | Risk Ratio (M‐H, Fixed, 95% CI) | 0.36 [0.10, 1.28] |
| Outcome or subgroup title | No. of studies | No. of participants | Statistical method | Effect size |
| 1 Mean neurological score at day 5 Show forest plot | 1 | 38 | Mean Difference (IV, Fixed, 95% CI) | 5.30 [‐7.47, 18.07] |
| 2 Mean neurological score at week 6 Show forest plot | 1 | 32 | Mean Difference (IV, Fixed, 95% CI) | 10.2 [‐8.48, 28.88] |
| 3 Mean neurological score at 1 year Show forest plot | 1 | 25 | Mean Difference (IV, Fixed, 95% CI) | 5.60 [‐15.02, 26.22] |
| 4 Mean Orgogozo score at 6 months Show forest plot | 1 | 27 | Mean Difference (IV, Fixed, 95% CI) | ‐18.20 [‐41.62, 5.22] |
| 5 Mean Orgogozo score at 1 year Show forest plot | 1 | 27 | Mean Difference (IV, Fixed, 95% CI) | ‐27.90 [‐51.79, ‐4.01] |
| 6 Mean Trouillas score at 6 months Show forest plot | 1 | 20 | Mean Difference (IV, Fixed, 95% CI) | ‐1.5 [‐4.16, 1.16] |
| 7 Mean Trouillas score at 1 year Show forest plot | 1 | 27 | Mean Difference (IV, Fixed, 95% CI) | ‐2.2 [‐4.25, ‐0.15] |
| 8 Mean Rankin score at 6 months Show forest plot | 1 | 27 | Mean Difference (IV, Fixed, 95% CI) | ‐0.60 [‐1.38, 0.18] |
| 9 Mean Rankin score at 1 year Show forest plot | 1 | 27 | Mean Difference (IV, Fixed, 95% CI) | ‐0.60 [‐1.38, 0.18] |
| 10 Mean neurological recovery score at 12 months Show forest plot | 1 | 17 | Mean Difference (IV, Fixed, 95% CI) | ‐2.2 [‐2.82, ‐1.58] |
| 11 Neurological function deficit score at 3 weeks Show forest plot | 1 | 80 | Mean Difference (IV, Fixed, 95% CI) | ‐3.0 [‐5.63, ‐0.37] |
| Outcome or subgroup title | No. of studies | No. of participants | Statistical method | Effect size |
| 1 NIHSS 0 or improved by 4 points at 24 hours Show forest plot | 1 | 33 | Risk Ratio (M‐H, Fixed, 95% CI) | 0.56 [0.16, 1.99] |
| 2 Modified Rankin score less than 2 at 90 days Show forest plot | 2 | Risk Ratio (M‐H, Fixed, 95% CI) | Subtotals only | |
| 2.1 HBO alone | 1 | 33 | Risk Ratio (M‐H, Fixed, 95% CI) | 0.52 [0.22, 1.23] |
| 2.2 HBO and edaravone | 1 | 38 | Risk Ratio (M‐H, Fixed, 95% CI) | 6.0 [0.80, 45.20] |
| 3 Glasgow Outcome Score of 5 Show forest plot | 1 | 33 | Risk Ratio (M‐H, Fixed, 95% CI) | 0.56 [0.27, 1.19] |
| 4 NIHSS less than 2 Show forest plot | 1 | 33 | Risk Ratio (M‐H, Fixed, 95% CI) | 0.59 [0.24, 1.42] |
| 5 Deemed cured and self‐caring Show forest plot | 1 | 70 | Risk Ratio (M‐H, Fixed, 95% CI) | 1.89 [0.64, 5.58] |
| Outcome or subgroup title | No. of studies | No. of participants | Statistical method | Effect size |
| 1 Barthel Index 95 or 100 at 90 days Show forest plot | 1 | 33 | Risk Ratio (M‐H, Fixed, 95% CI) | 1.20 [0.62, 2.32] |
| 2 Mean Barthel Index at 3 weeks Show forest plot | 1 | 80 | Mean Difference (IV, Fixed, 95% CI) | ‐20.0 [‐26.30, ‐13.70] |
| Outcome or subgroup title | No. of studies | No. of participants | Statistical method | Effect size |
| 1 Mean volume of infarct at 4 months Show forest plot | 1 | 27 | Mean Difference (IV, Fixed, 95% CI) | 20.20 [‐13.37, 53.77] |
| Outcome or subgroup title | No. of studies | No. of participants | Statistical method | Effect size |
| 1 Ear pain Show forest plot | 2 | 71 | Risk Ratio (M‐H, Fixed, 95% CI) | 4.89 [0.60, 39.66] |