Гипербарическая кислородная терапия (оксигенотерапия) при остром ишемическом инсульте
Abstract
Background
Most cases of stroke are caused by impairment of blood flow to the brain (ischaemia), which results in a reduction in available oxygen and subsequent cell death. It has been postulated that hyperbaric oxygen therapy (HBOT) may reduce the volume of brain that will die by greatly increasing available oxygen, and it may further improve outcomes by reducing brain swelling. Some centres are using HBOT routinely to treat people with stroke. This is an update of a Cochrane Review first published in 2005.
Objectives
To assess the effectiveness and safety of adjunctive HBOT in the treatment of people with acute ischaemic stroke.
Search methods
We searched the Cochrane Stroke Group Trials Register (last searched April 2014), the Cochrane Central Register of Controlled Trials (CENTRAL) (April 2014), MEDLINE (1966 to April 2014), EMBASE (1980 to April 2014), the Cumulative Index to Nursing and Allied Health Literature (CINAHL) (1982 to April 2014), the Database of Randomised Controlled Trials in Hyperbaric Medicine (DORCTIHM) (searched April 2014) and the reference lists of articles. We handsearched relevant publications and contacted researchers to identify additional published and unpublished studies.
Selection criteria
Randomised controlled trials (RCTs) that compared the effects of adjunctive HBOT versus those of no HBOT (no treatment or sham).
Data collection and analysis
Three review authors independently extracted data, assessed each trial for internal validity and resolved differences by discussion.
Main results
We included 11 RCTs involving 705 participants. The methodological quality of the trials varied. We could pool data only for case fatalities. No significant differences were noted in the case fatality rate at six months in those receiving HBOT compared with the control group (risk ratio (RR) 0.97, 95% confidence interval (CI) 0.34 to 2.75, P value 0.96). Four of 14 scale measures of disability and functional performance indicated improvement following HBOT, for example, the mean Trouillas Disability Scale score was lower with HBOT (mean difference (MD) 2.2 point reduction with HBOT, 95% CI 0.15 to 4.3, P value 0.04), and the mean Orgogozo Scale score was higher (MD 27.9 points, 95% CI 4.0 to 51.8, P value 0.02).
Authors' conclusions
We found no good evidence to show that HBOT improves clinical outcomes when applied during acute presentation of ischaemic stroke. Although evidence from the 11 RCTs is insufficient to provide clear guidelines for practice, the possibility of clinical benefit has not been excluded. Further research is required to better define the role of HBOT in this condition.
PICO
Резюме на простом языке
Гипербарическая кислородная терапия (оксигенотерапия) в лечении людей с острым ишемическим инсультом
Вопрос
Мы хотели сравнить безопасность и эффективность гипербарической кислородной терапии (гипербарической оксигенации ‐ ГБО) с отсутствием ГБО (либо отсутствие лечения, либо неэффективное вмешательство, предназначенное имитировать истинное лечение ‐ ГБО) для лечения людей, пострадавших от острого ишемического инсульта.
Актуальность
Гипербарическая кислородная терапия (ГБО) является лечением, предназначенным увеличить обеспечение кислородом части мозга, пораженной инсультом, и уменьшить степень необратимого повреждения. ГБО подразумавает дыхание людей чистым кислородом в специально сконструированной камере (например, такой, как камеры, используемые для глубоководных дайверов, с изгибами) в течение примерно полутора часов каждый день от 10 до 20 дней.
Характеристика исследований
Мы выявили 11 исследований, объединивших 705 участников, по апрель 2014 года. Во все исследования были включены взрослые участники (41% женщин), у которых случился острый инсульт в течение последних двух недель, хотя в большинство исследований участников включили в течение трех дней с момента инсульта. Все испытания оценивали ГБО в дополнение к стандартной практике лечения участников исследования. Большинство испытаний сообщили о числе смертей и о некой мере функциональной способности, хотя используемые для этого показатели значительно варьировали, что затрудняло сравнения между испытаниями. Периоды последующего наблюдения варьировали от 90 дней до одного года.
Основные результаты
Было изучено слишком малое число пациентов, чтобы сказать, уменьшает ли ГБО шансы смерти, и только три испытания позволили предположить улучшение по способности выполнять повседневные задачи. В целом, в настоящее время имеется мало доказательств, чтобы поддержать использование ГБО у людей с инсультом.
Качество доказательств
В целом, качество доказательств было умеренным, учитывая малое число участников и многообразие инструментов, использованных для оценки качества жизни и функциональной способности участников. Методология, использованная во многих из этих клинических испытаний, была описана плохо, что затрудняло полноценную оценку надежности доказательств. Мы могли объединить данные только по шансам смерти после инсульта, и хотя доказательства не позволяли предполагать, что ГБО уменьшала шансы смерти после инсульта, наша уверенность в этом результате относительно низкая. Мы не исключили возможность того, что ГБО может быть либо вредной, либо полезной.
Authors' conclusions
Summary of findings
| Should hyperbaric oxygen therapy be used as an adjuvant therapy to routine therapy and rehabilitation for acute ischaemic stroke? | ||||||
| Patient or population: people with acute ischaemic stroke | ||||||
| Outcomes | Illustrative comparative risks* (95% CI) | Relative effect | Number of participants | Quality of the evidence | Comments | |
| Assumed risk | Corresponding risk | |||||
| Routine therapy and rehabilitation | Hyperbaric oxygen therapy used as adjuvant therapy | |||||
| Death | Low‐risk population | RR 0.97 | 144 | ⊕⊕⊕⊝ | ||
| 20 per 1000 | 19 per 1000 | |||||
| Medium‐risk population | ||||||
| 80 per 1000 | 78 per 1000 | |||||
| High‐risk population | ||||||
| 120 per 1000 | 116 per 1000 | |||||
| *The basis for the assumed risk (e.g. median control group risk across studies) is provided in footnotes. The corresponding risk (and its 95% confidence interval) is based on the assumed risk in the comparison group and the relative effect of the intervention (and its 95% CI). | ||||||
| GRADE Working Group grades of evidence. | ||||||
| a Small trials, with most not blinded to allocation. | ||||||
Background
Description of the condition
Stroke may be defined as a sudden neurological deficit of presumed vascular origin (Bath 2000). It is both a leading cause of mortality worldwide, accounting for an estimated 4.4 million deaths in 1990 (Murray 1997), and a leading cause of disability. About one‐third of survivors require significant assistance in daily life at one year after the event (Bamford 1991; Bath 2000).
Stroke is divided into two broad subgroups: ischaemic (impairment of blood flow) and haemorrhagic (bleeding within the brain), with the former accounting for 73% to 86% of all cases (Sudlow 1997). On average, ischaemic stroke has a lower case fatality rate than haemorrhagic stroke (23% versus 62% at one year), and treatment differs for the two subgroups (Bamford 1991; Bath 2000). Therefore, early and accurate diagnosis is desirable. Because clinical assessment is unreliable in determining stroke type, neuroimaging (preferably using computerised tomography (CT) scan) is required for optimal management (Wardlaw 2004).
During a cerebral ischaemic event, neurological tissue suffers hypoxia. When hypoxia is prolonged, neurons lose their ability to maintain ionic homeostasis. Free oxygen radicals accumulate and degrade the cell membranes (Ikeda 1990; Siesjo 1989); irreversible changes result in unavoidable cell death. These changes may occur rapidly and before therapy can be instituted, but in some people the symptoms worsen gradually or in a step‐wise fashion over a matter of hours or days (Robertson 1989). This latter observation suggests that close management of haemodynamic, respiratory and metabolic factors designed to maintain oxygenation might be beneficial. Indeed, intensive stroke management protocols and antiplatelet therapy have been shown to positively influence the outcome (CASTCG 1997; ISTCG 1997; SUTC 2004).
Description of the intervention
Hyperbaric oxygen therapy (HBOT) is an adjunctive therapy that has been proposed for the treatment of people with ischaemic stroke (Hart 1971; Ingvar 1965). HBOT is the therapeutic administration of 100% oxygen at environmental pressures greater than 1.0 atmosphere absolute (ATA). Administration involves placing the patient in an airtight vessel, increasing pressure within that vessel and administering 100% oxygen for respiration. In this way, it is possible to deliver greatly increased partial pressure of oxygen to the tissues. Typically, treatments involve pressurisation to between 1.5 and 3.0 ATA for periods between 60 and 120 minutes, once or twice daily.
How the intervention might work
Potential benefits of HBOT include reversal of hypoxia through increased oxygen delivery and reduction of cerebral oedema (Hills 1999; Sukoff 1982), as well as several specific effects of hyperoxia, which include decreased lipid peroxidation, inhibition of leucocyte activation and restoration of the functional blood‐brain barrier (Mink 1995a; Mink 1995b; Thom 1993). It has been proposed that HBOT protects marginally viable brain (often termed 'the ischaemic penumbra') from further damage on reperfusion through these mechanisms, which act to regulate abnormal cellular metabolites (Badr 2001; Selman 2004). Conversely, oxygen in high doses may increase oxidative stress through the production of oxygen free‐radical species and is potentially toxic (Yusa 1987). Indeed, the brain is particularly at risk (Clark 1982). For this reason, it is appropriate to postulate that in some people with stroke, HBOT may do more harm than good.
Therefore, HBOT is associated with some risk of adverse effects, including damage to the ears, sinuses and lungs from the effects of pressure, temporary worsening of shortsightedness, claustrophobia and oxygen poisoning. Although serious adverse events are rare, HBOT cannot be regarded as an entirely benign intervention.
Why it is important to do this review
Despite 40 years of interest in the delivery of HBOT for people with stroke, little comparative evidence of effectiveness can be found. Most reports have described single or multiple cases, and the largest study includes a series of 122 cases reported in 1980 (Neubauer 1980). A review of these studies revealed that more than half of cases improved clinically or electrophysiologically with HBOT and concluded that a case could be made for setting up controlled studies (Nighoghossian 1997).
This is an update of a Cochrane review first published in 2005.
Objectives
To assess the effectiveness and safety of adjunctive HBOT in the treatment of people with acute ischaemic stroke.
Methods
Criteria for considering studies for this review
Types of studies
We included all randomised controlled trials (RCTs) that compared the effects of adjunctive HBOT versus those of no HBOT (no treatment or sham).
Types of participants
We focused on participants of any age or sex with acute ischaemic stroke. Acute ischaemic stroke was defined as a sudden neurological deficit of presumed vascular origin for which haemorrhage had been excluded by CT or magnetic resonance imaging (MRI) within 14 days of enrolment in the trial.
Types of interventions
Trials comparing standard treatment regimens designed to promote recovery after acute ischaemic stroke, including intensive combined therapies, with and without HBOT.
Studies were eligible for inclusion if HBOT was administered in a compression chamber at pressures between 1.5 ATA and 3.0 ATA for treatment times between 30 minutes and 120 minutes, at least once daily.
Types of outcome measures
Studies were eligible for inclusion in the meta‐analysis if they reported any of the following outcome measures. Because of variations in clinical practice, we divided timing and recording of outcomes into three stages for analysis: early (immediately after the treatment course), medium term (four to eight weeks after treatment) and longer term (at the end of scheduled follow‐up). Several assessment scales were used to quantify trial outcomes. We have taken information concerning these scales from the Internet Stroke Centre Stroke Trials Directory at http://www.strokecenter.org/trials/scales/index.htm.
Primary outcomes
-
Case fatality rate.
-
Severe functional disability rate (or death), defined as 'drowsy/stuporous/unconscious or unable to feed/dress independently.' Care was taken to ensure that death was included as a bad outcome when data were extracted.
Secondary outcomes
-
Functional status scale scores (e.g. National Institutes of Health Stroke Scale (NIHSS), Rankin Score, Glasgow Outcome Scale).
-
Deemed to have a good functional outcome assessed as a binary outcome using any of the above scales.
-
Activities of daily living (ADLs) (e.g. the Barthel Index).
-
CT or MRI estimate of infarct size or volume.
-
Adverse events following HBOT, such as proportion of participants with visual disturbance (short and long term), barotrauma (aural, sinus, pulmonary short and long term) and oxygen toxicity (short term); other recorded adverse effects were reported and discussed.
Search methods for identification of studies
See the 'Specialized register' section in the Cochrane Stroke Group module.
Electronic searches
We searched the Cochrane Stroke Group Trials Register, which was last searched by the Managing Editor on 3 April 2014. In addition, we searched MEDLINE (1966 to April 2014; Appendix 1), EMBASE (1980 to April 2014; Appendix 2) and the Cumulative Index to Nursing and Allied Health Literature (CINAHL) (1982 to April 2014; Appendix 3), as well as the Cochrane Central Register of Controlled Trials (CENTRAL) (8 April 2014; Appendix 4). We adapted the MEDLINE search strategy for the other databases. We applied no language restrictions. We also searched the Database of Randomised Controlled Trials in Hyperbaric Medicine (DORCTIHM) (from inception to April 2014) (Bennett 2004). The DORCTIHM database was compiled through an unfocused search of PubMed using 'hyperbaric oxygenation' as a medical subject heading (MeSH) term, handsearching of primarily hyperbaric journals (see below) since first publication and checking of references in identified RCTs. This site is now interactive and receives citations for formal review from healthcare professionals in the field.
Searching other resources
-
We searched the reference lists of articles and contacted researchers in an effort to identify additional published and unpublished studies.
-
We handsearched the following relevant publications.
-
Hyperbaric textbooks (Jain 1999; Jain 2009; Kindwall 1999; Mathieu 2006; Oriani 1996).
-
Journals (Undersea and Hyperbaric Medicine 1992 to 2014, Hyperbaric Medicine Review 1986 to 1992, South Pacific Underwater Medicine Society (SPUMS) Journal 1973 to 2007, European Journal of Hyperbaric Medicine 1998 to 2007, Diving and Hyperbaric Medicine 2007 to 2014 and Aviation, Space and Environmental Medicine Journal 1980 to 2014).
-
Conference proceedings (Undersea and Hyperbaric Medical Society, SPUMS, European Undersea and Baromedical Society, International Congress of Hyperbaric Medicine) published from 1980 to 2014.
-
Data collection and analysis
Trial identification
Three review authors (MB, JW and PK) scanned records identified through the electronic searches and excluded obviously irrelevant studies. Two review authors (MB and AS) assessed the remaining records and retrieved the full‐text articles of all potentially relevant studies. From these, three review authors (MB, AS and PK) selected studies for inclusion based on the criteria described previously. In all instances, review authors resolved differences of opinion by discussion.
Data extraction
Three review authors (MB, AS and CF) independently extracted data from the studies using standardised forms developed for this review. We contacted the authors of primary studies to request further information when data were missing or incomplete. Review authors resolved all differences by discussion.
Quality assessment
We assessed study quality using the 'Risk of bias' tables for each individual study, as described in the Cochrane Handbook for Systematic Reviews of Interventions (Higgins 2011); the results are presented both descriptively and graphically.
Analyses
We used a fixed‐effect model when no evidence of significant heterogeneity between studies was found and planned to use a random‐effects model when such heterogeneity was likely (DerSimonian 1986). We considered the appropriateness of meta‐analysis in the presence of significant clinical or statistical heterogeneity. We assessed statistical heterogeneity using the I2 statistic. We planned to explore heterogeneity and to perform subgroup analyses if appropriate.
For proportions (dichotomous outcomes), we used risk ratio (RR). We converted continuous data to mean differences (MDs) using the inverse variance method and calculated an overall MD. We planned to test publication bias using funnel plots; however, this was not appropriate given the small number of studies found.
We planned to perform subgroup analysis by calculating the RR or MD in each subgroup and examining 95% confidence intervals (CIs). Non‐overlap in intervals would have been taken to indicate a statistically significant difference between subgroups; however, subgroup analysis was not appropriate given the available data.
All analyses were performed on an intention‐to‐treat basis, if possible, and if not possible, this was clearly stated.
We intended to perform sensitivity analyses for missing data and study quality, if appropriate.
Missing data
We had planned to employ sensitivity analyses by using different approaches to imputing missing data. However, no binary outcomes involved incomplete data, and this analysis was not required.
Study quality
If appropriate, we had planned to conduct a sensitivity analysis by study quality based on the presence or absence of a reliable random allocation method, concealment of allocation and blinding of participants or outcome assessors.
If appropriate data were found, we planned to consider subgroup analysis based on the following.
-
Time elapsed between stroke and institution of HBOT.
-
Dose of oxygen received (pressure less than 2.0 ATA versus greater than or equal to 2.0 ATA), time of treatment (less than 60 minutes versus 60 minutes or longer) and length of treatment course (fewer than five sessions versus five or more sessions).
-
Nature of comparative treatment modalities.
-
Volume of cerebral infarction as measured by baseline presentation of CT imaging.
Results
Description of studies
We identified a total of 962 references in 2004, a further 104 by September 2008 and a further 396 by April 2014, yielding a total of 1462 citations. Following elimination of duplicates, independent scrutiny of the titles and abstracts revealed 40 potentially relevant articles. One was an ongoing trial first announced in 2008 (Michalski 2008), but our attempts to contact the study authors were unsuccessful, and this trial may have been abandoned. Following review of the full text of the remaining 39 articles, we excluded 18 further trials because they were not RCTs, five because they gave inappropriate treatment, four because they included inappropriate participants (with long‐standing or haemorrhagic stroke) and one review article (see Characteristics of excluded studies and Figure 1). The remaining 11 randomised trials formed the basis of this review and are described below. Seven trials are now included in the quantitative review.

Study flow diagram.
Between the previous search in September 2008 and the most recent search in April 2014, we found 396 new citations, of which only one was a new trial, which contributed 38 further participants to the quantitative analysis (Imai 2006). In this review, we also included four relevant trials that did not report on our outcomes of interest and so did not contribute to the quantitative review. Together these trials enrolled a total of 334 participants.
In total, the 11 included trials enrolled 705 participants (361 into trials contributing to the quantitative review and 344 into trials contributing to the qualitative review only).
Anderson 1991 enrolled 39 non‐pregnant participants (sex distribution was not given) between 20 and 90 years of age, presenting with a neurological deficit and score greater than 20 on a scale devised for this trial (0 = no deficit, 100 = completely unresponsive). The deficit was presumed to be due to ischaemic cerebral infarction in the brain region perfused by one carotid artery and to have occurred during the preceding two weeks. Once enrolled, all participants received standard care in a neurological intensive care unit and 400 mg of vitamin A daily. Those randomly assigned to the HBOT arm received 100% oxygen (for 60 minutes at 1.5 ATA) every eight hours to a total of 15 sessions, and those in the control arm received a sham treatment of breathing air (at 1.5 ATA) on the same schedule. Changes in the graded neurological examination performed on admission were used to assess neurological outcomes at day five, week six and year one. Infarct volume was estimated by CT at four months, and deaths were recorded.
Nighoghossian 1995 enrolled 34 participants (21 men), between 20 and 75 years of age, presenting with a neurological deficit highly suggestive of middle cerebral artery (MCA) occlusion. All participants presented within 24 hours of the cerebral event and with a score less than 80 on the Orgogozo Functional Scale (0 = completely unresponsive, 100 = no deficit). Once enrolled, all participants received supportive care including low‐dose heparin (10,000 units divided into two doses daily), nursing care, rehabilitation, speech therapy and occupational therapy. Those allocated to HBOT received 100% oxygen (in a monoplace chamber at 1.5 ATA daily for 40 minutes for 10 days), while controls received sham therapy (at 1.2 ATA) of breathing air on the same schedule. Outcomes included case fatality rate and changes on three healthcare scales (acute assessment scale: Orgogozo (100 to 0), Trouillas (0 to 10) and functional assessment scale (Rankin Scale)) that were used to assess neurological outcomes at six months and at one year.
Sansone 1997 has been presented only in abstract format. This trial enrolled 17 participants with an average age of 62 years who had presented for therapy within 24 hours of CT scanning, showing a cerebral ischaemic event in the middle or anterior cerebral arterial territory. Study participants included 11 males. The degree of neurological deficit was not clear, although scores were provided in a table. Once enrolled, participants were randomly assigned by a method not stated to receive HBOT (1.5 to 1.8 ATA for 60 minutes daily for 8 to 10 days) or sham treatment of breathing air. A neurological recovery score (0 to 10) was used to assess outcomes at six and 12 months.
Rusyniak 2003 enrolled 33 participants (including 22 men) presenting to the emergency department within 24 hours of stroke onset with a deficit on an acute impairment scale—the National Institutes of Health Stroke Scale (NIHSS)—of less than 23 (30 is maximum disability) and without evidence of haemorrhage on CT. Those randomly assigned to the HBOT arm received a single session (breathing 100% oxygen for 60 minutes in a monoplace chamber at 2.5 ATA), while those in the control arm received sham treatment (breathing oxygen at 1.14 ATA). Primary outcome measures included percentages of participants with improvement at 24 hours and at 90 days. Secondary measurements included complications of treatment and mortality at 90 days. Outcomes included case fatality rate; adverse effects of treatment and changes in the following: NIHSS score (at 24 hours and at 90 days); a functional assessment scale—the modified Rankin Scale (90 days); and two outcome scales—the Barthel Index of ADL (90 days) and the Glasgow Outcome Scale (90 days).
Yang 2003 enrolled 80 participants (43 men) with radiological or MRI evidence of ischaemic stroke within 72 hours of the event. These strokes occurred in a range of vascular territories. Participants were randomly assigned to receive HBOT at 2.0 ATA for 80 minutes daily, probably for 20 days, or a standard therapy that may have included a vasodilator, an anticoagulant or a 'nerve cell protectant.' The only outcome measure was a four‐point scale from 'cure' to 'no effect' that was measured at 21 days.
Yang 2004 enrolled 120 participants with radiological or MRI evidence of ischaemic stroke within 72 hours of the event; however 40 of these were randomly assigned to an arm that was not relevant to this review. The strokes were all 'first events,' associated with neurological deficits and during which the patient was conscious and co‐operative. Eighty participants were randomly assigned to HBOT at 2.0 ATA for 60 minutes daily for 20 days or to a standard treatment regimen that was not described in detail. Outcomes measured include degree of neurological dysfunction (scale not described), Fugl‐Meyer motor assessment score and Barthel Index of activities of daily living. The timing of these assessments was not stated.
Imai 2006 enrolled 38 adult participants with acute embolic stroke in the MCA territory within 48 hours of the event. Initial diagnosis was determined by neurological signs and was confirmed by MRI. Patients were excluded if they had received fibrinolytic therapy. All participants received standard care plus a free‐radical scavenger—edaravone 30 mg intravenously twice daily. In addition, the 19 participants in the HBOT group received 100% oxygen at 2.0 ATA for 60 minutes daily for 10 days. Reported outcomes included death, unfavourable outcomes by the Modified Rankin Scale (mRS), adverse events and median NIHSS scores—all at 90 days.
Trials included but not contributing to the quantitative review
Li 1998 enrolled 86 participants with cerebral infarction (time not stated but described as 'acute') and provided 'routine' therapy with 'Salvia Milirrhiza Co.' to both groups. The 43 participants assigned to the HBOT group received 10 daily treatments at 2 ATA breathing 100% oxygen for 120 minutes. The study authors reported cerebral blood flow, electroencephalography (EEG), haemorrheology and serum superoxide dismutase (SOD) before and after the intervention period but included no outcomes of interest for this review. EEG, cerebral blood flow and serum SOD were reported as improved in the HBOT group versus the control group (P value < 0.01). Haemorrheology was not significantly different.
Peng 2003 enrolled 60 participants with cerebral infarction within the previous seven days, and 30 were allocated to each arm of the study. All participants received 'standard pharmacological care,' while the HBOT group received 10 daily treatments at 2.3 ATA breathing 100% oxygen for 80 minutes. The study authors reported within‐group differences for several markers of free‐radical activity, including serum nitric oxide (NO), SOD and monoaldehyde (MDA) but did not directly compare groups. Levels of NO and SOD were significantly increased following HBOT, but not in the control group. Participants in the HBOT group had significantly improved scores on an undefined neurological deficit scale (HBOT 9 ± 8 versus 15 ± 9, t = ‐2.176, P value < 0.05). Researchers also reported improved 'clinical efficacy' in the HBOT group (HBOT 87% versus control 63%, x2 = 4.356, P value < 0.05).
Hong 2008 is an abstract only and has not been published in full. This trial enrolled 86 young inpatients with ischaemic stroke, but there are no further details. The cohort was randomised into two groups (method unknown), but the number of participants in each group is not given. One group received 'routine therapy' while the other received 'routine therapy and hyperbaric therapy'. Neither treatment arm was described. The authors reported the 'Nerve Function Deficit Score' (undefined) was improved in 70% in the HBOT group and 42.6% in the control group, that the effectiveness of treatment in the HBOT group was 81.4% compared with 35.9% in the control group, and that the total progress rate was 93% versus 60.5% in favour of the HBOT group. None of these outcomes were defined.
Zhao 2008 enrolled 112 adults admitted with an acute stroke involving the internal carotid artery territory and confirmed with CT or MRI within 24 hours. They were randomised by a method not described. Sixty‐two participants received routine therapy including anticoagulation, antiplatelet aggregation agents, cerebral vasodilators, reduction of intracranial pressure by dehydration, as well as supplementary rehabilitation exercise. Fifty participants received the same routine treatment plus HBOT for 60 minutes daily for 10 days at 2.0 ATA (plus a 30‐minute decompression). Serum levels of soluble intercellular adhesion molecule, soluble vascular cell adhesion molecule, soluble E‐selectin, and matrix metalloproteinase‐9 were significantly increased on admission and decreased over the study period in both groups. The decrease was significantly greater in the HBO group, compared with the routine treatment group (P value < 0.05 or P value < 0.01).
Risk of bias in included studies
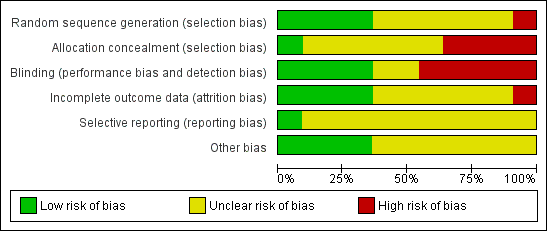
See the Characteristics of included studies table for further details. These trials varied in methodological quality, and only six provided full reports of completed trials in a peer‐reviewed publication. Risk of bias dimensions are presented for each included study in Figure 2 and Figure 3.

Methodological quality summary: review authors' judgements about each methodological quality item for each included study.

Methodological quality graph: review authors' judgements about each methodological quality item presented as percentages across all included studies.
Randomisation
Randomisation procedures were described in two trials ‐ Rusyniak 2003 (sealed envelopes) and Peng 2003 (coin toss) ‐ but not in the other nine trials. Allocation concealment was adequately described in Rusyniak 2003, but in the other 10 reports, it was not clear whether investigators were unable to predict the prospective group to which a participant would be allocated.
Participant baseline characteristics
All trials enrolled participants with clinical evidence of neurological deficit attributable to ischaemic stroke and lasting longer than 24 hours. Five trials specifically excluded haemorrhagic stroke with CT or MRI evidence before the time of enrolment (Imai 2006; Rusyniak 2003; Yang 2003; Yang 2004; Zhao 2008). Three trials enrolled participants within 24 hours of the cerebral event (Rusyniak 2003; Nighoghossian 1995; Sansone 1997), one trial within 48 hours (Imai 2006), two trials within 72 hours (Yang 2003; Yang 2004) and one trial within seven days (Peng 2003), and one trial accepted participants up to two weeks following the event (Anderson 1991). The extent and severity of deficit on enrolment were poorly described and difficult to compare across trials, given the different neurological and health status scales used to establish baseline status. Three trials specified the clinical appearance of deficits in an area supplied by one internal carotid artery (Anderson 1991; Nighoghossian 1995; Sansone 1997): Two trials specified the anterior cerebral artery territory (Anderson 1991; Imai 2006) and two the anterior or middle cerebral territory (Nighoghossian 1995; Sansone 1997); three studies did not specify the area (Rusyniak 2003; Yang 2003; Yang 2004). All trials enrolled both male and female adults. In total, 118 participants (41%) were female.
Blinding
Four trials utilised sham therapy to mask participants to HBOT (Anderson 1991; Nighoghossian 1995; Rusyniak 2003, Sansone 1997). Two trials blinded the investigators (Anderson 1991; Rusyniak 2003); one trial also specified outcome assessor blinding (Anderson 1991). No study author formally tested the success of the blinding strategy applied.
Participants lost to follow‐up
Nighoghossian 1995 reported a total of seven participants who were withdrawn from therapy (control group: four ‐ all because of worsening neurological status, with one dead at six‐month follow‐up; HBOT group: three ‐ one with worsening of neurological state, one with myocardial infarction and one with claustrophobia). Anderson 1991 lost a total of 12 participants to follow‐up at six months (control group: five ‐ two deaths, two unavailable and one refusal; HBOT group: seven ‐ two deaths, one unavailable, three refusals and one following a second stroke); Rusyniak 2003 lost seven participants to final follow‐up (control group: six ‐ two dead, four not explained; HBOT group: one dead). Yang 2003 reported a participant group of 80 but reported demographic and outcome data for only 70 participants—it is not clear whether this was an error or if 10 participants were lost to follow‐up. No comparisons of baseline characteristics were made between those lost to follow‐up and those remaining in the study.
Intention‐to‐treat analysis
Two trials performed intention‐to‐treat analyses as they reported inclusion of those lost to follow‐up or not completing the allocated therapy (Nighoghossian 1995; Rusyniak 2003). For mortality, one trial also used intention‐to‐treat; however, it is not clear if this approach was used for other outcomes (Anderson 1991).
Effects of interventions
We could pool data from only seven studies enrolling a total of 361 participants and for a limited number of clinically important outcomes. For most outcomes, we have been limited to a description of outcomes reported individually for each study.
Primary outcomes
Comparison 1. Death at three to six months
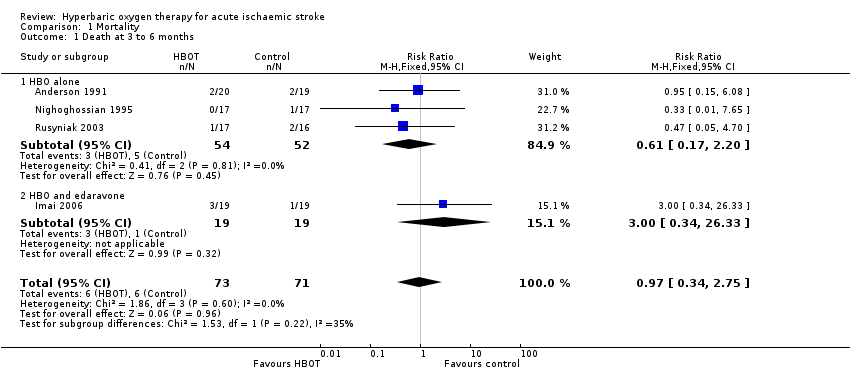
Data were available for four trials involving 144 participants (45% of the total participants in this review) (Anderson 1991; Imai 2006; Nighoghossian 1995; Rusyniak 2003; ). No significant differences in case fatality rates were noted (six deaths (8%) in those receiving HBOT versus six (8.5%) among those given sham therapy). The risk ratio (RR) of dying after receiving HBOT was 0.97 (95% CI 0.34 to 2.75, P value 0.96). Moderate heterogeneity between trials was indicated (I2 = 34.7%), which was explained by removal of the single trial testing the combination of HBOT and a free‐radical scavenger (edaravone) versus edaravone only. No participants were lost to follow‐up for this outcome (Analysis 1.1).
Comparison 2. No effect of therapy
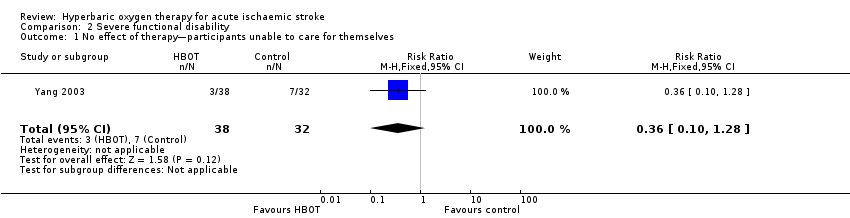
Only Yang 2003 presented data on this outcome, involving 70 participants (25% of the total). In the HBOT group, three of 38 participants (8%) were judged to have received 'no effect' from therapy and were unable to care for themselves, compared with seven of 32 cases (22%) in the control group. The risk ratio for a poor outcome with HBOT was 0.36 but was not statistically significant (95% CI 0.1 to 1.28, P value = 0.12) (Analysis 2.1).
Secondary outcomes
Comparison 3. Functional scales
Mean neurological assessment score at day five
Only Anderson 1991 reported this outcome. The mean score was lower (better outcome) in the control group (38.5 versus 43.8: MD 5.3 points, 95% CI ‐7.5 to 18.1, P value 0.42) (Analysis 3.1).
Mean neurological assessment score at week six
Only Anderson 1991 reported this outcome. The mean score was lower (better outcome) in the control group (28.3 versus 38.5: MD 10.2 points, 95% CI ‐8.5 to 28.9, P value 0.28) (Analysis 3.2).
Mean neurological assessment score at one year
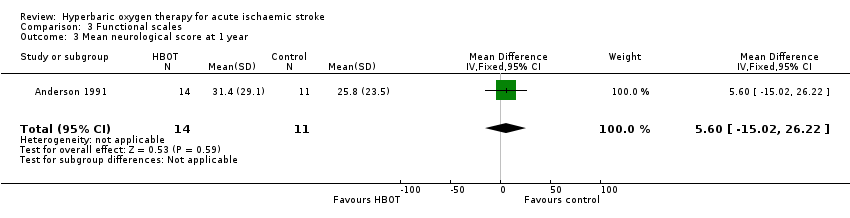
Only Anderson 1991 reported this outcome. The mean score was lower (better outcome) in the control group (25.8 versus 31.4: MD 5.6 points, 95% CI ‐15.0 to 26.2, P value 0.59) (Analysis 3.3).
Mean Orgogozo Scale score at six months
Only Nighoghossian 1995 reported this outcome. The mean score was higher (better outcome) in the HBOT group (72.9 versus 54.7: MD 18.2 points, 95% CI ‐5.2 to 41.6, P value 0.13) (Analysis 3.4).
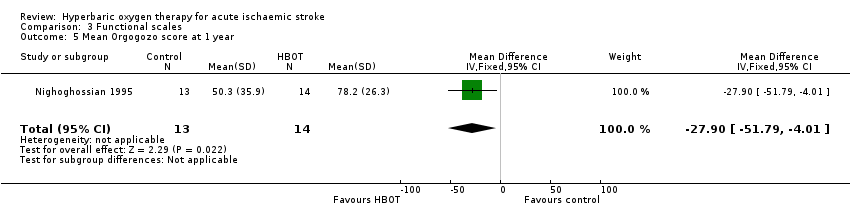
Mean Orgogozo Scale score at one year
Only Nighoghossian 1995 reported this outcome. The mean score was higher (better outcome) in the HBOT group (78.2 versus 50.3: MD 27.9 points, 95% CI 4.0 to 51.8, P value 0.02) (Analysis 3.5).
Mean Trouillas Disability Scale score at six months
Only Nighoghossian 1995 reported this outcome. The mean score was lower (better outcome) in the HBOT group (4.6 versus 6.1: MD 1.5 points, 95% CI ‐1.2 to 4.2, P value 0.27) (Analysis 3.6).
Mean Trouillas Disability Scale score at one year
Only Nighoghossian 1995 reported this outcome. The mean score was lower (better outcome) in the HBOT group (4.1 versus 6.3: MD 2.2 points, 95% CI 0.15 to 4.3, P value 0.04) (Analysis 3.7).
Mean Modified Rankin Functional Assessment Scale score at six months
Only Nighoghossian 1995 reported this outcome. The mean score was lower (better outcome) in the HBOT group (2.6 versus 3.2: MD 0.6 points, 95% CI ‐0.18 to 1.4, P value 0.13) (Analysis 3.8).
Mean Modified Rankin Functional Assessment Scale score at one year
Only Nighoghossian 1995 reported this outcome. The mean score was lower (better outcome) in the HBOT group (2.4 versus 3.0: MD 0.6 points, 95% CI ‐0.18 to 1.4, P value 0.13) (Analysis 3.9).
Mean Neurological Recovery Score at 12 months
Only Sansone 1997 reported this outcome. The mean score was better in the HBOT group (HBOT score 4.2 versus control 6.4, MD 2.2 points better with HBOT, 95% CI 1.6 to 2.8, P value < 0.0001) (Analysis 3.10).
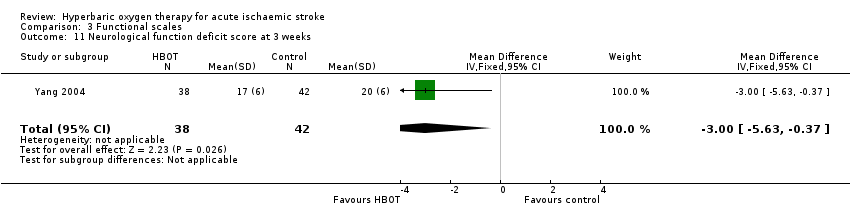
Mean Neurological Functional Deficit Score at three weeks
Only Yang 2004 reported this outcome and did not define this scale. The mean score after therapy was better with HBOT than with sham (HBOT 17 versus control 20, MD 3 points better with HBOT, 95% CI 0.4 to 5.6, P value 0.03) (Analysis 3.11).
Comparison 4. Deemed to have a good outcome
Two trials reported the numbers of participants achieving a predefined 'good outcome' (Imai 2006; Rusyniak 2003). Rusyniak 2003 used four different outcome scales, and Imai 2006 used the Modified Rankin Scale. Differences are reported below.
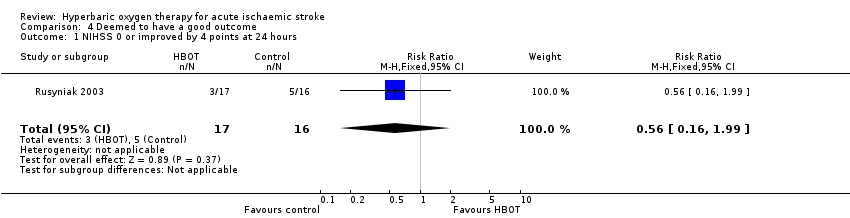
NIHSS zero or improved by four points at 24 hours
Three participants in the HBOT group achieved this outcome versus five in the control group (RR 0.56, 95% CI 0.2 to 2.0, P value 0.37, for a good outcome with HBOT) (Analysis 4.1).
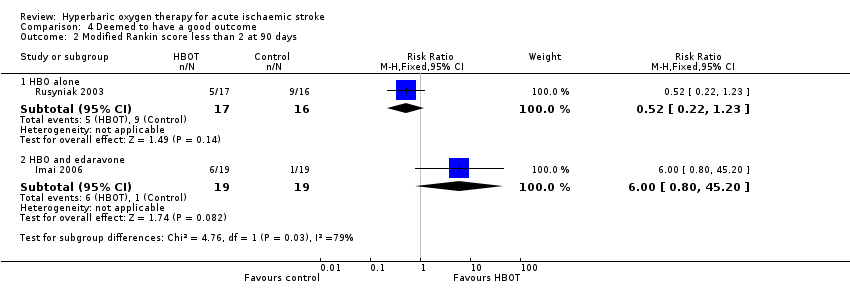
Rankin Scale score less than two at 90 days
In Rusyniak 2003, five participants in the HBOT group achieved this outcome versus nine in the control group (RR 0.52, 95% CI 0.2 to 1.2, P value 0.14 for a good outcome with HBOT), while in Imai 2006, six participants achieved a good outcome with HBOT versus only one who received control (RR 6.0, 95% CI 0.8 to 45.2, P value 0.08). Pooled analysis was subject to high heterogeneity (I2 = 82%) and has not been reported (Analysis 4.2).
Glasgow Outcome score of five at 90 days
Six participants in the HBOT group achieved this outcome versus 10 in the control group (RR 0.6, 95% CI 0.3 to 1.2, P value 0.13 for a good outcome with HBOT) (Analysis 4.3).
NIHSS score less than two at 90 days
Five participants in the HBOT group achieved this outcome versus eight in the control group (RR 0.59, 95% CI 0.2 to 1.4, P value 0.24 for a good outcome with HBOT) (Analysis 4.4).
Deemed cured and self‐caring at 21 days
Yang 2003 reported on the proportion of participants achieving 'cure' and able to provide self‐care. Nine participants in the HBOT were 'cured' versus four in the control group (RR 1.9, 95% CI 0.6 to 5.6, P value 0.25 for a good outcome with HBOT) (Analysis 4.5).
Comparison 5. Activities of daily living
Barthel Index of 95 or 100 at 90 days
Only Rusyniak 2003 reported the number of participants with this outcome. Eight participants in the HBOT group achieved this score versus nine in the control group (RR 1.2, 95% CI 0.6 to 2.3, P value 0.6 for a good outcome with HBOT) (Analysis 5.1).
Mean Barthel Index at three weeks
Only Yang 2004 reported this outcome. The mean Barthel Index was higher (better) in the HBOT group (74 versus 54). The MD of 20 points was statistically significant (95% CI 13.7 to 26.3, P value < 0.0001) (Analysis 5.2).
Comparison 6. Mean volume of infarct on CT
Mean infarct volume at four months
Only Anderson 1991 reported this outcome. The mean infarct volume was smaller in the control group (29.0 cm3 versus 49.2 cm3) but not significantly so (MD 20.2 cm3, 95% CI ‐13.4 to 53.8, P value 0.24) (Analysis 6.1).
Comparison 7. Adverse effects of therapy
Ear pain
Two trials reported on this outcome, enrolling a total of 71 participants (22% of the total) (Imai 2006; Rusyniak 2003). Four participants in the HBOT group suffered significant ear pain versus none in the control group (RR 4.9, 95% CI 0.6 to 39.7, P value 0.14) (Analysis 7.1).
Claustrophobia with related discomfiture was a significant problem in the monoplace vessels used in all trials for both arms. The severity of these problems varied across studies and was differentially reported. Anderson 1991 reported 15 participants (39%) who could not complete scheduled therapy, and Rusyniak 2003 did not report withdrawal of any participants from therapy. This is likely to reflect the single‐treatment design of Rusyniak 2003 on the one hand and the very intensive schedule planned for Anderson 1991 on the other.
Discussion
Summary of main results
Pooled data analysis for clinical outcomes of interest could be performed with respect to only one primary analysis: death at three to six months. We found no convincing evidence that HBOT improves outcomes when applied during the acute presentation of ischaemic stroke. Pooled data from four trials did not suggest significant benefit for the case fatality rate in the six months following presentation (RR 0.97) (Anderson 1991; Imai 2006; Nighoghossian 1995; Rusyniak 2003). Although no deaths were reported in the other trials, it is not clearly stated whether all participants enrolled reached final follow‐up. It is of interest that the only trial to administer the combination of a free‐radical scavenger and HBOT reported three deaths in the HBOT arm and one in the control group (Imai 2006). Use of antioxidants during HBOT remains a controversial practice.
Some indications showed improvement on some functional and clinical scales, but this finding was not consistent. Given the heterogeneity of participants enrolled and the poor descriptors used for some of these scales, we believe that pooling of results using a standardised mean difference was not justified. In all, of the 15 comparisons made, three studies reported a total of four comparisons with a statistically significant difference in favour of HBOT, although the clinical importance of these differences is not clear (Nighoghossian 1995 (two scores); Sansone 1997 (one score); Yang 2004 (one score)). When estimated at longer follow‐up times by Nighoghossian 1995, these improvements were present at one year but not at six months after therapy was completed.
Overall completeness and applicability of evidence
This review has included data from 11 trials. We believe these represent all randomised trials in this area, both published and unpublished, at the time of our database search. Only seven trials with 361 participants were available for evaluation using our planned comparisons, and meta‐analysis was not appropriate or possible for most outcomes. Four randomised trials enrolling a further 344 participants reported no outcomes of interest for our meta‐analysis.
Although we have made every effort to locate further unpublished data, it remains possible that this review is subject to a positive publication bias, with generally favourable trials more likely to provide reporting. With regard to long‐term outcomes following HBOT and any effect on the quality of life of these study participants, we have located no relevant data.
These trials were published over a 17‐year period, up to 2008. We had planned to perform subgroup analyses with respect to time elapsed between stroke and institution of HBOT, dose of oxygen received and duration of treatment course. None of these analyses were appropriate given the small number of pooled analyses and the relatively uniform lack of effect shown in individual studies. In one pooled analysis that was possible, statistical heterogeneity was moderate (I2 = 34.7%), and the two included trials were clinically heterogenous in that one trial included only participants with embolic stroke, while using combination therapy of HBOT and a free‐radical scavenger (edaravone) (Imai 2006).
A wide range of oxygen doses was reported across these studies: Rusyniak 2003 gave one session only, Anderson 1991 provided an intensive regimen of eight‐hourly exposures for three days, Imai 2006 held daily sessions for seven days, five trials reported daily therapy for 10 days (Li 1998; Nighoghossian 1995; Sansone 1997; Yang 2003; Zhao 2008) and Yang 2004 provided therapy for 20 days. Anderson 1991, Nighoghossian 1995 and Sansone 1997 applied modest hyperbaric pressure of 1.5 ATA versus the 2.5 ATA applied by Rusyniak 2003 in the single therapy session. Five trials used 2.0 ATA (Imai 2006; Li 1998; Yang 2003; Yang 2004; Zhao 2008). This review does not permit conclusions with regard to oxygen dosing schedule.
HBOT is regarded as a relatively benign intervention. Few possible major adverse effects have been described (pulmonary barotrauma, drug reactions, injury or death related to chamber fire), and none of the included studies reported any such events. Various more minor complications may occur commonly but were similarly not reported in the included studies. Visual disturbance, usually reduction in visual acuity secondary to conformational changes in the lens, is very commonly reported in perhaps as many as 50% of those given a course of 30 treatments (Khan 2003). Although a great majority of people experiencing visual disturbances recover spontaneously over days to weeks, a small proportion of people continue to require correction to restore sight to pretreatment levels. The second most common adverse effect associated with HBOT is barotrauma. Barotrauma can affect any air‐filled cavity in the body (including middle ear, lungs and respiratory sinuses) and occurs as a direct result of compression. Aural barotrauma is by far the most common as the middle ear air space is small and is largely surrounded by bone and the sensitive tympanic membrane. Active effort by the individual is usually required to inflate the middle ear through the Eustachian tube on each side. Barotrauma is a consequence not of HBOT directly but rather of the physical conditions required to administer it. Most episodes of barotrauma are mild, easily treated or recover spontaneously and do not require the therapy to be abandoned. Less commonly, HBOT may be associated with acute neurological toxicity manifesting as seizure.
Quality of the evidence
A major problem for this review was the multiple outcome scales used to assess functional ability and clinical severity across trials. No scale was used and reported by more than one of these trials, making pooling of data for analysis impossible. Further, analysis of these ordinal scales to produce mean scores for group comparisons may not be appropriate. This is particularly true of Rankin, Trouillas and other unnamed recovery scales (Sansone 1997; Yang 2003; Yang 2004), given their limited range of scores from zero to 10, but none of the reports provided plots of experimental data for any of these scales to justify the use of such parametric tests. The usefulness of such scales for estimating outcomes at all has been questioned (Van Gijn 1992). Many of them offer distinct advantages, including the tendency to equate multiple small deficits with a few major deficits and a poor ability to estimate stroke deficit at the extremes of severity (Orgogozo 1998). One review concluded that of nine stroke scales tested, the NIHSS was one of the three most reliable and the Barthel Index was the most reliable disability scale (D'Olhaberriague 1996).
The problem of multiple alternative outcome measures when potential stroke therapies are investigated is not confined to the area of HBOT. Considerable efforts are being made to develop a standard suite of outcomes to improve this situation, most notably the 'Core Outcome Measures in Effectiveness Trials (COMET) initiative.' More information is available at http://www.cometinitiative.org/.
Other problems associated with assessing data include failure to report on primary functional outcomes, variability in time intervals between stroke event and enrolment, and variable doses of HBOT. These problems demand cautious interpretation of the results.
Potential biases in the review process
We have made an exhaustive search of the literature, including handsearching of multiple proceedings and relevant journals in all languages. All apparently relevant study reports have been translated, and we believe we have not missed any significant studies in the area. This review has been conducted in accordance with the Cochrane methodology and is explicit. We have reported potential biases noted in contributing studies.
Agreements and disagreements with other studies or reviews
A number of reviews have examined the use of HBOT in neurological conditions, including acute stroke. Despite this, the question of the efficacy and effectiveness of HBOT for this purpose remains controversial. The conclusions reached by individual authors are largely dependent on the relative weight given to animal experimentation and non‐randomised clinical trials on the one hand versus randomised clinical trials on the other. Al‐Waili 2005 reviewed both clinical and preclinical evidence and concluded that "previous studies have demonstrated promising results—strong enough to warrant further clinical study of HBO therapy in patients with stroke," implying agreement with our analysis that the clinical case is not yet sufficiently strong to support routine use of HBOT.
Similarly, in a systematic review of the clinical data, Carson 2005 suggested that the best evidence shows no benefit of hyperbaric oxygen therapy in people with stroke. However, review authors agree that because of considerable clinical heterogeneity, particularly with respect to timing and dose of HBOT, firm conclusions are difficult to make.

Study flow diagram.

Methodological quality summary: review authors' judgements about each methodological quality item for each included study.
Methodological quality graph: review authors' judgements about each methodological quality item presented as percentages across all included studies.
Comparison 1 Mortality, Outcome 1 Death at 3 to 6 months.
Comparison 2 Severe functional disability, Outcome 1 No effect of therapy—participants unable to care for themselves.

Comparison 3 Functional scales, Outcome 1 Mean neurological score at day 5.

Comparison 3 Functional scales, Outcome 2 Mean neurological score at week 6.
Comparison 3 Functional scales, Outcome 3 Mean neurological score at 1 year.

Comparison 3 Functional scales, Outcome 4 Mean Orgogozo score at 6 months.
Comparison 3 Functional scales, Outcome 5 Mean Orgogozo score at 1 year.

Comparison 3 Functional scales, Outcome 6 Mean Trouillas score at 6 months.

Comparison 3 Functional scales, Outcome 7 Mean Trouillas score at 1 year.

Comparison 3 Functional scales, Outcome 8 Mean Rankin score at 6 months.

Comparison 3 Functional scales, Outcome 9 Mean Rankin score at 1 year.

Comparison 3 Functional scales, Outcome 10 Mean neurological recovery score at 12 months.
Comparison 3 Functional scales, Outcome 11 Neurological function deficit score at 3 weeks.
Comparison 4 Deemed to have a good outcome, Outcome 1 NIHSS 0 or improved by 4 points at 24 hours.
Comparison 4 Deemed to have a good outcome, Outcome 2 Modified Rankin score less than 2 at 90 days.
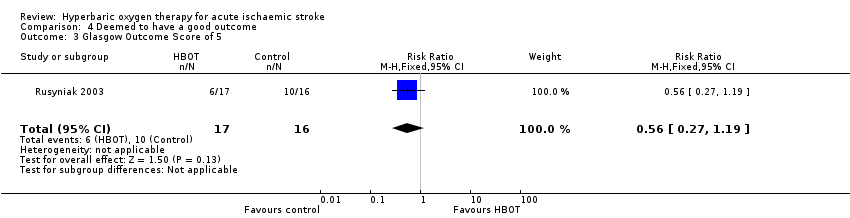
Comparison 4 Deemed to have a good outcome, Outcome 3 Glasgow Outcome Score of 5.

Comparison 4 Deemed to have a good outcome, Outcome 4 NIHSS less than 2.

Comparison 4 Deemed to have a good outcome, Outcome 5 Deemed cured and self‐caring.

Comparison 5 Activities of daily living, Outcome 1 Barthel Index 95 or 100 at 90 days.

Comparison 5 Activities of daily living, Outcome 2 Mean Barthel Index at 3 weeks.

Comparison 6 Mean volume of infarct on CT, Outcome 1 Mean volume of infarct at 4 months.

Comparison 7 Adverse effects of therapy, Outcome 1 Ear pain.
| Should hyperbaric oxygen therapy be used as an adjuvant therapy to routine therapy and rehabilitation for acute ischaemic stroke? | ||||||
| Patient or population: people with acute ischaemic stroke | ||||||
| Outcomes | Illustrative comparative risks* (95% CI) | Relative effect | Number of participants | Quality of the evidence | Comments | |
| Assumed risk | Corresponding risk | |||||
| Routine therapy and rehabilitation | Hyperbaric oxygen therapy used as adjuvant therapy | |||||
| Death | Low‐risk population | RR 0.97 | 144 | ⊕⊕⊕⊝ | ||
| 20 per 1000 | 19 per 1000 | |||||
| Medium‐risk population | ||||||
| 80 per 1000 | 78 per 1000 | |||||
| High‐risk population | ||||||
| 120 per 1000 | 116 per 1000 | |||||
| *The basis for the assumed risk (e.g. median control group risk across studies) is provided in footnotes. The corresponding risk (and its 95% confidence interval) is based on the assumed risk in the comparison group and the relative effect of the intervention (and its 95% CI). | ||||||
| GRADE Working Group grades of evidence. | ||||||
| a Small trials, with most not blinded to allocation. | ||||||
| Outcome or subgroup title | No. of studies | No. of participants | Statistical method | Effect size |
| 1 Death at 3 to 6 months Show forest plot | 4 | 144 | Risk Ratio (M‐H, Fixed, 95% CI) | 0.97 [0.34, 2.75] |
| 1.1 HBO alone | 3 | 106 | Risk Ratio (M‐H, Fixed, 95% CI) | 0.61 [0.17, 2.20] |
| 1.2 HBO and edaravone | 1 | 38 | Risk Ratio (M‐H, Fixed, 95% CI) | 3.0 [0.34, 26.33] |
| Outcome or subgroup title | No. of studies | No. of participants | Statistical method | Effect size |
| 1 No effect of therapy—participants unable to care for themselves Show forest plot | 1 | 70 | Risk Ratio (M‐H, Fixed, 95% CI) | 0.36 [0.10, 1.28] |
| Outcome or subgroup title | No. of studies | No. of participants | Statistical method | Effect size |
| 1 Mean neurological score at day 5 Show forest plot | 1 | 38 | Mean Difference (IV, Fixed, 95% CI) | 5.30 [‐7.47, 18.07] |
| 2 Mean neurological score at week 6 Show forest plot | 1 | 32 | Mean Difference (IV, Fixed, 95% CI) | 10.2 [‐8.48, 28.88] |
| 3 Mean neurological score at 1 year Show forest plot | 1 | 25 | Mean Difference (IV, Fixed, 95% CI) | 5.60 [‐15.02, 26.22] |
| 4 Mean Orgogozo score at 6 months Show forest plot | 1 | 27 | Mean Difference (IV, Fixed, 95% CI) | ‐18.20 [‐41.62, 5.22] |
| 5 Mean Orgogozo score at 1 year Show forest plot | 1 | 27 | Mean Difference (IV, Fixed, 95% CI) | ‐27.90 [‐51.79, ‐4.01] |
| 6 Mean Trouillas score at 6 months Show forest plot | 1 | 20 | Mean Difference (IV, Fixed, 95% CI) | ‐1.5 [‐4.16, 1.16] |
| 7 Mean Trouillas score at 1 year Show forest plot | 1 | 27 | Mean Difference (IV, Fixed, 95% CI) | ‐2.2 [‐4.25, ‐0.15] |
| 8 Mean Rankin score at 6 months Show forest plot | 1 | 27 | Mean Difference (IV, Fixed, 95% CI) | ‐0.60 [‐1.38, 0.18] |
| 9 Mean Rankin score at 1 year Show forest plot | 1 | 27 | Mean Difference (IV, Fixed, 95% CI) | ‐0.60 [‐1.38, 0.18] |
| 10 Mean neurological recovery score at 12 months Show forest plot | 1 | 17 | Mean Difference (IV, Fixed, 95% CI) | ‐2.2 [‐2.82, ‐1.58] |
| 11 Neurological function deficit score at 3 weeks Show forest plot | 1 | 80 | Mean Difference (IV, Fixed, 95% CI) | ‐3.0 [‐5.63, ‐0.37] |
| Outcome or subgroup title | No. of studies | No. of participants | Statistical method | Effect size |
| 1 NIHSS 0 or improved by 4 points at 24 hours Show forest plot | 1 | 33 | Risk Ratio (M‐H, Fixed, 95% CI) | 0.56 [0.16, 1.99] |
| 2 Modified Rankin score less than 2 at 90 days Show forest plot | 2 | Risk Ratio (M‐H, Fixed, 95% CI) | Subtotals only | |
| 2.1 HBO alone | 1 | 33 | Risk Ratio (M‐H, Fixed, 95% CI) | 0.52 [0.22, 1.23] |
| 2.2 HBO and edaravone | 1 | 38 | Risk Ratio (M‐H, Fixed, 95% CI) | 6.0 [0.80, 45.20] |
| 3 Glasgow Outcome Score of 5 Show forest plot | 1 | 33 | Risk Ratio (M‐H, Fixed, 95% CI) | 0.56 [0.27, 1.19] |
| 4 NIHSS less than 2 Show forest plot | 1 | 33 | Risk Ratio (M‐H, Fixed, 95% CI) | 0.59 [0.24, 1.42] |
| 5 Deemed cured and self‐caring Show forest plot | 1 | 70 | Risk Ratio (M‐H, Fixed, 95% CI) | 1.89 [0.64, 5.58] |
| Outcome or subgroup title | No. of studies | No. of participants | Statistical method | Effect size |
| 1 Barthel Index 95 or 100 at 90 days Show forest plot | 1 | 33 | Risk Ratio (M‐H, Fixed, 95% CI) | 1.20 [0.62, 2.32] |
| 2 Mean Barthel Index at 3 weeks Show forest plot | 1 | 80 | Mean Difference (IV, Fixed, 95% CI) | ‐20.0 [‐26.30, ‐13.70] |
| Outcome or subgroup title | No. of studies | No. of participants | Statistical method | Effect size |
| 1 Mean volume of infarct at 4 months Show forest plot | 1 | 27 | Mean Difference (IV, Fixed, 95% CI) | 20.20 [‐13.37, 53.77] |
| Outcome or subgroup title | No. of studies | No. of participants | Statistical method | Effect size |
| 1 Ear pain Show forest plot | 2 | 71 | Risk Ratio (M‐H, Fixed, 95% CI) | 4.89 [0.60, 39.66] |